Embed Size (px)
Citation preview

Job characteristics and employee well-being:a test of Warr's Vitamin Model in health careworkers using structural equation modelling
JAN DE JONGE1 AND WILMAR B. SCHAUFELI2
1Department of Work and Organizational Psychology, University of Nijmegen, P.O. Box 9104,6500 HE Nijmegen, The Netherlands2Department of Social and Organizational Psychology, Utrecht University, P.O. Box 80140,3508 TC Utrecht, The Netherlands
Summary Warr's (1987) Vitamin Model was investigated in a representative sample of 1437 Dutchhealth care workers (i.e. nurses and nurses' aides). According to this model, it washypothesized that three job characteristics (i.e. job demands, job autonomy, andworkplace social support) are curvilinearly related with three key indicators of employeewell-being (i.e. job satisfaction, job-related anxiety, and emotional exhaustion).Structural equation modelling (LISREL 8) was employed to test the comprehensiveVitamin Model. The results showed that the ®t of the non-linear model is superior tothat of the linear model. Except for the relationship between job autonomy andemotional exhaustion, the curvilinear relationships followed the predicted U-shapedor inverted U-shaped curvilinear pattern. Moreover, it appeared that the three jobcharacteristics are di�erentially related with various indicators of employee well-being.In conclusion, this study partially supports the assertion of the Vitamin Model thatnon-linear relationships exist between job characteristics and employee well-being.# 1998 John Wiley & Sons, Ltd.
J. Organiz. Behav. 19: 387±407 (1998)
Introduction
Many attempts have been made to develop theories, perspectives, and conceptual models thatrelate job characteristics with employee well-being (cf. Kahn and Byosiere, 1992). During thepast decades, two theoretical frameworks have been particularly successful in generating andguiding empirical research: the Job Characteristics Model (Hackman and Oldham, 1980) and theDemand±Control±Support Model (Johnson and Hall, 1988; Karasek and Theorell, 1990).Although both models di�er in scope and complexity, they assume linear relationships betweenjob characteristics and indices of employee well-being. For instance, as hypothesized by bothmodels, autonomy on the job is linearly associated with job satisfaction: the more autonomy aworker experiences the more satis®ed (s)he is with the job.
Warr's (1987) Vitamin Model (VM) challenges this popular belief of linear relationships.Instead, the VM stipulates non-linear relationships between job characteristics and mental healthoutcomes, including employee well-being. To date a comprehensive empirical test of the VM still
CCC 0894±3796/98/040387±21$17.50 Received 21 July 1995# 1998 John Wiley & Sons, Ltd. Accepted 20 September 1996
JOURNAL OF ORGANIZATIONAL BEHAVIOR, VOL. 19, 387±407 (1998)

stands out, indicating that little can be said about the validity of the model. Therefore, the currentarticle presents an overall test of Warr's model using structural equation modelling.
The Vitamin Model
Essentially, the VM holds that mental health is a�ected by environmental psychological featuressuch as job characteristics in a way that is analogous to the non-linear e�ects that vitamins aresupposed to have on our physical health. In addition to this central assumption of non-linearity,the VM builds on two other main features. First, job characteristics are grouped into nine cate-gories that relate di�erently with mental health outcomes according to the type of `vitamin' theyrepresent. Second, a complex three-axial model of a�ective well-being, a core aspect of mentalhealth, is postulated. Below the three key features of the VM are explained in greater detail.
Vitamins exert a particular in¯uence on the human body. That is, vitamin de®ciency producesbodily impairment and, consequently, may lead to physical illness (`de®ciency disease'). Gener-ally, vitamin intake initially improves health and physical functioning, but beyond a particularlevel of intake no further improvement is observed. Continued intake of vitamins may lead to twodi�erent kinds of e�ects, as shown in Figure 1.
First, a so-called constant e�ect might occur: health neither improves, nor noxious conse-quences are observed that impair the individual's physical health. According to Warr (1987,1994), vitamins C and E have a suchlike e�ect on the human body. Therefore, the label CE(`Constant E�ect') is used to denote this particular relationship. Second, an overdose of vitaminsleads to a toxic concentration in the body (`hypervitaminosis'), which causes poor bodilyfunctioning and ill-health. Among others, vitamins A and D are known to be toxic, when takenin large quantities. For that reason Warr has used the label AD (`Additional Decrement') todenote the inverted U-shaped curvilinear relationship as depicted in Figure 1. Warr (1987) arguesthat the e�ects of job characteristics upon mental health parallel the ways in which vitamins actupon the human body. Following this line of reasoning we could refer to Warr's vitamins as
Figure 1. The relationship between job characteristics and a�ective well-being within the Vitamin Model(Reprinted from Work, Unemployment, and Mental Health by Peter B. Warr, 1987, p. 234, by permission of
Oxford University Press)
# 1998 John Wiley & Sons, Ltd. J. Organiz. Behav. 19: 387±407 (1998)
388 J. DE JONGE AND W. B. SCHAUFELI
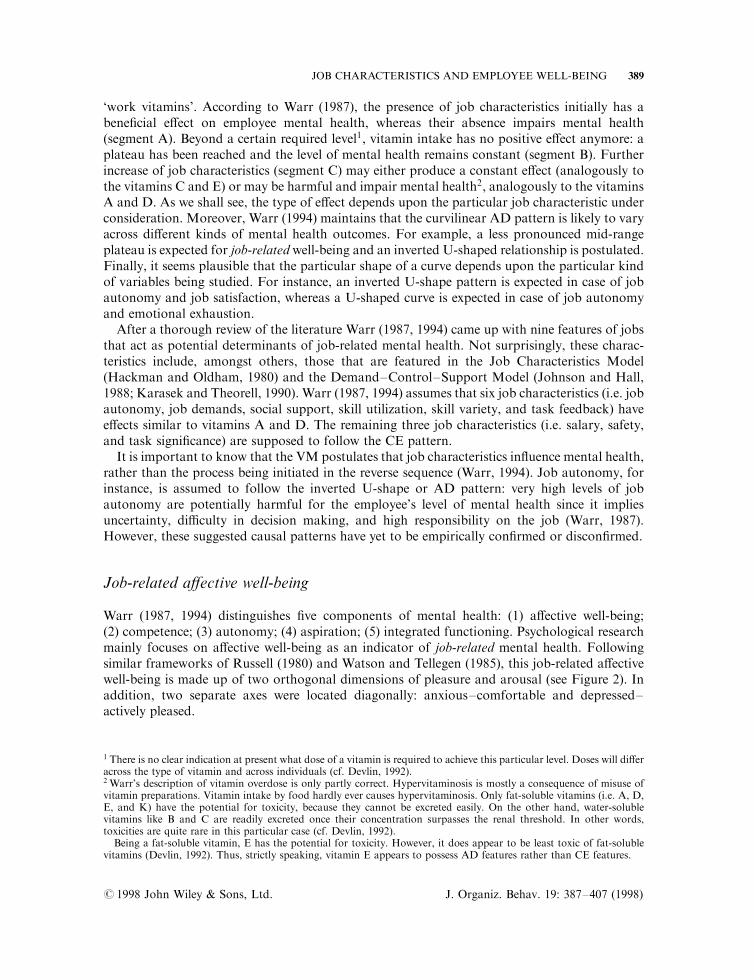
`work vitamins'. According to Warr (1987), the presence of job characteristics initially has abene®cial e�ect on employee mental health, whereas their absence impairs mental health(segment A). Beyond a certain required level1, vitamin intake has no positive e�ect anymore: aplateau has been reached and the level of mental health remains constant (segment B). Furtherincrease of job characteristics (segment C) may either produce a constant e�ect (analogously tothe vitamins C and E) or may be harmful and impair mental health2, analogously to the vitaminsA and D. As we shall see, the type of e�ect depends upon the particular job characteristic underconsideration. Moreover, Warr (1994) maintains that the curvilinear AD pattern is likely to varyacross di�erent kinds of mental health outcomes. For example, a less pronounced mid-rangeplateau is expected for job-related well-being and an inverted U-shaped relationship is postulated.Finally, it seems plausible that the particular shape of a curve depends upon the particular kindof variables being studied. For instance, an inverted U-shape pattern is expected in case of jobautonomy and job satisfaction, whereas a U-shaped curve is expected in case of job autonomyand emotional exhaustion.
After a thorough review of the literature Warr (1987, 1994) came up with nine features of jobsthat act as potential determinants of job-related mental health. Not surprisingly, these charac-teristics include, amongst others, those that are featured in the Job Characteristics Model(Hackman and Oldham, 1980) and the Demand±Control±Support Model (Johnson and Hall,1988; Karasek and Theorell, 1990). Warr (1987, 1994) assumes that six job characteristics (i.e. jobautonomy, job demands, social support, skill utilization, skill variety, and task feedback) havee�ects similar to vitamins A and D. The remaining three job characteristics (i.e. salary, safety,and task signi®cance) are supposed to follow the CE pattern.
It is important to know that the VM postulates that job characteristics in¯uence mental health,rather than the process being initiated in the reverse sequence (Warr, 1994). Job autonomy, forinstance, is assumed to follow the inverted U-shape or AD pattern: very high levels of jobautonomy are potentially harmful for the employee's level of mental health since it impliesuncertainty, di�culty in decision making, and high responsibility on the job (Warr, 1987).However, these suggested causal patterns have yet to be empirically con®rmed or discon®rmed.
Job-related a�ective well-being
Warr (1987, 1994) distinguishes ®ve components of mental health: (1) a�ective well-being;(2) competence; (3) autonomy; (4) aspiration; (5) integrated functioning. Psychological researchmainly focuses on a�ective well-being as an indicator of job-related mental health. Followingsimilar frameworks of Russell (1980) and Watson and Tellegen (1985), this job-related a�ectivewell-being is made up of two orthogonal dimensions of pleasure and arousal (see Figure 2). Inaddition, two separate axes were located diagonally: anxious±comfortable and depressed±actively pleased.
1 There is no clear indication at present what dose of a vitamin is required to achieve this particular level. Doses will di�eracross the type of vitamin and across individuals (cf. Devlin, 1992).2 Warr's description of vitamin overdose is only partly correct. Hypervitaminosis is mostly a consequence of misuse ofvitamin preparations. Vitamin intake by food hardly ever causes hypervitaminosis. Only fat-soluble vitamins (i.e. A, D,E, and K) have the potential for toxicity, because they cannot be excreted easily. On the other hand, water-solublevitamins like B and C are readily excreted once their concentration surpasses the renal threshold. In other words,toxicities are quite rare in this particular case (cf. Devlin, 1992).Being a fat-soluble vitamin, E has the potential for toxicity. However, it does appear to be least toxic of fat-soluble
vitamins (Devlin, 1992). Thus, strictly speaking, vitamin E appears to possess AD features rather than CE features.
# 1998 John Wiley & Sons, Ltd. J. Organiz. Behav. 19: 387±407 (1998)
JOB CHARACTERISTICS AND EMPLOYEE WELL-BEING 389

In order to measure a�ective well-being empirically three axes are used: (1) discontented±contented; (2) anxious±comfortable; (3) depressed±actively pleased. The vertical arousaldimension is not considered to be an empirical indicator of well-being and is therefore notlabelled. Negative aspects of a�ective well-being are shown at the left-hand side of Figure 2,whereas positive aspects are depicted at the right-hand side. The elongated shape of Figure 2suggests that the pleasure dimension is more important than the arousal dimension inconstituting a�ective well-being.
Warr (1990a) has developed measurement scales of all aspects of mental health, includingjob-related a�ective well-being (see also Sevastos, Smith and Cordery, 1992). The scales for job-related a�ective well-being cover the full range of the two principal axes (numbers 2 and 3 inFigure 2), and seem to be psychometrically quite acceptable. Consistent with the position of theaxes in Figure 2, the scores on the dimensions of a�ective well-being are expected to be positivelycorrelated; that is, the angles between the axes are less than 90 degrees. In occupational settings,the ®rst axis (i.e. discontented±contented) has mostly been operationalized through measures ofjob satisfaction, but measures of job attachment and organizational commitment have been usedas well (Warr, 1987). The second axis (i.e. anxious±comfortable) is usually tapped throughmeasures of job-related anxiety, job-related tension, and job-related strain. Finally, the third axis(i.e. depressed±actively pleased) is assessed by such measures as occupational burnout, job-related depression, job boredom, and fatigue.
Empirical support for the Vitamin Model
In presenting a sound summary of empirical evidence with respect to several aspects of the VM,Warr (1987, 1994) showed that his nine job characteristics do act in isolation as predicted by themodel. But as far as we know, a comprehensive empirical test of parts of the VM is lacking(see also Warr, 1994).
In recent years, a few cross-sectional studies have investigated the proposed patterns of the VM(e.g. Fletcher and Jones, 1993; De Jonge, Schaufeli and Furda, 1995; Parkes, 1991; Warr, 1990b;Xie and Johns, 1995). Most notably Warr's own study among nearly 1900 employees con®rmedthe postulated curvilinear relationships (Warr, 1990b). Signi®cant curvilinear relationships werefound between job demands on the one hand, and job satisfaction, job-related anxiety, and job-related depression on the other. Regarding job autonomy, a curvilinear association was shownwith job satisfaction. The latter relationship was the only one found to be signi®cant in the studyof Fletcher and Jones (1993) in a large heterogeneous sample of about 1300 men. Parkes (1991),
Figure 2. Three principal axes of a�ective well-being (Reprinted from Work, Unemployment, and MentalHealth by Peter B. Warr, 1987, p. 41, by permission of Oxford University Press)
# 1998 John Wiley & Sons, Ltd. J. Organiz. Behav. 19: 387±407 (1998)
390 J. DE JONGE AND W. B. SCHAUFELI

however, did not ®nd any curvilinear relationship in her sample of almost 600 civil servants.Contrarily, De Jonge et al. (1995) found four out of 12 curvilinear relationships in their studyamong about 250 health care professionals. Firstly, they demonstrated a similar curvilinearrelationship between job demands and job satisfaction as reported by Warr (1990b). Secondly, acurvilinear association was found between job autonomy and emotional exhaustion, an occupa-tional burnout component. Finally, two curvilinear relationships were found between socialsupport and particular aspects of job-related burnout (i.e. emotional exhaustion and reducedpersonal accomplishment). However, these curvilinear patterns did not match expectations:instead of a U-shaped (`AD') curve, an inverted U-shape was found. Xie and Johns (1995)examined curvilinear relationships between job scope and several strains in their study amongmore than 400 full-time employees. They found a U-shaped curvilinear relationship between self-reported job scope and burnout (i.e. emotional exhaustion).
Taken together, the results of the few studies that haveÐpartiallyÐtested the VM are mixedand inconclusive. Job demands and job autonomy seem to be related curvilinearly to someaspects of employee mental health in a way as predicted by the model, whereas the e�ect ofworkplace social support does not follow the model. Most importantly, however, all studies havefailed to take account of the possible multifaceted ways in which job characteristics may a�ectjob-related well-being (cf. Fletcher, 1991; Warr, 1987, 1994).
Aim of the present study
The purpose of this article is to test Warr's comprehensive Vitamin Model empirically. In otherwords: do job characteristics act like psychological `vitamins', in ways as predicted by the model,as shown in Figure 1? Because of their theoretical and practical relevance three job characteristicsare included in this study: (1) job demands, (2) job autonomy, and (3) workplace social support.There is considerable empirical evidence for the importance of these three job characteristics inrelation to employee well-being (for more extensive reviews see: Ganster and Schaubroeck, 1991;Karasek and Theorell, 1990; Schnall, Landsbergis and Baker, 1994; Warr, 1987).
In addition, one aspect of the VM deserves particular attention; the multidimensional view ofa�ective well-being which is a crucial aspect of mental health. In the present study the three axesthat constitute a�ective well-being (see Figure 2) are represented by (1) job satisfaction, (2) job-related anxiety, and (3) occupational burnout, respectively.
According toWarr (1994), in order to test the VM adequately, a large sample of employees anda wide range of values of job characteristics are required. Non-linearity is expected to be morepronounced in studies among jobs that produce extreme scores on job characteristics. Therefore,we tested the VM in a relatively heterogeneous and large sample of health care workers; that is,nursing and nursing-like professionals. Several authors have pointed out that these professionalsare quite suitable for testing this kind of conceptual models (e.g. Fox, Dwyer and Ganster, 1993;Ganster and Fusilier, 1989; De Jonge, Janssen and Van Breukelen, 1996). For example, becauseof di�erent types of health care areas and di�erent specialties, nurses and nursing-like workersare a relatively heterogeneous group. In addition to this, nurses and nurses' aides have stressfuljobs that are characterized by high workload and low job autonomy. Consequently, burnout is aserious problem in today's nursing profession (e.g. Cordes and Dougherty, 1993; Schaufeli andJanczur, 1994).
Finally, Warr (1994) stated that multivariate and simultaneous tests of the VM are badlyneeded. We will therefore employ a comprehensive structural equation model that allows for asimultaneous test of various aspects of the model.
# 1998 John Wiley & Sons, Ltd. J. Organiz. Behav. 19: 387±407 (1998)
JOB CHARACTERISTICS AND EMPLOYEE WELL-BEING 391

Hypotheses
In line with the Vitamin Model, we hypothesize that job characteristics (i.e. job demands, jobautonomy, and workplace social support) are curvilinearly associated with three dimensions ofa�ective well-being (i.e. job satisfaction, job-related anxiety, and occupational burnout). Asmentioned before, both inverted U-shaped and U-shaped (`AD') patterns are expected dependingupon the variables being studied.
Since gender and age may confound the results, both variables are included in the model aswell. For instance, women tend to report greater job satisfaction than men, and they also tend toreport more psychosomatic symptoms (e.g. Rosen®eld, 1989; Sevastos et al., 1992; Warr, 1987,1990b). Similarly, Kasl (1989) noted that age may play an important role: older people reportmore health problems than younger people do. In addition, Karasek and his team (e.g. Karasekand Theorell, 1990; Schwartz, Pieper and Karasek, 1988) argued that age is negatively related tojob strain. Moreover, they showed that job characteristics were systematically related to demo-graphic variables like gender and age. For example, it should not be surprising that (1) olderwomen tend to have less demanding jobs, (2) an older and probably more experienced nurse willhave greater job autonomy, and (3) men's average levels of job autonomy are markedly higherthan women's levels.
Method
Procedure and subjects
A random sample of 16 institutions was drawn from all general hospitals including a psychi-atric unit and all combined nursing homes3 (N � 218) in the Netherlands. These institutions(i.e. eight hospitals and eight nursing homes) participated voluntarily in the present study. Inorder to achieve a relatively heterogeneous group of health care providers, di�erent kinds of unitswere asked to participate in the study: intensive care units (ICUs), psychiatric units, internalunits, and surgical units in hospitals, and somatic units and psycho-geriatric units in nursinghomes.
In total, the initial sample consisted of 1806 health care workers from 64 units, includingregistered nurses, student nurses, nurses' aides, activity therapists, secretaries, and kitchen sta�.Self-report questionnaires were ®lled in and returned by 1489 respondents (82 per cent responserate). Thirteen employees from non-caring professions (e.g. activity therapists and secretaries)were excluded from the ®nal sample, since the content of their jobs di�ers greatly from that ofhealth care providers. In addition, only workers who had been employed for more than 3 monthswere included in the ®nal sample, in order to ensure valid and reliable observations of thework situation (cf. Katz, 1978a,b). Both restrictions reduced the ®nal sample to 1437 `real' and`experienced' health care providers.
Eighty-three per cent of the respondents were women; ages ranged from 17 to 59 years(mean � 30:7; S:D: � 8:4). The mean work experience was 10.2 years (S:D: � 7:2), and 46 percent of the respondents worked full-time.
3 Combined nursing homes are nursing homes with somatic units as well as psycho-geriatric units.
# 1998 John Wiley & Sons, Ltd. J. Organiz. Behav. 19: 387±407 (1998)
392 J. DE JONGE AND W. B. SCHAUFELI

Measures
Demographic variablesDemographic variables (i.e. gender and age) are included as control variables that can be expectedto confound relationships between job characteristics and outcome variables (e.g. Karasek andTheorell, 1990; Kasl, 1989; Schaufeli and Van Dierendonck, 1994).
Job demandsJob demands are measured by an 8-item questionnaire (5-point response scale ranging from 1`never' to 5 `always') that includes a wide range of qualitative and quantitative demanding aspectsof the job, such as working under time pressure, working hard, strenuous work, and job com-plexity. The job demands scale has been well-validated in Dutch samples of health care workers(e.g. Boone and De Jonge, 1996; De Jonge, Landeweerd and Nijhuis, 1993; Vermaat, 1994).
Job autonomyJob autonomy is assessed by the Maastricht Autonomy Questionnaire (MAQ; De Jonge, 1995;De Jonge, Landeweerd and Van Breukelen, 1994), which consists of 10 Likert items with a5-point response scale ranging from 1 `very little' to 5 `very much'. The MAQ measures theworker's opportunity of freedom, inherent in the job, to determine a variety of task elements,such as method of working, amount of work, and work goals. The results of a study among249 Dutch health care workers con®rmed the validity as well as the reliability of the MAQ(cf. De Jonge et al., 1994; Vermaat, 1994). More speci®cally, the postulated one-factor structurehad been con®rmed, the coe�cient alpha was 0.86, and the test±retest reliability was 0.66(8-month time interval).
Workplace social supportWorkplace social support is measured by a 10-item scale of total work-related social support(from the senior nursing o�cer as well as from colleagues). The scale was derived from a Dutchquestionnaire on organizational stress (`Vragenlijst Organisatie Stress-Doetinchem'ÐVOS-D;Bergers, Marcelissen and De Wol�, 1986). A 4-point response scale was used, ranging from 1`never' to 4 `always'.
Job satisfactionJob satisfaction is assessed by a single item (i.e. `I am satis®ed with my present job') that wasscored on a 5-point rating scale, ranging from 1 `strongly disagree' to 5 `fully agree'. It has beenshown that a global rating of overall job satisfaction is an inclusive measure of general jobsatisfaction (e.g. Scarpello and Campbell, 1983; Weaver, 1980). De Jonge (1995) showed a test±retest reliability for this item of 0.55 (1-year time interval).
Job-related anxietyJob-related anxiety is measured by means of a scale of the Dutch Organizational StressQuestionnaire (`Vragenlijst Organisatie Stress'ÐVOS; Reiche and Van Dijkhuizen, 1979), askingrespondents how they generally felt at work. The subscale consists of four items with a response
# 1998 John Wiley & Sons, Ltd. J. Organiz. Behav. 19: 387±407 (1998)
JOB CHARACTERISTICS AND EMPLOYEE WELL-BEING 393

scale ranging from 1 `never' to 4 `always'. The items re¯ect feelings of anxiety, nervousness,tenseness, and restlessness, respectively.
Emotional exhaustionEmotional exhaustion is measured by a subscale of the Dutch version of the Maslach BurnoutInventory: the MBI-NL (Schaufeli and Van Dierendonck, 1993, 1994). Emotional exhaustion isthe burnout dimension that is closest to more traditional job strain variables (cf. Maslach, 1993;Shirom, 1989). In its original form, the scale consists of nine items, scored on a 7-point scale(ranging from 0 `never' to 6 `always'). Because of insu�cient factorial validity in earlier studies,the original item 16 (`Working with people directly puts too much stress on me') is eliminated inthe Dutch version of the MBI (cf. Byrne, 1991; Schaufeli and Van Dierendonck, 1993).
Data analysis
Covariance structure modelling (CSM) with full-information maximum likelihood (FIML)estimation was used to assess the ®t of the proposed Vitamin Model. CSM is a multivariatetechnique which combines methodological and statistical contributions from the psychometrictheory as well as the econometric theory (Diamantopoulos, 1994; Scott Long, 1983). Basically,covariance structure models consist of an integration of two models: (1) the measurement orfactor-analytic model, which reduces observed variables to a smaller number of latent factors; and(2) the structural equation model, which de®nes (causal) relationships among these latent factors(cf. JoÈ reskog and SoÈ rbom, 1989; Scott Long, 1983). The present article simpli®es the covariancestructure model by assuming that the latent and observed variables are identical (i.e. each con-struct had only one operationalization). In other words, there are no speci®ed measurementmodels in the analyses. The corresponding analyses were performed using the LISREL 8computer program (JoÈ reskog and SoÈ rbom, 1993).
Bollen and Scott Long (1993) as well as JoÈ reskog (1993) recommend a mixture of ®t-indices inorder to assess the overall ®t of the model: the chi-square statistic (w2) and the LISREL adjustedgoodness-of-®t index (AGFI; JoÈ reskog, 1993); the root mean square error of approximation(RMSEA; Browne and Cudeck, 1993; Steiger, 1990); the non-normed ®t index (NNFI; Bentlerand Bonett, 1980), and the cross-validation index (CVI; Browne and Cudeck, 1993; Cudeck andBrowne, 1983). For a detailed description of these ®t indices, see JoÈ reskog (1993) or Browne andCudeck (1993).
Values of AGFI greater than 0.90, and RMSEA of about 0.08 or less indicate a reasonable ®t ofthe model, whereas values equal to or greater than 0.95 (AGFI) or less than 0.05 (RMSEA)indicate a close ®t (Browne and Cudeck, 1993; Verschuren, 1991). The major disadvantage of thechi-square statistic and the AGFI is that their value depends on sample size (Marsh, Balla andMcDonald, 1988). Therefore, we computed also the NNFI which is hardly a�ected by samplesize. The NNFI indicates the incremental ®t of a particular model as compared to an independentmodel, a so-called null model (M0) that assumes zero relationships between the variables. Bentler(1990) argued that the value of the NNFI should be greater than 0.90.Models with a poorer ®t canusually be improved by relaxing parameters which were ®xed to a speci®c value a priori (e.g. zero).
First of all, gender (dummy variable) and age were introduced into the structural model aspotential confounders; therefore, they have to be labelled as exogenous variables (cf. Bollen, 1989,p. 126), and all other variables have to be labelled as endogenous variables (i.e. job characteristicsand a�ective well-being). In addition, the VM suggests non-linear relationships between jobcharacteristics and a�ective well-being. Such relationships are appropriately modelled by
# 1998 John Wiley & Sons, Ltd. J. Organiz. Behav. 19: 387±407 (1998)
394 J. DE JONGE AND W. B. SCHAUFELI

including a linear as well as a squared term of a particular exogenous variable (Bollen, 1989;Kenny and Judd, 1984). This was done by performing two analytic steps (cf. Aiken and West,1991; Jaccard, Turrisi and Wan, 1990): (1) the three exogenous variables (i.e. job demands, jobautonomy, and social support) were mean-centred in order to prevent multicollinearity; (2) thesquared terms of the exogenous variables were computed from these centred variables.
Next, three structural models were ®tted to the data in two steps. First, a model M1 withoutnon-linear e�ects was speci®ed, followed by a model M2 with non-linear e�ects. Accordingly,Warr's VM, as described in our hypotheses, is tested against the null hypothesis (H0) that thereare no non-linear relationships. Di�erent nested models can be compared by a likelihood ratiotest (cf. Bentler and Bonett, 1980; JoÈ reskog and SoÈ rbom, 1993). The di�erence between competi-tive models has a chi-square distribution with the number of degrees of freedom equal to thedi�erence between the degrees of freedom of the separate models. Critical values of the chi-squaredistribution are taken as evidence whether or not H0 has to be rejected. Second, the speci®edmodels M1 and M2 are compared with the null model (M0). Eventually, the best ®tting model isrespeci®ed in order to improve its ®t.
Finally, in order to examine the robustness of the ®nal model, a cross-validation procedure wasfollowed that has been suggested by Browne and Cudeck (1993). According to this procedure, oursample is randomly split into a calibration sample (n1 � 719) and a validation sample (n2 � 718).In order to ensure that hospital workers and nursing home workers are equally represented inboth subsamples, the parent-sample was strati®ed accordingly. Within each stratum (i.e. type ofinstitution), all respondents were randomly assigned to the calibration sample or to the validationsample. No signi®cant di�erences between the two split-samples were found with respect todemographic characteristics. More speci®cally, a double cross-validation in combination with aso-called `®xed-weights strategy' was employed (cf. Cudeck and Browne, 1983; Diamantopoulos,1994; MacCallum, Roznowski, Mar and Reith, 1994). That is, both split-sample covariancematrices are used to ®t the proposed model and are mutually cross-validated. The ®xed-weightsstrategy implies that only those parameters which represent the model-structure will be con-strained (i.e. all linear and non-linear weights). All variances and covariances (including error andresidual terms) are allowed to be re-estimated. The rationale for this approach is that in CSMtheoretical weights are assumed to be identical for every individual in the population. In otherwords, those weights would characterize the individuals in the population, as well as those in anygiven sample, and, therefore, would not be a�ected by sampling (cf. MacCallum and Tucker,1991). On the other hand, (co)variances re¯ect (co)variation within a given group and, hence, area�ected by sampling.
A ®t function F is calculated using one of the subsamples when the model estimates were readin as ®xed values. This ®tting function, also called the two-sample cross-validation index (CVI),is a measure of the discrepancy between the ®tted model estimates in the analysed sample and thecovariance matrix of the other sample (Browne and Cudeck, 1993).
Results
Preliminary analysis
Prior to the LISREL analyses, the means (M), standard deviations (S.D.), internal consistencies(Cronbach's alpha), and zero-order Pearson correlations of the variables were calculated (seeTables 1 and 2). Missing observations were handled by listwise deletion. The Cronbach's alphas
# 1998 John Wiley & Sons, Ltd. J. Organiz. Behav. 19: 387±407 (1998)
JOB CHARACTERISTICS AND EMPLOYEE WELL-BEING 395

indicate acceptable reliabilities in both subsamples. Covariance matrices were performed in orderto analyse the structural models.
Model-®t
The hypothetical structural model is shown in Figure 3. The parameters to be estimated are:(1) regression coe�cients linking gender and age with job characteristics as well as mental health
Table 1. Means, standard deviations (S.D.) and internal consistencies (Cronbach's a) of the study variables
Measures Calibration sample (n � 665) Validation sample (n � 667)
Mean S.D. a Mean S.D. a
Job demands 0.00 0.60 0.87 0.00 0.58 0.86Job autonomy 0.00 0.55 0.81 0.00 0.58 0.82Social support 0.00 0.35 0.79 0.00 0.34 0.79Job demands2 0.35 0.55 Ð 0.34 0.54 ÐJob autonomy2 0.30 0.45 Ð 0.33 0.46 ÐSocial support2 0.12 0.18 Ð 0.11 0.15 ÐJob satisfaction 3.94 0.90 Ð 3.95 0.82 ÐJob-rel. anxiety 1.50 0.45 0.79 1.48 0.42 0.76Emot. exhaustion 1.74 0.88 0.85 1.75 0.85 0.84
Figure 3. The hypothetical structural equation model
# 1998 John Wiley & Sons, Ltd. J. Organiz. Behav. 19: 387±407 (1998)
396 J. DE JONGE AND W. B. SCHAUFELI

Table 2. Intercorrelations among the study variables (below diagonal: calibration sample, n � 665; above diagonal: validation sample, n � 667)
Measures 1 2 3 4 5 6 7 8 9 10 11
1 Gender� Ð ÿ0.11{ 0.08{ ÿ0.17{ 0.10{ 0.05 ÿ0.04 ÿ0.04 0.05 ÿ0.04 ÿ0.012 Age ÿ0.14{ Ð 0.12{ 0.09{ ÿ0.09{ 0.02 0.14{ 0.05 ÿ0.06 ÿ0.02 ÿ0.023 Job demands 0.03 0.03 Ð ÿ0.23{ ÿ0.20{ 0.08{ 0.03 0.08{ ÿ0.18{ 0.18{ 0.44{4 Job autonomy ÿ0.16{ 0.04 ÿ0.29{ Ð 0.14{ ÿ0.10{ 0.04 ÿ0.02 0.15{ ÿ0.05 ÿ0.10{5 Social support 0.12{ ÿ0.07 ÿ0.15{ 0.16{ Ð ÿ0.01 0.04 ÿ0.14{ 0.35{ ÿ0.20{ ÿ0.30{6 Job demands2 0.06 0.05 0.04 ÿ0.04 0.04 Ð 0.12{ 0.18{ ÿ0.05 0.14{ 0.057 Job autonomy2 ÿ0.05 0.19{ 0.06 0.10{ ÿ0.04 0.09{ Ð 0.09{ 0.01 ÿ0.08{ ÿ0.068 Social support2 0.05 ÿ0.00 0.09{ ÿ0.06 ÿ0.22{ 0.07 0.03 Ð ÿ0.13{ 0.01 0.059 Job satisfaction 0.13{ ÿ0.10{ ÿ0.21{ 0.11{ 0.35{ ÿ0.06 0.01 ÿ0.22{ Ð ÿ0.17{ ÿ0.33{
10 Job-rel. anxiety 0.00 0.01 0.20{ ÿ0.09{ ÿ0.22{ 0.05 0.07 0.16{ ÿ0.22{ Ð 0.46{11 Emot. exhaustion ÿ0.01 ÿ0.02 0.48{ ÿ0.14{ ÿ0.31{ 0.02 ÿ0.01 0.20{ ÿ0.42{ 0.45{ Ð
�Gender was coded 0 (males) and 1 (females).{ p4 0:05 (two-tailed).
#1998JohnWiley
&Sons,Ltd.
J.Organiz.
Behav.19:387±407(1998)
JOBCHARACTERISTIC
SAND
EMPLOYEEWELL-BEIN
G397

outcomes (G matrix); (2) regression coe�cients linking the job characteristics with the outcomes(B matrix); (3) covariances between the exogenous variables (F matrix); (4) residual covariancesbetween the job characteristics (C matrix). In addition, errors in equations predicting the fouroutcome variables (C matrix) are allowed to correlate. Error caused by misspeci®cation of themodel would be re¯ected by these correlations. Such misspeci®cations might be caused by theexistence of an additional variable that is not included in the model, but nevertheless is necessaryto more fully explain the outcome variables (cf. MacCallum, Wegener, Uchino and Fabrigar,1993; Scott Long, 1983).
Table 3 summarizes the results of the nested models that include non-linear e�ects. Thestructural models were identi®ed successfully; therefore, we are able to estimate the modelparameters (cf. Diamantopoulos, 1994). Consider ®rst the models without (M1) and with non-linear e�ects (M2) of the calibration sample. The hypothesis test shows that the di�erencebetween the two chi-squares is signi®cant (Dw2 � 35:53; Ddf � 9; p4 0:001), indicating thatH0 is rejected. Thus, in the calibration sample the non-linear model has a better statistical ®t thanthe linear model. Consider next the linear (M1) and non-linear model (M2) of the validationsample. Again, the likelihood ratio test exceeds the critical value (Dw2 � 24:98, Ddf � 9,p4 0:01), indicating that H0 is rejected. Thus, the non-linear model ®ts signi®cantly better thanthe linear model in the validation sample as well.
However, values of NNFI are still below 0.90, which means that the ®t of the models can befurther improved. The Modi®cation Indices (MIs) of all four models revealed that one of thelargest MIs refers to the ®xed parameters connection age to the cross-product of job autonomy.Since age is signi®cantly related to the cross-product of job autonomy (see Table 2), the corres-ponding parameter has been relaxed in all models, resulting in four respeci®ed models (Table 3).It appears that the modi®ed non-linear models (M2-respeci®ed) yield a non-signi®cant chi-square
Table 3. Goodness-of-®t indices of structural models and squared multiple correlations of a�ectivewell-being
Model Chi-2 (df ) AGFI RMSEA NNFI CVI R2
sat exh anx
Calibration sample (n � 665)Null model (M0) 835.19� (55) 0.74 0.15 Ð 1.11 Ð Ð ÐLinear model (M1) 64.64� (15) 0.93 0.07 0.77 0.21 0.16 0.29 0.08M1-respeci®ed 41.94� (14) 0.95 0.06 0.86 0.19 0.16 0.29 0.08Non-lin. model (M2) 29.11� (6) 0.91 0.08 0.73 0.23 0.19 0.31 0.09M2-respeci®ed 6.41 (5) 0.98 0.02 0.98 0.22 0.19 0.31 0.09
Validation sample (n � 667)
Null model (M0) 736.13� (55) 0.77 0.14 Ð 1.26 Ð Ð ÐLinear model (M1) 42.75� (15) 0.95 0.05 0.85 0.29 0.15 0.25 0.07M1-respeci®ed 30.83� (14) 0.96 0.04 0.90 0.25 0.15 0.25 0.07Non-lin. model (M2) 17.77� (6) 0.95 0.05 0.84 0.31 0.15 0.25 0.09M2-respeci®ed 5.85 (5) 0.98 0.02 0.99 0.27 0.15 0.25 0.09
Total sample (n � 1332)
Non-linear (Mt) 8.79 (5) 0.98 0.02 0.97 0.17 0.28 0.08
� p4 0:01:sat, satisfaction; exh, exhaustion; anx, anxiety
# 1998 John Wiley & Sons, Ltd. J. Organiz. Behav. 19: 387±407 (1998)
398 J. DE JONGE AND W. B. SCHAUFELI

value, which means a statistically good ®t. Moreover, all respeci®ed models show acceptable ®tvalues for AGFI, RMSEA, and NNFI, respectively.
Finally, we consider the cross-validation indices for the modi®ed models in both subsamples.The results show that model M1-respeci®ed in the calibration sample has the smallest discrepancyfunction value (CVI � 0:19), indicating the most stable model.
Interpreting structural coe�cients
Most importantly, the respeci®ed non-linear models in both subsamples yield the best ®t indices.Both models, however, do not appear to be the most stable across subsamples. Consequently, inorder to interpret the estimated non-linear structural coe�cients as reliably as possible, raw dataof both subsamples were merged into a single covariance matrix (n � 1332), that includes thethree job characteristics and their corresponding cross-products, the three outcome variables,and the two control variables. This overall non-linear model Mt shows a statistically good ®t interms of w2 and acceptable other ®t indices (see Table 3). The magnitude of the squared multiplecorrelations (R2) of the outcome variables ranged from 0.08 for job-related anxiety to 0.28 foremotional exhaustion.
Figure 4 represents the estimated structural coe�cients of the modi®ed non-linear model(M2-respeci®ed), based on the whole sample. It should be noted that only signi®cant relationshipsbetween job characteristics and employee well-being (i.e. FIML coe�cients) are shown4.Furthermore, there is one non-signi®cant FIML coe�cient in the model (i.e. the dotted line fromjob autonomy to emotional exhaustion) because of hierarchical statistical procedures (see below,cf. Bishop, Fienberg and Holland, 1975; Kleinbaum, Kupper and Muller, 1988).
A closer inspection of the non-linear model in Figure 4 reveals four signi®cant non-linearrelationships between: (1) job demands and anxiety; (2) job autonomy and emotional exhaustion;(3) social support and job satisfaction; (4) social support and emotional exhaustion, respectively.
In Figures 5 to 8 the signi®cant non-linear e�ects are graphically represented according to themethod described by Aiken and West (1991). Following hierarchical statistical principles, theregression equation consists of the squared term as well as the main term of a job characteristic.All other variables were assumed to have average levels and hence were not involved in theequations. Except for Figure 6, all other ®gures show the AD pattern as postulated by theVM. Since anxiety and emotional exhaustion are negative outcomes, the expected AD pattern isindicated by a U-shape instead of an inverted U-shape (Figures 5, 6 and 8). Contrary toexpectations, the curvilinear pattern of job autonomy is somewhat di�erent. Instead of aU-shaped curve, an inverted U-shaped curve is found: low and high levels of job autonomy areassociated with relatively low levels of exhaustion.
Discussion
The main purpose of the present study is to provide empirical support for Warr's Vitamin Model(1987, 1994) by testing it comprehensively using structural equation modelling. More speci®cally,
4 Not surprisingly, several signi®cant relationships exist between (1) demographic variables and job characteristics, (2)demographic variables and outcomes; (3) job characteristics themselves, (4) outcomes themselves, (5) demographicvariables themselves, and (6) error terms. For the sake of brevity, their size and magnitude are not shown in Figure 4. Therelevant ®ndings are available upon request from the authors.
# 1998 John Wiley & Sons, Ltd. J. Organiz. Behav. 19: 387±407 (1998)
JOB CHARACTERISTICS AND EMPLOYEE WELL-BEING 399

it was hypothesized that three crucial job characteristics (i.e. job demands, job autonomy, andworkplace social support) are curvilinearly related with three key aspects of job-related well-being (i.e. job satisfaction, job-related anxiety, and emotional exhaustion).
Model-®t
As postulated by the Vitamin Model, the ®t of the structural equation model that includes non-linear relations between job characteristics and well-being is superior to the model that onlyincludes linear relationships. Moreover, with one notable exception (i.e. the curvilinear relation-ship between job autonomy and emotional exhaustion) these non-linear relationships follow theexpected U-shaped or inverted U-shaped AD pattern (see Figure 1). Finally, although the linearmodel was slightly more stable, the robustness of ®t of the non-linear model is demonstratedbecause it was equally successfully ®tted in two independent subsamples: a calibration sampleand a validation sample. Consequently, the plausibility of the VM is con®rmed by our results.
It should be emphasized, however, that the relative magnitude of the squared multiplecorrelations (R2) is not very high, ranging from 0.08 for job-related anxiety to 0.28 for emotionalexhaustion. In addition, the variance increments of the squared terms of the predictors are notvery large either (1±2 per cent). On the other hand, it should be noted that these values areconsistent with those obtained by other high quality occupational stress studies (cf. Karasek,1989; Warr, 1990b; Xie and Johns, 1995).
Figure 4. The ultimate structural equation model with signi®cant FIML coe�cients ( p4 0:05, two-tailed;total sample: n � 1332)
# 1998 John Wiley & Sons, Ltd. J. Organiz. Behav. 19: 387±407 (1998)
400 J. DE JONGE AND W. B. SCHAUFELI

Unfortunately, four out of nine quadratic terms (i.e. 44 per cent) appeared to be signi®cant. Thevalidity of these ®ndings is somewhat limited accordingly. In general, the power of statistical testsfor higher order terms is expected to be low (cf. Aiken and West, 1991). Even under conditions ofhighly reliable measurement scales, and the use of structural equation modelling, the covariancesbetween the product terms and their components might be a�ected by measurement error. Thiserror might be the cause of unstable non-linear models. Another explanation could be that theseresults might be caused by a so-called `healthy worker e�ect' (cf. Frese, 1985). Employees withadverse health reactions might be absent more frequently and thus be underrepresented in oursample. So, the relationship between job characteristics and mental health outcomes may beunderestimated because of restriction of variance in the outcome variable(s).
Non-linear and linear representations
As far as the non-linear relationships are concerned, our ®ndings agree with other similar studies.For instance, Warr (1990b) found a similar signi®cant non-linear `AD' relationship between jobdemands and job-related anxiety.
Job demandsIn contrast, as in our study, several authors did not ®nd non-linear relationships between jobdemands and the `depressed±actively pleased' axis of a�ective well-being (e.g. Fletcher and Jones,
Figures 5±8. Graphical representations of the non-linear relationships (total sample, n � 1332; y-axis;outcome variables, x-axis, centred job characteristics)
# 1998 John Wiley & Sons, Ltd. J. Organiz. Behav. 19: 387±407 (1998)
JOB CHARACTERISTICS AND EMPLOYEE WELL-BEING 401

1993; De Jonge et al., 1995; Parkes, 1991). Thus, it seems that job demands are only linearlyassociated with indicators of job-related depression such as occupational burnout (e.g. emotionalexhaustion). An explanation for this unexpected result may be some restriction of range inexperienced workload. Generally, the experienced workload in health care is rather high; thenbecause of ®nancial cutbacks and higher care standards, more (complex) work has to beperformed with less professionals. As a consequence, not many professionals are included whoexperience very low levels of job demands (i.e. 2 per cent scored less than 2). In other words, interms of Figure 1, a great number of employees at the right-hand side (segment C) are included.Another explanation may be the reciprocity of the relationship between demands and exhaustion(e.g. De Jonge, 1995; Warr, 1994). It cannot be ruled out that emotionally exhausted people tendto perceive their workload as higher, which in turn may lead to more feelings of exhaustion.Accordingly, a linear pattern of association between job demands and occupational burnout is tobe expected.
Finally, job demands are negatively, but only linearly, related with job satisfaction. Severalinvestigators have also reported this signi®cant association. For example, McLaney and Hurrell(1988) reported in their study among 765 health care workers a signi®cant zero-order correlationof ÿ0:20 between job demands and job satisfaction. In a similar vein, a study among 289 nursesand nurses' aides revealed that job demands were positively associated with job dissatisfaction(Landsbergis, 1988).
Job autonomyThe ®nding that job autonomy is non-linearly associated with emotional exhaustion (De Jongeet al., 1995) is replicated in the present study. However, compared to the earlier study, the shapeof the curve is inverted: instead of moderate levels of autonomy being related to low levels ofexhaustion, the present study reveals that moderate autonomy is related to higher levels ofexhaustion. This particular result might be caused by the neglect of some important personalcharacteristics in this study, like `need for autonomy'. It can be speculated that employees with ahigh need for autonomy, for instance, are likely to be less a�ected by high levels of job autonomythan those lacking this need (cf. Landeweerd and Boumans, 1994; Warr, 1994). Moreover, thereis empirical as well as statistical evidence that the shape of a curve might change as a function of amoderator variable (Champoux, 1992; Jaccard et al., 1990). For example, in the case of low needfor autonomy, job autonomy could be positively related to emotional exhaustion, whereas forhigh need for autonomy the resulting relationship between job autonomy and exhaustion couldbe curvilinear (representing an inverted U-shape). These results suggest that an incorporation ora resequencing of some variables in the model might be useful.
In addition, job autonomy has a small but signi®cant linear relationship with job satisfaction.This ®nding is consistent with respect to prior job redesign research (e.g. Fried and Ferris, 1987;Loher, Noe, Moeller and Fitzgerald, 1985) and occupational stress research (e.g. Landsbergis,1988; Parkes and Von Rabenau, 1993).
Workplace social supportSocial support showed signi®cant non-linear relationships with job satisfaction and emotionalexhaustion, respectively. Both relationships followed the postulated AD pattern, and the lattercorroborates a similar ®nding of De Jonge et al. (1995). A tentative explanation for theserelatively strong non-linear relationships of social support is the nature of the work of nurses andnurses' aides. A ®rst characteristic feature of their jobs is that workplace social support plays animportant role in daily work, because for the most part nurses and nurses' aides work closely
# 1998 John Wiley & Sons, Ltd. J. Organiz. Behav. 19: 387±407 (1998)
402 J. DE JONGE AND W. B. SCHAUFELI

together in teams (e.g. De Jonge and Landeweerd, 1993; Shinn, Rosario, Morch and Chestnut,1984). A second characteristic feature is the relatively low level of job autonomy compared toother occupations. When the level of autonomy is rather poor, social and collective forms of`control' may become more important (Boone and De Jonge, 1996; Johnson and Hall, 1994). So,it can be speculated that workplace social support plays a more signi®cant role in these workers'well-being than job autonomy does.
Another ®nding of interest is the decreasing level of job satisfaction and the increasing level ofemotional exhaustion at high levels of social support. This result provides some evidence for the`stress-transfer' bu�ering theory of Karasek, Triantis and Chaudhry (1982). In the case of highsocial cohesion, the work group serves as a reservoir for moderating strain of any of its members.In other words, less strained workers absorb part of the problems of their more strainedcolleagues, equilibrating individual strain di�erences.
Finally, social support appeared to be positively related with job satisfaction, and negativelyrelated with anxiety and emotional exhaustion, respectively. Similar plausible signi®cant associa-tions have frequently been observed in occupational research. A longitudinal study by Parkes(1982), for instance, revealed that changes in social support were positively associated withchanges in job satisfaction and negatively associated with changes in anxiety and depression.
Di�erential associations
The validity of the three-axial framework of a�ective well-being has been established in this studyon job characteristics. A closer inspection of the ®ndings indicates that di�erent aspects of well-being are di�erentially associated with various job characteristics. For instance, variations in jobdemands are more likely to bear upon axis 3 (i.e. `depressed±actively pleased') than on both otheraxes. This result con®rms the role of job demands as `stressors' that have an impact on theindividual's mood rather than on his or her level of anxiety or satisfaction. More particularly, ourresults agree with the burnout literature that shows consistent and rather substantive relation-ships, especially between emotional exhaustion and measures of job demands such as perceivedstress, workload, and time pressure (Schaufeli and Buunk, 1996). Additionally, variations in jobautonomy are related with axis 1 (i.e. `discontented±contented') and axis 3 (i.e. `depressed±actively pleased') rather than with axis 2 (i.e. `anxious±comfortable'). In line with more generalnotions of depression, Warr (1990b) argued that job-related depression is thought more likely tobe related to loss or deprivation. In occupational research, job characteristics such as job auton-omy are considered important at levels representing deprivation, because they often exist in lowquantities. This line of reasoning is also consistent with Karasek's (1979) study. His two surveystudies showed that the highest levels of depression were particularly observed in employees whoexperienced low levels of job control.
Finally, variations in workplace social support are somewhat more strongly associated withaxis 1 (i.e. `discontented±contented') than with both other axes. Nonetheless, all three axesshowed meaningful relationships with social support. In the literature, several theories can befound which distinguish the di�erent roles of workplace support (cf. Johnson, 1989). On the mostbasic level, social support satis®es a human need for companionship and group a�liation, therebypromoting feelings of satisfaction. Moreover, workplace support may also serve as a resource toreduce the impact of job demands, and may lead to lower levels of anxiety and emotionalexhaustion.
In brief, di�erent job characteristics are more or less important in relation to di�erent aspectsof employee well-being.
# 1998 John Wiley & Sons, Ltd. J. Organiz. Behav. 19: 387±407 (1998)
JOB CHARACTERISTICS AND EMPLOYEE WELL-BEING 403

Limitations
Unfortunately, the present study shares some limitations with other similar studies. For instance,our study was cross-sectional and relied exclusively on self-report measures, which precludescausal interpretation of the relationships between job characteristics and employee well-being.
Nevertheless, the implication of the present study seems to be important for future research inthe ®eld of organizational behavior. The Vitamin Model has successfully challenged the popularbelief of the existence of linear relationships between job characteristics and mental healthoutcomes on which various psychological models are built such as the Job Characteristics Modeland the Demand±Control±Support Model.
References
Aiken, L. S. and West, S. G. (1991). Multiple Regression: Testing and Interpreting Interactions, SagePublications, Newbury Park, California.
Bentler, P. M. (1990). `Comparative ®t indices in structural models', Psychological Bulletin, 107, 238±246.Bentler, P. M. and Bonett, D. G. (1980). `Signi®cance tests and goodness of ®t in the analysis of covariancestructures', Psychological Bulletin, 88(3), 588±606.
Bergers, G. P. A., Marcelissen, F. H. G. and De Wol�, Ch.J. (1986). VOS-D. Vragenlijst Organisatiestress-D: handleiding [VOS-D. Work stress questionnaire Doetinchem], Katholieke Universiteit, Nijmegen.
Bishop, Y. M. M., Fienberg, S. E. and Holland, P. W. (1975). Discrete Multivariate Analysis: Theory andPractice, MIT Press, Cambridge.
Bollen, K. A. (1989). Structural Equations with Latent Variables, Wiley, New York.Bollen, K. A. and Scott Long, J. (1993). `Introduction'. In: Bollen, K. A. and Scott Long, J. (Eds) TestingStructural Equation Models, Sage, Newbury Park, California, pp. 1±9.
Boone, H. and Jonge, J. de (1996). `De relatie tussen verpleegsystemen en werkkenmerken: een exploratievestudie' [The relationship between nursing systems and job characteristics: an exploratory study],Verpleegkunde: Nederlands-Vlaams wetenschappelijk tijdschrift voor verpleegkundigen, 11(2), 74±85.
Browne, M. W. and Cudeck, R. (1993). `Alternative ways of assessing model ®t'. In: Bollen, K. A. and ScottLong, J. (Eds) Testing Structural Equation Models, Sage, Newbury Park, California, pp. 136±162.
Byrne, B. M. (1991). `The Maslach Burnout Inventory: Validating factorial structure and invariance acrossintermediate, secondary, and university educators', Multivariate Behavioral Research, 26(4), 583±605.
Champoux, J. E. (1992). `A multivariate analysis of curvilinear relationships among job scope, workcontext satisfactions, and a�ective outcomes', Human Relations, 45(1), 87±111.
Cordes, C. L. and Dougherty, T. W. (1993). `A review and an integration of research on job burnout',Academy of Management Review, 18(4), 621±656.
Cudeck, R. and Browne, M. W. (1983). `Cross-validation of covariance structures', Multivariate BehavioralResearch, 18, 147±167.
De Jonge, J. (1995). `Job Autonomy, Well-being, and Health: A study among Dutch health care workers',PhD thesis, Datawyse, Maastricht.
De Jonge, J., Janssen, P. P. M. and Van Breukelen, G. J. P. (1996). `Testing the Demand±Control±SupportModel among health care professionals: a structural equation model', Work and Stress, 10(3), 209±224.
De Jonge, J. and Landeweerd, J. A. (1993). `Toetsing van de job demand-control benadering bijwerknemers in de gezondheidszorg: een secundaire data-analyse' [Testing the job demand-controlapproach among health care workers: a secondary analysis], Gedrag en Organisatie, 6(2), 79±92.
De Jonge, J., Landeweerd, J. A. and Van Breukelen, G. J. P. (1994). `De Maastrichtse Autonomielijst:achtergrond, constructie en validering' [The Maastricht Autonomy Questionnaire: background,construction and validation], Gedrag en Organisatie, 7(1), 27±41.
De Jonge, J., Landeweerd, J. A. and Nijhuis, F. J. N. (1993). `Constructie en validering van de vragenlijstten behoeve van het project ``autonomie in het werk'' ' [Construction and validation of the questionnairefor the `job autonomy project'], Studies bedrijfsgezondheidszorg nummer 9, Rijksuniversiteit Limburg,Maastricht.
# 1998 John Wiley & Sons, Ltd. J. Organiz. Behav. 19: 387±407 (1998)
404 J. DE JONGE AND W. B. SCHAUFELI

De Jonge, J., Schaufeli, W. B. and Furda, J. (1995). `Werkkenmerken: psychologische arbeidsvitamines?'[Job characteristics: psychological work vitamins?], Gedrag en Organisatie, 8(4), 231±248.
Devlin, T. M. (1992). Textbook of Biochemistry: With Clinical Correlations, Wiley-Liss, New York.Diamantopoulos, A. (1994). `Modelling with LISREL, a guide for the uninitiated', Journal of MarketingManagement, 10, 105±136.
Fletcher, B.(C.) (1991). Work, Stress, Disease, and Life Expectancy, Wiley, Chichester.Fletcher, B.(C.) and Jones, F. (1993). `A refutation of Karasek's demand±discretion model of occupationalstress with a range of dependent measures', Journal of Organizational Behavior, 14, 319±330.
Fox, M. L., Dwyer, D. J. and Ganster, D. C. (1993). `E�ects of stressful job demands and control onpsychological and attitudinal outcomes in a hospital setting', Academy of Management Journal, 36(2),289±318.
Frese, M. (1985). `Stress at work and psychosomatic complaints: A causal interpretation', Journal ofApplied Psychology, 70(2), 314±328.
Fried, Y. and Ferris, G. R. (1987). `The validity of the Job Characteristics Model: A review and meta-analysis', Personnel Psychology, 40, 287±322.
Ganster, D. C. and Fusilier, M. R. (1989). `Control in the workplace'. In: Cooper, C. L. and Robertson,I. T. (Eds) International Review of Industrial and Organizational Psychology, Wiley, Chichester, pp. 235±280.
Ganster, D. C. and Schaubroeck, J. (1991). `Work stress and employee health', Journal of Management, 17,235±271.
Hackman, J. R. and Oldham, G. R. (1980). Work Redesign, Addison-Wesley, Massachusetts.Jaccard, J. R., Turrisi, R. and Wan, C. K. (1990). Interaction E�ects in Multiple Regression, Sage, NewburyPark, California.
Johnson, J. V. (1989). `Control, collectivity and the psychosocial work environment'. In: Sauter,S. L., Hurrell Jr., J. J. and Cooper, C. L. (Eds) Job Control and Worker Health, Wiley, Chichester,pp. 56±74.
Johnson, J. V. and Hall, E. M. (1988). `Job strain, work place social support, and cardiovascular disease:A cross-sectional study of a random sample of the Swedish working population', American Journal ofPublic Health, 78(10), 1336±1342.
Johnson, J. V. and Hall, E. M. (1994). `Social support in the work environment and cardiovascular disease'.In: Shumaker, S. A. and Czajkowski, S. M. (Eds) Social Support and Cardiovascular Disease, PlenumPress, New York, pp. 145±167.
JoÈ reskog, K. G. (1993). `Testing structural equation models'. In: Bollen, K. A. and Scott Long, J. (Eds)Testing Structural Equation Models, Sage, Newbury Park, California, pp. 294±316.
JoÈ reskog, K. G. and SoÈ rbom, D. (1993). LISREL 8: User's Reference Guide, Scienti®c Software Inter-national, Chicago.
Kahn, R. L. and Byosiere, P. (1992). `Stress in organizations'. In: Dunette, M. D. and Hough, L. M. (Eds)Handbook of Industrial and Organizational Psychology, Vol. 3, Consulting Psychologists Press, Palo Alto,CA, pp. 571±650.
Karasek Jr., R. A. (1979). `Job demands, job decision latitude, and mental strain: Implications for jobredesign', Administrative Science Quarterly, 24, 285±307.
Karasek, R. (1989). `Control in the workplace and its health-related aspects'. In: Sauter, S. L., Hurrell Jr.,J. J. and Cooper, C. L. (Eds) Job Control and Worker Health, Wiley, Chichester, pp. 129±159.
Karasek, R. A. and Theorell, T. (1990). Healthy Work: Stress, Productivity and the Reconstruction ofWorking Life, Basic Books, New York.
Karasek, R. A., Triantis, K. P. and Chaudhry, S. S. (1982). `Coworker and supervisor support asmoderators of associations between task characteristics and mental strain', Journal of OccupationalBehaviour, 3, 181±200.
Kasl, S. V. (1989). `An epidemiological perspective on the role of control in health'. In: Sauter, S. L.,Hurrell Jr., J. J. and Cooper, C. L. (Eds) Job Control and Worker Health, Wiley, Chichester, pp. 161±189.
Katz, R. (1978a). `Job longevity as a situational factor in job satisfaction', Administrative Science Quarterly,23, 204±223.
Katz, R. (1978b). `The in¯uence of job longevity on employee reactions to task characteristics', HumanRelations, 31, 703±725.
Kenny, D. A. and Judd, C. M. (1984). `Estimating the nonlinear and interactive e�ects of latent variables',Psychological Bulletin, 96(1), 201±210.
# 1998 John Wiley & Sons, Ltd. J. Organiz. Behav. 19: 387±407 (1998)
JOB CHARACTERISTICS AND EMPLOYEE WELL-BEING 405
Kleinbaum, D. G., Kupper, L. L. and Muller, K. E. (1988). Applied Regression Analysis and OtherMultivariable Methods, 2nd edn, PWS-KENT Publishing Company, Boston.
Landeweerd, J. A. and Boumans, N. P. G. (1994). `The e�ect of work dimensions and need for autonomyon nurses' work satisfaction and health', Journal of Occupational and Organizational Psychology, 67,207±217.
Landsbergis, P. A. (1988). `Occupational stress among health care workers: A test of the job demands±control model', Journal of Organizational Behavior, 9, 217±239.
Loher, B. T., Noe, R. A., Moeller, N. L. and Fitzgerald, M. P. (1985). `A meta-analysis of the relation ofjob characteristics to job satisfaction', Journal of Applied Psychology, 70, 280±289.
MacCallum, R. C., Roznowski, M., Mar, C. M. and Reith, J. V. (1994). `Alternative strategies for cross-validation of covariance structure models', Multivariate Behavioral Research, 29(1), 1±32.
MacCallum, R. C. and Tucker, L. R. (1991). `Representing sources of error in the common-factor model:Implications for theory and practice', Psychological Bulletin, 109, 502±511.
MacCallum, R. C., Wegener, D. T., Uchino, B. N. and Fabrigar, L. R. (1993). `The problem ofequivalent models in applications of covariance structure analysis', Psychological Bulletin, 114(1),185±199.
Marsh, H. W., Balla, J. R. and McDonald, R. P. (1988). `Goodness-of-®t indexes in con®rmatory factoranalysis: The e�ect of sample size', Psychological Bulletin, 103(3), 391±410.
Maslach, C. (1993). `Burnout: a multidimensional perspective'. In: Schaufeli, W. B., Maslach, C. andMarek, T. (Eds) Professional Burnout: Recent Developments in Theory and Research, Taylor & Francis,Washington, pp. 19±32.
McLaney, M. A. and Hurrell Jr., J. J. (1988). `Control, stress, and job satisfaction in Canadian nurses',Work and Stress, 2(3), 217±224.
Parkes, K. R. (1982). `Occupational stress among student nurses: A natural experiment', Journal of AppliedPsychology, 67, 784±796.
Parkes, K. (1991). `Locus of control as moderator: An explanation for additive versus interactive ®ndingsin the demand±discretion model of work stress?' British Journal of Psychology, 82, 291±312.
Parkes, K. R. and Von Rabenau, C. (1993). `Work characteristics and well-being among psychiatric health-care sta� ', Journal of Community & Applied Social Psychology, 3, 243±259.
Reiche, H. M. J. K. I. and Van Dijkhuizen, N. (1979). Vragenlijst Organisatie Stress: Test-Handleiding[Organizational Stress Questionnaire: test-manual], Katholieke Universiteit, Nijmegen.
Rosen®eld, S. (1989). `The e�ects of women's employment: Personal control and sex di�erences in mentalhealth', Journal of Health and Social Behavior, 30, 77±91.
Russell, J. A. (1980). `A circumplex model of a�ect', Journal of Personality and Social Psychology, 39,1161±1178.
Scarpello, V. and Campbell, J. P. (1983). `Job satisfaction: are all the parts there?' Personnel Psychology, 36,577±600.
Schaufeli, W. B. and Buunk, A. P. (1996). `Burnout'. In: Schabracq, M. J., Winnubst, J. A. M. and Cooper,C. L. (Eds) Handbook of Work and Health Psychology, Wiley, Chichester, pp. 311±346.
Schaufeli, W. B. and Van Dierendonck, D. (1993). `The construct validity of two burnout measures',Journal of Organizational Behavior, 14, 631±647.
Schaufeli, W. B. and Van Dierendonck, D. (1994). `Burnout, een begrip gemeten: de Nederlandse versie vande Maslach Burnout Inventory' [Burnout, a measured concept: the Dutch version of the MBI], Gedrag enGezondheid, 22(4), 153±172.
Schaufeli, W. B. and Janczur, B. (1994). `Burnout among nurses: A Polish±Dutch comparison', Journal ofCross-Cultural Psychology, 25, 95±113.
Schnall, P. L., Landsbergis, P. A. and Baker, D. (1994). `Job strain and cardiovascular disease',Annual Review of Public Health, 15, 381±411.
Schwartz, J. E., Pieper, C. F. and Karasek, R. A. (1988). `A procedure for linking psychosocial jobcharacteristics data to health surveys', American Journal of Public Health, 78(8), 904±909.
Scott Long, J. (1983). Covariance Structure Models: An Introduction to LISREL, Sage, Newbury Park,California.
Sevastos, P., Smith, L. and Cordery, J. L. (1992). `Evidence on the reliability and construct validity ofWarr's (1990) well-being and mental health measures', Journal of Occupational and OrganizationalPsychology, 65, 33±49.
Shinn, M., Rosario, M., Morch, H. and Chestnut, D. E. (1984). `Coping with job stress and burnout inhuman services', Journal of Personality and Social Psychology, 46, 864±876.
# 1998 John Wiley & Sons, Ltd. J. Organiz. Behav. 19: 387±407 (1998)
406 J. DE JONGE AND W. B. SCHAUFELI

Shirom, A. (1989). `Burnout in work organizations'. In: Cooper, C. L. and Robertson, I. (Eds) InternationalReview of Industrial and Organizational Psychology, Wiley, Chichester, pp. 25±48.
Steiger, J. H. (1990). `Structural model evaluation and modi®cation: An interval estimation approach',Multivariate Behavioral Research, 25, 173±180.
Vermaat, K. (1994). Flexibele Werklastbeheersing in de Verpleging [Flexible workload control in nursing],Limburg University, Maastricht.
Verschuren, P. J. M. (1991). Structurele Modellen tussen Theorie en Praktijk [Structural models betweentheory and practice], Het Spectrum, Meppel.
Warr, P. (1987). Work, Unemployment, and Mental Health, Clarendon Press, Oxford.Warr, P. (1990a). `The measurement of well-being and other aspects of mental health', Journal ofOccupational Psychology, 63, 193±210.
Warr, P. B. (1990b). `Decision latitude, job demands, and employee well-being', Work and Stress, 4(4),285±294.
Warr, P. (1994). `A conceptual framework for the study of work and mental health', Work and Stress, 8(2),84±97.
Watson, D. and Tellegen, A. (1985). `Toward a consensual structure of mood', Psychological Bulletin, 98(2),219±235.
Weaver, C. N. (1980). `Job satisfaction in the United States in the 1970s', Journal of Applied Psychology,65(3), 364±367.
Xie, J. L. and Johns, G. (1995). `Job scope and stress: can job scope be too high?', Academy of ManagementJournal, 38(5), 1288±1309.
# 1998 John Wiley & Sons, Ltd. J. Organiz. Behav. 19: 387±407 (1998)
JOB CHARACTERISTICS AND EMPLOYEE WELL-BEING 407