Embed Size (px)
Citation preview

João Pedro Nunes Pereira
Polyvinylidene fluoride based nanocompositesfor the development of energy systems
João
Ped
ro N
unes
Per
eira
Outubro de 2013UMin
ho |
201
3Po
lyvi
nylid
ene
fluor
ide
base
d na
noco
mpo
site
sfo
r th
e de
velo
pmen
t of e
nerg
y sy
stem
s
Universidade do MinhoEscola de Ciências


Outubro de 2013
Tese de DoutoramentoFísica / Ciências
Trabalho efectuado sob a orientação deProfessor Doutor Senentxu Lanceros-MéndezProfessor Doutor José Gerardo Vieira da Rocha
João Pedro Nunes Pereira
Polyvinylidene fluoride based nanocompositesfor the development of energy systems
Universidade do MinhoEscola de Ciências


i
for my PARENTS,
to whom I fully dedicate this work!


iii
Acknowledgments
I would like to thank to Portuguese Foundation for Science and Technology –
FCT for the financial support (SFRH/BD/66930/2009) and to University of Minho for
giving me all the conditions to develop my work.
Being a researcher is a lifestyle which is only possible if one is surrounded by
fantastic people helping us to take the right decisions. Belong to the Electroactive Smart
Materials group was undoubtedly the key of success of this work... without you my
friends, none of this would be possible. Thank you all, especially Carlos and Vítor for
having guided me so patiently in my first steps.
Professor Senentxu, I can find no words to express my deep gratitude and
admiration for everything you taught me and for every moment I lived with you along
this long journey. After all these years I can truly say that you are my "father in science"
and you will always be a reference to me and an example to follow. THANK YOU!
Professor Gerardo, thank you for all the support and encouragement shown
throughout these years and the good advices you always gave me.
Thank you Professor Manuela for all the support and availability that always
showed to work with me.
Thank you Professor Darrell for the amazing time I have experienced with your
research group at Bath University.
Many thanks Vítor, Susana and Pedro for your friendship and constant presence
throughout these years.
Madi, Daniel, Ritinha, Sarinha, Anita, Óscar and Teresinha heartfelt thanks for all
the love you put in my life! I am a very happy and lucky guy to have you near me!
And you My Beloved’s mom and dad…THANK YOU… for all the love you
always gave me since my first day, I owe you everything!


v
Abstract
The economic and environmental costs of current energy resources created the
need to develop new methods to generate and store energy. In this sense, the
development of polymer materials led to the emergence of a new generation of porous
polymers for energy applications, which are typically described as “energy polymers”.
The specific properties of poly(vinylidene fluoride) (PVDF) and its copolymer
poly(vinylidene fluoride-co-trifluoroethylene) (P(VDF-TrFE)), such as high dielectric
permittivity, high polarity, softness and flexibility, among others, make them excellent
choices for energy applications. The incorporation of fillers into these polymeric
matrices can also be highly advantageous, since it allows tuning certain properties of the
matrices optimizing their characteristics for specific applications.
According this, P(VDF-TrFE) based composite membranes with zeolites (Y
zeolite, NaY), clays (montmorillonite, MMT), multiwalled-carbon nanotubes
(MWCNT) and barium titanate (BaTiO3) fillers were prepared by thermally induced
phase separation (TIPS) for batteries separator applications. PVDF and P(VDF-TrFE)
polymers and composites with BaTiO3 were also prepared by electrospinning for energy
harvesting systems.
P(VDF-TrFE) composite membranes showed suitable morphological, thermal,
mechanical and electrochemical properties for the development of lithium ion separator
membranes for battery applications.
The developed membranes showed high degrees of porosity, ranging from 70 %
for the pristine polymer to a maximum of 83 % for MMT filled membrane, excepting
NaY membrane which showed the lowest value of 36 %. The porosity increase is
reflected in electrolyte solution uptake, which increases markedly for membranes with
higher porosity reaching values above 300 % for BaTiO3 and MMT filled membranes,
whereas for the pristine polymer is ~225 %.
The room temperature ionic conductivity showed a strong increase for all
composites, from 5.24×10⁻⁷
S/cm for the pristine polymer to a maximum of 9.22×10⁻⁶
S/cm for the BaTiO3/P(VDF-TrFE) membrane. The ionic conductivity variation with
temperature is diminished with the inclusion of fillers, in particular for the MMT and
MWCNT filled membranes. The stable operation window is at least 6.0 V for all
membranes.

vi
Pristine polymer electrospun fibers of PVDF showed the best energy harvesting
performance with generated output powers of 0.02 W and 25 W, under low and high
mechanical deformation conditions, respectively. Pristine P(VDF-TrFE) and
BaTiO3/P(VDF-TrFE) composites fibers showed lower output powers.
The objectives of the study were successfully achieved, and the overall results are
an effective contribute for the development of novel polymer based materials for energy
systems applications.

vii
Resumo
Os custos económicos e ambientais das fontes de energia mais usadas na
atualidade criaram a necessidade de procurar novos métodos de armazenar e gerar
energia. Neste sentido, a disponibilidade de materiais poliméricos possibilitou o
aparecimento de uma nova geração de polímeros porosos para aplicações energéticas
designados por “polímeros energéticos”.
As propriedades específicas do poli(fluoreto de vinilideno) (PVDF) e do seu
copolímero poli(fluoreto de vinilideno-co-trifluoretileno) (P(VDF-TrFE)), tais como
elevada constante dielétrica, alta polaridade e flexibilidade, entre outras, fazem deles
excelentes escolhas para este tipo de aplicações.
Desta forma prepararam-se membranas poliméricas compósitas baseadas em
P(VDF-TrFE) com zeólitos (zeólito Y, NaY), argilas (montmorillonite, MMT),
nanotubos de carbono (MWCNT) e titanato de bário (BaTiO3), pelo método de
separação de fase termicamente induzida (TIPS), para aplicações em separadores de
baterias, bem como fibras de PVDF, P(VDF-TrFE) e BaTiO3/P(VDF-TrFE) por
electrospinning para sistemas de energy harvesting.
As membranas compósitas de P(VDF-TrFE) revelaram propriedades
morfológicas, térmicas, mecânicas e eletroquímicas adequadas para aplicações em
separadores de baterias de lítio.
A maior parte das membranas compósitas apresentaram elevados valores de
porosidade, desde 70 % para o polímero simples até 83 % para a membrana com MMT,
com a exceção da membrana com zeólitos que apresentou o valor mais baixo de 36 %.
Os aumentos da porosidade refletiram-se na absorção de líquido eletrólito, que
aumentou de forma mais acentuada nas membranas com maior porosidade atingindo
valores superiores a 300 % para as membranas com BaTiO3 e MMT, quando
comparado com os 200 % do polímero puro.
A condutividade iónica à temperatura ambiente apresentou fortes aumentos em
todos os compósitos, desde o valor de 5.24×10⁻⁷
S/cm para o polímero puro até ao
máximo de 9.22×10⁻⁶
S/cm para a membrana de BaTiO3/P(VDF-TrFE). As variações da
condutividade em função da temperatura foram diminuídas nos compósitos,
principalmente para as membranas com MMT e MWCNT. A janela estável de operação
foi no mínimo de 6.0 V para todas as membranas.

viii
As fibras poliméricas de P(VDF-TrFE) produzidas por electrospinning
apresentaram o melhor resultado em termos de geração de energia, gerando potências
saída de 0.02 W e 25 W, em condições de baixa a alta deformação mecânica,
respetivamente. O polímero P(VDF-TrFE) e o compósito BaTiO3/P(VDF-TrFE)
apresentaram potências mais baixas.
Os objetivos deste estudo foram alcançados com sucesso e os resultados globais
são um contributo efetivo para o desenvolvimento de novos materiais poliméricos para
aplicações em sistemas de energia.

ix
Contents
1 - Introduction ........................................................................................................ 1
1.1. Polymers and energy systems ...................................................................... 3
1.2. Poly(vinylidene) fluoride ............................................................................. 4
1.3. Applications ................................................................................................. 6
1.4. Objectives ..................................................................................................... 9
1.5. Thesis structure .......................................................................................... 10
1.6. References .................................................................................................. 11
2 - Materials and methods ..................................................................................... 15
2.1. Materials ..................................................................................................... 17
2.2. Sample preparation..................................................................................... 18
2.2.1. Porous membranes for battery separator applications ........................ 18
2.2.2. Electrospun polymer fibers for energy harvesting .............................. 19
2.3. Sample characterization ............................................................................. 20
2.3.1. Microstructure and polymer phase ...................................................... 20
2.3.2. Thermal properties and degree of crystallinity ................................... 21
2.3.3. Porosity ............................................................................................... 21
2.3.4. Electrolyte solution uptake .................................................................. 22
2.3.5. Mechanical properties ......................................................................... 22
2.3.6. Electrochemical impedance spectroscopy........................................... 23
2.3.7. Cyclic voltammetry ............................................................................. 24
2.3.8. Energy harvesting response................................................................. 24
2.4. References .................................................................................................. 26
3 - Porous membranes of NaY/P(VDF-TrFE) ...................................................... 27
3.1. Introduction ................................................................................................ 29
3.2. Results and Discussion ............................................................................... 31

x
3.2.1. Microstructural characteristics and polymer phase ............................. 31
3.2.2. Thermal and mechanical properties .................................................... 34
3.2.3. Electrical properties ............................................................................ 38
3.3. Conclusion.................................................................................................. 43
3.4. References .................................................................................................. 45
4 - Porous membranes of MMT/P(VDF-TrFE) .................................................... 51
4.1. Introduction ................................................................................................ 53
4.2. Results and discussion................................................................................ 56
4.2.1. Microstructural characteristics and polymer phase ............................. 56
4.2.2. Porosity, electrolyte uptake and tortuosity .......................................... 59
4.2.3. Thermal and mechanical properties .................................................... 60
4.2.4. Electrical properties ............................................................................ 62
4.3. Conclusion.................................................................................................. 66
4.4. References .................................................................................................. 68
5 - Porous membranes of CNT/P(VDF-TrFE) ...................................................... 73
5.1. Introduction ................................................................................................ 75
5.2. Results and discussion................................................................................ 77
5.2.1. MWCNT type and concentration ........................................................ 77
5.2.2. Microstructural characteristics ............................................................ 78
5.2.3. Thermal and mechanical properties .................................................... 82
5.2.4. Electrical properties ............................................................................ 84
5.2.5. MWCNT type comparison .................................................................. 90
5.4. Conclusion.................................................................................................. 91
5.5. References .................................................................................................. 92
6 - Porous membranes of BaTiO3/P(VDF-TrFE) .................................................. 97
6.1. Introduction ................................................................................................ 99
6.2. Results and discussion.............................................................................. 101

xi
6.2.1. Microstructural characteristics .......................................................... 101
6.2.5. Particles size effect ............................................................................ 110
6.3. Conclusion................................................................................................ 113
6.4. References ................................................................................................ 115
7 - Energy harvesting performance of PVDF based electrospun fibers .............. 121
7.1. Introduction .............................................................................................. 123
7.2. Results and discussion.............................................................................. 125
7.2.1. Morphology ....................................................................................... 125
7.2.2. Polymer phase and crystallinity ........................................................ 129
7.2.3. Energy harvesting response............................................................... 130
7.3. Conclusion................................................................................................ 135
7.4. References ................................................................................................ 136
8 - Final remarks, conclusions and future work .................................................. 139
8.1. Final remarks ............................................................................................ 141
8.2. Conclusions .............................................................................................. 145
8.3. Future work .............................................................................................. 146
8.4. References ................................................................................................ 148


xiii
List of figures
Figure 1.1: Schematic representations of PVDF , and -phases. ............................... 5
Figure 1.2: Schematic representation of P(VDF-TrFE). ................................................. 6
Figure 2.1: Scheme of the procedure for sample preparation. ...................................... 19
Figure 2.2: Scheme of the procedure for the preparation of the BaTiO3/P(VDF-TrFE)
electrospun fibers. ........................................................................................................... 20
Figure 2.3: a) Scheme of the experimental setup used for the periodic bending tests; b)
interdigitated electrode plate with electrospun fibers; c) electromechanical generator
during a energy harvesting bending test. ........................................................................ 25
Figure 3.1: Cross-section SEM images of the NaY/P(VDF-TrFE) composites with
different zeolite contents: a) 0 % (P(VDF-TrFE)); b) 4 %; c) 16 %; d) 32 %. .............. 31
Figure 3.2: a) Influence of the zeolite content in the mean diameter of pores and
porosity in the NaY/P(VDF-TrFE) composites and b) 1 M LiClO4.3H2O-PC solution
uptake as a function of zeolite content for the NaY/P(VDF-TrFE) composites. ........... 32
Figure 3.3: FTIR spectra for NaY/P(VDF-TrFE) composites for different zeolite
contents: a) without electrolyte solution uptake; b) with electrolyte solution uptake. ... 33
Figure 3.4: DSC thermograms of the NaY/P(VDF-TrFE) composites with different
zeolite filler contents: a) without electrolyte solution uptake; b) with electrolyte
solution uptake. ............................................................................................................... 35
Figure 3.5: Stress-Strain curves of the NaY/P(VDF-TrFE) composites with different
zeolite particles contents: a) without electrolyte solution uptake; b) with electrolyte
solution uptake. ............................................................................................................... 36
Figure 3.6: Stress-Strain curves of the NaY/P(VDF-TrFE) composites for 16 wt% at
different temperatures. .................................................................................................... 38

xiv
Figure 3.7: a) Nyquist plot of the NaY/P(VDF-TrFE) composites for all filler contents
at 50 ºC; b-c) Bode diagram of the NaY/P(VDF-TrFE) composites for all contents at
50 ºC and d) impedance modulus as a function of zeolite content at different
temperatures.................................................................................................................... 39
Figure 3.8: Log i as function of 1000/T for NaY/P(VDF-TrFE) composites a) without
electrolyte solution uptake and b) with electrolyte solution uptake. .............................. 41
Figure 3.9: a) Voltammograms of NaY/P(VDF-TrFE) with 16 wt% of zeolites at
different scanning rates and b) voltammograms of NaY/P(VDF-TrFE) composites at
0.5 V/s. ............................................................................................................................ 42
Figure 4.1: Cross section SEM images of the MMT/P(VDF-TrFE) composites with
different clay content: a) 0 wt%, b) 4 wt%, c) 16 wt% and d) 32 wt%. ......................... 57
Figure 4.2: FTIR spectra of the MMT/P(VDF-TrFE) composites with different MMT
contents without electrolyte solution uptake. ................................................................. 58
Figure 4.3: a) Porosity as a function of clay content for MMT/P(VDF-TrFE)
composites; b) 1 M LiClO4.3H2O-PC solution uptake as a function of clay content for
the MMT/P(VDF-TrFE) composites. ............................................................................. 59
Figure 4.4: DSC thermograms of the MMT/P(VDF-TrFE) composites for the different
clay contents without electrolyte solution uptake........................................................... 60
Figure 4.5: Stress-Strain curves of the MMT/P(VDF-TrFE) composites with different
clay contents: a) without electrolyte solution uptake and b) with electrolyte
solution uptake. ............................................................................................................... 61
Figure 4.6: a) Nyquist plot of the MMT/P(VDF-TrFE) composites for all filler contents
at 50 ºC, b-c) Bode diagram of the MMT/P(VDF-TrFE) composites for all contents at
50 ºC and d) impedance modulus as a function of clay content at different temperatures.
........................................................................................................................................ 63
Figure 4.7: Log i as a function of 1000/T for MMT/P(VDF-TrFE) composites: a)
without electrolyte solution uptake and b) with electrolyte solution uptake. ................. 64

xv
Figure 4.8: a) Voltammogram of MMT/P(VDF-TrFE) composites at 0.5 V/s; b)
voltammogram of MMT/P(VDF-TrFE) with 16 wt% of clays at different scanning rates.
........................................................................................................................................ 66
Figure 5.1: DC conductivity as function of filler amount for the different MWCNT
used at room temperature. .............................................................................................. 77
Figure 5.2: Cross section SEM images and histograms of pore size diameter of the
MWCNT/P(VDF-TrFE) composites with different filler content: a) and c) 0.0 wt%, b)
and d) 0.5 wt%. ............................................................................................................... 78
Figure 5.3: Porosity and electrolyte uptake as function of MWCNT content for
membranes with different content of fillers. .................................................................. 79
Figure 5.4: FTIR spectra of the MWCNT/P(VDF-TrFE) composites with different
MWCNT content without electrolyte solution uptake. .................................................. 80
Figure 5.5: Room temperature ionic conductivity and tortuosity of membranes
+ 1 M LiClO4.3H2O; σ0 (S/cm) = 9.8 mS/cm at 25 ºC. .................................................. 81
Figure 5.6: DSC thermograms of the MWCNT/P(VDF-TrFE) composites for the
different filler contents without electrolyte solution uptake. .......................................... 82
Figure 5.7: Stress-strain curves of the MWCNT/P(VDF-TrFE) composites with
different filler contents: a) without electrolyte solution uptake; b) with electrolyte
solution uptake. ............................................................................................................... 83
Figure 5.8: a) Nyquist plot and b-c) Bode diagram of the MWCNT/P(VDF-TrFE)
composites for different filler content at 25 ºC. ............................................................. 84
Figure 5.9: Equivalent circuit proposed for the impedance data measured in the
different MWCNT/P(VDF-TrFE) membranes at different temperatures....................... 85
Figure 5.10: Nyquist plot for the experimental data and fitting for the equivalent circuit
of figure 5.9 for membrane with 0.2 wt% of MWCNT at 50 ºC. ................................... 86

xvi
Figure 5.11: Log i as a function of 1000/T for MWCNT/P(VDF-TrFE) composites:
a) without electrolyte solution uptake; b) with electrolyte solution uptake. .................. 87
Figure 5.12: a) Voltammogram of MWCNT/P(VDF-TrFE) composites at 0.1 V/s;
b) voltammogram of MWCNT/P(VDF-TrFE) with 0.5 wt% of MWCNT at different
scanning rates. ................................................................................................................ 88
Figure 5.13: a) Stress-strain curves of the MWCNT/P(VDF-TrFE) membranes with
electrolyte uptake; b) Nyquist plot of the MWCNT/P(VDF-TrFE) composites with
electrolyte uptake at 25 ºC; c) Log i as a function of 1000/T for
MWCNT/P(VDF-TrFE) composites with electrolyte uptake; d) Voltammograms of the
MWCNT/P(VDF-TrFE) membranes with electrolyte uptake at 0.5 V/s........................ 90
Figure 6.1: Cross section SEM images of the BaTiO3/P(VDF-TrFE) composites with
different filler contents: a) 0 wt%, b) 4 wt%, c) 16 wt% and d) 32 wt%; e) average pore
size distribution and f) electrolyte content as function of time, for membrane with 16
wt% of BaTiO3. ............................................................................................................ 102
Figure 6.2: a) Average pore size and porosity and b) electrolyte content as function of
BaTiO3 content for all membrane. ................................................................................ 103
Figure 6.3: a) FTIR spectra of the BaTiO3/P(VDF-TrFE) composites with different
filler contents; b) DSC thermogram of membrane composites with different amounts of
ceramic particles. .......................................................................................................... 104
Figure 6.4: Stress-strain curves of the BaTiO3/P(VDF-TrFE) composites with different
ceramic nanoparticles contents after electrolyte solution uptake. ................................ 106
Figure 6.5: a) Nyquist plot for the BaTiO3/P(VDF-TrFE) composites at 25 ºC; b) Log
i as a function of 1000/T for BaTiO3/P(VDF-TrFE) composites with electrolyte
solution uptake. ............................................................................................................. 107
Figure 6.6: a) Voltammogram of BaTiO3/P(VDF-TrFE) composites at 0.1 V/s with
different filler contents; b) voltammogram of BaTiO3/P(VDF-TrFE) with 16 wt% of
ceramic particles with 100 nm in diameter at different scanning rates. ...................... 109

xvii
Figure 6.7: Cross section SEM images of BaTiO3/P(VDF-TrFE) composites with
16 wt% of ceramic particles with filler sizes of a) 10 nm and b) 500 nm. ................. 110
Figure 6.8: a) Average pore size and porosity and b) electrolyte content of membranes
with 16 wt% of BaTiO3 particles as a function of filler average diameter. .................. 111
Figure 6.9: a) Tensile stress-strain measurements, b) Nyquist plot at 25 ºC, c) Log i as
a function of 1000/T and d) cyclic voltammetry, of BaTiO3/P(VDF-TrFE) composites
with 16 wt% filler content. ........................................................................................... 112
Figure 7.1: BaTiO3/P(VDF-TrFE) electrospun membrane obtained at 15/85
polymer/solution and with 5 % BaTiO3 nanoparticles with particle size of Ø = 100 nm:
a) 20 kV, b) 35 kV, c) 25 kV and d) backscattering image of sample obtained at 25 kV
(image b). Traveling distance of 20 cm, needle inner diameter of 0.5 mm and flow rate
of 0.5 mL/h. .................................................................................................................. 126
Figure 7.2: a) Influence of applied electric field on the mean diameter of the
electrospun BaTiO3/P(VDF-TrFE) fibers, the flow rate was 0.5 mL/h and needle inner
diameter of 0.5 mm; b) Influence of tip inner diameter on the mean diameter of the
electrospun BaTiO3/P(VDF-TrFE) fibers, the flow rate was 0.5 mL/h and applied
electric field of 1.25 kV/cm; c) Influence of flow rate on the mean diameter of the
electrospun BaTiO3/P(VDF-TrFE) fibers, the tip inner diameter was 0.5 mm and the
applied electric field of 1.25 kV/cm; d) Influence of BaTiO3 content on the fiber mean
diameter for the electrospun BaTiO3/P(VDF-TrFE) membrane, the tip inner diameter
was 0.5 mm, applied electric field of 1.25 kV/cm and a flow rate of 0.5 mL/h. Average
filler size: Ø = 100 nm; filler concentration in a), b) and c) 5 %. ................................ 127
Figure 7.3: Influence of BaTiO3 particle average size in the composite fiber diameter:
a) 10 nm, b) 500 nm, c) backscattering image of electrospun fibers with 20 % BaTiO3
(Ø = 100 nm) and d) electrospun BaTiO3/P(VDF-TrFE) (20 % BaTiO3 and
Ø = 100 nm) membrane obtained at 750 rpm. For all samples, tip inner diameter was
0.5 mm, applied electric field of 1.25 kV/cm and a flow rate of 0.5 mL/h. ................. 128
Figure 7.4: a) Infrared measurements for the PVDF and BaTiO3/P(VDF-TrFE)
electrospun membranes with a tip inner diameter of 0.5 mm, applied voltage of 25 kV,
distance between tip and collector of 20 cm and a flow rate of 1.0 and 8.0 mL/h; b) DSC

xviii
results for the PVDF and BaTiO3/P(VDF-TrFE) electrospun membranes with a tip inner
diameter of 0.5 mm, applied voltage of 25 kV and a distance between tip and collector
of 20 cm and a flow rate of 1.0 and 8.0 mL/h. ............................................................. 129
Figure 7.5: Voltage generated during 6 ms at a frequency of 1 kHz, of an electrospun
sample of BaTiO3/P(VDF-TrFE) with 20 % of ceramic 10 nm; b) maximum voltage
generated at different frequencies for all type of samples produced; c) piezopotential
obtained at 1 kHz for P(VDF-TrFE) and BaTiO3/P(VDF-TrFE) with 20 % ceramic filler
and d) maximum power generated by the electrospun membranes as a function of
frequency. ..................................................................................................................... 132
Figure 7.6: a) Diagram of a bending test performed with a finger; b) Positive output
voltage generated during a test performed with finger deformation for the PVDF
electrospun fibers. ......................................................................................................... 134
Figure 8.1: Cross section images of: a) pristine P(VDF-TrFE), b) 16 wt% NaY/P(VDF-
TrFE), c) 4 wt% MMT/ P(VDF-TrFE), d) 0.1 wt% MWCNT/ P(VDF-TrFE) and
e) 16 wt% BaTiO3/ P(VDF-TrFE) membranes. ........................................................... 141
Figure 8.2: a) Average pore size and b) porosity and uptake for the P(VDF-TrFE),
16 wt% NaY/P(VDF-TrFE), 4 wt% MMT/P(VDF-TrFE), 0.1 wt% MWCNT/P(VDF-
TrFE) and 16 wt% BaTiO3/P(VDF-TrFE) membranes. ............................................... 142
Figure 8.3: Room temperature a) ionic conductivity; b) tortuosity and activation energy
for the P(VDF-TrFE), 16 wt% NaY/P(VDF-TrFE), 4 wt% MMT/P(VDF-TrFE), 0.1
wt% MWCNT/P(VDF-TrFE) and 16 wt% BaTiO3/P(VDF-TrFE) membranes. ......... 143
Figure 8.4: Log i as function of 1000/T of (VDF-TrFE), 16 wt% NaY/P(VDF-TrFE),
4 wt% MMT/P(VDF-TrFE), 0.1 wt% MWCNT/P(VDF-TrFE) and 16 wt%
BaTiO3/P(VDF-TrFE) membranes. .............................................................................. 144

xix
List of tables
Table 2.1: Materials, provider and prepared samples in each chapter. .......................... 17
Table 3.1: Ionic conductivity and tortuosity of 1 M LiClO4.3H2O + separator
membrane; σ0 = 9.8 mS/cm at 25 ºC. ............................................................................. 34
Table 3.2: Degree of Crystallinity of all samples calculated through equation 2.1 to the
melting peak of samples without electrolyte solution uptake......................................... 35
Table 3.3: Mechanical properties of the composite membranes. .................................. 37
Table 3.4: Activation energy for all porous membranes with and without electrolyte
solution. .......................................................................................................................... 41
Table 3.5: Diffusion coefficient calculated by equation 2.8 for all porous membranes
with electrolyte solution. ................................................................................................ 43
Table 4.1: Room temperature ionic conductivity and tortuosity of 1M LiClO4.3H2O +
separator membrane; σ0 = 9.8 mS/cm at 25 ºC. .............................................................. 59
Table 4.2: Degree of crystallinity calculated applying equation 2.1 to the melting peak
of the samples. ................................................................................................................ 61
Table 4.3: Mechanical properties of the MMT/P(VDF-TrFE) membranes with and
without electrolyte solution uptake................................................................................. 62
Table 4.4: Activation energy for the different porous membranes with and without
electrolyte solution uptake. ............................................................................................. 65
Table 5.1: Characteristics of the MWCNT. ................................................................... 77
Table 5.2: Degree of crystallinity of the membranes calculated by applying equation
2.1 to the melting peak of the samples ........................................................................... 82
Table 5.3: Mechanical properties of the MWCNT/P(VDF-TrFE) membranes with and
without electrolyte solution uptake................................................................................. 83

xx
Table 5.4: Equivalent circuit parameters for MWCNT/P(VDF-TrFE) membranes at
50 ºC. .............................................................................................................................. 86
Table 5.5: Activation energies for all membranes with and without electrolyte solution
uptake.............................................................................................................................. 88
Table 6.1: Structural properties of the ceramic fillers [35]. ........................................ 101
Table 6.2: Degree of crystallinity of the BaTiO3/P(VDF-TrFE) membranes with
different amounts of ceramic fillers.............................................................................. 105
Table 6.3: Mechanical properties of the membranes with electrolyte solution uptake.
...................................................................................................................................... 106
Table 6.4: Room temperature ionic conductivity (σi) and tortuosity () of the
membranes filled with 1 M LiClO4.3H2O electrolyte solution; σ0 = 9.8 mS/cm at 25 ºC.
...................................................................................................................................... 107
Table 6.5: Activation energy (Ea) of the composite membranes with electrolyte solution
uptake, determined after equation 2.7. ......................................................................... 108
Table 7.1: Characteristic physical properties of electroactive PVDF, P(VDF-TrFE) and
BaTiO3 [26, 31]. ........................................................................................................... 133
Table 7.2: Structural properties of the BaTiO3 ceramic particles [35]. ....................... 134
Table 8.1: Average pore size, porosity and electrolyte uptake of the membranes. ..... 142
Table 8.2: Room temperature ionic conductivity (σi), tortuosity () and activation
energy (Ea) of the membranes filled with 1 M LiClO4.3H2O electrolyte solution;
σ0 = 9.8 S/cm at 25 ºC. ................................................................................................. 143

xxi
List of symbols
A Area
C Capacitor
C0 Analyte concentration
d Thickness
D Diffusion coefficient
d3n Piezoelectric coefficient
E Voltage
Ea Activation energy
Econtent Electrolyte content
I Current intensity
ip Oxidative peak current
k3n Electromechanical coupling coefficient
mn Mass
N Number of electrons
nn Parameter n
Pn Power
Q Differential heat
R Ideal gas constant
Rn Resistance / resistor
T Temperature
t Time
T’ Period
Tc Curie temperature
Tg Glass transition temperature
Tm Melting temperature
v Potential scan rate
Vn Voltage
WS Warburg impedance
|Z| Absolute impedance
Z’ Imaginary impedance
Z’’ Real impedance

xxii
ΔH Enthalpy
ε Porosity
ε’ Dielectric constant
σn Conductivity
τ Tortuosity
Ø Diameter
χc Degree of crystallinity

xxiii
List of abbreviations
ATR Attenuated total reflectance
CNT Carbon nanotubes
CPE Constant phase element
DMC Dimethyl carbonate
DMF N,N-dimethylformamide
DSC Differential scanning calorimetry
EC Ethylene carbonate
EIS Electrochemical impedance spectroscopy
FE Ferroelectric
FTIR Fourier transformed infrared spectrostopy
MEK Methylethylketone
MMT Montmorillonite
MWCNT Multiwalled-carbon nanotubes
MWS Maxwell-Wagner-Sillars
NMP N-methyl-pyrrolidone
P(VDF-TrFE) Poly(vinylidene fluoride-co-trifluoroethylene)
PAN Poly(acrylonitrile)
PC Propylene carbonate
PE Paraelectric
PEG Polyethylene glycol
PEO Poly(ethylene oxide)
PI Polyimide
PP Poly(propylene)
PVA Polyvinyl alcohol
PVDF Poly(vinylidene fluoride)
PVDF-HFP Poly(vinylidene fluoride-co-hexafluoropropene)
PZT Lead zirconate titanate
SEM Scanning electron microscope
SPE Solid polymer electrolyte
TGA Thermo gravimetric analysis

xxiv
THF Tetrahydrofuran
TIPS Thermally induced phase separation
XRD X-ray diffraction

1 - Introduction
This chapter introduces the main topics related to the present thesis. A contextualization
of the work is provided in accordance to current energy needs. The main characteristics
of poly(vinylidene) fluoride (PVDF) and its copolymers are presented, as well as their
specific applications in energy systems. Finally the general and specific objectives of
the study are defined together with the main structure of the document.


1 - INTRODUCTION
3
1.1. Polymers and energy systems
For economical and environmental reasons the increasing need of energy by
modern societies led to the need to explore clean and renewable energy resources. Fossil
fuel resources are getting scarce and expensive and economical activity based on these
fuels brought up the carbon dioxide load increase on the atmosphere to values with
large impact on global warming. In this sense, new energy generations and storage
systems are being explored, some of them based on a new generation of porous
polymers for energy applications, which could be described as “energy polymers”.
These materials allow new energy related possibilities, with better generation, storage
and transportation. Novel polymeric materials for fuel cells membranes, hydrogen and
methane storage, nanofoams with high thermal insulation, catalysts, light harvesting,
among others, are strongly emerging. Recent advances in the control of polymer
molecular structures allow a fine tuning of their properties, which led to increased
interest in its use [1-3].
The next generation of energy storage and conservation devices is based on solid
polymer electrolytes (SPE), which provides larger operational flexibility and long
lifetime for a wide range of applications [4]. Lithium-ion (Li-ion) secondary batteries
play a key role in meeting energy demands of current society, mainly in portable
electronic devices and in electrical vehicles, since they have high theoretical capacity,
improved safety, lower materials cost, simple fabrication and absence of electrolyte
leakage. In batteries, electrolyte liquids frequently present numerous disadvantages,
such as gas formation during operation, leakage, corrosive reactions, combustible
reaction products, difficulty of use in portable devices, among others; these problems
led to increased demand for polymer based alternatives [3].
The most widely used polymers in SPE applications are poly(ethylene) (PE),
poly(propylene) (PP), poly(ethylene oxide) (PEO), poly(acrylonitrile) (PAN),
poly(vinylidene fluoride) (PVDF) and its copolymers [5]. PEO was the first polymer
proposed and used in SPE Li-ion rechargeable batteries, however, the electrolyte system
exhibited lower room temperature ionic conductivity, due to the crystalline nature of
PEO polymer and moderate dielectric constant [3-4]. To overcome this, many studies
have focused on composite polymer electrolytes, based on polymers with low glass
transition temperature (Tg) with adequate amounts of inert inorganic nanofillers. It is

1 – INTRODUCTION
4
established that the inclusion of ceramic fillers improves the ionic conductivity of the
composite polymer electrolytes [3, 5]. Among fillers, the most commonly used into
polymer hosts matrices are the inert oxide ceramics (aluminium oxide – Al2O3, silicon
oxide – SiO2 and titanium dioxide – TiO2), molecular sieves (zeolites), ferroelectric
materials (e.g. BaTiO3) and carbonaceous fillers [6].
The search for solutions that meet the energy needs of contemporary societies is
not restricted to energy storage. New energy generation processes have been studied in
order to meet these needs. In this sense, energy harvesting materials and systems have
emerged as a prominent research area. Harvesting energy from ambient waste energy
for low power electronic applications became a strong ally of wireless devices
technologies, since this allows remote electric power sourcing of storage devices, thus
extending wireless systems lifespan. This concept has an immediate economic and
environmental impact, by reducing chemical waste resulting from the replacement of
batteries and maintenance costs. The increasing interest in this area led to many studies,
mainly based on the piezoelectric effect of materials to convert environmental vibration
into useful electrical energy [7-9].
Among polymers, PVDF is an important case of energy material, its semi-
crystalline and high-molecular weight structure, with short and long-term ordering
regions, allows obtaining, after poling, a suitable piezoelectric response for these kind
of applications. PVDF presents the advantage of being mechanically strong, flexible and
resistant to a wide variety of chemicals [7]. Lately, the incorporation of piezoceramics,
such as BaTiO3 and lead zirconate titanate (PZT), into polymeric matrices has raised
largest interest and presents itself as a challenge in developing applications [10].
In short, the use of polymers in energy systems is becoming increasingly
important. They are easy to process, low cost and the overall mechanical, thermal and
electrochemical properties make them excellent choices for the development of new
energy systems.
1.2. Poly(vinylidene) fluoride
PVDF is a semi-crystalline polymer with a complex structure which can show five
distinct chain conformations. The, designed as all trans (TTT) planar zigzag -phase,
1 - INTRODUCTION
5
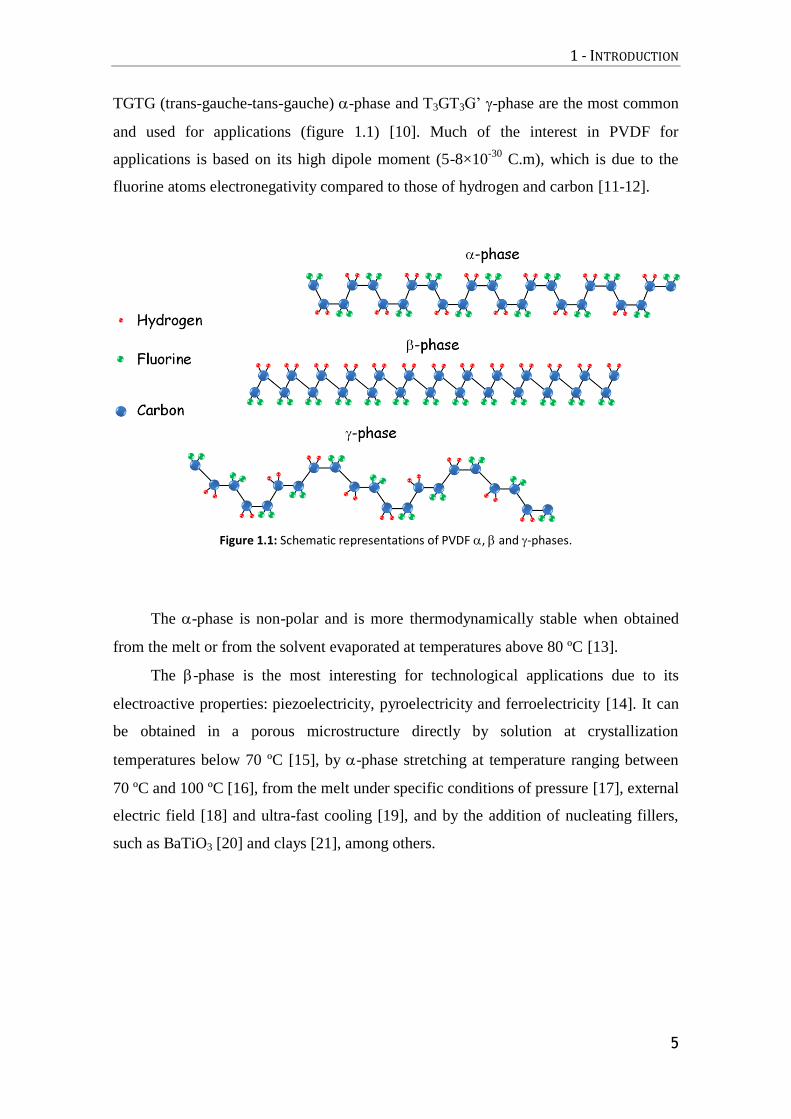
TGTG (trans-gauche-tans-gauche) -phase and T3GT3G’ -phase are the most common
and used for applications (figure 1.1) [10]. Much of the interest in PVDF for
applications is based on its high dipole moment (5-8×10-30
C.m), which is due to the
fluorine atoms electronegativity compared to those of hydrogen and carbon [11-12].
Figure 1.1: Schematic representations of PVDF , and -phases.
The -phase is non-polar and is more thermodynamically stable when obtained
from the melt or from the solvent evaporated at temperatures above 80 ºC [13].
The -phase is the most interesting for technological applications due to its
electroactive properties: piezoelectricity, pyroelectricity and ferroelectricity [14]. It can
be obtained in a porous microstructure directly by solution at crystallization
temperatures below 70 ºC [15], by -phase stretching at temperature ranging between
70 ºC and 100 ºC [16], from the melt under specific conditions of pressure [17], external
electric field [18] and ultra-fast cooling [19], and by the addition of nucleating fillers,
such as BaTiO3 [20] and clays [21], among others.

1 – INTRODUCTION
6
The semi-crystalline copolymer poly(vinylidene fluoride-co-trifluoroethylene)
P(VDF-TrFE) (figure 1.2) always presents a electroactive phase, similar to the one of
the β-phase of PVDF, for specific molar ratios of vinylidene fluoride (VDF) and TrFE,
independently on the processing method (from the melt or from solution) [22]. The
ferroelectric-paraelectric (FE-PE) phase transition of P(VDF-TrFE) occurs at a Tc below
the melting temperature (Tm). These temperatures depend on the crystallization
conditions and molar ratio of VDF and TrFE [23-25].
Figure 1.2: Schematic representation of P(VDF-TrFE).
1.3. Applications
PVDF and PVDF based composites have specific properties of high electrical
permittivity, low thermal conductivity, softness and flexibility, good impedance
matching to air and water and relatively low cost, making them excellent choices for
several applications, such as sensors, actuators, vibrations control, ultrasonic
transducers, batteries, filters, chemical warfare protection, magnetoelectric materials,
and recently in the biological fields [18, 26-28]. Less known are the applications in
tactile sensors, ferroelectric devices, energy conservation devices, shock sensors,
thermal and optical property measurement devices and pyroelectric infrared arrays,
among others [29].
There is a recent increasing interest in developing polymer electrolytes with high
ionic conductivity, good mechanical strength and thermal stability for Li-ion batteries,
and also other electrochemical devices like supercapacitors and electrochromic devices,
which should meet the requirements of safety, energy density and mechanical properties

1 - INTRODUCTION
7
for these kind of applications [10]. PVDF has high polarity, dielectric permittivity and
anodic stability, which provides larger affinity with polar liquid electrolytes and
supports ionizations of lithium salts, so that their incorporation into PVDF polymeric
matrix lead to high functional polymer electrolytes [5, 10]. PVDF has proven to
enhance lithium transport number due to selective interactions with anionic species. The
ionic conduction process depends on electrolyte solution uptake, which in turn depends
on the porosity and pore size of the polymer matrix [30]. However, the affinity of PVDF
with the electrolyte liquid may affect the thermal and mechanical stabilities, if too much
solution fills the matrix pores [31]. Costa et al. [32] studied the copolymer P(VDF-
TrFE) membranes for this purpose and found that best performances were obtained in
porous membranes with hydrated lithium salts loaded by uptake technique. The
incorporation of lithium triflate salt into poly(vinylidene fluoride-co-hexafluoropropene)
copolymer (PVDF-HFP) matrix proved to be a way to increase ionic conductivity by
reducing crystallinity of the polymer [33], once the interactions between PVDF and
lithium salts mainly occurs in the polymer amorphous area [34].
The major challenge for materials for battery applications is to combine good
ionic conductivity and high electrolyte uptake whilst keeping proper mechanical
properties (in the temperature range of lithium battery operation).
The use of PVDF and copolymers based composites in Li-ion batteries
applications is a promising way for these kinds of applications, namely through the
fabrication of polymeric matrices with homogeneous multilayers or hierarchical pore
structures in order to enhance the thermal and mechanical stability, electrodes
compatibility and ionic conduction, as well as electrochemical performance [5, 10]. The
use of several fillers has been reported with profitable results; the incorporation of nano-
clays particles into PVDF matrices shows enhanced porosities, electrolyte uptakes,
room temperature ionic conductivity and electrodes interfacial resistance [35]; the
inclusion of SiO2(Li+) into PVDF leads to higher electrolyte uptakes and ionic
conductivities [36]; TiO2 in PVDF-HFP helps to improve the mechanical strength, ionic
conductivity and electrolyte/electrode interfacial stability [37]. The nature and amount
of fillers is crucial in determining the properties of the composite [5].
PVDF has also been widely used as sensor and actuator on the basis of its
piezoelectric properties. However, the piezoelectric ceramics/polymers with improved
properties, with respect to the polymer matrix, represent the major challenge of this area
[38-39]. In this sense, the inclusion of ceramic fillers like BaTiO3 [36, 40] or lead

1 – INTRODUCTION
8
zirconate titanate (PZT) [41], carbon nanotubes [41], among others, in PVDF and
P(VDF-TrFE) matrices contributes to improve dielectric constant, enabling to tune the
piezoelectric response to obtain higher output powers in vibration harvesting structures
[10]. The vast majority of recent research in power harvesting with piezoelectric
materials has focused on improving the efficiency of piezoelectric power harvesting
systems, however, improving the power harvesting circuitry and energy management
techniques has also been targeted. The large challenge of this area remains in the gap
between energy consumption of electronic devices and the energy generation
capabilities of the power harvesting systems [9].
In short, PVDF and its copolymers are the most interesting and promising
polymers for the development of energy storage and generation applications, due to
their large dielectric constant, piezoelectric, pyroelectric and ferroelectric effects,
among others. They offer broad engineering possibilities for materials preparation with
tailored microstructure and properties, showing therefore large potential for a new
generation of energy related applications. The inclusion of fillers in these systems also
represents a real alternative to optimize energy devices based on these materials [5, 10].

1 - INTRODUCTION
9
1.4. Objectives
Since the improvement of existing energy generation and storage devices
represents a part of the solution to meet current energy demands of the modern world,
the main objective of the present study is to develop new polymer composite materials,
based on PVDF and P(VDF-TrFE), with the requirements for lithium battery separators
and vibration energy harvesting applications. To achieve this purpose, the main specific
objectives are:
1. Prepare porous P(VDF-TrFE) based composite membranes, by thermally induced
phase separation (TIPS), with different filler types, shape and contents: zeolites
(Y zeolist, NaY), clays (montmorillonite, MMT), multiwalled-carbon nanotubes
(MWCNT) and barium titanate (BaTiO3) for lithium batteries separator
applications;
2. Prepare PVDF, P(VDF-TrFE) and BaTiO3/P(VDF-TrFE) fibers, by
electrospinning technique, with different amounts of the piezoceramic BaTiO3, for
energy harvesting systems;
3. Obtain a complete characterization of the morphological, thermal, mechanical and
electrochemical properties of the prepared samples, as well as knowing the
relationship between these properties and fillers added;
4. Evaluate the performance of the prepared materials for applications.

1 – INTRODUCTION
10
1.5. Thesis structure
This thesis is divided into eight chapters to provide a logical sequence of the
developed work during this investigation. Five of the eight chapters are based on
published scientific papers focused on the development of materials for energy systems
applications.
The chapter 1 describes a general state of art of materials and systems developed
during the study. A specific state of art is provided in each of the following chapters,
whenever necessary. The objectives of the study are also presented as well as the
structure of the thesis report.
The chapter 2 provides a description of the experimental procedures, including
used materials and preparation methods of respective samples, the experimental
techniques carried out to characterize morphological, thermal, mechanical and
electrochemical properties of the samples, as well as the procedures used to test the
performance of the materials for the intended applications.
The chapters 3, 4, 5 and 6 report the study of the influence of NaY, MMT,
MWCNT and BaTiO3 fillers, respectively, in the morphological, thermal, mechanical
and electrochemical properties of the P(VDF-TrFE) composite membranes for lithium
battery applications. All these chapters are based on published scientific papers.
Chapter 7 describes the preparation and testing of a energy harvesting device
based on PVDF, P(VDF-TrFE) and P(VDF-TrFE) with BaTiO3 ceramic particles. This
chapter is based on a published scientific paper.
The chapter 8 provides some final remarks by comparing the main characteristics
of the membranes presented in chapters 3, 4, 5 and 6 for battery applications, the
general conclusions of the study as well as the future work perspectives.

1 - INTRODUCTION
11
1.6. References
1. Thomas, A., P. Kuhn, J. Weber, M.-M. Titirici, and M. Antonietti. Porous
Polymers: Enabling Solutions for Energy Applications. Macromolecular Rapid
Communications, 2009. 30(4-5): p. 221-236.
2. Vilela, F., K. Zhang, and M. Antonietti. Conjugated porous polymers for energy
applications. Energy & Environmental Science, 2012. 5(7): p. 7819-7832.
3. Mittal, V. Polymers for energy storage and conversion. 2013, New Jersey: John
Wiley & Sons.
4. Hickner, M.A. and J.E. McGrath. 10.32 - Polymers in Energy Applications, in
Polymer Science: A Comprehensive Reference, M. Editors-in-Chief: Krzysztof
and M. Martin, Editors. 2012, Elsevier: Amsterdam. p. 597-600.
5. Costa, C.M., M.M. Silva, and S. Lanceros-Mendez. Battery separators based on
vinylidene fluoride (VDF) polymers and copolymers for lithium ion battery
applications. RSC Advances, 2013. 3(29): p. 11404-11417.
6. Costa, C.M., J. Nunes-Pereira, L.C. Rodrigues, M.M. Silva, J.L.G. Ribelles, and
S. Lanceros-Méndez. Novel poly(vinylidene fluoride-
trifluoroethylene)/poly(ethylene oxide) blends for battery separators in lithium-
ion applications. Electrochimica Acta, 2013. 88(0): p. 473-476.
7. Erturk, A. and D.J. Inman. Piezoelectric Energy Harvesting. 2011: Wiley.
8. Priya, S. and D.J. Inman. Energy Harvesting Technologies. 2008: Springer.
9. Anton, S.R. and H.A. Sodano. A review of power harvesting using piezoelectric
materials (2003–2006). Smart Materials and Structures, 2007. 16(3): p. R1.
10. Martins, P., A.C. Lopes, and S. Lanceros-Mendez Electroactive phases of
poly(vinylidene fluoride): Determination, processing and applications. Progress
in Polymer Science, DOI:
http://dx.doi.org/10.1016/j.progpolymsci.2013.07.006.
11. Salimi, A. and A.A. Yousefi. Analysis Method: FTIR studies of β-phase crystal
formation in stretched PVDF films. Polymer Testing, 2003. 22(6): p. 699-704.
12. Giannetti, E. Semi-crystalline fluorinated polymers. Polymer International,
2001. 50(1): p. 10-26.
13. Gregorio, J.R. and M. Cestari. Effect of crystallization temperature on the
crystalline phase content and morphology of poly(vinylidene fluoride). Journal
of Polymer Science Part B: Polymer Physics, 1994. 32(5): p. 859-870.
14. Silva, M.P., C.M. Costa, V. Sencadas, A.J. Paleo, and S. Lanceros-Méndez.
Degradation of the dielectric and piezoelectric response of β-poly(vinylidene

1 – INTRODUCTION
12
fluoride) after temperature annealing. Journal of Polymer Research, 2011.
18(6): p. 1451-1457.
15. Magalhães, R., N. Durães, M. Silva, J. Silva, V. Sencadas, G. Botelho, J.L.
Gómez Ribelles, and S. Lanceros-Méndez. The Role of Solvent Evaporation in
the Microstructure of Electroactive β-Poly(Vinylidene Fluoride) Membranes
Obtained by Isothermal Crystallization. Soft Materials, 2010. 9(1): p. 1-14.
16. Sencadas, V., R. Gregorio, and S. Lanceros-Méndez. α to β Phase
Transformation and Microestructural Changes of PVDF Films Induced by
Uniaxial Stretch. Journal of Macromolecular Science, Part B, 2009. 48(3): p.
514-525.
17. Hattori, T., M. Kanaoka, and H. Ohigashi. Improved piezoelectricity in thick
lamellar beta-form crystals of poly(vinylidene fluoride) crystallized under high
pressure. Journal of Applied Physics, 1996. 79(4): p. 2016-2022.
18. Ribeiro, C., V. Sencadas, J.L.G. Ribelles, and S. Lanceros-Méndez. Influence of
Processing Conditions on Polymorphism and Nanofiber Morphology of
Electroactive Poly(vinylidene fluoride) Electrospun Membranes. Soft Materials,
2010. 8(3): p. 274-287.
19. Yang, D. and Y. Chen. β-phase formation of poly(vinylidene fluoride) from the
melt induced by quenching. Journal of Materials Science Letters, 1987. 6(5): p.
599-603.
20. Mendes, S.F., C.M. Costa, C. Caparros, V. Sencadas, and S. Lanceros-Méndez.
Effect of filler size and concentration on the structure and properties of
poly(vinylidene fluoride)/BaTiO3 nanocomposites. Journal of Materials Science,
2012. 47(3): p. 1378-1388.
21. Patro, T.U., M.V. Mhalgi, D.V. Khakhar, and A. Misra. Studies on
poly(vinylidene fluoride)–clay nanocomposites: Effect of different clay
modifiers. Polymer, 2008. 49(16): p. 3486-3499.
22. Nalwa, H.S. Ferroelectric polymers : chemistry, physics, and applications.
1995, New York: Dekker.
23. Lovinger, A.J., T. Furukawa, G.T. Davis, and M.G. Broadhurst.
Crystallographic changes characterizing the Curie transition in three
ferroelectric copolymers of vinylidene fluoride and trifluoroethylene: 2.
Oriented or poled samples. Polymer, 1983. 24(10): p. 1233-1239.
24. Furukawa, T., G.E. Johnson, H.E. Bair, Y. Tajitsu, A. Chiba, and E. Fukada.
Ferroelectric phase transition in a copolymer of vinylidene fluoride and
trifluoroethylene. Ferroelectrics, 1981. 32(1): p. 61-67.
25. Li, W., Y. Zhu, D. Hua, P. Wang, X. Chen, and J. Shen. Crystalline
morphologies of P(VDF-TrFE) (70/30) copolymer films above melting point.
Applied Surface Science, 2008. 254(22): p. 7321-7325.

1 - INTRODUCTION
13
26. Martins, P., J.S. Nunes, G. Hungerford, D. Miranda, A. Ferreira, V. Sencadas,
and S. Lanceros-Méndez. Local variation of the dielectric properties of
poly(vinylidene fluoride) during the α- to β-phase transformation. Physics
Letters A, 2009. 373(2): p. 177-180.
27. Martins, P., C. Caparros, R. Gonçalves, P.M. Martins, M. Benelmekki, G.
Botelho, and S. Lanceros-Mendez. Role of Nanoparticle Surface Charge on the
Nucleation of the Electroactive β-Poly(vinylidene fluoride) Nanocomposites for
Sensor and Actuator Applications. The Journal of Physical Chemistry C, 2012.
116(29): p. 15790-15794.
28. Sencadas, V., R. Gregorio Filho, and S. Lanceros-Mendez. Processing and
characterization of a novel nonporous poly(vinilidene fluoride) films in the β
phase. Journal of Non-Crystalline Solids, 2006. 352(21–22): p. 2226-2229.
29. Lang, S.B. and S. Muensit. Review of some lesser-known applications of
piezoelectric and pyroelectric polymers. Applied Physics A, 2006. 85(2): p. 125-
134.
30. Saito, Y., H. Kataoka, E. Quartarone, and P. Mustarelli. Carrier Migration
Mechanism of Physically Cross-Linked Polymer Gel Electrolytes Based on
PVDF Membranes. The Journal of Physical Chemistry B, 2002. 106(29): p.
7200-7204.
31. Saunier, J., F. Alloin, J.Y. Sanchez, and L. Maniguet. Plasticized microporous
poly(vinylidene fluoride) separators for lithium-ion batteries. III. Gel properties
and irreversible modifications of poly(vinylidene fluoride) membranes under
swelling in liquid electrolytes. Journal of Polymer Science Part B: Polymer
Physics, 2004. 42(12): p. 2308-2317.
32. Costa, C.M., V. Sencadas, J.G. Rocha, M.M. Silva, and S. Lanceros-Méndez.
Evaluation of the main processing parameters influencing the performance of
poly(vinylidene fluoride–trifluoroethylene) lithium-ion battery separators.
Journal of Solid State Electrochemistry, 2013. 17(3): p. 861-870.
33. Ramesh, S. and S.-C. Lu. Effect of lithium salt concentration on crystallinity of
poly(vinylidene fluoride-co-hexafluoropropylene)-based solid polymer
electrolytes. Journal of Molecular Structure, 2011. 994(1–3): p. 403-409.
34. Tian, L.-y., X.-b. Huang, and X.-z. Tang. Study on morphology behavior of
PVDF-based electrolytes. Journal of Applied Polymer Science, 2004. 92(6): p.
3839-3842.
35. Prasanth, R., N. Shubha, H.H. Hng, and M. Srinivasan. Effect of nano-clay on
ionic conductivity and electrochemical properties of poly(vinylidene fluoride)
based nanocomposite porous polymer membranes and their application as
polymer electrolyte in lithium ion batteries. European Polymer Journal, 2013.
49(2): p. 307-318.

1 – INTRODUCTION
14
36. Ye, H.-J., W.-Z. Shao, and L. Zhen. Crystallization kinetics and phase
transformation of poly(vinylidene fluoride) films incorporated with
functionalized baTiO3 nanoparticles. Journal of Applied Polymer Science,
2013. 129(5): p. 2940-2949.
37. Miao, R., B. Liu, Z. Zhu, Y. Liu, J. Li, X. Wang, and Q. Li. PVDF-HFP-based
porous polymer electrolyte membranes for lithium-ion batteries. Journal of
Power Sources, 2008. 184(2): p. 420-426.
38. Cui, C., R.H. Baughman, Z. Iqbal, T.R. Kazmar, and D.K. Dahlstrom. Improved
piezoelectric s for hydrophone applications based on calcium-modified lead
titanate/poly(vinylidene fluoride) composites. Sensors and Actuators A:
Physical, 1998. 65(1): p. 76-85.
39. Safari, A. Development of piezoelectric composites for transducers. Journal de
physique. III, 1994. 4(7): p. 1129-1149.
40. Nunes-Pereira, J., V. Sencadas, V. Correia, J.G. Rocha, and S. Lanceros-
Méndez. Energy harvesting performance of piezoelectric electrospun polymer
fibers and polymer/ceramic composites. Sensors and Actuators A: Physical,
2013. 196(0): p. 55-62.
41. Guan, X., Y. Zhang, H. Li, and J. Ou. PZT/PVDF composites doped with carbon
nanotubes. Sensors and Actuators A: Physical, 2013. 194(0): p. 228-231.

2 - Materials and methods
This chapter provides a description of the materials used in this investigation, as
well as the experimental details on sample preparation. The experimental conditions for
the characterization of the morphological, thermal, mechanical and electrochemical or
electromechanical properties of the prepared samples are also presented.


2 – MATERIALS AND METHODS
17
2.1. Materials
The materials used in the present study are shown in table 2.1, together with the
provider as well as the reference to the prepared sample, and the chapter in which the
results are presented.
Table 2.1: Materials, provider and prepared samples in each chapter.
Chapter Material Provider Sample
3
Poly(vinylidene fluoride-co-trifluoroethylene) (70/30)
(P(VDF-TrFE)) Solvay
P(VDF-TrFE)/DMF (15/85) (w/w)
N,N-dimethylformamide (DMF)
Merck
Y zeolite (NaY) Zeolyst
International 4, 16 and 32 wt% NaY/P(VDF-
TrFE)
Propylene carbonate (PC) Merck Electrolyte uptake in 1 M
LiClO4∙3H2O-PC for all samples Lithium perchlorate trihydrate (LiClO4∙3H2O)
Merck
4
Poly(vinylidene fluoride-co-trifluoroethylene) (70/30)
(P(VDF-TrFE)) Solvay
P(VDF-TrFE)/DMF (15/85) (w/w)
N,N-dimethylformamide (DMF)
Merck
Montmorillonite K10 (MMT) Sigma Aldrich 4, 16 and 32 wt%
MMT/P(VDF-TrFE)
Propylene carbonate (PC) Merck Electrolyte uptake in 1 M
LiClO4∙3H2O-PC for all samples Lithium perchlorate trihydrate (LiClO4∙3H2O)
Merck
5
Poly(vinylidene fluoride-co-trifluoroethylene) (70/30)
(P(VDF-TrFE)) Solvay
P(VDF-TrFE)/DMF (15/85) (w/w)
N,N-dimethylformamide (DMF)
Merck
Multiwalled-carbon nanotubes C 150P
(MWCNT_B) Baytubes®
0.1, 0.2 and 0.5 wt% MWCNT/P(VDF-TrFE) Multiwalled-carbon
nanotubes NC3100 (MWCNT_N)
NanocylTM
Propylene carbonate (PC) Merck Electrolyte uptake in 1 M
LiClO4∙3H2O-PC for all samples Lithium perchlorate trihydrate (LiClO4∙3H2O)
Merck

2 – MATERIALS AND METHODS
18
6
Poly(vinylidene fluoride-co-trifluoroethylene) (70/30)
(P(VDF-TrFE)) Solvay
P(VDF-TrFE)/DMF (15/85) (w/w)
N,N-dimethylformamide (DMF)
Merck
Barium titanate particles (BaTiO3) Ø = 10, 100 and 500
nm Nanoamor
4, 16 and 32 wt% BaTiO3/P(VDF-TrFE)
Propylene carbonate (PC) Merck Electrolyte uptake in 1 M
LiClO4∙3H2O-PC for all samples Lithium perchlorate trihydrate (LiClO4∙3H2O)
Merck
7
Poly(vinylidene) fluoride (PVDF) Solef 1010
Solvay
PVDF/DMF/MEK (15/68/17) (w/w) and
P(VDF-TrFE)/DMF/MEK (15/68/17) (w/w)
Poly(vinylidene fluoride-co-trifluoroethylene) (70/30)
(P(VDF-TrFE)) Solvay
N,N-dimethylformamide (DMF)
Merck
Methylethylketone (7.0/3.0, v/v) (MEK)
Panreac
Barium titanate particles (BaTiO3) Ø = 10, 100 and 500
nm Nanoamor
5, 10 and 20 wt% BaTiO3/P(VDF-TrFE)
2.2. Sample preparation
2.2.1. Porous membranes for battery separator applications
NaY/P(VDF-TrFE), MMT/P(VDF-TrFE), MWCNT/P(VDF-TrFE) and
BaTiO3/P(VDF-TrFE) porous membranes were prepared by thermally induced phase
separation (figure 2.1). The fillers were dispersed in a DMF solution during 4 hours.
P(VDF-TrFE) powder was added to the fillers to achieve a concentration of 15 % (w/w)
of the two components in solution. The fillers to polymer relative concentration ranged
from 0 up to 32 % for NaY, MMT and BaTiO3 particles and 0.1 up to 0.5 % for
MWCNT (as it should be below the percolation threshold for both MWCNT types to be
suitable for the intended purpose [1]). The solution was prepared at room temperature
under constant magnetic stirring until complete polymer dissolution, i.e., until a
homogeneous solution was obtained (~2 hours). In order to prevent the formation of

2 – MATERIALS AND METHODS
19
aggregates and to improve polymer dissolution, the solution temperature was increased
5 ºC above room temperature during the first 15 min. Finally, the mixture was placed in
a glass Petri dish allowing completely DMF solvent evaporation at room temperature
during 15 days in a gas extraction chamber.
Figure 2.1: Scheme of the procedure for sample preparation.
2.2.2. Electrospun polymer fibers for energy harvesting
PVDF, P(VDF-TrFE) and BaTiO3/P(VDF-TrFE) electrospun fiber samples were
prepared by dispersing the ceramic powder in a solution of DMF and MEK, from
Panreac to obtain a total concentration of 15 % (w/w) of polymer plus ceramic present
in the solution. The ceramic to polymer relative concentration ranged from 0 up to 20 %
ceramic content (w/w). The final solution was dissolved at room temperature under
constant magnetic stirring until complete polymer dissolution, i.e., until a homogeneous
solution was obtained (~2 hours) (figure 2.2).
The polymer solution was placed in a commercial plastic syringe (10 mL) fitted
with a steel needle with inner diameter ranging from 0.5 to 1.7 mm. Electrospinning
was conducted in a range between 20 and 35 kV with a high voltage power supply from
Glassman (model PS/FC30P04). A syringe pump (from Syringepump) was used to feed
the polymer solutions into the needle tip at rate between 0.5 and 8 mL/h.

2 – MATERIALS AND METHODS
20
The electrospun fibers were collected in a grounded collecting plate (random
fibers) or in a rotating drum (oriented fibers), placed at a distance between 10 and 30 cm
from the needle (figure 2.2), and in interdigitated electrode plates (figure 2.3b).
Figure 2.2: Scheme of the procedure for the preparation of the BaTiO3/P(VDF-TrFE) electrospun fibers.
2.3. Sample characterization
The common techniques for porous membrane and electrospun fiber
characterization (scanning electron microscopy (SEM), Fourier transformed infrared
spectroscopy (FTIR) and differential scanning calorimetry (DSC)) are presented first,
followed by the specific techniques used for porous membrane characterization
(porosity, electrolyte solution uptake, stress strain measurements, electrochemical
impedance spectroscopy (EIS) and cyclic voltammetry) and for electrospun fiber
characterization (periodic bending tests).
2.3.1. Microstructure and polymer phase
Samples were coated with a thin gold layer using a sputter coating (Polaron,
model SC502 sputter coater) and the morphology analyzed using a scanning electron
microscope (Leica Cambridge apparatus at room temperature) with an accelerating
voltage of 15 kV. The membrane average pore diameter and the electrospun fiber
diameter were determined on the basis of the diameter of 40 pores and fibers,
respectively, using the SEM images at 200x magnification and the Image J software.

2 – MATERIALS AND METHODS
21
Polymer phase of the porous membranes and electrospun fibers were assessed by
FTIR performed at room temperature with a Jasco FTIR-4100. FTIR spectra were
collected in attenuated total reflectance mode (ATR) from 4000 to 600 cm-1
after 32
scans with a resolution of 4 cm-1
.
2.3.2. Thermal properties and degree of crystallinity
The thermal properties of the porous membranes and electrospun fibers were
determined by DSC with a Mettler Toledo 821e apparatus. The samples were cut from
the central region of the samples, placed in 50 L crucibles and heated from 50 to 200
ºC at a rate of 10 ºC/min, under an argon atmosphere. The degree of crystallinity (c)
was calculated (equation 2.1) from the melting/crystallization enthalpy (Hf) based on
the enthalpy of a 100 % crystalline sample (P(VDF-TrFE): H100 = 103.4 J/g) [2]:
100ΔH
ΔHχ
100
fc (2.1)
2.3.3. Porosity
The porosity of the membranes (ε) was measured with a pycnometer by the
following procedure: the pycnometer was filled with ethanol and the mass was
measured (m1); the mass of the sample was measured (m0) and then immersed in
ethanol; after the sample being completely soaked in ethanol, more ethanol was added
to fill completely the pycnometer, and the mass of the assembly (sample + pycnometer)
was measured (m2); finally, the sample was removed from the pycnometer and the
residual weight of the pycnometer with ethanol was measured (m3). Ethanol was used
because of its low density and easy soaking within the sample.
The porosity of the membrane was calculated according to [3]:
31
032
mm
mmm
(2.2)
The mean porosity of each membrane was obtained as the average of the values
determined in six measurements.

2 – MATERIALS AND METHODS
22
2.3.4. Electrolyte solution uptake
The porous membranes were immersed in an electrolyte solution of 1 M
LiClO4.3H2O in PC during 24 hours (figure 2.1) and the uptake was evaluated
according to:
100m
mmUptake
0
0
(2.3)
where m0 is the mass of the membrane and mE is the mass of the membrane after
immersion in the electrolyte solution.
The electrolyte content (Econtent) was evaluated according to:
100m
m-1E
E
0content (2.4)
where m0 is the mass of the dry membrane and mE is the mass of the membrane
filled with electrolyte solution.
LiClO4.3H2O was chosen for the electrolyte solution as it improves the
conductivity of the composite as compared to LiClO4, as reported in other works [4-6].
This salt is widely used in electrolyte solutions due to its excellent solubility and high
anodic stability, as well as high decomposition temperature in solution (above 100 ºC)
[6].
2.3.5. Mechanical properties
The mechanical properties of the porous membranes (~1.0×2.5 cm) were
evaluated by stress strain measurements carried out in a TST350 Linkam Scientific
Instruments set up at a strain rate of 15 m/s.

2 – MATERIALS AND METHODS
23
2.3.6. Electrochemical impedance spectroscopy
The ionic conductivity of the porous membranes was evaluated by an Autolab
PGSTAT-12 (Eco Chemie) set-up in a frequency range from 500 mHz to 65 kHz. The
samples were placed in a constant volume support equipped with gold blocking
electrodes located within a Buchi TO 50 oven. The temperature, measured by a type K
thermocouple, was varied between 20 and 120 ºC. The ionic conductivity (σi) was
calculated for each heating cycle according to:
AR
dσ
b
i (2.5)
where Rb is the bulk resistance, d is the thickness and A is the area of the sample.
The tortuosity (), the ratio between the effective capillarity and thickness of the
sample was determined by [7]:
i
0
σ
στ
(2.6)
where σ0 is the conductivity of the liquid electrolyte, σi is the conductivity of the
membrane and the electrolyte set at room temperature and ε is the porosity of the
membrane.
The ionic conductivity (σi) temperature dependence follows the Arrhenius
equation:
RT
Eexpσ a
0i (2.7)
where 0, is the pre-exponential factor, Ea is the apparent activation energy for ion
transport, R is the gas constant (8.314 J/mol.K) and T is the temperature.

2 – MATERIALS AND METHODS
24
2.3.7. Cyclic voltammetry
Cyclic voltammetry was performed within a glove box with argon atmosphere
using a two electrode configuration and a gold microelectrode as working electrode.
The 25 m diameter gold microelectrodes were previously polished, washed with
tetrahydrofuran (THF) and dried in hot air. The cell assembly was performed within the
glove box by placing a lithium disk (10 mm diameter, 1 mm thick, Aldrich, 99.9%
purity) as a counter electrode on a stainless steel current collector. Then the porous
membrane sample was centred over the counter electrode and the gold microelectrode
was centred over the sample. The assembly was firmly attached by a clamp, placed
inside a Faraday cage and connected to an Autolab PGSTAT-12 (Eco Chemie) that
records the voltammograms at a scan rate from 0.05 to 1 mV/s. From the
voltammograms, the diffusion coefficient (D) of the electroactive species was calculated
according to the Randles-Sevcik equation [8]:
02
12
12
35
p CvADn)10(2.69i (2.8)
where ip is the oxidative peak current in A, n is the number of electrons transferred in
the redox reaction, A is the electrode area in cm2, v is the potential scan rate in V/s and
C0 is the analyte concentration in mol/cm3.
2.3.8. Energy harvesting response
Energy harvesting performance of the electrospun samples was evaluated by
periodic bending tests (low deformation) in an electromechanical generator (Frederiksen
2185.00) excited from 1 Hz to 1 kHz using a signal generator (Circuitmate GF2) with
an internal resistance of 1 M (figure 2.3a). The maximum vertical displacement of the
samples was ~7 mm measured from the initial position at 1 Hz (figure 2.3c). The
voltage output was performed using an oscilloscope (Axo 4005) and the data collected

2 – MATERIALS AND METHODS
25
with the Picoscope software. The maximum average power was calculated from the first
100 ms of vibration trough:
dtR
)t(V
'T
1P
L
2
0L (2.9)
where V0(t) is the real time voltage, RL is the load resistance and T’ is the period
of load application.
Samples were also submitted to bending tests with high deformation, where the
mechanical stress was applied by a finger, following the procedure applied by [9].
Figure 2.3: a) Scheme of the experimental setup used for the periodic bending tests; b) interdigitated electrode plate with electrospun fibers; c) electromechanical generator during a energy harvesting bending test.

2 – MATERIALS AND METHODS
26
2.4. References
1. Carabineiro, S.A.C., M.F.R. Pereira, J. Nunes-Pereira, J. Silva, C. Caparros, V.
Sencadas, and S. Lanceros-Méndez. The effect of nanotube surface oxidation on
the electrical properties of multiwall carbon nanotube/poly(vinylidene fluoride)
composites. Journal of Materials Science, 2012. 47(23): p. 8103-8111.
2. Bassett, D.C. Developments in Crystalline Polymers. 1982, London: Applied
Science Publishers.
3. California, A., V.F. Cardoso, C.M. Costa, V. Sencadas, G. Botelho, J.L. Gómez-
Ribelles, and S. Lanceros-Mendez. Tailoring porous structure of ferroelectric
poly(vinylidene fluoride-trifluoroethylene) by controlling solvent/polymer ratio
and solvent evaporation rate. European Polymer Journal, 2011. 47(12): p. 2442-
2450.
4. Costa, C.M., V. Sencadas, J.G. Rocha, M.M. Silva, and S. Lanceros-Méndez.
Evaluation of the main processing parameters influencing the performance of
poly(vinylidene fluoride–trifluoroethylene) lithium-ion battery separators.
Journal of Solid State Electrochemistry, 2013. 17(3): p. 861-870.
5. Nunes, S.C., V. de Zea Bermudez, D. Ostrovskii, P.B. Tavares, P.C. Barbosa,
M.M. Silva, and M.J. Smith. Spectroscopic and structural studies of di-ureasils
doped with lithium perchlorate. Electrochimica Acta, 2007. 53(4): p. 1466-1475.
6. Xu, K. Nonaqueous Liquid Electrolytes for Lithium-Based Rechargeable
Batteries. Chemical Reviews, 2004. 104(10): p. 4303-4418.
7. Karabelli, D., J.C. Leprêtre, F. Alloin, and J.Y. Sanchez. Poly(vinylidene
fluoride)-based macroporous separators for supercapacitors. Electrochimica
Acta, 2011. 57(0): p. 98-103.
8. Bard, A.J. and L.R. Faulkner. Electrochemical Methods: Fundamentals and
Applications. 2000, New York; Chichester: John Wiley.
9. Chen, X., S. Xu, N. Yao, and Y. Shi. 1.6 V Nanogenerator for Mechanical
Energy Harvesting Using PZT Nanofibers. Nano Letters, 2010. 10(6): p. 2133-
2137.

3 - Porous membranes of NaY/P(VDF-TrFE)
This chapter is based on the following publication:
Nunes-Pereira, J., A.C. Lopes, C.M. Costa, L.C. Rodrigues, M.M. Silva, and S.
Lanceros-Méndez. Microporous membranes of NaY zeolite/poly(vinylidene fluoride–
trifluoroethylene) for Li-ion battery separators. Journal of Electroanalytical Chemistry,
2013. 689: p. 223-232.


3 – POROUS MEMBRANES OF NaY/P(VDF-TrFE)
29
3.1. Introduction
The increasing use of handheld devices has driven the technological advances in
rechargeable solid-state batteries. Lithium-ion batteries are the systems of choice,
offering high energy density, flexible and lightweight design and longer lifespan than
comparable battery technologies [1].
The lithium battery industry is rapidly expanding and already represents the
largest segment of the industry of portable batteries for computers, cell phones and
cameras. However these batteries still have some aspects to improve [2], in particular
related to the high reactivity of the lithium with the components of the electrolyte. One
solution to this problem could be the use of polymer electrolytes. Primary lithium
batteries are now stated as a mature technology, future major developments must
be focused on secondary cells [3].
A battery is a transducer that converts chemical energy into electrical energy. The
principal constituents are the anode, cathode and separator membrane (SPE). In the case
of lithium batteries the anode is the source of lithium ions, the cathode is the sink for the
lithium ions and the electrolyte provides the separation for ionic and electronic transport
[2]. Generally, the solid polymer electrolyte (SPE) is a porous membrane placed
between the electrodes of opposite polarity, permeable to ionic flow but preventing
electric contact of electrodes. It play a key role in all batteries, keeping the positive and
negative electrodes separated, avoiding short circuits and allowing rapid transport of
ionic charge carriers [4-5]. The main parameters determining the performance of SPE
are thickness, permeability, porosity/pore size, wettability, electrolyte absorption and
retention, chemical, dimensional and thermal stability [4, 6]. For the SPE, the lithium
salt is placed in the membrane through incorporation of an electrolyte solution or
directly in the membrane in the form of composite [7-8]. The most used polymer
matrixes for SPE applications are poly(ethylene oxide) (PEO) [9-12], poly(acrylonitrile)
(PAN) [13-14], poly(vinylidene fluoride) (PVDF) and its copolymers [15-18].
PVDF and its copolymer poly(vinylidene fluoride-co-trifluoroethylene) P(VDF-
TrFE) are used for SPE due to their good mechanical properties, wettability by organic
solvents, chemically inertness, good contact between electrode and electrolyte and being
stable in cathodic environment [18-19]. The main difference between P(VDF-TrFE) and
PVDF is that the copolymer exhibit the ferroelectric to paraelectric transition (FE-PE) at

3 – POROUS MEMBRANES OF NaY/P(VDF-TrFE)
30
a Curie temperature (Tc) below melting temperature (Tm), and crystallizes both from the
melt or by solution casting in a polar ferroelectric transplanar chain configuration [20-
22]. P(VDF-TrFE) membranes for lithium ion battery have been prepared by different
processing techniques. The porous membranes were produced by solvent casting with
varying porosity in which lithium ions were introduced by uptake; composite separators
were also prepared with the lithium salts introduced within the polymer matrix [18, 23-
24]. The results showed that the ionic conductivity of the membrane depends on the
porosity and the pore size, which is related to the ability to uptake. Large advances in
SPE technologies are produced by the incorporation of suitable fillers into the host
polymer for improving mechanical strength, thermal stability and ionic conductivities
[25-26]. Among these fillers are oxide ceramic, zeolites, carbon nanotubes, etc. [26].
Zeolites are hydrated aluminosilicates with a crystalline structure where SiO44-
and AlO45-
tetrahedral units are linked by common oxygen atoms, forming channels and
cavities with regular dimensions. For each AlO45-
unit present a framework of negative
charge is created that can be balanced by protons or metal cations [27-28]. The presence
of these exchangeable cations makes zeolite to have a high electric conductivity when
compared with other ionic crystalline solids [29].
Due to their properties, zeolite fillers are used in composite materials for
application as fuel cells and lithium-ion batteries [30-33]. Porous membranes with
zeolite nanofillers are suitable for high-performance lithium-ion batteries as they can
provide composites with higher ionic conductivity with respect to the pure polymers
and also provide mechanical strength [30].
Due to the promising results of P(VDF-TrFE) separators for battery applications,
the main goal of this work consist on the preparation of polar zeolite/P(VDF-TrFE)
porous membranes by solvent evaporation with different contents of zeolite
nanoparticles for improving electrical and mechanical properties. In this study the Y
zeolite (faujasite structure) on the sodium form (NaY) has been used, with a Si/Al ratio
of 2.83 as it has been proven to provide increased dielectric constant and conductivity to
poly(vinylidene fluoride) thin films [34].
The influence of the zeolite content in the performance of the battery separator
membranes, with and without electrolyte solution (1 M LiClO4.3H2O-PC), was
evaluated through the study of the morphological, thermal, mechanical and electrical
properties.

3 – POROUS MEMBRANES OF NaY/P(VDF-TrFE)
31
3.2. Results and Discussion
3.2.1. Microstructural characteristics and polymer phase
Figure 3.1 shows a cross-section scanning electron microscopy (SEM) images of
the NaY/P(VDF-TrFE) composites with different zeolites contents.
Figure 3.1: Cross-section SEM images of the NaY/P(VDF-TrFE) composites with different zeolite contents: a) 0 % (P(VDF-TrFE)); b) 4 %; c) 16 %; d) 32 %.
The samples are characterized by a uniform distribution of micropores,
independently of the zeolite content. Therefore, the microstructure is independent of the
zeolite content and similar to the one obtained for the pure copolymer [18]. The
mechanism of polymer/solvent evaporation for P(VDF-TrFE)/DMF without fillers does
not seems to be affected by the presence of the zeolite fillers, and it is explained as a
liquid/liquid spinodal decomposition followed by polymer crystallization, depending
mainly on the evaporation rate of the solvent and the crystallization temperature [35-
36]. Due to their porous structure, the zeolite particles absorb solvent during sample
preparation, shifting to the solvent-rich areas during the liquid-liquid phase separation.
In this way, zeolites are not incorporated into the polymer microstructure during
crystallization, remaining decorating the internal walls of the polymer pores for all
zeolites contents (detail in figure 3.1c).

3 – POROUS MEMBRANES OF NaY/P(VDF-TrFE)
32
Thus, was observed that the inclusion of zeolites does not affect the pore
distribution of the membrane but can modify the average pore size.
Figure 3.2 shows the dependence of the average pore size, porosity and electrolyte
uptake of NaY/P(VDF-TrFE) membranes with different zeolite contents.
0 4 8 12 16 20 24 28 320
10
20
30
40a)
Average pore size
Ave
rag
e p
ore
siz
e (m
)
NaY content (%)
30
40
50
60
70 Porosity
Po
rosity (
%)
0 4 8 12 16 20 24 28 32 360
50
100
150
200
250 b)
Up
take
(%
)
NaY content (%)
Figure 3.2: a) Influence of the zeolite content in the mean diameter of pores and porosity in the NaY/P(VDF-TrFE) composites and b) 1 M LiClO4.3H2O-PC solution uptake as a function of zeolite content for the NaY/P(VDF-TrFE) composites.
It is shown that the pore size increases three times and the porosity decreases by
introducing zeolites in the membranes due to modification in the phase separation and
solvent evaporation kinetics [35-36]. Similar behaviour was observed for PEO-PVDF-
HFP-Al2O3/PP [37]. On the other hand, increasing NaY content reduces pore size due to
filler accumulation on the pore walls. Only for the sample with 32 wt% zeolite content
the porosity increases. In this case, the porosity due to the higher amounts of zeolite
cavities counteracts the decrease of the porosity of the polymer due to the zeolite
placement on the sidewalls of pores. Regarding the electrolyte uptake, the combination
of increased pore size and decreasing porosity for filled samples, compared to pristine
polymer, leads to similar uptake except for the 32 wt% zeolite content sample, in which
the large amount of zeolites on sidewalls of the pores reduces electrolyte uptake. This
fact is attributed to the considerable contribution of zeolite cavities to the porosity,
being these pores not able to absorb Li salts In this way, the filler concentration of 32
wt% sets the limit for improved performance for the NaY/P(VDF-TrFE) composites for
Li-ion battery applications.
The large degree of porosity associated to the electrolyte uptake facilitates the
transfer of lithium ions because increases the number of transport channels [38].

3 – POROUS MEMBRANES OF NaY/P(VDF-TrFE)
33
For electroactive polymers of PVDF and copolymer it is possible to determine the
polymer crystalline phase accurately, both through X-ray diffraction (XRD) and Fourier
transformed infrared spectroscopy (FTIR) [39]. PVDF-TrFE at this co-polymer
concentration always crystallizes in the polar phase. In this case, FTIR was also used for
to evaluate the interactions between polymer matrix and zeolites, as well as the effect of
electrolyte solution introduction in membrane structure (figure 3.3).
750 1000 1250 1500
a) NaYPolymer32 %
16 %
4 %
0 %
Tra
nsm
itta
nce
(a
.u.)
Wavenumber (cm-1)
750 1000 1250 1500
b) LiClO4
PolymerPC
Tra
nsm
itta
nce
(a
.u.)
Wavenumber (cm-1)
32 %
16 %
4 %
0 %
Figure 3.3: FTIR spectra for NaY/P(VDF-TrFE) composites for different zeolite contents: a) without electrolyte solution uptake; b) with electrolyte solution uptake.
Figure 3.3a shows the FTIR spectra for the samples without electrolyte solution
uptake, and the characteristic vibration modes (851 cm−1
, 886 cm−1
and 1402 cm−1
) of
the polymer all-trans conformation [40] are observed for all zeolite contents. The band
increasing with increasing zeolite content around 900-1100 cm-1
corresponds to the
stretching vibration of the Si-O bond in the SiO4 tetrahedrons and reflects the presence
the zeolites in the membranes [41]. For the membrane with 32 wt% zeolite content, the
characteristic bands of the zeolite superimpose the polymer ones.
Regarding vibration modes of samples with electrolyte solution (figure 3.3 b), the
two strong bands related to the presence of propylene carbonate (712 cm−1
and 777
cm−1
), as well as the two vibration modes at 933 cm−1
and 1150 cm−1
, identified by
symmetric stretching band and asymmetric bending band, respectively of ClO4- [42],
are detected. Further, the characteristic bands of the polymer and zeolites are unaffected
by the presence of electrolyte, maintaining the membrane physico-chemical
characteristics.

3 – POROUS MEMBRANES OF NaY/P(VDF-TrFE)
34
Table 3.1 presents the room temperature ionic conductivity (equation 2.5) and
tortuosity (equation 2.6) for all samples after electrolyte uptake.
Table 3.1: Ionic conductivity and tortuosity of 1 M LiClO4.3H2O + separator membrane; σ0 = 9.8 mS/cm at 25 ºC.
Sample σi (S/cm) τ
0 % 5.24×10⁻⁷ 115
4 % 3.54×10⁻⁷ 113
16 % 2.33×10⁻⁶ 39
32 % 2.87×10⁻⁶ 43
The ionic conductivity of porous membranes increases with increasing zeolite
content due to the large surface area of the zeolites, that reduces the growth rate of the
resistive layer on the electrode surface and aids to trap residual traces of impurities,
such as water and oxygen, leading to an improvement of the compatibility between
membranes and the electrodes, resulting in increased ionic conductivity [43-44].
The tortuosity describes the average pore connectivity of the solid and is related
with the ionic transport, providing information about the effect of the pore blockage.
The tortuosity decreases with increasing zeolite content until the filler concentration of
32 wt%. The membranes without zeolites and the one with 4 wt% show high tortuosity
values due to poor pore connectivity which hinders the ionic transport. For higher
zeolite contents the tortuosity decreases as the ionic transport is now supported by the
higher conductivity of the zeolite fillers in the sidewalls of the pores, leading to better
pore connectivity [45].
3.2.2. Thermal and mechanical properties
The characterization of the porous membrane by thermal (differential scanning
calorimetry measurements – DSC) and mechanical (stress-strain curves) techniques is
crucial to evaluate the performance of membranes for battery applications and to
determine the influence of zeolite content in the polymeric matrix.

3 – POROUS MEMBRANES OF NaY/P(VDF-TrFE)
35
DSC thermograms for NaY/P(VDF-TrFE) membranes without and with
electrolyte solution are depicted in figures 3.4 a) and b), respectively.
80 100 120 140 160 180 200
Tc
Tma)
1 (
W/g
)
.
4 %
16 %
32 %
0%
Q (
W/g
)
Temperature (ºC)
en
do
80 100 120 140 160 180 200
b)
2 (
W/g
)
.
32 %
0 %
16 %
4 %
Q (
W/g
)
Temperature (ºC)
en
do
Figure 3.4: DSC thermograms of the NaY/P(VDF-TrFE) composites with different zeolite filler contents: a) without electrolyte solution uptake; b) with electrolyte solution uptake.
In DSC thermograms for NaY/P(VDF-TrFE) membranes without electrolyte
solution (figure 3.4a) two endothermic peaks are observed, representing the
ferroelectric-paraelectric phase transition (lower temperature peak, Tc) at 117 ºC and
melting temperature of the polymer matrix (higher temperature peak, Tm) at 146 ºC
[46]. These peaks does not depend on zeolite content present in the polymeric matrix,
indicating that fillers inclusion does not significantly influence the polymer ferroelectric
phase, degree of crystallinity and thermal stability, because fillers are mainly placed on
the outside walls of the polymer.
This fact is demonstrated in table 3.2 where the degree of crystallinity, calculated
by equation 2.1, is shown for NaY/P(VDF-TrFE) membranes without electrolyte
solution uptake.
Table 3.2: Degree of Crystallinity of all samples calculated through equation 2.1 to the melting peak of samples without electrolyte solution uptake.
Sample χc ± 2 (%)
0 % 28
4 % 26
16 % 23
32 % 20
The degree of crystallinity shows a small decrease by increasing filler content,
due to the defective induced crystallization in the polymer structure in the places where

3 – POROUS MEMBRANES OF NaY/P(VDF-TrFE)
36
it interacts with the zeolites. Nucleation and growth kinetics of the polymer is changed
due to the large zeolite contents (above 4 wt%) [47].
In the DSC thermograms for samples with electrolyte solution (figure 3.4b) the
two endothermic peaks characteristics of the polymeric matrix are not detected for all
filler contents due to the high absorption of the electrolyte solution by the composite
membranes. It is reported that the PC present in the electrolyte solution leads to the
collapse of some crystallites of P(VDF-TrFE), increasing the amorphous content within
the polymer matrix [48]. Nevertheless, membranes stability is demonstrated up to the
ferroelectric-paraelectric phase transition temperature, around 120 ºC, in which the
polarity and electrical characteristics of the membrane changes.
The mechanical properties of the separator membranes for lithium ion batteries
are essential for performance, integrity and safety of the batteries [49-50]. The
mechanical properties of porous materials depend on porosity, pore size, distribution
and geometry [51], and represent one of the main drawbacks of polymer porous
membranes that can be solved by suitable selection of reinforcing fillers.
The stress-strain curves of NaY/P(VDF-TrFE) composites with different zeolite
nanoparticle contents are represented in figure 3.5 without electrolyte solution (figure
3.5a) and with electrolyte solution (figure 3.5b). In table 3.3 the mechanical parameters
(elastic modulus, stress at break and strain at break) obtained from figure 3.5 are shown.
0 100 200 300 400 500
0.0
0.5
1.0
1.5
2.0
2.5
3.0
3.5
4.0a)
Str
ess (
MP
a)
Strain (%)
0%
4%
16%
32%
0 100 200 300 400 500
0.0
0.4
0.8
1.2
1.6
2.0
2.4 b)
Str
ess (
MP
a)
Strain (%)
0%
4%
16%
32%
Figure 3.5: Stress-Strain curves of the NaY/P(VDF-TrFE) composites with different zeolite particles contents: a) without electrolyte solution uptake; b) with electrolyte solution uptake.

3 – POROUS MEMBRANES OF NaY/P(VDF-TrFE)
37
Table 3.3: Mechanical properties of the composite membranes.
Without Uptake With Uptake Sample 0 % 4 % 16 % 32 % 0 % 4 % 16 % 32 % Stretching strain at break (%) 455 293 299 383 392 326 455 426 Stress at break (MPa) 3.5 3.1 2.7 2.7 1.2 1 1.55 2.3 Elastic Modulus (MPa) 40 51 62 76 1.9 1.4 1.7 3.8
Figure 3.5a shows that addition of zeolites up to 4 wt% improves the mechanical
properties (yielding stress) of the membrane separator in comparison with zeolites free
membranes. This phenomenon is attributed to the Lewis acid-base interactions between
the polymer matrix and the Lewis acid sites on the surface of the zeolite particles [52].
For zeolite contents above 4 wt%, the mechanical stress at yielding of the
membranes decreases due to aggregate formation at the membrane surface.
The elastic modulus (table 3.3) increases with increasing filler content, indicating
the reinforcing effect of the zeolites. This behaviour can be explained by a folding effect
of the polymer chains within the zeolite particles at the filler-polymer contact points.
The mechanical properties (elastic modulus, stress at break and strain at break) of the
samples with electrolyte solution decrease, compared to the ones without electrolyte,
due to large uptakes. The effect of electrolyte uptake in the mechanical properties is
similar for all zeolite concentrations, nevertheless, the elastic modulus and the
stretching at break are higher for samples with larger zeolite content. It is interesting to
observe that the stress-strain curves with electrolyte solution have the form of steps
resulting from the collapse of the pores in membrane structure.

3 – POROUS MEMBRANES OF NaY/P(VDF-TrFE)
38
The determination of the mechanical properties as function of temperature is
crucial to set limits of applicability of the porous membranes to different environments.
Figure 3.6 shows the mechanical behaviour of the NaY/P(VDF-TrFE) composites for
16% wt at different temperatures.
0 100 200 300 400
0.0
0.5
1.0
1.5
2.0
2.5
3.0
S
tre
ss (
MP
a)
Strain (%)
T=25 ºC
T=50 ºC
T=100 ºC
Figure 3.6: Stress-Strain curves of the NaY/P(VDF-TrFE) composites for 16 wt% at different temperatures.
The mechanical response (figure 3.6) determined through the different parameters
(elastic modulus, stress at break and strain at break) decreases with increasing
temperature.
Increasing temperature induces larger polymer chain mobility within the
crystalline and amorphous phases, particularly at temperatures higher than the c-
relaxation temperature of the polymer around 60 ºC, resulting in the decrease of
mechanical properties [53]. This behaviour was observed for all samples independently
of the zeolite content.
3.2.3. Electrical properties
The electrochemical properties of all samples with and without electrolyte
solution were determined by electrochemical impedance spectroscopy (EIS) and are
represented through Nyquist plots (imaginary impedance Z’’ versus real impedance Z’),
Bode plots (absolute impedance |Z| and phase angle versus frequency) and ionic
conductivity versus temperature. For all samples with electrolyte solution the Nyquist

3 – POROUS MEMBRANES OF NaY/P(VDF-TrFE)
39
plots at 50 ºC are presented in figure 3.7a) and the Bode diagram in figure 3.7b) and c).
Figure 3.7d shows the impedance modulus as a function of zeolite content for the
different samples at different temperatures and at a frequency of 1 kHz.
0 500 1000 1500 2000 2500 3000
0
500
1000
1500
2000
2500
3000
3500a)
-Z''
(
)
Z' ()
0 %
4 %
16 %
32 %
100
101
102
103
104
105
0
1000
2000
3000
4000
5000
6000
7000
8000
9000b)
|Z| (
)Frequency (Hz)
0 %
4 %
16 %
32 %
100
101
102
103
104
105
0
-10
-20
-30
-40
-50
-60
-70 c)
Ph
ase
an
gle
(d
eg
)
Frequency (Hz)
0 %
4 %
16 %
32 %
0 4 8 12 16 20 24 28 32
20
40
60
80
100
120
140
160 d)
|Z| (
)
NaY contents (%)
T=24 ºC
T=50 ºC
T=100 ºC
Figure 3.7: a) Nyquist plot of the NaY/P(VDF-TrFE) composites for all filler contents at 50 ºC; b-c) Bode diagram of the NaY/P(VDF-TrFE) composites for all contents at 50 ºC and d) impedance modulus as a function of zeolite content at different temperatures.
Usually, Nyquist plot is characterized by three distinct parts: a semicircle located
at the high-frequency range that corresponds to the charge transfer process, a straight
line for lower frequency related to the diffusion process and the transition between these
phenomena [54-55].
In figure 3.7a, the semi-circle at higher frequencies is observed for the pristine
polymer membrane. This semicircle is not clearly identified in the composite
membranes as the inclusion of zeolites improves the charge transfer process. The larger
pore size and the high value of the tortuosity can be the reasons for the high value of the
Nyquist curve in the membrane with 4 wt% of zeolites.

3 – POROUS MEMBRANES OF NaY/P(VDF-TrFE)
40
The impedance modulus as a function of frequency for all samples at 50 ºC is
represented in figure 3.7b. For all membranes, the impedance modulus decreases with
increasing frequency, being this decrease more significant for lower frequencies up to 1
kHz. This behaviour indicates the restricted dynamics of ion mobility within the porous
membranes.
The phase angle as function of frequency for all membranes at 50 ºC is shown in
figure 3.7c. The maximum phase angle occurs at -70 º, independently of the zeolite
content. For an ideal resistor and capacitor in series, the maximum phase angle should
be -90 º. In this case, as the maximum phase angle is lower than -90 º, the behaviour is
better represented by a constant phase element (CPE) [56], which can be modelled as a
capacitor with a distribution of relaxation times [57-58].
The influence of zeolites in the electric conduction behaviour is due to their
intrinsic conductivity and to their effect in the polymer matrix. With respect the later,
zeolite fillers show strong Lewis acid centres in their frameworks and inside the
channels, which contribute to the reduction of the crystallinity of the polymer host, thus
resulting in a higher conductivity and Li+ transference number. The conductivity
behaviour in the separator membrane is also influenced by the zeolite contents; for
small contents of zeolites, and despite the higher diameter of zeolite cavity (13 Ǻ)
compared to lithium ions, the uptake occurs mainly in the polymer matrix. Further, the
zeolite content is not enough to establish channels networks of conduction. For higher
zeolite contents, the channel conduction networks are created, resulting in an increase of
porous membrane ionic conductivity.
Figure 3.7d shows the impedance modulus as a function of zeolite content at
different temperatures at 1 kHz. For all membranes, the impedance modulus decreases
with increasing temperature due to the release of trapped ionic charges followed by their
accumulation in the polymer matrix and in the interfaces between zeolites and polymer.
On the other hand, the zeolite filler increases the ac conductivity and is an evidence of
the Maxwell-Wagner-Sillars (MWS) contribution [59]. It has been shown that applying
a power law fit for 4 wt% composite the exponent number of Jonscher law is 1 [59].
Further, electrode polarization contributions are presented, for temperatures below
60 ºC, in the frequency region between 100 at 10
2 Hz.
Regardless the temperature, the impedance modulus increases with increasing
zeolite content up to 4 wt% and decreases for larger filler contents. This results from the

3 – POROUS MEMBRANES OF NaY/P(VDF-TrFE)
41
large pore size and still low zeolite content to create a conductivity network in the
4 wt% sample.
Figure 3.8 shows the temperature dependence of ionic conductivity of composite
all membranes without (figure 3.8a) and with (figure 3.8b) electrolyte solution uptake.
2.4 2.6 2.8 3.0 3.2 3.4
-11
-10
-9
-8a)
Lo
g
i (S
/cm
)
1000/T (K-1)
0 %
4 %
16 %
32 %
2.8 3.0 3.2 3.4
-6
-5
-4
b)
Lo
g
i (S
/cm
)
1000/T (K-1)
0 %
4 %
16 %
32 %
Figure 3.8: Log i as function of 1000/T for NaY/P(VDF-TrFE) composites a) without electrolyte solution uptake and b) with electrolyte solution uptake.
Regardless the electrolyte uptake, ionic conductivity increases with increasing
temperature, as the polymer tends to expand leading to higher free volume. Further,
polymer segmental and charge nobilities are also enhanced [60].
The inclusion of zeolites increases the ionic conductivity of the membrane, by
increasing pore size and by the zeolites two-dimensional interconnected channels. The
electrolyte solution absorbed in the zeolites structure may form a conducting pathway in
the porous membrane when its content is high enough, as shown in figure 3.8 [30, 52].
In the table 3.4 it is presented the activation energy, Ea, for ion transport for all samples
calculated from the Arrhenius equation (equation 2.7) applied to the data of figure 3.8.
Table 3.4: Activation energy for all porous membranes with and without electrolyte solution.
Samples Without electrolyte
solution (kJ/mol) With electrolyte solution (kJ/mol)
0 % 181 64
4 % 76 43
16 % 78 44
32 % 34 42
The activation energy values show dependence on filler content and electrolyte
solution uptake, which improves the mobility and ionic charge carriers in the porous

3 – POROUS MEMBRANES OF NaY/P(VDF-TrFE)
42
membranes [61]. Significant differences in the activation energy value are observed
between membranes with and without fillers, due to the charge and conductive
pathways introduced by zeolites particles. Increasing filler content decreases the ion
transport energy barrier, leading to a decrease in the activation energy [62]. The
electrochemical stability and the diffusion coefficient of the membranes were measured
by microelectrode cyclic voltammetry over the potential range -2.0 V to 6.0 V with
electrolyte solution (figure 3.9).
-2 0 2 4 6-1.0x10
-7
0.0
1.0x10⁻⁷
2.0x10⁻⁷
a)
I (A
)
E vs Li/Li+(V)
1 V/s
0.5 V/s
0.1 V/s
0.05 V/s
-2 0 2 4 6-1.0x10
-7
0.0
1.0x10⁻⁷
2.0x10⁻⁷
b)
E vs Li/Li+(V)
0 %
4 %
16 %
32 %
I (A
)
Figure 3.9: a) Voltammograms of NaY/P(VDF-TrFE) with 16 wt% of zeolites at different scanning rates and b) voltammograms of NaY/P(VDF-TrFE) composites at 0.5 V/s.
The voltammogram of the membrane with 16 wt% of zeolite (figure 3.9a) exhibits
good electrochemical stability independently of scanning rate, with anodic potentials
higher than 5.5 V versus Li/Li+ and oxidation peak around 1.0 V. The anodic current
onset may be associated with the decomposition of the polymer electrolyte. Increasing
potential sweeping rate shifts the cathodic peak potential in the negative direction. The
small peak around 1.0 V has been ascribed to reduction of water present in PE or
oxygen impurities. Similar behaviour has been observed for other systems based on
PEO and lithium salt [63].
For the same scanning rate (0.5 V/s) multiples anodic potentials higher than 4 V
were obtained for high zeolite contents, the oxidation peak also depending on the zeolite
content present in the polymeric matrix.

3 – POROUS MEMBRANES OF NaY/P(VDF-TrFE)
43
The diffusion coefficients calculated by equation 2.8 for all porous membranes are
shown in table 3.5. The diffusion coefficient of PVDF is 1.98×10⁻⁶
cm2/s.
Table 3.5: Diffusion coefficient calculated by equation 2.8 for all porous membranes with electrolyte solution.
Samples Diffusion coefficient (cm2/s)
0 % 3.45×10⁻⁵
4 % 2.58×10⁻⁵
16 % 4.09×10⁻⁵
32 % 3.29×10⁻⁵
The diffusion coefficient does not show strong dependence on zeolite content,
presenting the maximum value of 4.09×10⁻⁵ cm2/s for membrane with 16 wt% of
zeolites. The diffusion coefficient of the copolymer is higher than the one of PVDF,
due to copolymerization with TrFE.
3.3. Conclusion
NaY zeolite/PVDF-TrFE porous membranes with different zeolite contents were
prepared for lithium ion battery applications by thermally induced phase separation
(TIPS). The electrolyte solution was 1 M LiClO4.3H2O-PC. The zeolite inclusion
changes the pore size, porosity and uptake of membranes. The polymer phase is not
affected by the inclusion of the zeolites. The tortuosity decreases with increasing zeolite
content, indicating that ionic transport is now supported by a better pore connectivity.
The membranes are thermally stable above 100 ºC and the inclusion of fillers improves
the mechanical strength of the membranes.
The ionic conductivity is influenced by the filler content and a maximum value
2.33×10⁻⁶
S/cm is obtained at room temperature for the P(VDF-TrFE) membrane with
16 wt% zeolite content. The zeolite particles form a conducting pathway in the
polymeric matrix for high zeolite contents, improving the ionic conductivity. The
overall stability of the porous membrane, determined by cyclic voltammetry, is
appropriate for the intended applications with no electrochemical oxidation occurring at
potentials lower than 3.0 V. These results shows that the NaY/P(VDF-TrFE) porous

3 – POROUS MEMBRANES OF NaY/P(VDF-TrFE)
44
membranes have adequate electrochemical stability, thermal, mechanical and electrical
properties for being used as battery separators in lithium ion batteries.

3 – POROUS MEMBRANES OF NaY/P(VDF-TrFE)
45
3.4. References
1. Tarascon, J.M. and M. Armand. Issues and challenges facing rechargeable
lithium batteries. Nature, 2001. 414(6861): p. 359-367.
2. Whittingham, M.S. Lithium Batteries and Cathode Materials. Chemical
Reviews, 2004. 104(10): p. 4271-4302.
3. Vincent, C.A. Lithium batteries: a 50-year perspective, 1959–2009. Solid State
Ionics, 2000. 134(1–2): p. 159-167.
4. Arora, P. and Z. Zhang. Battery Separators. Chemical Reviews, 2004. 104(10):
p. 4419-4462.
5. Besenhard, J.O. Handbook of battery materials. 1999, Weinheim; New York:
Wiley-VCH.
6. Xu, K. Nonaqueous Liquid Electrolytes for Lithium-Based Rechargeable
Batteries. Chemical Reviews, 2004. 104(10): p. 4303-4418.
7. Manuel Stephan, A. Review on gel polymer electrolytes for lithium batteries.
European Polymer Journal, 2006. 42(1): p. 21-42.
8. Barbosa, P.C., M.M. Silva, M.J. Smith, A. Gonçalves, and E. Fortunato. Studies
of solid-state electrochromic devices based on PEO/siliceous hybrids doped with
lithium perchlorate. Electrochimica Acta, 2007. 52(8): p. 2938-2943.
9. Persi, L., F. Croce, B. Scrosati, E. Plichta, and M.A. Hendrickson. Poly(ethylene
oxide)-Based, Nanocomposite Electrolytes as Improved Separators for
Rechargeable Lithium Polymer Batteries. Journal of The Electrochemical
Society, 2002. 149(2): p. A212-A216.
10. Kim, D.-W., J.-M. Ko, J.-H. Chun, S.-H. Kim, and J.-K. Park. Electrochemical
performances of lithium-ion cells prepared with polyethylene oxide-coated
separators. Electrochemistry Communications, 2001. 3(10): p. 535-538.
11. Wang, C., Y. Wei, G.R. Ferment, W. Li, and T. Li. Poly(ethylene oxide)–silica
hybrid materials for lithium battery application. Materials Letters, 1999. 39(4):
p. 206-210.
12. Li, H., X.-T. Ma, J.-L. Shi, Z.-K. Yao, B.-K. Zhu, and L.-P. Zhu. Preparation
and properties of poly(ethylene oxide) gel filled polypropylene separators and
their corresponding gel polymer electrolytes for Li-ion batteries. Electrochimica
Acta, 2011. 56(6): p. 2641-2647.
13. Cho, T.H., T. Sakai, S. Tanase, K. Kimura, Y. Kondo, T. Tarao, and M. Tanaka.
Electrochemical Performances of Polyacrylonitrile Nanofiber-Based Nonwoven
Separator for Lithium-Ion Battery. Electrochemical and Solid-State Letters,
2007. 10(7): p. A159-A162.

3 – POROUS MEMBRANES OF NaY/P(VDF-TrFE)
46
14. Huai, Y., J. Gao, Z. Deng, and J. Suo. Preparation and characterization of a
special structural poly(acrylonitrile)-based microporous membrane for lithium-
ion batteries. Ionics, 2010. 16(7): p. 603-611.
15. Cheng, C.L., C.C. Wan, and Y.Y. Wang. Preparation of porous, chemically
cross-linked, PVdF-based gel polymer electrolytes for rechargeable lithium
batteries. Journal of Power Sources, 2004. 134(2): p. 202-210.
16. Wachtler, M., D. Ostrovskii, P. Jacobsson, and B. Scrosati. A study on PVdF-
based SiO2-containing composite gel-type polymer electrolytes for lithium
batteries. Electrochimica Acta, 2004. 50(2–3): p. 357-361.
17. Stephan, A.M., K.S. Nahm, M. Anbu Kulandainathan, G. Ravi, and J. Wilson.
Poly(vinylidene fluoride-hexafluoropropylene) (PVdF-HFP) based composite
electrolytes for lithium batteries. European Polymer Journal, 2006. 42(8): p.
1728-1734.
18. Costa, C.M., L.C. Rodrigues, V. Sencadas, M.M. Silva, J.G. Rocha, and S.
Lanceros-Méndez. Effect of degree of porosity on the properties of
poly(vinylidene fluoride–trifluorethylene) for Li-ion battery separators. Journal
of Membrane Science, 2012. 407–408(0): p. 193-201.
19. Djian, D., F. Alloin, S. Martinet, and H. Lignier. Macroporous poly(vinylidene
fluoride) membrane as a separator for lithium-ion batteries with high charge
rate capacity. Journal of Power Sources, 2009. 187(2): p. 575-580.
20. Nalwa, H.S. Ferroelectric polymers : chemistry, physics, and applications.
1995, New York: Dekker.
21. Lovinger, A.J., T. Furukawa, G.T. Davis, and M.G. Broadhurst.
Crystallographic changes characterizing the Curie transition in three
ferroelectric copolymers of vinylidene fluoride and trifluoroethylene: 2.
Oriented or poled samples. Polymer, 1983. 24(10): p. 1233-1239.
22. Furukawa, T., G.E. Johnson, H.E. Bair, Y. Tajitsu, A. Chiba, and E. Fukada.
Ferroelectric phase transition in a copolymer of vinylidene fluoride and
trifluoroethylene. Ferroelectrics, 1981. 32(1): p. 61-67.
23. Costa, C.M., A. California, V.F. Cardoso, V. Sencadas, L.C. Rodrigues, M.M.
Silva, and S. Lanceros-Méndez. Electroactive Poly(Vinylidene Fluoride-
Trifluorethylene) (PVDF-TrFE) Microporous Membranes for Lithium-Ion
Battery Applications. Ferroelectrics, 2012. 430(1): p. 103-107.
24. Costa, C.M., L.C. Rodrigues, V. Sencadas, M.M. Silva, and S. Lanceros-
Méndez. Effect of the microsctructure and lithium-ion content in
poly[(vinylidene fluoride)-co-trifluoroethylene]/lithium perchlorate trihydrate
composite membranes for battery applications. Solid State Ionics, 2012. 217(0):
p. 19-26.

3 – POROUS MEMBRANES OF NaY/P(VDF-TrFE)
47
25. Weston, J.E. and B.C.H. Steele. Effects of inert fillers on the mechanical and
electrochemical properties of lithium salt-poly(ethylene oxide) polymer
electrolytes. Solid State Ionics, 1982. 7(1): p. 75-79.
26. Srun Jung, Dae Won Kim, Sang Deuk Lee, Minserk Cheong, Dinh Quan
Nguyen, Byung Won Cho, and H.S. Kim. Fillers for Solid-State Polymer
Electrolytes: Highlight. Bull. Korean Chem. Soc, 2009. 30(10).
27. Martínez, C. and A. Corma. Inorganic molecular sieves: Preparation,
modification and industrial application in catalytic processes. Coordination
Chemistry Reviews, 2011. 255(13–14): p. 1558-1580.
28. Hersh, C.K. Molecular sieves. 1961, New York: Reinhold Publishing
Corporation.
29. Abdoulaye, A., J.V. Zanchetta, F. Di Renzo, J.C. Giuntini, J. Vanderschueren,
and G. Chabanis. Dielectric properties of faujasites: comparison between types
X and Y during dehydration. Microporous and Mesoporous Materials, 2000.
34(3): p. 317-325.
30. Xi, J., X. Qiu, and L. Chen. PVDF–PEO/ZSM-5 based composite microporous
polymer electrolyte with novel pore configuration and ionic conductivity. Solid
State Ionics, 2006. 177(7–8): p. 709-713.
31. Piao, J., S. Liao, and Z. Liang. A novel cesium hydrogen sulfate–zeolite
inorganic composite electrolyte membrane for polymer electrolyte membrane
fuel cell application. Journal of Power Sources, 2009. 193(2): p. 483-487.
32. Wang, J., X. Zheng, H. Wu, B. Zheng, Z. Jiang, X. Hao, and B. Wang. Effect of
zeolites on chitosan/zeolite hybrid membranes for direct methanol fuel cell.
Journal of Power Sources, 2008. 178(1): p. 9-19.
33. Sancho, T., J. Soler, and M.P. Pina. Conductivity in zeolite–polymer composite
membranes for PEMFCs. Journal of Power Sources, 2007. 169(1): p. 92-97.
34. Lopes, A.C., R. Gonçalves, C.M. Costa, A.M. Fonseca, G. Botelho, I.C. Neves,
and S. Lanceros-Mendez. Effect of Zeolite Content in the Electrical, Mechanical
and Thermal Degradation Response of Poly(vinylidene fluoride)/NaY Zeolite
Composites. Journal of Nanoscience and Nanotechnology, 2012. 12(8): p. 6804-
6810.
35. California, A., V.F. Cardoso, C.M. Costa, V. Sencadas, G. Botelho, J.L. Gómez-
Ribelles, and S. Lanceros-Mendez. Tailoring porous structure of ferroelectric
poly(vinylidene fluoride-trifluoroethylene) by controlling solvent/polymer ratio
and solvent evaporation rate. European Polymer Journal, 2011. 47(12): p. 2442-
2450.
36. Ferreira, A., J. Silva, V. Sencadas, J.L.G. Ribelles, and S. Lanceros-Méndez.
Poly[(vinylidene fluoride)-co-trifluoroethylene] Membranes Obtained by

3 – POROUS MEMBRANES OF NaY/P(VDF-TrFE)
48
Isothermal Crystallization from Solution. Macromolecular Materials and
Engineering, 2010. 295(6): p. 523-528.
37. Liao, Y.H., X.P. Li, C.H. Fu, R. Xu, L. Zhou, C.L. Tan, S.J. Hu, and W.S. Li.
Polypropylene-supported and nano-Al2O3 doped poly(ethylene oxide)–
poly(vinylidene fluoride-hexafluoropropylene)-based gel electrolyte for lithium
ion batteries. Journal of Power Sources, 2011. 196(4): p. 2115-2121.
38. Zhang, P., H.P. Zhang, G.C. Li, Z.H. Li, and Y.P. Wu. A novel process to
prepare porous membranes comprising SnO2 nanoparticles and P(MMA-AN) as
polymer electrolyte. Electrochemistry Communications, 2008. 10(7): p. 1052-
1055.
39. Lanceros-Méndez, S., J.F. Mano, A.M. Costa, and V.H. Schmidt. FTIR AND
DSC STUDIES OF MECHANICALLY DEFORMED β-PVDF FILMS. Journal of
Macromolecular Science, Part B, 2001. 40(3-4): p. 517-527.
40. Prabu, A.A., J.S. Lee, K.J. Kim, and H.S. Lee. Infrared spectroscopic studies on
crystallization and Curie transition behavior of ultrathin films of P(VDF/TrFE)
(72/28). Vibrational Spectroscopy, 2006. 41(1): p. 1-13.
41. Shikunov, B.I., L.I. Lafer, V.I. Yakerson, I.V. Mishin, and A.M. Rubinshtein.
Infrared spectra of synthetic zeolites. Russian Chemical Bulletin, 1972. 21(1): p.
201-203.
42. Chen, Y., Y.-H. Zhang, and L.-J. Zhao. ATR-FTIR spectroscopic studies on
aqueous LiClO4, NaClO4, and Mg(ClO4)2 solutions. Physical Chemistry
Chemical Physics, 2004. 6(3): p. 537-542.
43. Gentili, V., S. Panero, P. Reale, and B. Scrosati. Composite gel-type polymer
electrolytes for advanced, rechargeable lithium batteries. Journal of Power
Sources, 2007. 170(1): p. 185-190.
44. Jiang, Y.-X., Z.-F. Chen, Q.-C. Zhuang, J.-M. Xu, Q.-F. Dong, L. Huang, and
S.-G. Sun. A novel composite microporous polymer electrolyte prepared with
molecule sieves for Li-ion batteries. Journal of Power Sources, 2006. 160(2): p.
1320-1328.
45. Quartarone, E., P. Mustarelli, and A. Magistris. Transport Properties of Porous
PVDF Membranes. The Journal of Physical Chemistry B, 2002. 106(42): p.
10828-10833.
46. Sencadas, V., S. Lanceros-Méndez, and J.F. Mano. Thermal characterization of
a vinylidene fluoride-trifluorethylene (75–25) (%mol) copolymer film. Journal of
Non-Crystalline Solids, 2006. 352(50–51): p. 5376-5381.
47. Costa, C.M., S. Firmino Mendes, V. Sencadas, A. Ferreira, R. Gregorio Jr, J.L.
Gómez Ribelles, and S. Lanceros-Méndez. Influence of processing parameters
on the polymer phase, microstructure and macroscopic properties of

3 – POROUS MEMBRANES OF NaY/P(VDF-TrFE)
49
poly(vinilidene fluoride)/Pb(Zr0.53Ti0.47)O3 composites. Journal of Non-
Crystalline Solids, 2010. 356(41–42): p. 2127-2133.
48. Tian, L.-y., X.-b. Huang, and X.-z. Tang. Study on morphology behavior of
PVDF-based electrolytes. Journal of Applied Polymer Science, 2004. 92(6): p.
3839-3842.
49. Tian, Z., X. He, W. Pu, C. Wan, and C. Jiang. Preparation of poly(acrylonitrile–
butyl acrylate) gel electrolyte for lithium-ion batteries. Electrochimica Acta,
2006. 52(2): p. 688-693.
50. Sheidaei, A., X. Xiao, X. Huang, and J. Hitt. Mechanical behavior of a battery
separator in electrolyte solutions. Journal of Power Sources, 2011. 196(20): p.
8728-8734.
51. Lu, G., G.Q. Lu, and Z.M. Xiao. Mechanical Properties of Porous Materials.
Journal of Porous Materials, 1999. 6(4): p. 359-368.
52. Xi, J., S. Miao, and X. Tang. Selective Transporting of Lithium Ion by Shape
Selective Molecular Sieves ZSM-5 in PEO-Based Composite Polymer
Electrolyte. Macromolecules, 2004. 37(23): p. 8592-8598.
53. Costa, C.M., V. Sencadas, I. Pelicano, F. Martins, J.G. Rocha, and S. Lanceros-
Mendez. Microscopic origin of the high-strain mechanical response of poled
and non-poled poly(vinylidene fluoride) in the β-phase. Journal of Non-
Crystalline Solids, 2008. 354(32): p. 3871-3876.
54. Chang, B.-Y. and S.-M. Park. Electrochemical Impedance Spectroscopy. Annual
Review of Analytical Chemistry, 2010. 3(1): p. 207-229.
55. Park, M., X. Zhang, M. Chung, G.B. Less, and A.M. Sastry. A review of
conduction phenomena in Li-ion batteries. Journal of Power Sources, 2010.
195(24): p. 7904-7929.
56. Zelinka, S.L., L. Ortiz-Candelaria, D.S. Stone, and D.R. Rammer.
Electrochemical impedance spectroscopy (EIS) as a tool for measuring
corrosion of polymer-coated fasteners used in treated wood. . Forest products
journal, 2009. 59(1-2): p. 77-82.
57. Cole, K. Dispersion and Absorption in Dielectrics I. Alternating Current
Characteristics. J. Chem. Phys., 1941. 9(4): p. 341.
58. Raistrick, I.D. Application of Impedance Spectroscopy to Materials Science.
Annual Review of Materials Science, 1986. 16(1): p. 343-370.
59. Lopes, A.C., C.M. Costa, R.S.i. Serra, I.C. Neves, J.L.G. Ribelles, and S.
Lanceros-Méndez. Dielectric relaxation, ac conductivity and electric modulus in
poly(vinylidene fluoride)/NaY zeolite composites. Solid State Ionics, 2013.
235(0): p. 42-50.

3 – POROUS MEMBRANES OF NaY/P(VDF-TrFE)
50
60. Karabelli, D., J.C. Leprêtre, F. Alloin, and J.Y. Sanchez. Poly(vinylidene
fluoride)-based macroporous separators for supercapacitors. Electrochimica
Acta, 2011. 57(1): p. 98-103.
61. Every, H.A., F. Zhou, M. Forsyth, and D.R. MacFarlane. Lithium ion mobility in
poly(vinyl alcohol) based polymer electrolytes as determined by 7Li NMR
spectroscopy. Electrochimica Acta, 1998. 43(10–11): p. 1465-1469.
62. Gray, F.M. Solid polymer electrolytes : fundamentals and technological
applications. 1991, New York, NY: VCH.
63. Aurbach, D., M. Daroux, P. Faguy, and E. Yeager. The electrochemistry of
noble metal electrodes in aprotic organic solvents containing lithium salts.
Journal of Electroanalytical Chemistry and Interfacial Electrochemistry, 1991.
297(1): p. 225-244.

4 - Porous membranes of MMT/P(VDF-TrFE)
This chapter is based on the following publication:
Nunes-Pereira, J., A.C. Lopes, C.M. Costa, R. Leones, M.M. Silva, and S. Lanceros-
Méndez. Porous Membranes of Montmorillonite/Poly(vinylidene fluoride-
trifluorethylene) for Li-Ion Battery Separators. Electroanalysis, 2012. 24(11):
p. 2147-156.


4 – POROUS MEMBRANES OF MMT/P(VDF-TrFE)
53
4.1. Introduction
The battery industry has experienced a strong growth over the past few years in
the area of portable and rechargeable battery packs, due to the widespread use of cell
phones, PDA’s, laptop computers, cameras and other wireless electronics as well as due
to the demand for power hybrid electric vehicles, full electric vehicles and by the need
of energy storage related to renewable energies [1-3]. Lithium ion batteries are most
often the systems of choice for portable applications, offering high energy density,
flexible and lightweight design, and longer lifespan than competing battery
technologies. At present, it is the largest sector representative in batteries for portable
systems and shows the best performance mainly due to its high energy density (210
W.h/kg) [3-4].
Nevertheless, the actual secondary battery systems use expensive materials, which
act as an obstacle to the sustained growth of this industry. In addition, the safety of
these devices is still questioned [2]. The use of lithium in secondary cells is difficult due
to its high reactivity with the electrolyte components. One solution to this problem can
be the use of polymer electrolytes. In this way, future developments in secondary cells
will focus mainly on two areas: improving cells safety, energy density and
electrochemical characteristics and provide larger systems for electric vehicles and
dispersed energy storage systems [5].
A battery is a transducer that converts chemical into electrical energy and its main
constituents are the cathode, the anode and the membrane separator (e.g. solid polymer
electrolyte – SPE). In lithium ion batteries the anode serves as the source of ions, the
cathode provides the function of collecting the ions and the electrolyte ensures the
separation for ionic and electronic transport [2]. The separator is a porous membrane
between the electrodes of opposite polarity, permeable to ionic flow but preventing
electric contact between electrodes [6-8].
The SPE performance is determinate by parameters like thickness, permeability,
porosity/pore size, wettability, electrolyte absorption and retention, chemical,
dimensional and thermal stability [6, 9]. In a SPE the lithium salt is incorporated into
the membrane through an electrolyte solution or directly in the form of composite [10-
11]. The polymer matrix most often used in SPE are poly(ethylene oxide) (PEO) [12-

4 – POROUS MEMBRANES OF MMT/P(VDF-TrFE)
54
15], poly(acrylonitrile) (PAN) [16-17] and poly(vinylidene fluoride) (PVDF) and its
copolymers [18-21].
PVDF and poly(vinylidene fluoride-co-trifluoroethylene) (P(VDF-TrFE))
copolymers have attracted scientific and technological interest as SPE due to their good
mechanical properties, wettability by organic solvents, chemically inertness, good
contact between electrode and electrolyte and stability in cathodic environment [21-22].
P(VFD-TrFE) has a ferroelectric to paraelectric (FE-PE) phase transition at a
Curie temperature (Tc) that occurs below the melting temperature (Tm), and crystallizes
from the melt or by solution casting in a polar ferroelectric chain conformation [23].
SPE based on P(VDF-TrFE) for lithium ion batteries have been studied from different
approaches: porous membranes were prepared by solvent casting with varying porosity
and the lithium ions were introduced by uptake or the polymer composites were
prepared with lithium salts introduced within the polymer matrix [21, 24-25]. The
results were better for porous membranes and lithium ion uptake, the ionic conductivity
depending on membrane porosity and pore size, which are related to the ability for
uptake.
The incorporation of suitable fillers into host polymers, such as carbon nanotubes,
zeolites, inert oxide ceramics, rare-earth ceramics and others, has proved to be a viable
solution for improving mechanical properties, thermal and chemical stability and ionic
conductivity of polymer membranes for SPE [26-27]. Among these fillers, ceramics and
clays are the ones with the largest application potential [26]. Studies of PVDF
reinforced with nanoclays show that the presence of nanoparticles improves the
mechanical strength of the materials [28-29]. Clays are, compositionally, similar to
zeolites since both are alumino-silicates. However, the rigid 3-dimensional and
crystalline structure characteristic of the zeolites, forming channels and cavities with
regular dimensions [30], are replaced by a layered crystalline structure in the clays.
These thin layers are formed by tetrahedral and octahedral sheets of silicon and alumina,
surrounded by oxygen atoms [31]. The combination of these sheets can create a 1:1 or
2:1 layered structure. In particular, montmorillonite (MMT) clay presents a 2:1 layered
structure, each layer consisting on two-dimensional silicon sheets bonded to a central
alumina sheet by shared oxygen ions. The stacking of these layers gives origin to van
der Waals gaps where cations (typically Na+ and/or Ca
2+) are located which are
responsible for the balancing of deficiency charge created by the isomorphous
substitution within the layers of tetrahedral Si4+
by Al3+
or octahedral Al3+
by Mg2+
[31-

4 – POROUS MEMBRANES OF MMT/P(VDF-TrFE)
55
32]. The presence of ions leads to water absorption by clays, resulting in the interlayer
expansion of MMT resulting therefore in shrinking and swelling as water is absorbed
and removed between the layers [33]. On the other hand, in 1:1 layered structures a
tetrahedral sheet is fused with an octahedral sheet, whereby the oxygen atoms are shared
[34]. Contrary to 2:1 structure, this structure is not able to absorb water. This 1:1 clay
structure usually presents a lower amount of cations when compared with the 2:1
layered structure, facts that make the 2:1 layered structure of MMT clays the choice for
membrane production.
Some works have already been presented exploring clays/polymer composites for
battery applications. Electrical and electrochemical properties of nanocomposite
polymer electrolytes based on intercalation of PVDF into organically modified MMT
clays were investigated; the results show that the addition of clay enhances the
electrolyte uptake due to the affinity between clays and electrolyte molecules. The ionic
conductivity increases with increasing clay content to a maximum value of 2.310-3
S/cm at room temperature for a 4 wt% of clay content. The presence of fillers also
provides a better electrochemical stability [35].
Composites of organoclay ALA-MMT (12-aminododecanoic acid - ALA), PAN
and LiClO4 were tested as electrolytes for lithium batteries; the presence of clays
improving the electrolyte performance. The ionic conductivity reached the maximum
value around 2.4410-4
S/cm at 30 ºC for the composites with 7 wt% fillers content.
Electrochemical stability and cyclability is confirmed between 0 and 4 V [36].
Montmorillonite/polyvinyl alcohol (MMT/PVA) composites polymer membranes
showed ionic conductivity of 3.6810-2
S/cm for composites with 10 wt% of MMT. The
stability window was about 2 V [37].
Gel polymer electrolytes based on montmorillonite/poly(vinylidene fluoride-co-
hexafluoropropene) (MMT/PVDF-HFP) composites showed ionic conductivity in the
range of 1-2.510-1
mS/cm [38]. Additionally, polymer composite electrolyte based on
PVDF, polyethylene glycol (PEG) and functionalized clays showed maximum
conductivity of 7.77 mS/cm for 6 wt% of clays. The membrane porosity decreases with
increasing filler content from 0 to 10 wt% [39].
Previous reported results as well as the properties of polymeric separators
materials based on P(VDF-TrFE) for lithium batteries applications with zeolites [40],
support the main objective of this work, which consists in the preparation of

4 – POROUS MEMBRANES OF MMT/P(VDF-TrFE)
56
clay/P(VDF-TrFE) porous membranes with different MMT clay contents in order to
improve both the electrical and mechanical properties of SPE. The influence of MMT
content in the performance of the battery separator membranes, with and without
electrolyte solution (1 M LiClO4.3H2O-PC), was evaluated through the morphological,
thermal, mechanical and electrical properties.
4.2. Results and discussion
4.2.1. Microstructural characteristics and polymer phase
It has been shown [21] that pristine PVDF-TrFE membranes produced under
suitable solvent evaporation conditions lead to porosity and pore configuration suitable
for lithium ion battery applications. Those conditions were applied for the production of
the composite samples.

4 – POROUS MEMBRANES OF MMT/P(VDF-TrFE)
57
Figure 4.1 shows surface and cross-section images of the MMT/P(VDF-TrFE)
membranes with different clay contents and histograms of the pore diameter distribution
determined from the same scanning electron microscopy (SEM) images.
Figure 4.1: Cross section SEM images of the MMT/P(VDF-TrFE) composites with different clay content: a) 0 wt%, b) 4 wt%, c) 16 wt% and d) 32 wt%.
A uniform distribution of pores can be observed independently of clay content for
the samples with 4 and 16 wt%. These samples show a structure similar to the one
obtained for the pure copolymer when crystallized under the same conditions [41]. In
this way, the crystallization mechanism is not affected by the presence of the fillers. The
formation of the porous structure is therefore explained by a liquid/liquid spinodal
decomposition followed by polymer crystallization depending mainly on the
evaporation rate of the solvent and the crystallization temperature [41-42]. The sample
with 32 wt% MMT content shows a very distinct microstructure, different from the
lower clay concentrations and pristine polymer: the clay particles aggregate in certain
areas of the polymer hindering partially the formation of the porous microstructure
necessary for the intended application as battery separator membrane [40].

4 – POROUS MEMBRANES OF MMT/P(VDF-TrFE)
58
As the formation of the porous structure is strongly affected by the liquid/liquid
spinodal decomposition and solvent evaporation rate [41-42], these factors are affected
by the presence of the clays, resulting in a tendency to increase the average pore size
with increasing MMT content.
Figure 4.2 shows the Fourier transformed infrared spectroscopy (FTIR) spectra
for the membranes without electrolyte solution uptake.
800 1000 1200 1400 1600
MMTPolymer
Polymer 16 %
4 %
0 %
Tra
nsm
itta
nce
(a
.u.)
Wavenumber (cm-1)
Figure 4.2: FTIR spectra of the MMT/P(VDF-TrFE) composites with different MMT contents without electrolyte solution uptake.
The FTIR spectra (figure 4.2) shows the characteristic vibration modes (851 cm-1
,
886 cm-1
and 1402 cm-1
) of the polymer all-trans configuration [43] for all clay
contents. The polymer characteristic bands are unaffected by the presence of MMT
particles. These bands area also unaffected by the presence of the electrolyte solution
[40].
For the membranes with 4 and 16 wt% MMT content it is notorious the presence
of the characteristic band of MMT around 1084 cm-1
corresponding to the stretching
vibration modes of Si-O-Si [44].

4 – POROUS MEMBRANES OF MMT/P(VDF-TrFE)
59
4.2.2. Porosity, electrolyte uptake and tortuosity
Figure 4.3 shows the electrolyte solution uptake as function of clay content for the
samples up to MMT content of 16 wt%, as the samples with higher clay content does
not show the necessary porous microstructure (figure 4.1).
0 4 8 12 160
20
40
60
80
a)
Po
rosity (
%)
MMT content (%)
0 4 8 12 160
50
100
150
200
250
300
350 b)
Up
take
(%
)
MMT content (%)
Figure 4.3: a) Porosity as a function of clay content for MMT/P(VDF-TrFE) composites; b) 1 M LiClO4.3H2O-PC solution uptake as a function of clay content for the MMT/P(VDF-TrFE) composites.
Figure 4.3 shows an increase of the membrane porosity and electrolyte uptake
with the presence of MMT. Clay inclusion in the polymeric matrix results in an increase
of the porosity, which in turn leads to increased uptake capacity. The increase of uptake
(figure 4.3b) is a result of the excellent affinity of MMT particles towards polar PC
molecules, the solvent in the electrolyte solution.
Table 4.1 shows the room temperature ionic conductivity and the tortuosity
calculated by equation 2.5 and 2.6 respectively.
Table 4.1: Room temperature ionic conductivity and tortuosity of 1M LiClO4.3H2O + separator membrane; σ0 = 9.8 mS/cm at 25 ºC.
Sample σi (S/cm) τ
0 % 5.2410-7 115
4 % 5.9810-7 117
16 % 8.1110-7 104
It is shown that ionic conductivity of the membranes increases slightly with
increasing clay content. The inclusion of fillers increases the number of ions within the
samples, which leads to a higher conductivity values.

4 – POROUS MEMBRANES OF MMT/P(VDF-TrFE)
60
The tortuosity, known as the ratio of the mean capillary length to membrane
thickness, describes the average pore connectivity and gives information about the pore
blockage. An ideal porous body present a tortuosity of 1, in this case the values indicate
a hindered system [6]. However, it is observed a slight decrease of the tortuosity with
increasing filler content. The presence of clays increases the connectivity between the
pores leading to decrease of pore blockage.
4.2.3. Thermal and mechanical properties
Figure 4.4 shows the differential scanning calorimetry (DSC) thermograms for the
MMT/P(VDF-TrFE) membranes.
80 100 120 140 160 180
Tm
Tc
.
16 %
0 %
4 %
Q (
W/g
)
Temperature (ºC)
endo
1 W
/g
Figure 4.4: DSC thermograms of the MMT/P(VDF-TrFE) composites for the different clay contents without electrolyte solution uptake.
The DSC thermograms show two endothermic peaks corresponding to the
ferroelectric-paraelectric phase transition (lower temperature peak, Tc) around 117 ºC
and the melting temperature of the polymer (higher temperature peak, Tm) around 146
ºC [45]. The thermogram shows that the clays content does not affect significantly the
polymer ferroelectric phase, its degree of crystallinity and thermal stability. These
parameters are also not affected by the presence of the electrolyte solution as shown in
[40] for different fillers.

4 – POROUS MEMBRANES OF MMT/P(VDF-TrFE)
61
The table 4.2 shows the degree of crystallinity for the MMT/P(VDF-TrFE)
membranes as a function of filler content.
Table 4.2: Degree of crystallinity calculated applying equation 2.1 to the melting peak of the samples.
Sample χc ± 2 (%)
0 % 28
4 % 27 16 % 23
The results show a small decrease in the degree of crystallinity with increasing
filler content due to defective crystallization of the polymer structure in the places
around the clays particles, due to changes in the nucleation and growth kinetics of the
polymer [46].
The performance, integrity and safety of a battery are extremely dependent on the
mechanical properties of the membrane separator [47-48], which in turn depend on
porosity, pore size and distribution [49]. Mechanical characteristics are among the main
drawbacks of polymer porous membranes that can be solved with suitable reinforcing
fillers.
Figure 4.5 show the stress-strain curves of the MMT/P(VDF-TrFE) membranes
with different filler contents without (figure 4.5a) and with electrolyte solution (figure
4.5b).
0 25 50 75 100
0
1
2
3
0 %
4 %
16 %
a)
Strain (%)
Str
ess (
MP
a)
0 100 200 300 400
0
1
2
3
0 %
4 %
16 %
b)
Strain (%)
Str
ess (
MP
a)
Figure 4.5: Stress-Strain curves of the MMT/P(VDF-TrFE) composites with different clay contents: a) without electrolyte solution uptake and b) with electrolyte solution uptake.

4 – POROUS MEMBRANES OF MMT/P(VDF-TrFE)
62
Table 4.3 shows the mechanical properties of the composites with and without
electrolyte solution uptake.
Table 4.3: Mechanical properties of the MMT/P(VDF-TrFE) membranes with and without electrolyte solution uptake.
Without uptake With uptake
Sample 0 % 4 % 16 % 0 % 4 % 16 % Yielding stress (MPa) 2.1 2.6 2.0 0.3 0.6 0.7 Elastic modulus (MPa) 40 81.4 71.7 1.9 2.0 2.7
Figure 4.5a and table 4.3 shows that addition of MMT up to 4 wt% improves the
yielding stress and elastic modulus of the membranes previous to uptake, but for 16
wt% these mechanical parameters decrease. The reason for 4 wt% be attributed to the
reinforcement effect of the MMT particles caused by its intercalation through the
polymer matrix, and for 16 wt%, the layers occupy the full volume suggesting that
percolation is achieved [50]. As regard to membranes with electrolyte solution uptake
(figure 4.5b), the samples with clays also show better mechanical properties than the
pristine polymer. However, a decrease in yielding stress and elastic modulus can be
observed in comparison with the membranes without electrolyte solution, attributed to
the high electrolyte solution uptake and swelling for all samples.
4.2.4. Electrical properties
The electrochemical properties of the samples, with electrolyte solution uptake,
were evaluated by electrochemical impedance spectroscopy (EIS), trough the Nyquist
plots (imaginary impedance Z’’ as function of real impedance Z’), Bode plots
(impedance modulus |Z| as function of frequency and phase angle) and ionic
conductivity as function of temperature. Figure 4.6 presents the Nyquist plots for all
samples with electrolyte uptake at 50 ºC (figure 4.6a), the Bode plots (figure 4.6b and
4.6c) and the impedance modulus as function of clays content at 1 kHz and different
temperatures (figure 4.6d).
The Nyquist plot is characterized by three distinct zones: a semicircle located at
the high frequency range which corresponds to the charge transfer process, a straight

4 – POROUS MEMBRANES OF MMT/P(VDF-TrFE)
63
line for lower frequency range which is related to the diffusion process and the
transition between these phenomena [51-52].
0 500 1000 1500 2000 2500
0
500
1000
1500
2000
2500
3000
3500
4000
0 %
4 %
16 %
a)
Z' ()
-Z''
()
100
101
102
103
104
105
0
1000
2000
3000
4000
5000 0 %
4 %
16 %
b)
|Z| (
)
Frequency (Hz)
100
101
102
103
104
105
0
-10
-20
-30
-40
-50
-60
-70 0 %
4 %
16 %
c)
Ph
ase
an
gle
(d
eg
)
Frequency (Hz)
0 4 8 12 16
20
40
60
80
100
120
140
25 ºC
50 ºC
100 ºC
d)
|Z| (
)
MMT content (%)
Figure 4.6: a) Nyquist plot of the MMT/P(VDF-TrFE) composites for all filler contents at 50 ºC, b-c) Bode diagram of the MMT/P(VDF-TrFE) composites for all contents at 50 ºC and d) impedance modulus as a function of clay content at different temperatures.
Figure 4.6a presents the semicircle at higher frequencies for the membrane
without fillers, whereas for the samples with fillers it is just slightly noted, showing that
the inclusion of clays particles improves the charge transfer process, which suggests the
enhancement in number of free ions and their mobility in the increased spacing of
intercalated clay galleries.
In figure 4.6b is shown that impedance decrease with increasing frequency for the
pure polymer and for sample with 4 wt% of clays particles, due to the contribution of
the electrode polarization and Maxwell-Wagner-Sillars (MWS) interfacial polarization.
This behaviour is typical for the polymer separator indicating restricted ion mobility
within the porous membrane. For the membrane with 16 wt% of fillers the impedance

4 – POROUS MEMBRANES OF MMT/P(VDF-TrFE)
64
increases with increasing frequency and is observed two saturation region in the low
and high frequency assisted by ion-migration and dipolar relaxation respectively. This
amount of fillers is near to the percolation limit and enters a regime dominated by clays
and in the case of MWS phenomena, the free charges build up at the interfacing
boundaries of the clay fillers.
The Bode diagram of the phase angle as function of frequency (figure 4.6c) shows
a maximum phase angle between -60 and -70 ºC for all membranes. In an ideal resistor
and capacitor in series, the maximum phase angle should be at -90 ºC. In this case the
behaviour is near a constant phase element (CPE) [53], which can be modelled as a
capacitor with a distribution of a relaxation times [54-55].
Figure 4.6d illustrates the impedance modulus as function of clays content for a
given frequency of 1 kHz and for different temperatures. The impedance does not show
a strong dependence with the clay content for lower temperatures, increasing strongly
with clay content at 100 ºC. Further, it is observed a decrease in the impedance with
increasing temperature, except for the 16 wt% MMT sample which the opposite
behaviour is observed for the highest temperature. This behaviour suggests that clay
interaction with P(VDF-TrFE) matrix reduce relaxation time of the ionic species
thereby assisting ion-transport in the lower temperatures and lower concentration
ranges. At high concentrations and temperatures ionic mobility is hindered due to strong
interface charge accumulation leading to increased impedance modulus.
Figure 4.7 shows the behaviour of the ionic conductivity with temperature for the
polymer composite membranes with and without electrolyte solution uptake.
2.4 2.6 2.8 3.0 3.2 3.4
-11
-10
-9
-8 0 %
4 %
16 %
a)
1000/T (K-1)
Log
i (S
/cm
)
2.8 3.0 3.2 3.4-6.5
-6.0
-5.5
-5.0
-4.5
-4.0
0 %
4 %
16 %
b)
1000/T (K-1)
Log
i (S
/cm
)
Figure 4.7: Log i as a function of 1000/T for MMT/P(VDF-TrFE) composites: a) without electrolyte solution uptake and b) with electrolyte solution uptake.

4 – POROUS MEMBRANES OF MMT/P(VDF-TrFE)
65
The ionic conductivity increases slightly with increasing filler content (figure
4.7a). On the one hand the MMT particles increase the free anion content resulting in a
larger number of charge carriers [36], on the other hand, it decreases slightly the degree
of crystallinity and tortuosity, which in turn leads to an increase of the ionic
conductivity [56].
Without electrolyte solution uptake (figure 4.7a) the ionic conductivity is higher
for the membrane with lower filler content, due to a higher ionic mobility for the sample
with 4 wt% of MMT. In the membrane with 16 wt% of MMT the conductivity
decreases due to interface effects caused by the increase in filler inducing defects in the
membrane structure.
In the membranes with electrolyte uptake (figure 4.7b) the ionic conductivity
increases by about 4 orders of magnitude. Moreover, the thermal stability of the
electrical conductivity increases significantly for the membranes with MMT content.
The pure polymer presents a conductivity higher than that of the composites but very
unstable with temperature. The obtained results of the overall conductivity of the
composites are lower than others achieved by clay composites (e.g. [35]) as the present
approach does not use organically modified clays, leading to a lower level of
exfoliation.
Table 4.4 shows the activation energy (Ea) for ion transport, calculated by the
application of Arrhenius equation (equation 2.7) to the data of figure 4.7
Table 4.4: Activation energy for the different porous membranes with and without electrolyte solution uptake.
Samples Ea without electrolyte
solution (kJ/mol) Ea with electrolyte solution (kJ/mol)
0 % 181 64
4 % 25 10
16 % 16 15
The Ea shows a strong dependence with MMT filler content and with electrolyte
solution uptake. The Ea decreases with increasing MMT content and with the presence
of electrolyte solution. The electrolyte solution strongly improves the mobility and ionic
charge carriers in the porous membranes [57].

4 – POROUS MEMBRANES OF MMT/P(VDF-TrFE)
66
The electrochemical stability and the diffusion coefficient of the composites were
evaluated by cyclic voltammetry over the potential range -2.0 to 6.0 V (figure 4.8).
-2 0 2 4 6
-0.2
-0.1
0.0
0.1
0.2
0.3 a)
E vs Li/Li+ (V)
0 %
4 %
16 %
I (
A)
-2 0 2 4 6
-0.1
0.0
0.1
0.2 0.05 V/s
0.1 V/s
0.5 V/s
1 V/s
b)
I (
A)
E vs Li/Li+ (V)
Figure 4.8: a) Voltammogram of MMT/P(VDF-TrFE) composites at 0.5 V/s; b) voltammogram of MMT/P(VDF-TrFE) with 16 wt% of clays at different scanning rates.
The voltammogram of figure 4.8a shows that the anodic and cathodic peaks
increase with the addition of clays. Both peaks are more intense for the membrane with
4 wt% filler content. All membranes present a stable operation window between 0.5 and
4.0 V, versus Li/Li+. It is noted that a reduction peak around 1.0 - 1.5 V appeared for the
electrolytes films. Previously, the peak in this region had been ascribed to the reduction
of low level of water present or oxygen impurities. Similar behaviour has been observed
for other systems based on PEO and lithium salt [58].
Figure 4.8b shows that the increase of the scanning rate affects the
electrochemical stability of the membrane. From these data, the diffusion coefficients of
all membranes, calculated by equation 2.8, are in the order of 3.50×10⁻⁵
cm2/s for pure
polymer and 16 wt% composite and 5.16×10⁻⁵
cm2/s for the 4 wt% MMT composite.
Therefore, the diffusion coefficient does not depend on filler content.
4.3. Conclusion
MMT/P(VDF-TrFE) porous membranes with different contents of MMT were
prepared by thermally induced phase separation (TIPS) for lithium ion battery
applications . The electrolyte solution was 1 M LiClO4.3H2O-PC. The clay inclusion
increases the average pore size, the porosity and electrolyte solution uptake of the

4 – POROUS MEMBRANES OF MMT/P(VDF-TrFE)
67
membranes. No variation of the polymer phase is observed due to the inclusion of MMT
in the composite. The degree of crystallinity and the tortuosity slightly decrease with
increasing filler content, suggesting the later a decrease in the pore blockage. The
membranes are thermally stable up to ~100 ºC and the inclusion of the fillers enhances
its mechanical properties. The ionic conductivity is slightly improved and its
temperature stability strongly improved by the presence of clays. The electrochemical
stability evaluated by cyclic voltammetry reveals a stable window operation up to 5.0 V,
versus Li/Li+. The overall performance is optimised for the membrane with 4 % filler
content.
These results show that MMT/P(VDF-TrFE) porous membranes with 4 % filler
content have adequate electrochemical stability, thermal, mechanical and electrical
properties for being used as battery separators in lithium ion batteries.

4 – POROUS MEMBRANES OF MMT/P(VDF-TrFE)
68
4.4. References
1. Brodd, R.J., K.R. Bullock, R.A. Leising, R.L. Middaugh, J.R. Miller, and E.
Takeuchi. Batteries, 1977 to 2002. Journal of The Electrochemical Society,
2004. 151(3): p. K1-K11.
2. Whittingham, M.S. Lithium Batteries and Cathode Materials. Chemical
Reviews, 2004. 104(10): p. 4271-4302.
3. Tarascon, J.-M. Key challenges in future Li-battery research. Philosophical
Transactions of the Royal Society A: Mathematical, Physical and Engineering
Sciences, 2010. 368(1923): p. 3227-3241.
4. Tarascon, J.M. and M. Armand. Issues and challenges facing rechargeable
lithium batteries. Nature, 2001. 414(6861): p. 359-367.
5. Vincent, C.A. Lithium batteries: a 50-year perspective, 1959–2009. Solid State
Ionics, 2000. 134(1–2): p. 159-167.
6. Arora, P. and Z. Zhang. Battery Separators. Chemical Reviews, 2004. 35(50): p.
4419-4462.
7. Linden, D. and T.B. Reddy. Linden's handbook of batteries. 2001, New York:
McGraw-Hill.
8. Daniel, C. and J.O. Besenhard. Handbook of battery materials. 2011, Weinheim:
Wiley-VCH Verlag.
9. Xu, K. Nonaqueous Liquid Electrolytes for Lithium-Based Rechargeable
Batteries. Chemical Reviews, 2004. 104(10): p. 4303-4418.
10. Manuel Stephan, A. Review on gel polymer electrolytes for lithium batteries.
European Polymer Journal, 2006. 42(1): p. 21-42.
11. Barbosa, P.C., M.M. Silva, M.J. Smith, A. Gonçalves, and E. Fortunato. Studies
of solid-state electrochromic devices based on PEO/siliceous hybrids doped with
lithium perchlorate. Electrochimica Acta, 2007. 52(8): p. 2938-2943.
12. Persi, L., F. Croce, B. Scrosati, E. Plichta, and M.A. Hendrickson. Poly(ethylene
oxide)-Based, Nanocomposite Electrolytes as Improved Separators for
Rechargeable Lithium Polymer Batteries. Journal of The Electrochemical
Society, 2002. 149(2): p. A212-A216.
13. Kim, D.-W., J.-M. Ko, J.-H. Chun, S.-H. Kim, and J.-K. Park. Electrochemical
performances of lithium-ion cells prepared with polyethylene oxide-coated
separators. Electrochemistry Communications, 2001. 3(10): p. 535-538.

4 – POROUS MEMBRANES OF MMT/P(VDF-TrFE)
69
14. Wang, C., Y. Wei, G.R. Ferment, W. Li, and T. Li. Poly(ethylene oxide)–silica
hybrid materials for lithium battery application. Materials Letters, 1999. 39(4):
p. 206-210.
15. Li, H., X.-T. Ma, J.-L. Shi, Z.-K. Yao, B.-K. Zhu, and L.-P. Zhu. Preparation
and properties of poly(ethylene oxide) gel filled polypropylene separators and
their corresponding gel polymer electrolytes for Li-ion batteries. Electrochimica
Acta, 2011. 56(6): p. 2641-2647.
16. Cho, T.H., T. Sakai, S. Tanase, K. Kimura, Y. Kondo, T. Tarao, and M. Tanaka.
Electrochemical performances of polyacrylonitrile nanofiber-based nonwoven
separator for lithium-ion battery. Electrochemical and Solid State Letters, 2007.
10(7): p. A159-A162.
17. Huai, Y., J. Gao, Z. Deng, and J. Suo. Preparation and characterization of a
special structural poly(acrylonitrile)-based microporous membrane for lithium-
ion batteries. Ionics, 2010. 16(7): p. 603-611.
18. Cheng, C.L., C.C. Wan, and Y.Y. Wang. Preparation of porous, chemically
cross-linked, PVdF-based gel polymer electrolytes for rechargeable lithium
batteries. Journal of Power Sources, 2004. 134(2): p. 202-210.
19. Stephan, A.M., K.S. Nahm, M. Anbu Kulandainathan, G. Ravi, and J. Wilson.
Poly(vinylidene fluoride-hexafluoropropylene) (PVdF-HFP) based composite
electrolytes for lithium batteries. European Polymer Journal, 2006. 42(8): p.
1728-1734.
20. Wachtler, M., D. Ostrovskii, P. Jacobsson, and B. Scrosati. A study on PVdF-
based SiO2-containing composite gel-type polymer electrolytes for lithium
batteries. Electrochimica Acta, 2004. 50(2–3): p. 357-361.
21. Costa, C.M., L.C. Rodrigues, V. Sencadas, M.M. Silva, J.G. Rocha, and S.
Lanceros-Méndez. Effect of degree of porosity on the properties of
poly(vinylidene fluoride–trifluorethylene) for Li-ion battery separators. Journal
of Membrane Science, 2012. 407–408(0): p. 193-201.
22. Djian, D., F. Alloin, S. Martinet, and H. Lignier. Macroporous poly(vinylidene
fluoride) membrane as a separator for lithium-ion batteries with high charge
rate capacity. Journal of Power Sources, 2009. 187(2): p. 575-580.
23. Nalwa, H.S. Ferroelectric polymers : chemistry, physics, and applications.
1995, New York: Dekker.
24. Costa, C.M., A. California, V.F. Cardoso, V. Sencadas, L.C. Rodrigues, M.M.
Silva, and S. Lanceros-Méndez. Electroactive Poly(Vinylidene Fluoride-
Trifluorethylene) (PVDF-TrFE) Microporous Membranes for Lithium-Ion
Battery Applications. Ferroelectrics, 2012. 430(1): p. 103-107.
25. Costa, C.M., L.C. Rodrigues, V. Sencadas, M.M. Silva, and S. Lanceros-
Méndez. Effect of the microsctructure and lithium-ion content in

4 – POROUS MEMBRANES OF MMT/P(VDF-TrFE)
70
poly[(vinylidene fluoride)-co-trifluoroethylene]/lithium perchlorate trihydrate
composite membranes for battery applications. Solid State Ionics, 2012. 217(0):
p. 19-26.
26. Jung, S., D. Kim, S. Lee, M. Cheong, D. Nguyen, B. Cho, and H. Kim. {Fillers
for Solid-State Polymer Electrolytes : Highlight}. Polymer, 2009. 30(10): p.
2355-2361.
27. Weston, J.E. and B.C.H. Steele. Effects of inert fillers on the mechanical and
electrochemical properties of lithium salt-poly(ethylene oxide) polymer
electrolytes. Solid State Ionics, 1982. 7(1): p. 75-79.
28. Hwang, H.-Y., D.-J. Kim, H.-J. Kim, Y.-T. Hong, and S.-Y. Nam. Effect of
nanoclay on properties of porous PVdF membranes. Transactions of Nonferrous
Metals Society of China, 2011. 21, Supplement 1(0): p. s141-s147.
29. Koh, M.J., H.Y. Hwang, D.J. Kim, H.J. Kim, Y.T. Hong, and S.Y. Nam.
Preparation and Characterization of Porous PVdF-HFP/clay Nanocomposite
Membranes. Journal of Materials Science & Technology, 2010. 26(7): p.
633-638.
30. Corma, A. Inorganic Solid Acids and Their Use in Acid-Catalyzed Hydrocarbon
Reactions. Chemical Reviews, 1995. 95(3): p. 559-614.
31. Pavlidou, S. and C.D. Papaspyrides. A review on polymer-layered silicate
nanocomposites. Progress in Polymer Science, 2008. 33(12): p. 1119-1198.
32. Xie, W., Z.M. Gao, K.L. Liu, W.P. Pan, R. Vaia, D. Hunter, and A. Singh.
Thermal characterization of organically modified montmorillonite.
Thermochimica Acta, 2001. 367: p. 339-350.
33. Norrish, K. The swelling of montmorillonite. Discussions of the Faraday Society,
1954. 18(0): p. 120-134.
34. Ma, C. and R.A. Eggleton. Cation exchange capacity of kaolinite. Clays and
Clay Minerals, 1999. 47(2): p. 174-180.
35. Deka, M. and A. Kumar. Electrical and electrochemical studies of
poly(vinylidene fluoride)–clay nanocomposite gel polymer electrolytes for Li-ion
batteries. Journal of Power Sources, 2011. 196(3): p. 1358-1364.
36. Chen, H.-W., T.-P. Lin, and F.-C. Chang. Ionic conductivity enhancement of the
plasticized PMMA/LiClO4 polymer nanocomposite electrolyte containing clay.
Polymer, 2002. 43(19): p. 5281-5288.
37. Yang, C.-C., Y.-J. Lee, and J.M. Yang. Direct methanol fuel cell (DMFC) based
on PVA/MMT composite polymer membranes. Journal of Power Sources, 2009.
188(1): p. 30-37.

4 – POROUS MEMBRANES OF MMT/P(VDF-TrFE)
71
38. Wang, M. and S. Dong. Enhanced electrochemical properties of nanocomposite
polymer electrolyte based on copolymer with exfoliated clays. Journal of Power
Sources, 2007. 170(2): p. 425-432.
39. Wang, Y.-P., X.-H. Gao, R.-M. Wang, H.-G. Liu, C. Yang, and Y.-B. Xiong.
Effect of functionalized montmorillonite addition on the thermal properties and
ionic conductivity of PVDF–PEG polymer electrolyte. Reactive and Functional
Polymers, 2008. 68(7): p. 1170-1177.
40. Nunes-Pereira, J., A.C. Lopes, C.M. Costa, L.C. Rodrigues, M.M. Silva, and S.
Lanceros-Méndez. Microporous membranes of NaY zeolite/poly(vinylidene
fluoride–trifluoroethylene) for Li-ion battery separators. Journal of
Electroanalytical Chemistry, 2013. 689(0): p. 223-232.
41. California, A., V.F. Cardoso, C.M. Costa, V. Sencadas, G. Botelho, J.L. Gómez-
Ribelles, and S. Lanceros-Mendez. Tailoring porous structure of ferroelectric
poly(vinylidene fluoride-trifluoroethylene) by controlling solvent/polymer ratio
and solvent evaporation rate. European Polymer Journal, 2011. 47(12): p. 2442-
2450.
42. Ferreira, A., J. Silva, V. Sencadas, J.L.G. Ribelles, and S. Lanceros-Méndez.
Poly[(vinylidene fluoride)-co-trifluoroethylene] Membranes Obtained by
Isothermal Crystallization from Solution. Macromolecular Materials and
Engineering, 2010. 295(6): p. 523-528.
43. Prabu, A.A., J.S. Lee, K.J. Kim, and H.S. Lee. Infrared spectroscopic studies on
crystallization and Curie transition behavior of ultrathin films of P(VDF/TrFE)
(72/28). Vibrational Spectroscopy, 2006. 41(1): p. 1-13.
44. Lopez-Estopier, R., M. Aceves-Mijares, and C. Falcony. Photoluminescence of
Silicon Rich Oxide films with different silicon excess and nitrogen content.
Electrical and Electronics Engineering, 2006 3rd International Conference on,
2006: p. 1-4.
45. Sencadas, V., S. Lanceros-Méndez, and J.F. Mano. Thermal characterization of
a vinylidene fluoride-trifluorethylene (75–25) (%mol) copolymer film. Journal of
Non-Crystalline Solids, 2006. 352(50–51): p. 5376-5381.
46. Costa, C.M., S. Firmino Mendes, V. Sencadas, A. Ferreira, R. Gregorio Jr, J.L.
Gómez Ribelles, and S. Lanceros-Méndez. Influence of processing parameters
on the polymer phase, microstructure and macroscopic properties of
poly(vinilidene fluoride)/Pb(Zr0.53Ti0.47)O3 composites. Journal of Non-
Crystalline Solids, 2010. 356(41–42): p. 2127-2133.
47. Sheidaei, A., X. Xiao, X. Huang, and J. Hitt. Mechanical behavior of a battery
separator in electrolyte solutions. Journal of Power Sources, 2011. 196(20): p.
8728-8734.

4 – POROUS MEMBRANES OF MMT/P(VDF-TrFE)
72
48. Tian, Z., X. He, W. Pu, C. Wan, and C. Jiang. Preparation of poly(acrylonitrile–
butyl acrylate) gel electrolyte for lithium-ion batteries. Electrochimica Acta,
2006. 52(2): p. 688-693.
49. Lu, G., G.Q. Lu, and Z.M. Xiao. Mechanical Properties of Porous Materials.
Journal of Porous Materials, 1999. 6(4): p. 359-368.
50. Madaleno, L., J. Schjødt-Thomsen, and J.C. Pinto. Morphology, thermal and
mechanical properties of PVC/MMT nanocomposites prepared by solution
blending and solution blending + melt compounding. Composites Science and
Technology, 2010. 70(5): p. 804-814.
51. Chang, B.-Y. and S.-M. Park. Electrochemical Impedance Spectroscopy. Annual
Review of Analytical Chemistry, 2010. 3(1): p. 207-229.
52. Park, M., X. Zhang, M. Chung, G.B. Less, and A.M. Sastry. A review of
conduction phenomena in Li-ion batteries. Journal of Power Sources, 2010.
195(24): p. 7904-7929.
53. Zelinka, S.L., L. Ortiz-Candelaria, D.S. Stone, and D.R. Rammer.
Electrochemical impedance spectroscopy (EIS) as a tool for measuring
corrosion of polymer-coated fasteners used in treated wood. Forest products
journal, 2009. 59(1-2): p. 77-82.
54. Cole, K. Dispersion and Absorption in Dielectrics I. Alternating Current
Characteristics. J. Chem. Phys., 1941. 9(4): p. 341.
55. Raistrick, I.D. Application of Impedance Spectroscopy to Materials Science.
Annual Review of Materials Science, 1986. 16(1): p. 343-370.
56. Kim, S., E.-J. Hwang, Y. Jung, M. Han, and S.-J. Park. Ionic conductivity of
polymeric nanocomposite electrolytes based on poly(ethylene oxide) and
organo-clay materials. Colloids and Surfaces A: Physicochemical and
Engineering Aspects, 2008. 313–314(0): p. 216-219.
57. Every, H.A., F. Zhou, M. Forsyth, and D.R. MacFarlane. Lithium ion mobility in
poly(vinyl alcohol) based polymer electrolytes as determined by 7Li NMR
spectroscopy. Electrochimica Acta, 1998. 43(10–11): p. 1465-1469.
58. Aurbach, D., M. Daroux, P. Faguy, and E. Yeager. The electrochemistry of
noble metal electrodes in aprotic organic solvents containing lithium salts.
Journal of Electroanalytical Chemistry and Interfacial Electrochemistry, 1991.
297(1): p. 225-244.

5 - Porous membranes of CNT/P(VDF-TrFE)
This chapter is based on the following publication:
Nunes-Pereira, J., C.M. Costa, R. Leones, M.M. Silva, and S. Lanceros-Méndez. Li-ion
battery separator membranes based on poly(vinylidene fluoride-
trifluoroethylene)/carbon nanotube composites. Solid State Ionics, 2013. 249–250:
p. 63-71.


5 – POROUS MEMBRANES OF CNT/P(VDF-TrFE)
75
5.1. Introduction
Lithium-ion rechargeable battery technology has conquered the market for
handheld devices such as laptop computers, cell phones, cameras and other wireless
electronics and still presents an increasing market growth [1-3]. Lithium ion batteries
provide high energy density (210 Wh/kg; 650 Wh/l), show flexible and lightweight
design and longer lifespan when compared to other competing systems such as the ones
based on lead-acid, nickel-cadmium (Ni-Cd) or nickel-metal hydride (Ni-MH) [4].
However, their performance is still not enough for the needs of the automobile industry
market, their safety and efficiency should be improved for large scale productions, the
systems degrade over time and lose efficiency and some components are still expensive
[1, 3, 5]. Furthermore, using lithium as the negative metal in secondary cells can be a
problem due to the reactivity with the electrolyte components. Two solutions have been
proposed for this issue: the use of polymer electrolytes and the use of graphitic carbon
electrodes [6].
The main constituents of a lithium ion battery are the anode – the source of
lithium ions, the cathode – the sink of lithium ions and the electrolyte/separator – often
in the form of a porous membrane (solid polymer electrolyte – SPE) that provides the
separation between the electrodes and a path for ionic conduction [2-3, 7]. The role of
the separator is extremely important in the operation of a battery by separating the two
electrodes and thus avoiding short circuits. Moreover it allows the flow of ions during
operation of the cell [2]. A SPE must meet certain requirements such as being an
electronic insulator, ionic conductor, mechanically strong, dimensionally stable, readily
wetted by the electrolyte and chemically resistant to electrolyte and impurity
degradation, among others [2, 7]. Polymers can meet these demands and the matrices
most often used as SPE are poly(ethylene oxide) (PEO) [8-11], poly(acrylonitrile)
(PAN) [12-13] and poly(vinylidene fluoride) (PVDF) and its copolymers [14-17].
PVDF and poly(vinylidene fluoride-co-trifluoroethylene) (P(VDF-TrFE))
copolymers have been investigated as SPE due to their high polarity, controllable
porosity, good mechanical properties, wettability by organic solvents, chemical
inertness, good contact with the electrodes and electrolyte stability in cathodic
environment [15, 18-20].
P(VDF-TrFE) is highly polar with a ferroelectric to paraelectric (FE-PE)
transition which occurs at a Curie temperature (Tc) below the melting temperature (Tm)

5 – POROUS MEMBRANES OF CNT/P(VDF-TrFE)
76
and crystallizes in the polar phase, which strongly improves electrolyte uptake and ionic
conduction of the polymer, when the polymer is prepared from the melt or by solution
casting [21]. SPE based on P(VDF-TrFE) have been studied from different approaches:
porous membranes prepared by solvent casting with Li ions introduced by uptake and
composites prepared with Li salts introduced within polymer matrix [15, 22]. Results
show that ionic conductivity is closely related to the porosity and pore size, which in
turn is related to the electrolyte uptake ability.
The incorporation of suitable fillers in polymer matrixes, such as carbon
nanotubes (CNT) [23], zeolites [20], ceramics and clays [19, 24-25], among others, has
been shown to be an interesting approach to improve the mechanical, thermal and
chemical stability and electrolyte uptake of SPE. The most relevant properties of CNT
are their high surface area, high electrical conductivity and excellent thermal and
mechanical properties [26-27]. CNT/polymer composite membranes have been
suggested for different purposes such as filtration [28] sensing and monitoring systems
[29], among others. In the particular case of batteries, CNT have been mainly used for
electrode fabrication [30-34] and recently for battery separators. For separator
membranes, the CNT content must be below the electrical percolation threshold, due to
the need to obtain electronically insulator membranes with suitable ionic conductivity
[35]. A recent study [11] reports the preparation of composite polymer electrolytes
based on PEO, CNT, LiPF6 and EC with an ionic conductivity in the order of 10-3
S/cm for 5 wt% content of CNT, which corresponds to an increase of 5 orders of
magnitude with respect to the values of the pristine polymer.
The successful use of fillers reported in previous works [19-20], reinforce the
relevance of this study to investigate the suitability of multiwall carbon nanotube,
MWCNT, for the preparation of porous membranes based on MWCNT/P(VDF-TrFE)
with improved electrolyte uptake, thermomechanical and electrical properties. Further,
SPE filled with CNT can also improve compatibility of the separator membrane with
the battery electrodes due to the carbonaceous nature of some of them [36-37].

5 – POROUS MEMBRANES OF CNT/P(VDF-TrFE)
77
5.2. Results and discussion
5.2.1. MWCNT type and concentration
The choice of MWCNT was based on the characteristics (table 5.1) and electrical
performance evaluated in previous works [38]. The MWCNT content in the samples
was below the percolation threshold (figure 5.1) in order to ensure that membranes are
electrically insulating.
Table 5.1: Characteristics of the MWCNT.
Diameter (nm) Length (m) Purity (%)
Baytubes C 150 P (MWCNT_B) 13 – 16 (outer) 1 – > 10 > 95
NC 3100 NanocylTM (MWCNT_N) 9.5 1.5 > 95
0.0 0.2 0.4 0.6 0.8 1.010
-11
10-9
10-7
10-5
10-3
10-1
MWCNT_N
MWCNT_B
(
S/c
m)
MWCNT content (%)
Figure 5.1: DC conductivity as function of filler amount for the different MWCNT used at room temperature.
Figure 5.1 shows the electrical conductivity of both MWCNT/PVDF composites
as a function of the MWCNT content. The percolation threshold concentration of
MWCNT_N is below 0.2 wt% whereas for MWCNT_B it is below 0.5 wt%. The
different dimensions of the MWCNT (table 5.1) results in different overall aspects
ratios, which influences the electrical properties of the composites [39], as observed in
figure 5.1. The experimental trends in the composites of both types of MWCNT are
similar and therefore the following sections will focus on the results obtained for the

5 – POROUS MEMBRANES OF CNT/P(VDF-TrFE)
78
MWCNT_B. A comparison of the performance of both MWCNT types will be provided
in the final section.
5.2.2. Microstructural characteristics
It has been shown that pristine P(VDF-TrFE) membranes produced under suitable
solvent evaporation conditions gives origin to porosity and pore configurations
appropriate for lithium ion batteries applications [15]. This characteristic porous
microstructure has been explained by the spinodal decomposition of the liquid-liquid
phase separation followed by crystallization of the copolymer rich phase [40].
Figure 5.2 shows the cross section scanning electron microscopy (SEM) images of
the MWCNT/P(VDF-TrFE) composites with different MWCNT contents and the
histograms of the pore size diameter as obtained from the SEM images.
0 2 4 6 8 10 12 14 16 180
2
4
6
8
10
12
14
16c)
9.0±3.1 m
Nu
mb
er
of co
un
ts
Pore size (m)
20 30 40 50 60 70 800
1
2
3
4
5
6
7
8
9
10 d)48.9±12.1 m
Nu
mb
er
of co
un
ts
Pore size (m)
Figure 5.2: Cross section SEM images and histograms of pore size diameter of the MWCNT/P(VDF-TrFE) composites with different filler content: a) and c) 0.0 wt%, b) and d) 0.5 wt%.
The inclusion of MWCNT in the membranes does not affect the distribution of
pores, the porous microstructure remaining homogeneous after the addition of fillers.
The average pore diameter increases from 9 to 60 m for 0.0 and 0.1 wt% content of

5 – POROUS MEMBRANES OF CNT/P(VDF-TrFE)
79
MWCNT, respectively, decreasing for higher filler contents, due to the filler effect on
the bi-phase solvent-polymer phase diagram and therefore on the phase separation and
solvent evaporation processes.
Figure 5.3 shows the porosity and electrolyte solution uptake as a function of
MWCNT content.
0.0 0.1 0.2 0.3 0.4 0.545
50
55
60
65
70
75
80
85
90
Porosity
Uptake
MWCNT content (%)
Po
rosity (
%)
210
220
230
240
250
260
270
280
290
Up
take
(%
)
Figure 5.3: Porosity and electrolyte uptake as function of MWCNT content for membranes with different content of fillers.
The porosity and electrolyte solution uptake increase with increasing filler content
but in different ways: whereas the porosity shows just a smaller increase from 70 to 80
% for increasing filler content from 0 to 0.5 wt%, the uptake shows a stronger increase
from 55 up to 80 %, indicating a strong interaction of the MWCNT with the solution.
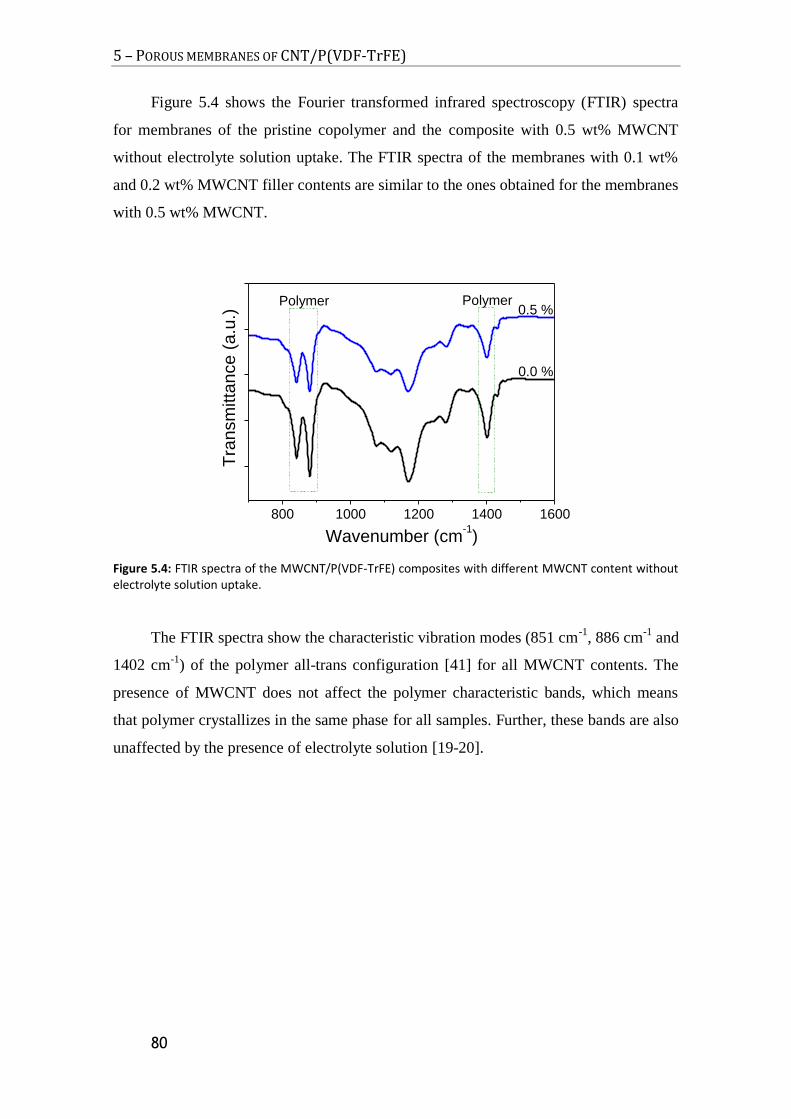
5 – POROUS MEMBRANES OF CNT/P(VDF-TrFE)
80
Figure 5.4 shows the Fourier transformed infrared spectroscopy (FTIR) spectra
for membranes of the pristine copolymer and the composite with 0.5 wt% MWCNT
without electrolyte solution uptake. The FTIR spectra of the membranes with 0.1 wt%
and 0.2 wt% MWCNT filler contents are similar to the ones obtained for the membranes
with 0.5 wt% MWCNT.
800 1000 1200 1400 1600
PolymerPolymer
0.0 %
0.5 %
Tra
nsm
itta
nce
(a
.u.)
Wavenumber (cm-1)
Figure 5.4: FTIR spectra of the MWCNT/P(VDF-TrFE) composites with different MWCNT content without electrolyte solution uptake.
The FTIR spectra show the characteristic vibration modes (851 cm-1
, 886 cm-1
and
1402 cm-1
) of the polymer all-trans configuration [41] for all MWCNT contents. The
presence of MWCNT does not affect the polymer characteristic bands, which means
that polymer crystallizes in the same phase for all samples. Further, these bands are also
unaffected by the presence of electrolyte solution [19-20].

5 – POROUS MEMBRANES OF CNT/P(VDF-TrFE)
81
Figure 5.5 shows the room temperature ionic conductivity (σi) and tortuosity (τ) of
the membranes soaked with the electrolyte solution as function of MWCNT content, as
calculated by equations 2.5 and 2.6, respectively.
0.0 0.1 0.2 0.3 0.4 0.5
5.0x10⁻⁷
1.0x10⁻⁶
1.5x10⁻⁶
2.0x10⁻⁶
i
MWCNT content (%)
i (
S/c
m)
60
80
100
120
140
160
Figure 5.5: Room temperature ionic conductivity and tortuosity of membranes + 1 M LiClO4.3H2O; σ0 (S/cm) = 9.8 mS/cm at 25 ºC.
The ionic conductivity (figure 5.5) increases with increasing MWCNT content up
to 0.2 wt%, which is attributed to the increase in porosity and electrolyte uptake, as well
as the increase of the amorphous phase fraction present in the polymer membrane as
observed by differential scanning calorimetry (DSC) (figure 5.6 and table 5.2) [42]. The
decrease of the conductivity for larger filler contributions is attributed to the increasing
tortuosity which counteracts the increase in conductivity due to the presence of the
conductive fillers.
The tortuosity (figure 5.5) is a property of a porous medium which describes the
pore connectivity of a solid and is frequently determined through the effective
conductivity [2]. The tortuosity of the membranes with 0.1 and 0.2 wt% filler content is
lower than for the pure polymer, leading to an increase in the conductivity of the
composites due to the presence of the fillers. For the membrane with 0.5 wt% of
MWCNT the tortuosity is higher than that of the pristine one and the effective
conductivity lower, indicating that pore blockage begins to occur at this concentration.
Tortuosity 1 describes an ideal porous body and higher values refer to more hindered
systems leading to higher resistance [2, 43]. Regarding to the tortuosity, the ideal
MWCNT concentration is thus between 0.1 and 0.2 wt%. The effective conductivity
varies inversely of tortuosity, reaching its maximum for 0.2 wt% filler content.

5 – POROUS MEMBRANES OF CNT/P(VDF-TrFE)
82
5.2.3. Thermal and mechanical properties
Figure 5.6 illustrates the DSC thermograms of the membranes without electrolyte
solution uptake.
80 100 120 140 160 180
Tm
Tc
0.0 %
endo
.
1 W
/g
0.1 %
0.2 %
0.5 %
Q (
W/g
)
Temperature (ºC)
Figure 5.6: DSC thermograms of the MWCNT/P(VDF-TrFE) composites for the different filler contents without electrolyte solution uptake.
The DSC thermograms (figure 5.6) show the characteristic ferroelectric-
paraelectric phase transition (lower temperature peak, Tc) around 117 ºC and the
melting temperature of the polymer (higher temperature peak, Tm) around 146 ºC [44].
Thermograms show that the presence of MWCNT does not affect significantly the FE-
PE transition and the melting temperature of the paraelectric phase. These parameters
are also unaffected by the presence of the electrolyte solution as observed already with
different fillers [19-20].
Table 5.2 shows the degree of crystallinity for the MWCNT/P(VDF-TrFE)
membranes as a function of filler content.
Table 5.2: Degree of crystallinity of the membranes calculated by applying equation 2.1 to the melting peak of the samples
Sample c ± 2 (%)
0.0 % 28
0.1 % 31
0.2 % 22
0.5 % 23
The degree of crystallinity has a slight tendency to decrease with increasing filler
content. The addiction of MWCNT induces a defective crystallization of the polymer at

5 – POROUS MEMBRANES OF CNT/P(VDF-TrFE)
83
the contact zones with MWCNT, due to changes in the nucleation and growth kinetics
[45].
The mechanical properties are essential for the safe handling and mechanical
stability of the battery [7]. Figure 5.7 shows the stress-strain curves for the
MWCNT/P(VDF-TrFE) membranes with different fillers content without (figure 5.7a)
and with (figure 5.7b) electrolyte solution uptake.
The main mechanical characteristics of the composites are summarized in table
5.3 as obtained from the data of figure 5.7.
0 100 200 300 400
0
1
2
3
4
a)
Strain (%)
0.0 %
0.1 %
0.2 %
0.5 %
Str
ess (
MP
a)
0 100 200 300 400
0.0
0.5
1.0
1.5
2.0
b)
Strain (%)
0.0 %
0.1 %
0.2 %
0.5 %
Str
ess (
MP
a)
Figure 5.7: Stress-strain curves of the MWCNT/P(VDF-TrFE) composites with different filler contents: a) without electrolyte solution uptake; b) with electrolyte solution uptake.
Table 5.3: Mechanical properties of the MWCNT/P(VDF-TrFE) membranes with and without electrolyte solution uptake.
Without electrolyte uptake With electrolyte uptake
Sample 0.0 % 0.1 % 0.2 % 0.5 % 0.0 % 0.1 % 0.2 % 0.5 %
Yield stress (MPa) 2.1 2.2 1.9 1.7 0.3 0.2 0.2 0.2
Elastic modulus (MPa) 40.0 40.2 41.2 41.6 1.9 1.5 1.0 1.4
Figure 5.7 and table 5.3 show that the addition of MWCNT does not affect
significantly the overall mechanical properties of the membranes. The elastic modulus
and the yield stress remain in the same value range after the inclusion of MWCNT,
indicating that the mechanical properties are still determined by the microporous
microstructure of the samples. However, there is a decrease in the yield stress and
elastic modulus of the samples after electrolyte solution uptake, attributed to the larger
uptake and swelling verified in all samples.

5 – POROUS MEMBRANES OF CNT/P(VDF-TrFE)
84
5.2.4. Electrical properties
Electrochemical impedance spectroscopy (EIS) was performed to evaluate the
electrochemical properties of the samples after electrolyte solution uptake [46]. The
results are shown trough the Nyquist plots (imaginary impedance Z’’ as function of real
impedance Z’) and Bode plots (impedance modulus |Z| and phase angle as function of
frequency). Figure 5.8 presents the Nyquist plots for all samples after electrolyte uptake
at 25 ºC (figure 5.8a) as well as the Bode plots (figure 5.8b and 5.8c).
0 2000 4000 6000 8000
0
2000
4000
6000
8000
10000
12000
a)
-Z''
()
Z' ()
0.0 %
0.1 %
0.2 %
0.5 %
100
101
102
103
104
105
0
3000
6000
9000
12000
15000
b)
|Z| (
)
Frequency (Hz)
0.0 %
0.1 %
0.2 %
0.5 %
100
101
102
103
104
105
0
-10
-20
-30
-40
-50
-60
-70
-80
c)
Phase a
ngle
(deg)
Fequency (Hz)
0.0 %
0.1 %
0.2 %
0.5 %
Figure 5.8: a) Nyquist plot and b-c) Bode diagram of the MWCNT/P(VDF-TrFE) composites for different filler content at 25 ºC.
The Nyquist plot (figure 5.8a) shows that the inclusion of MWCNT attenuates the
semicircle corresponding to the charge transfer process, indicating that the presence of
the fillers facilitates the charge transfer process due to the increasing electrical
conductivity [47].
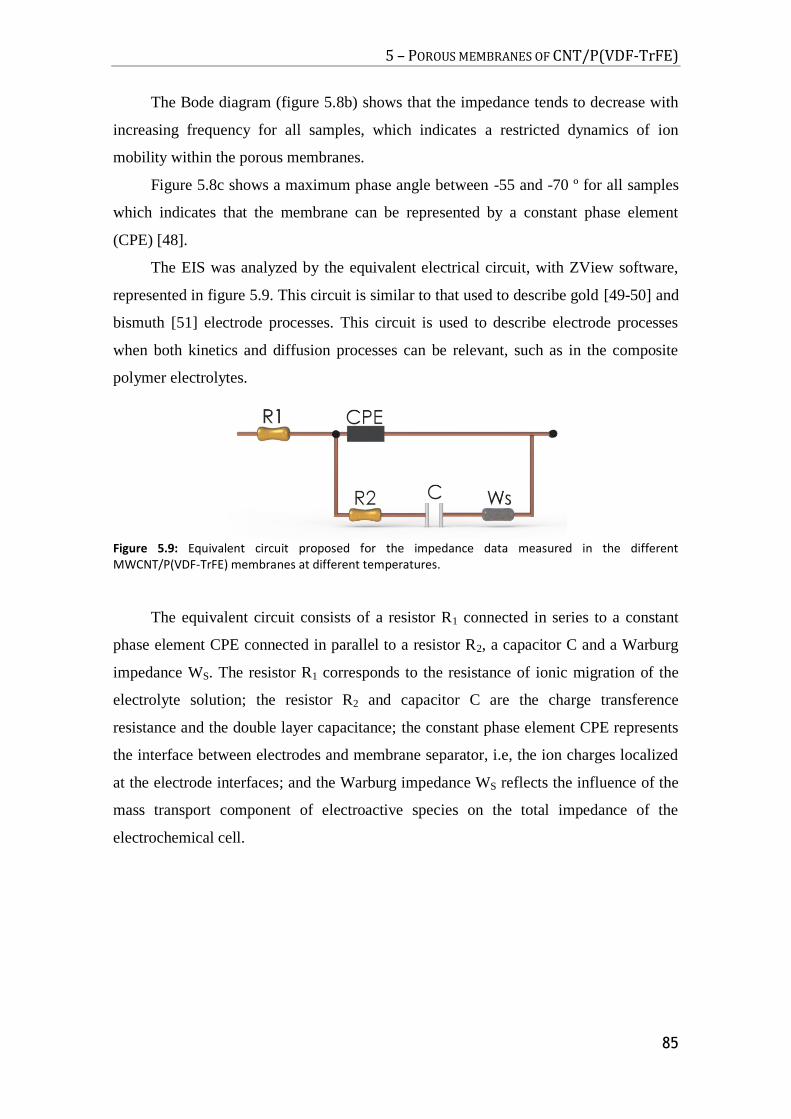
5 – POROUS MEMBRANES OF CNT/P(VDF-TrFE)
85
The Bode diagram (figure 5.8b) shows that the impedance tends to decrease with
increasing frequency for all samples, which indicates a restricted dynamics of ion
mobility within the porous membranes.
Figure 5.8c shows a maximum phase angle between -55 and -70 º for all samples
which indicates that the membrane can be represented by a constant phase element
(CPE) [48].
The EIS was analyzed by the equivalent electrical circuit, with ZView software,
represented in figure 5.9. This circuit is similar to that used to describe gold [49-50] and
bismuth [51] electrode processes. This circuit is used to describe electrode processes
when both kinetics and diffusion processes can be relevant, such as in the composite
polymer electrolytes.
Figure 5.9: Equivalent circuit proposed for the impedance data measured in the different MWCNT/P(VDF-TrFE) membranes at different temperatures.
The equivalent circuit consists of a resistor R1 connected in series to a constant
phase element CPE connected in parallel to a resistor R2, a capacitor C and a Warburg
impedance WS. The resistor R1 corresponds to the resistance of ionic migration of the
electrolyte solution; the resistor R2 and capacitor C are the charge transference
resistance and the double layer capacitance; the constant phase element CPE represents
the interface between electrodes and membrane separator, i.e, the ion charges localized
at the electrode interfaces; and the Warburg impedance WS reflects the influence of the
mass transport component of electroactive species on the total impedance of the
electrochemical cell.

5 – POROUS MEMBRANES OF CNT/P(VDF-TrFE)
86
This equivalent circuit was fitted to the impedance results of all samples. The
results for sample with 0.2 wt% filler content are presented in figure 5.10.
0 1000 2000 3000 4000 5000 6000
0
1000
2000
3000
4000
5000
6000
7000
0.2 %
Fit
- Z
'' (
)
Z' ()
Figure 5.10: Nyquist plot for the experimental data and fitting for the equivalent circuit of figure 5.9 for membrane with 0.2 wt% of MWCNT at 50 ºC.
The remaining composite membranes also present similar good fits for the
equivalent circuit represented in figure 5.9. The best equivalent circuit fitted for the
pristine polymer is the Randles circuit as reported in [52].
Table 5.4 shows the fitting parameters of the equivalent electrical circuit for all
composite membranes with different MWCNT contents at 50 ºC.
Table 5.4: Equivalent circuit parameters for MWCNT/P(VDF-TrFE) membranes at 50 ºC.
0.1 % 0.2 % 0.5 %
C (10-6 F) 49.80 55.40 1.09
R1 () 40.63 22.23 31.45
R2 () 3308.5 3362.7 336.18
WS () 28194 17471 4208.4
CPE (10-6 F) 5.76 7.12 37.1
n1 0.83 0.82 0.60
All fitted parameter values decrease with increasing filler content, except for the
CPE element. The increase of the parameters C, R1, R2 and WS is due to the increasing
conductivity originated by the increasing filler content. The increase of the CPE value
results from the increase of the interface charges between electrodes and composite
membrane.

5 – POROUS MEMBRANES OF CNT/P(VDF-TrFE)
87
Figure 5.11 presents the ionic conductivity as a function of temperature with and
without electrolyte solution uptake for all the membranes.
2.6 2.8 3.0 3.2 3.4-13
-12
-11
-10
-9
-8
-7
-6
a)
1000/T (K-1)
0.0 %
0.1 %
0.2 %
0.5 %
Log
i (S
/cm
)
2.8 3.0 3.2 3.4-7
-6
-5
-4
b)
1000/T (K-1)
0.0 %
0.1 %
0.2 %
0.5 %
Log
i (S
/cm
)
Figure 5.11: Log i as a function of 1000/T for MWCNT/P(VDF-TrFE) composites: a) without electrolyte solution uptake; b) with electrolyte solution uptake.
In figure 5.11a, the composite samples show higher ionic conductivity as
compared to the pristine one, being about one order of magnitude higher for 0.2 wt%
MWCNT filled composite. Membranes with electrolyte solution uptake (figure 5.11b)
have an ionic conductivity about 4 orders of magnitude higher than that without
electrolyte solution and are more stable as a function of temperature. This thermal
stability is achieved for MWCNT contents significantly lower than the ones reported in
[11]. The pure polymer shows higher ionic conductivity than the composites but is
strongly dependent on temperature. The inclusion of CNT improves significantly the
electrical properties of the membranes due of the low activation energy of conduction
(table 5.5), almost eliminating the dependence of the conductivity with temperature, fact
which is very convenient for battery applications. Further, the electrolyte solution does
not affect the thermal stability of the polymer as determined by thermo gravimetric
analysis TGA [15].

5 – POROUS MEMBRANES OF CNT/P(VDF-TrFE)
88
Table 5.5 shows the activation energy (Ea) for the ion transport, calculated by
fitting with the Arrhenius equation (equation 2.7) to data of figure 5.11.
Table 5.5: Activation energies for all membranes with and without electrolyte solution uptake.
Samples Ea without electrolyte
solution (kJ/mol) Ea with electrolyte solution (kJ/mol)
0.0 % 181 64
0.1 % 10 5
0.2 % 45 7
0.5 % 11 8
The activation energy shows a strong dependence with the MWCNT content and
also with the electrolyte solution uptake. The addition of fillers and the electrolyte
solution lead to a significant decrease of the Ea. The presence of fillers decreases
significantly the energy required for the ionic conduction process, due to the decrease of
the crystalline phase fraction and the increase of the free volume of the polymer, leading
to higher ion mobility.
To evaluate the electrochemical stability and diffusion coefficients of the
membranes, cyclic voltammetry over the potential range -2.0 to 6.0 V was carried out
after electrolyte solution uptake. The wide voltage window of electrochemical stability
of the membranes immersed in the electrolyte solution is observed in the figure 5.12.
-2 0 2 4 6
-5.0x10⁻⁸
0.0
5.0x10⁻⁸
1.0x10⁻⁷
1.5x10⁻⁷
2.0x10⁻⁷
a)
E vs Li/Li+ (V)
0.0 %
0.1 %
0.2 %
0.5 %
I (A
)
-2 0 2 4 6
-5.0x10⁻⁸
0.0
5.0x10⁻⁸
1.0x10⁻⁷
1.5x10⁻⁷
2.0x10⁻⁷
b)
E vs Li/Li+ (V)
0.05 V/s
0.1 V/s
0.5 V/s
1 V/s
I (A
)
Figure 5.12: a) Voltammogram of MWCNT/P(VDF-TrFE) composites at 0.1 V/s; b) voltammogram of MWCNT/P(VDF-TrFE) with 0.5 wt% of MWCNT at different scanning rates.

5 – POROUS MEMBRANES OF CNT/P(VDF-TrFE)
89
The voltammogram of figure 5.12a shows that the membranes with MWCNT are
more stable than the pure polymer. The operation window, between -2.0 and 4.0 V, is
more stable for MWCNT/P(VDF-TrFE) membranes. In figure 5.12a it is observed a
good electrochemical stability independently of MWCNT filler content, with anodic
potentials higher than 4.0 V and oxidation peak around 1.0 V. The anodic current onset
may be associated with the decomposition of the polymer electrolyte.
The electrochemical deposition of lithium salts is observed in the cathodic current
onset at about 1.0 V in figure 5.12a.
For high scanning rates above 0.5 V/s it is detected the presence of multiples
cathodic peaks starting from 4.0 V due to the electrodeposition of the cation on the
lithium substrate (figure 5.12 b). On the other hand, figure 5.12b demonstrates that the
scan rate does not affect significantly the electrochemical stability of the composite
membranes, the stable operation window remaining in the same value range for all
scanning rates; although the cathodic peaks tend to increase with increasing scan rate.
From voltammograms can be inferred that the addition of MWCNT improves the
electrochemical stability of the membranes; however the stable operation window is still
essentially determined by the electrolyte solution. The diffusion coefficient, calculated
from the voltammograms of figure 5.12 does not show dependence with filler content.
The pure polymer presents the lowest value of 3.4510-5
cm2/s and the membrane
with 0.2 wt% of MWCNT presents the highest value of 3.8410-5
cm2/s.

5 – POROUS MEMBRANES OF CNT/P(VDF-TrFE)
90
5.2.5. MWCNT type comparison
In order to evaluate the influence of the MWCNT type in the membranes
performance, two filler concentrations were compared.
Figure 5.13 shows the mechanical (figure 5.13a) and electrical properties
(impedance spectroscopy: figure 5.13b and c; cyclic voltammetry: figure 5.13d) of the
membranes with different MWCNT types and contents.
0 100 200 300 400
0.0
0.5
1.0
1.5
2.0
a)
Strain (%)
0.1 %_MWCNT_N
0.2 %_MWCNT_N
0.1 %_MWCNT_B
0.2 %_MWCNT_B
Str
ess (
MP
a)
0 2000 4000 6000 8000
0
2000
4000
6000
8000
10000
12000
b)
-Z''
()
Z' ()
0.1 %_MWCNT_N
0.2 %_MWCNT_N
0.1 %_MWCNT_B
0.2 %_MWCNT_B
2.8 3.0 3.2 3.4-7.0
-6.5
-6.0
-5.5
-5.0
-4.5
c)
1000/T (K-1)
0.1 %_MWCNT_N
0.2 %_MWCNT_N
0.1 %_MWCNT_B
0.2 %_MWCNT_B
Log
i (S
/cm
)
-2 0 2 4 6
-3.0x10⁻⁷
-2.0x10⁻⁷
-1.0x10⁻⁷
0.0
1.0x10⁻⁷
2.0x10⁻⁷
3.0x10⁻⁷
4.0x10⁻⁷
d)
E vs Li/Li+ (V)
0.1 %_MWCNT_N
0.2 %_MWCNT_N
0.1 %_MWCNT_B
0.2 %_MWCNT_B
I (A
)
Figure 5.13: a) Stress-strain curves of the MWCNT/P(VDF-TrFE) membranes with electrolyte uptake; b)
Nyquist plot of the MWCNT/P(VDF-TrFE) composites with electrolyte uptake at 25 ºC; c) Log i as a function of 1000/T for MWCNT/P(VDF-TrFE) composites with electrolyte uptake; d) Voltammograms of the MWCNT/P(VDF-TrFE) membranes with electrolyte uptake at 0.5 V/s.
Figure 5.13a illustrates that the overall mechanical properties are similar for all
samples. The MWCNT_N presents a slightly improvement in the elastic modulus and in
the yield stress, which is not significant in the overall mechanical performance.

5 – POROUS MEMBRANES OF CNT/P(VDF-TrFE)
91
In the Nyquist plot of figure 5.13b it is shown that the impedance behaviour is
similar for all composite membranes, the charge diffusion not depending on MWCNT
type. The ionic conductivity (figure 5.13c) is also analogous for all samples, as well as
the cyclic voltammetry (figure 5.13d). In the latter case, just the sample with 0.1 % filler
content of MWCNT_N shows a more intense oxidation peak around 1.0 V.
From these graphs can be concluded that the type of MWCNT considered in this
work does not affect significantly the overall performance of the membranes as battery
separator.
5.4. Conclusion
MWCNT/P(VDF-TrFE) porous membranes with different contents of MWCNT
were prepared by thermally induced phase separation (TIPS). The addition of MWCNT
to the polymer matrix increases the average pore size, leading to an increase in the
porosity up to 82 % and electrolyte solution uptake up to 275 % for 0.5 wt%
MWCNT filler content membranes. The polymer crystallizes in the polar phase after the
inclusion of MWCNT, and the ferroelectric to paraelectric transition and melting
temperatures remain at similar values of pristine polymer. The degree of crystallinity
decreases to 23 % for 0.5 wt% filler content composite. The tortuosity increases with
increasing filler content up to 0.2 wt% of MWCNT. The overall membrane mechanical
properties are not significantly affected by the presence of MWCNT. The ionic
conductivity increases with increasing MWCNT content, from 510-7
to 210-6
S/cm
for 0 and 0.1 wt%, respectively, and is more stable to temperature variations. The
electrochemical stability evaluated by cyclic voltammetry revealed a stable operation
window between -2.0 and 4.0 V, versus Li/Li+.
The mechanical properties, ionic conductivity and the thermal electrochemical
and stabilities of the polymer membranes are independently of the type of the MWCNT
used in this work.
The results show that MWCNT/P(VDF-TrFE) composite membranes have
adequate morphological, thermal, mechanical and electrochemical properties for being
used as separator membranes for lithium ion batteries.

5 – POROUS MEMBRANES OF CNT/P(VDF-TrFE)
92
5.5. References
1. Tarascon, J.-M. Key challenges in future Li-battery research. Philosophical
Transactions of the Royal Society A: Mathematical, Physical and Engineering
Sciences, 2010. 368(1923): p. 3227-3241.
2. Arora, P. and Z. Zhang. Battery Separators. Chemical Reviews, 2004. 35(50): p.
4419-4462.
3. Whittingham, M.S. Lithium Batteries and Cathode Materials. Chemical
Reviews, 2004. 104(10): p. 4271-4302.
4. Tarascon, J.M. and M. Armand. Issues and challenges facing rechargeable
lithium batteries. Nature, 2001. 414(6861): p. 359-367.
5. Zhang, J. and J. Lee. A review on prognostics and health monitoring of Li-ion
battery. Journal of Power Sources, 2011. 196(15): p. 6007-6014.
6. Vincent, C.A. Lithium batteries: a 50-year perspective, 1959–2009. Solid State
Ionics, 2000. 134(1–2): p. 159-167.
7. Huang, X. Separator technologies for lithium-ion batteries. Journal of Solid
State Electrochemistry, 2011. 15(4): p. 649-662.
8. Kim, D.-W., J.-M. Ko, J.-H. Chun, S.-H. Kim, and J.-K. Park. Electrochemical
performances of lithium-ion cells prepared with polyethylene oxide-coated
separators. Electrochemistry Communications, 2001. 3(10): p. 535-538.
9. Persi, L., F. Croce, B. Scrosati, E. Plichta, and M.A. Hendrickson. Poly(ethylene
oxide)-Based, Nanocomposite Electrolytes as Improved Separators for
Rechargeable Lithium Polymer Batteries. Journal of The Electrochemical
Society, 2002. 149(2): p. A212-A216.
10. Wang, C., Y. Wei, G.R. Ferment, W. Li, and T. Li. Poly(ethylene oxide)–silica
hybrid materials for lithium battery application. Materials Letters, 1999. 39(4):
p. 206-210.
11. Ibrahim, S., S.M.M. Yasin, M.N. Ng, R. Ahmad, and M.R. Johan. Impedance
spectroscopy of carbon nanotube/solid polymer electrolyte composites. Solid
State Communications, 2011. 151(23): p. 1828-1832.
12. Cho, T.H., T. Sakai, S. Tanase, K. Kimura, Y. Kondo, T. Tarao, and M. Tanaka.
Electrochemical performances of polyacrylonitrile nanofiber-based nonwoven
separator for lithium-ion battery. Electrochemical and Solid State Letters, 2007.
10(7): p. A159-A162.
13. Huai, Y., J. Gao, Z. Deng, and J. Suo. Preparation and characterization of a
special structural poly(acrylonitrile)-based microporous membrane for lithium-
ion batteries. Ionics, 2010. 16(7): p. 603-611.

5 – POROUS MEMBRANES OF CNT/P(VDF-TrFE)
93
14. Cheng, C.L., C.C. Wan, and Y.Y. Wang. Preparation of porous, chemically
cross-linked, PVdF-based gel polymer electrolytes for rechargeable lithium
batteries. Journal of Power Sources, 2004. 134(2): p. 202-210.
15. Costa, C.M., L.C. Rodrigues, V. Sencadas, M.M. Silva, J.G. Rocha, and S.
Lanceros-Méndez. Effect of degree of porosity on the properties of
poly(vinylidene fluoride–trifluorethylene) for Li-ion battery separators. Journal
of Membrane Science, 2012. 407–408(0): p. 193-201.
16. Stephan, A.M., K.S. Nahm, M. Anbu Kulandainathan, G. Ravi, and J. Wilson.
Poly(vinylidene fluoride-hexafluoropropylene) (PVdF-HFP) based composite
electrolytes for lithium batteries. European Polymer Journal, 2006. 42(8): p.
1728-1734.
17. Wachtler, M., D. Ostrovskii, P. Jacobsson, and B. Scrosati. A study on PVdF-
based SiO2-containing composite gel-type polymer electrolytes for lithium
batteries. Electrochimica Acta, 2004. 50(2–3): p. 357-361.
18. Djian, D., F. Alloin, S. Martinet, and H. Lignier. Macroporous poly(vinylidene
fluoride) membrane as a separator for lithium-ion batteries with high charge
rate capacity. Journal of Power Sources, 2009. 187(2): p. 575-580.
19. Nunes-Pereira, J., A.C. Lopes, C.M. Costa, R. Leones, M.M. Silva, and S.
Lanceros-Méndez. Porous Membranes of Montmorillonite/Poly(vinylidene
fluoride-trifluorethylene) for Li-Ion Battery Separators. Electroanalysis, 2012.
24(11): p. 2147-2156.
20. Nunes-Pereira, J., A.C. Lopes, C.M. Costa, L.C. Rodrigues, M.M. Silva, and S.
Lanceros-Méndez. Microporous membranes of NaY zeolite/poly(vinylidene
fluoride–trifluoroethylene) for Li-ion battery separators. Journal of
Electroanalytical Chemistry, 2013. 689(0): p. 223-232.
21. Nalwa, H.S. Ferroelectric polymers : chemistry, physics, and applications.
1995, New York: Dekker.
22. Costa, C.M., A. California, V.F. Cardoso, V. Sencadas, L.C. Rodrigues, M.M.
Silva, and S. Lanceros-Méndez. Electroactive Poly(Vinylidene Fluoride-
Trifluorethylene) (PVDF-TrFE) Microporous Membranes for Lithium-Ion
Battery Applications. Ferroelectrics, 2012. 430(1): p. 103-107.
23. Jung, S., D. Kim, S. Lee, M. Cheong, D. Nguyen, B. Cho, and H. Kim. Fillers
for Solid-State Polymer Electrolytes : Highlight. Bull. Korean Chem. Soc.,
2009. 30(10): p. 2355-2361.
24. Hwang, H.-Y., D.-J. Kim, H.-J. Kim, Y.-T. Hong, and S.-Y. Nam. Effect of
nanoclay on properties of porous PVdF membranes. Transactions of Nonferrous
Metals Society of China, 2011. 21, Supplement 1(0): p. s141-s147.

5 – POROUS MEMBRANES OF CNT/P(VDF-TrFE)
94
25. Koh, M.J., H.Y. Hwang, D.J. Kim, H.J. Kim, Y.T. Hong, and S.Y. Nam.
Preparation and Characterization of Porous PVdF-HFP/clay Nanocomposite
Membranes. Journal of Materials Science & Technology, 2010. 26(7): p. 633-
638.
26. Dalmas, F., J.-Y. Cavaillé, C. Gauthier, L. Chazeau, and R. Dendievel.
Viscoelastic behavior and electrical properties of flexible nanofiber filled
polymer nanocomposites. Influence of processing conditions. Composites
Science and Technology, 2007. 67(5): p. 829-839.
27. O'Connell, M. Carbon nanotubes : properties and applications. 2006, Boca
Raton, FL: CRC/Taylor & Francis.
28. Ahn, C.H., Y. Baek, C. Lee, S.O. Kim, S. Kim, S. Lee, S.-H. Kim, S.S. Bae, J.
Park, and J. Yoon. Carbon nanotube-based membranes: Fabrication and
application to desalination. Journal of Industrial and Engineering Chemistry,
2012. 18(5): p. 1551-1559.
29. de Lannoy, C.F., D. Jassby, D.D. Davis, and M.R. Wiesner. A highly electrically
conductive polymer–multiwalled carbon nanotube nanocomposite membrane.
Journal of Membrane Science, 2012. 415–416(0): p. 718-724.
30. Hu, L., H. Wu, F. La Mantia, Y. Yang, and Y. Cui. Thin, Flexible Secondary Li-
Ion Paper Batteries. ACS Nano, 2010. 4(10): p. 5843-5848.
31. Goyal, A., A.L.M. Reddy, and P.M. Ajayan. Flexible Carbon Nanotube–Cu2O
Hybrid Electrodes for Li-Ion Batteries. Small, 2011. 7(12): p. 1709-1713.
32. Lu, W., A. Goering, L. Qu, and L. Dai. Lithium-ion batteries based on
vertically-aligned carbon nanotube electrodes and ionic liquid electrolytes.
Physical Chemistry Chemical Physics, 2012. 14(35): p. 12099-12104.
33. Liu, X.-M., Z.d. Huang, S.w. Oh, B. Zhang, P.-C. Ma, M.M.F. Yuen, and J.-K.
Kim. Carbon nanotube (CNT)-based composites as electrode material for
rechargeable Li-ion batteries: A review. Composites Science and Technology,
2012. 72(2): p. 121-144.
34. Zou, M.-m., D.-j. Ai, and K.-y. Liu. Template synthesis of MnO2/CNT
nanocomposite and its application in rechargeable lithium batteries.
Transactions of Nonferrous Metals Society of China, 2011. 21(9): p. 2010-2014.
35. Ahn, J.-H., Y.-J. Kim, and G.X. Wang. Electrochemical properties of carbon
nanotube-dispersed PEO-LiX electrolytes. Metals and Materials International,
2006. 12(1): p. 69-73.
36. Guo, X., C. Wang, M. Chen, J. Wang, and J. Zheng. Carbon coating of
Li4Ti5O12 using amphiphilic carbonaceous material for improvement of lithium-
ion battery performance. Journal of Power Sources, 2012. 214(0): p. 107-112.

5 – POROUS MEMBRANES OF CNT/P(VDF-TrFE)
95
37. Sun, X., X. Wang, N. Feng, L. Qiao, X. Li, and D. He. A new carbonaceous
material derived from biomass source peels as an improved anode for lithium
ion batteries. Journal of Analytical and Applied Pyrolysis, 2013. 100(0): p. 181-
185.
38. Carabineiro, S.A.C., M.F.R. Pereira, J. Nunes-Pereira, J. Silva, C. Caparros, V.
Sencadas, and S. Lanceros-Méndez. The effect of nanotube surface oxidation on
the electrical properties of multiwall carbon nanotube/poly(vinylidene fluoride)
composites. Journal of Materials Science, 2012. 47(23): p. 8103-8111.
39. Shehzad, K., Z.-M. Dang, M.N. Ahmad, R.U.R. Sagar, S. Butt, M.U. Farooq,
and T.-B. Wang. Effects of carbon nanotubes aspect ratio on the qualitative and
quantitative aspects of frequency response of electrical conductivity and
dielectric permittivity in the carbon nanotube/polymer composites. Carbon,
2013. 54(0): p. 105-112.
40. Ferreira, A., J. Silva, V. Sencadas, J.L.G. Ribelles, and S. Lanceros-Méndez.
Poly[(vinylidene fluoride)-co-trifluoroethylene] Membranes Obtained by
Isothermal Crystallization from Solution. Macromolecular Materials and
Engineering, 2010. 295(6): p. 523-528.
41. Prabu, A.A., J.S. Lee, K.J. Kim, and H.S. Lee. Infrared spectroscopic studies on
crystallization and Curie transition behavior of ultrathin films of P(VDF/TrFE)
(72/28). Vibrational Spectroscopy, 2006. 41(1): p. 1-13.
42. Park, J.W., E.D. Jeong, M.-S. Won, and Y.-B. Shim. Effect of organic acids and
nano-sized ceramic doping on PEO-based solid polymer electrolytes. Journal of
Power Sources, 2006. 160(1): p. 674-680.
43. Quartarone, E., P. Mustarelli, and A. Magistris. Transport Properties of Porous
PVDF Membranes. The Journal of Physical Chemistry B, 2002. 106(42): p.
10828-10833.
44. Sencadas, V., S. Lanceros-Méndez, and J.F. Mano. Thermal characterization of
a vinylidene fluoride-trifluorethylene (75–25) (%mol) copolymer film. Journal of
Non-Crystalline Solids, 2006. 352(50–51): p. 5376-5381.
45. Costa, C.M., S. Firmino Mendes, V. Sencadas, A. Ferreira, R. Gregorio Jr, J.L.
Gómez Ribelles, and S. Lanceros-Méndez. Influence of processing parameters
on the polymer phase, microstructure and macroscopic properties of
poly(vinilidene fluoride)/Pb(Zr0.53Ti0.47)O3 composites. Journal of Non-
Crystalline Solids, 2010. 356(41–42): p. 2127-2133.
46. Brett, A.M.C.F.O. and C.M.A. Brett. Electroquímica: princípios, métodos e
aplicações. 1996, Coimbra: Livraria Almedina.
47. Ulaganathan, M. and S. Rajendran. Studies on MWCNT-Incorporated Composite
Polymer Electrolytes for Electrochemical Applications. Soft Materials, 2010.
8(4): p. 358-369.

5 – POROUS MEMBRANES OF CNT/P(VDF-TrFE)
96
48. Cole, K. Dispersion and Absorption in Dielectrics I. Alternating Current
Characteristics. J. Chem. Phys., 1941. 9(4): p. 341.
49. Bondarenko, A.S., G.A. Ragoisha, N.P. Osipovich, and E.A. Streltsov.
Potentiodynamic electrochemical impedance spectroscopy of lead upd on
polycrystalline gold and on selenium atomic underlayer. Electrochemistry
Communications, 2005. 7(6): p. 631-636.
50. Kerner, Z. and T. Pajkossy. Measurement of adsorption rates of anions on
Au(111) electrodes by impedance spectroscopy. Electrochimica Acta, 2002.
47(13–14): p. 2055-2063.
51. Nurk, G., H. Kasuk, K. Lust, A. Jänes, and E. Lust. Adsorption inetics of
dodecyl sulfate anions on the ismuth ( ) plane. Journal of Electroanalytical
Chemistry, 2003. 553(0): p. 1-19.
52. Costa, C.M., V. Sencadas, J.G. Rocha, M.M. Silva, and S. Lanceros-Méndez.
Evaluation of the main processing parameters influencing the performance of
poly(vinylidene fluoride–trifluoroethylene) lithium-ion battery separators.
Journal of Solid State Electrochemistry, 2013. 17(3): p. 861-870.

6 - Porous membranes of BaTiO3/P(VDF-TrFE)
This chapter is based on the following publication:
Nunes-Pereira, J., C.M. Costa, R.E. Sousa, A.V. Machado, M.M. Silva, and S.
Lanceros-Méndez. Li-ion battery separator membranes based on barium titanate and
poly(vinylidene fluoride-co-trifluoroethylene) Submited to Electrochimica Acta 2013.


6 – POROUS MEMBRANES OF BaTiO3/P(VDF-TrFE)
99
6.1. Introduction
Current lifestyle and technological advances, in particular in the area of mobile
communications, lead to an increased need and availability of stored energy [1-2].
Despite many emerging technologies, the most attractive way to store energy to provide
electrical power is to convert chemical into electrical energy. In this sense, lithium ion
secondary batteries are the systems with the best performance with higher working
voltage and energy density (210 Wh/kg; 650 Wh/l), longer service life and higher
flexibility design when compared to other systems such as lead-acid, nickel-cadmium
(Ni-Cd) or nickel-metal hydride (Ni-MH) batteries [1-4].
Up to know, the development of lithium secondary batteries has been mostly
focused on powering small electronic devices, but new developments are needed to
meet the requirements of new market trends, such as green energy, recycling and
flexibility, among others. One way to accomplish these requirements is the use of
polymers or organic/inorganic composites [2].
A battery is a device that converts stored chemical energy into electricity within a
closed system. Lithium ion batteries have three fundamental constituents, the negative
electrode (anode), the positive electrode (cathode) and the electrolyte within a separator.
Most Li-batteries use carbon as anode, metal oxides as cathode and organic solvents as
electrolyte solutions [2, 5]. The separator is often a porous polymer or ceramic
membrane placed between cathode and anode. It plays a key role in the battery
performance and safety, providing electrical insulation between electrodes and a
pathway for ionic conduction. An ideal separator should meet requirements such as
being electronic insulator, ionic conductor, mechanically strong, dimensionally stable,
readily wetted by electrolyte and chemically resistant to electrolyte and impurity
degradation, among others [2, 5-6]. Many polymers meet these demands and therefore
many studies have been developed for their use as separators: poly(ethylene oxide)
(PEO) [7-10], poly(acrylonitrile) (PAN) [11-12], polyimide (PI) [13] and
poly(vinylidene fluoride) (PVDF) and its copolymers [14-20].
PVDF and poly(vinylidene fluoride-co-trifluoroethylene) (P(VDF-TrFE)) have
attracted interest as battery separator due to its large polarity, controllable porosity,
suitable mechanical properties, wettability by organic solvents, chemically inertness,
good electrode/electrolyte contact and stability in cathodic environment [14-15, 21-22].

6 – POROUS MEMBRANES OF BaTiO3/P(VDF-TrFE)
100
In particular, P(VDF-TrFE) has high polarity and crystallizes in a polar phase
from the melt or by solution casting and its ferroelectric to paraelectric (FE-PE)
transition occurs at a Curie temperature (Tc) below the melting (Tm) [23].
Despite developments in polymer based separator membranes, there is large space
for improvement. In this way, the incorporation of suitable fillers in polymer matrixes
has become an interesting approach to improve mechanical, thermal and chemical
stability and electrolyte uptake of the separators. The use of carbon nanotubes [24-25],
zeolites [22], clays [21, 26], BaTiO3 [27-29] and others have been recently reported.
Ferroelectric ceramic fillers, as BaTiO3, enhance lithium interface stability, facilitate the
salt dissociation into charge species and improve the ionic conductivity, by increasing
the amorphous phase content of the polymers and the number of charge carriers [28].
BaTiO3 crystallizes in the perovskite structure [30] and has high dielectric
response at room temperature (ε’ =1200, Ø = 10 nm; ε’ = 3417, Ø = 500 nm) [31-32].
BaTiO3 exhibits five crystalline phases, hexagonal, cubic, tetragonal, orthorhombic,
monoclinic and rhombohedral depending on temperature [33].
Recent studies report on the use of polymeric composites with BaTiO3 as
separator membranes. The addition of this ceramic filler in a PEO/P(VDF-TrFE)
polymer blend increases the ionic conductivity up to 1.210-4
S/cm and the stable
operation window to a range of -2.3 to 2.4 V for 15 wt% of BaTiO3 [27]. Composites of
PEO with BaTiO3 also show high ionic conductivity, 1.510-5
S/cm, at room
temperature, and a stable operation window up to 4.1 V vs Li/Li+ at 80 ºC for 10 wt% of
fillers [29].
The successful use of the ferroelectric filler BaTiO3 reinforce the relevance of this
work, since besides the effect of filler content, the effect of filler size in the
morphological, thermal, mechanical, electrochemical properties of the polymeric
membranes is also considered. This fact is relevant and the BaTiO3 particle properties
and therefore their effect in a composite highly depend on particle size, the
ferroelectricity disappearing below a certain grain size [34].

6 – POROUS MEMBRANES OF BaTiO3/P(VDF-TrFE)
101
In this study particles of 10, 100 and 500 nm average size are evaluated table 6.1.
Table 6.1: Structural properties of the ceramic fillers [35].
Ø = 10 nm Ø = 100 nm Ø = 500 nm
Purity (%) 99.8 99.9 99.9
Crystallographic form cubic cubic tetragonal
6.2. Results and discussion
6.2.1. Microstructural characteristics
The effect of BaTiO3 concentration in the polymer matrix was studied in the
membranes with average particle size of 100 nm.
The morphology of the separator membrane is paramount for the battery
performance as well as in their assembling and handling [5]. It has been shown that
pristine P(VDF-TrFE) membranes produced under specific solvent evaporation
conditions lead to porosity and pore distribution adequate for Li-ion batteries
applications [14, 36].

6 – POROUS MEMBRANES OF BaTiO3/P(VDF-TrFE)
102
Figure 6.1 shows the cross section scanning electron microscopy (SEM) pictures
of P(VDF-TrFE) and ceramic/P(VDF-TrFE) composites, the average pore size
distribution and electrolyte solution uptake for the sample with 16 wt% filler content.
Figure 6.1: Cross section SEM images of the BaTiO3/P(VDF-TrFE) composites with different filler contents: a) 0 wt%, b) 4 wt%, c) 16 wt% and d) 32 wt%; e) average pore size distribution and f) electrolyte content as function of time, for membrane with 16 wt% of BaTiO3.
40 50 60 700
3
6
9
12
15
18
21 e) 54.3 ± 7.0 m
Nu
mb
er
of co
un
ts
Pore size (m)
0 5 10 15 20
60
62
64
66
68
70
72
f)
Econte
nt (
%)
t (min)

6 – POROUS MEMBRANES OF BaTiO3/P(VDF-TrFE)
103
Figure 6.1a shows that the pristine copolymer is characterized by a homogeneous
porous structure that remains after the addition of ceramic fillers (figures 6.1b, c and d).
In the inset of figures 6.1c and d it is notorious that the BaTiO3 nanoparticles decorate
the internal walls of the polymer pores, the fillers being located in the pore cavities
instead of being incorporated within the polymeric matrix.
Figure 6.1e represents the average pore size distribution of the sample with 16
wt% of fillers, all the pores have a diameter between 40 and 70 m. The average pore
size for all samples is represented in figure 6.2.
Figure 6.1f represents the electrolyte content as a function of time for the sample
with 16 wt% of BaTiO3 nanoparticles. The electrolyte content stabilizes about 2 minutes
after the onset. After stabilizing, the electrolyte content varies about 2 %, which is
within the experimental error. The behaviour is similar for the remaining samples.
Figure 6.2 shows the average pore size, porosity (figure 6.2a) and electrolyte
content (figure 6.2b) of the different membranes.
0
20
40
60
80
100
a)
Po
re s
ize
(m
)
0 4 8 12 16 20 24 28 3260
70
80
Po
rosity (
%)
BaTiO3 content (%)
0 4 8 12 16 20 24 28 3255
60
65
70
75
80
b)
Econte
nt (
%)
BaTiO3 content (%)
Figure 6.2: a) Average pore size and porosity and b) electrolyte content as function of BaTiO3 content for all membrane.
Figure 6.2a shows that the pore size increases with increasing BaTiO3 content,
between a minimum of 25 m for the pure polymer to a maximum 90 m for the
composite with 32 wt% of ceramic filler, which is to be ascribed to the filler effect on
the bi-phase solvent-polymer phase diagram and therefore on the phase separation and
solvent evaporation processes [37]. On the other hand, the porosity is not significantly
affected, being the variations within experimental error.
Figure 6.2b shows that the electrolyte content decreases with increasing ceramic
nanoparticles content, between approximately 76 and 59 %. Samples with higher

6 – POROUS MEMBRANES OF BaTiO3/P(VDF-TrFE)
104
amounts of fillers have less free space in the pore cavities for the electrolyte liquid,
resulting in lower electrolyte content. Further, larger pore sizes for a given degree of
porosity leads to lower surface area for interaction between separator and electrolyte.
The results of the weight loss proved to be negligible. Losses over 60 min time do
not show any significant variation due to the high evaporation temperature (242 ºC) of
the PC solvent of the electrolyte [38].
6.2.2. Polymer Phase and degree of crystallinity
Figure 6.3 shows the Fourier transformed infrared spectroscopy (FTIR) spectra
and the differential scanning calorimetry (DSC) thermogram for membranes with
different filler contents.
800 1000 1200 1400 1600
a)
0 %
16 %
32 %
4 %
Tra
nsm
itta
nce
(a
.u.)
Wavenumber (cm-1)
Polymer Polymer
80 100 120 140 160 180
Tc
Tm
b)
en
do
.
1 W
/g
0 %
4 %
16 %
32 %
Q (
W/g
)
Temperature (ºC)
Figure 6.3: a) FTIR spectra of the BaTiO3/P(VDF-TrFE) composites with different filler contents; b) DSC thermogram of membrane composites with different amounts of ceramic particles.
The infrared spectra shows that the presence of the fillers does not affect the
characteristic vibration modes (851 cm-1
, 886 cm-1
and 1402 cm-1
) of the all-trans
configuration of the polymer matrix [39]. The polymer crystallizes therefore in the polar
phase after the addition of BaTiO3 ceramic particles. These characteristic vibration
modes are also unaffected by the presence of electrolyte solution [21-22].
The thermograms of figure 6.3b show two endothermic peaks, the first around
117 ºC, corresponding to the polymer ferroelectric to paraelectric transition (Tc) and the
second around 146 ºC corresponding to the polymer melting temperature (Tm) [40]. The
addition of BaTiO3 does not affect these reference temperatures of the polymer. In the

6 – POROUS MEMBRANES OF BaTiO3/P(VDF-TrFE)
105
presence of electrolyte solution these parameters are also unaffected by the fillers
[21-22].
Table 6.2 shows the degree of crystallinity of the composite membranes
calculated by equation 2.1.
Table 6.2: Degree of crystallinity of the BaTiO3/P(VDF-TrFE) membranes with different amounts of ceramic fillers.
Sample c ± 2 (%)
0 % 28
4 % 29
16 % 26
32 % 20
The table 6.2 shows that the degree of crystallinity of the composites membranes
is lower than that of the pure polymer. The inclusion of fillers generally leads to an
initial increase of the degree of crystallinity, as small filler contents can act as
nucleation agents during the crystallization process. On the other hand, larger filler
contents decrease the degree of crystallinity as ill crystallization of the polymer often
occur in the presence of large content of ceramic fillers, that act as defects during the
crystallization process [41].

6 – POROUS MEMBRANES OF BaTiO3/P(VDF-TrFE)
106
6.2.3. Mechanical properties
Figure 6.4 shows the stress strain mechanical measurements for all the membranes
after electrolyte solution uptake and the main parameters of the mechanical evaluation
are summarized in table 6.3.
0 100 200 300 400
0.0
0.5
1.0
1.5
2.0
2.5
3.0
3.5
P(VDF-TrFE)
4 %
16 %
32 %
Strain (%)
Str
ess (
MP
a)
Figure 6.4: Stress-strain curves of the BaTiO3/P(VDF-TrFE) composites with different ceramic nanoparticles contents after electrolyte solution uptake.
Table 6.3: Mechanical properties of the membranes with electrolyte solution uptake.
Sample Yield Stress
(MPa) Elastic Modulus
(MPa) Stress at break
(MPa)
0 % 0.3 1.9 1.0
4 % 0.9 3.0 2.6
16 % 0.7 2.8 2.0
32 % 1.3 5.4 3.2
The addition of BaTiO3 to the polymer matrix affects the overall mechanical
properties of the membranes. The yield stress, elastic modulus and stress at break show
a slight increase in the composites membranes when compared to the pure polymer,
indicating that ceramic particles mechanically reinforce the composite despite the
decrease in crystallinity of the polymeric matrix [41-43]. In this sense the mechanical
reinforcement effect by filler polymer interactions over impose any effect related to the
variation in the degree of crystallinity. On the one hand, the proper wetting of the
ceramic filler by the polymer, due to strong electrostatic interactions [41], lead to a
mechanical reinforcement of the polymer within the composite, increasing the stress

6 – POROUS MEMBRANES OF BaTiO3/P(VDF-TrFE)
107
values needed for a given deformation. On the other hand, the overall mechanical
properties remain in same value range, being therefore determined by the microporous
microstructure of the membranes.
6.2.4. Electrical response
Electrochemical impedance spectroscopy (EIS) was performed to evaluate the
electrochemical properties of the membranes with electrolyte uptake. The results are
presented trough Nyquist plots (imaginary impedance Z’’ versus real impedance Z’,
figure 6.5a) and logarithmic ionic conductivity versus temperature (figure 6.5b).
0 500 1000 1500 2000
0
1000
2000
3000
4000
5000
a)
-Z''
()
Z' ()
0 %
4 %
16 %
32 %
2.6 2.8 3.0 3.2 3.4
-6
-5
-4
-3
b)
Log
i (S
/cm
)
1000/T (K-1)
0 %
4 %
16 %
32 %
Figure 6.5: a) Nyquist plot for the BaTiO3/P(VDF-TrFE) composites at 25 ºC; b) Log i as a function of 1000/T for BaTiO3/P(VDF-TrFE) composites with electrolyte solution uptake.
Table 6.4 shows the ionic conductivity (σi) and tortuosity () at room temperature,
obtained from equation 2.5 and 2.6 respectively.
Table 6.4: Room temperature ionic conductivity (σi) and tortuosity () of the membranes filled with 1 M LiClO4.3H2O electrolyte solution; σ0 = 9.8 mS/cm at 25 ºC.
Sample σi (S/cm)
0 % 5.2410-7 114.9
4 % 1.0410-4 8.4
16 % 4.1310-5 13.4
32 % 6.4010-5 10.4
The Nyquist plot is characterized by three distinct regions: a semicircle at high
frequencies corresponding to the charge transfer process, a straight line at low

6 – POROUS MEMBRANES OF BaTiO3/P(VDF-TrFE)
108
frequencies related to the diffusion process and the transition between both [44-45]. In
the Nyquist plot of figure 6.5a the high frequency semicircle appears only for the
pristine polymer. It indicates that the fillers facilitate the charge transfer process due to
the increase in ionic conductivity, as observed in figure 6.5b [46].
Figure 6.5b represents the ionic conductivity as function of temperature for the
different membranes with electrolyte uptake. The ionic conductivity of the composite
membranes is about two orders of magnitude higher than for the pure polymer (table
6.4), the ionic conduction is promoted by fillers through the increase of charge carriers
and amorphous phase content in the composites (figure 6.3b and table 6.2).
Furthermore, in the composite membranes the ionic conductivity is more stable in
temperature [43].
Regarding tortuosity, composites present substantially lower values than the pure
polymer. The tortuosity gives information about pore connectivity relating the mean
actual path with direct sample thickness and it is often defined trough the ionic
conductivity [5]. Tortuosity of polymer composites is substantially lower than for the
pure polymer, which indicates that the present of the fillers improve pore connectivity.
The membrane with 4 wt% of BaTiO3 shows the lower value of tortuosity, despite the
differences between composite membranes being small, the obtained values suggest that
for higher concentration pore blockage occurs as well as interface trapping of ions. An
ideal porous body has tortuosity of 1, so the porous structure of composites is not far
from the ideal value.
Table 6.5 represents the values of the activation energy of the conductive process.
Table 6.5: Activation energy (Ea) of the composite membranes with electrolyte solution uptake, determined after equation 2.7.
Samples Ea (kJ/mol)
0 % 64
4 % 11
16 % 15
32 % 10
Table 6.5 shows that activation energy is lower and similar for all composite
membranes, with respect to the pure polymer. The activation energy decreases
substantially in composite membranes, which could be associated to the decrease of the

6 – POROUS MEMBRANES OF BaTiO3/P(VDF-TrFE)
109
degree of crystallinity and the increase in the number of charge carriers, which leads to
an increase of the ionic mobility.
The figure 6.6 presents the cyclic voltammetry for samples with different BaTiO3
contents (figure 6.6a) and scan rates (figure 6.6b) used to evaluate the electrochemical
stability of the membranes.
-2 0 2 4 6
0
3x10⁻⁷
6x10⁻⁷
9x10⁻⁷
1x10⁻⁶
a)
0 %
4 %
16 %
32 %
E vs Li/Li+ (V)
I (A
)
-2 0 2 4 6
-4x10⁻⁷
0
4x10⁻⁷
8x10⁻⁷
1x10⁻⁶
2x10⁻⁶
b)
E vs Li/Li+ (V)
0.05 V/s
0.1 V/s
0.5 V/s
1 V/s
I (A
)
Figure 6.6: a) Voltammogram of BaTiO3/P(VDF-TrFE) composites at 0.1 V/s with different filler contents; b) voltammogram of BaTiO3/P(VDF-TrFE) with 16 wt% of ceramic particles with 100 nm in diameter at different scanning rates.
The voltammograms of fig 6.6a show stable operation windows between -2.0 and
4.0 V. The amount of fillers does not affect significantly the electrochemical stability,
although composite membranes present a cathodic peak higher than the pure polymer
around 6.0 V, probably due to charges accumulated at the interface between electrodes
and sample [47]. The voltammograms of figure 6.6b also show stable operation
windows between -2.0 and 4.0 V. For the higher scan rates, 0.5 and 1 V/s, an anodic
peak appears around 1.0 V and the cathodic peaks around 6.0 V are higher than for
lower speeds, since higher scan rates tends induce irreversible electrochemical
processes [48]. Generally, the electrochemical stability of the membranes is determined
by the electrolyte solution, so the presence of ceramic nanoparticles does not affect
significantly the electrochemical behaviour. All membranes present a stable operation
window at least 5.0 V amplitude, suitable for most common lithium-based couples,
which have voltages of about 3.0 V [28]. The diffusion coefficient calculated by
equation 2.8 through the maximum current value of the oxidative peak in the
voltammograms of figure 6 shows an increase with increasing BaTiO3 content. The

6 – POROUS MEMBRANES OF BaTiO3/P(VDF-TrFE)
110
pristine polymer presents the lowest value of 2.8510-5
cm2/s and the membrane with
32 wt% of ceramic nanoparticles presents the highest value of 1.2210-4
cm2/s, which is
similar for the other composites; this effect is attributed to the increase of ionic charge
carriers with the addition of fillers.
6.2.5. Particles size effect
In order to study the BaTiO3 filler size effect in the membranes performance,
membranes with 16 wt% filler content with 10, 100 and 500 nm average diameter were
prepared. Figure 6.7 shows the SEM images for samples with different average filler
size.
Figure 6.7: Cross section SEM images of BaTiO3/P(VDF-TrFE) composites with 16 wt% of ceramic particles with filler sizes of a) 10 nm and b) 500 nm.
Figure 6.7 show that the different membranes present a homogeneous pore
distribution unaffected by the size of the fillers. In all cases the fillers are lodged in the
pore cavities, not being incorporated into the polymer matrix structure.

6 – POROUS MEMBRANES OF BaTiO3/P(VDF-TrFE)
111
The influence of filler size in pore size, porosity and electrolyte content is
presented in figure 6.8.
40
60
80
a)
Po
re s
ize
(m
)
5 10 15 100 200 300 400 50060
70
80
90
Po
rosity (
%)
BaTiO3 size (nm)
5 10 15 100 200 300 400 500
70
71
72
73
74
75
76
b)
Econte
nt (
%)
BaTiO3 size (nm)
Figure 6.8: a) Average pore size and porosity and b) electrolyte content of membranes with 16 wt% of BaTiO3 particles as a function of filler average diameter.
Concerning to the pore size (figure 6.8a), there is a decrease with increasing filler
size, from a maximum of 68 to a minimum of 43 m for 10 and 500 nm filler average
diameter, respectively. During crystallization, the liquid-liquid phase separation of the
composite membranes is influenced by ceramic particle size [49], the fillers with larger
volume and lower surface area (100 and 500 nm) leading to a decrease of the average
pore size.
The porosity (figure 6.8a) and electrolyte content (figure 6.8b), on the other hand,
are affected by the size of the fillers. The porosity of the membranes increases and the
pore size decreases with increasing ceramic size as shown in figure 6.8a. As the
electrolyte content depends on the surface area-to-volume ratio and electrolyte-
membrane interaction, the electrolyte content increases for increasing ceramic size.
In this sense the pore size, porosity and electrolyte uptake are affected by particle
size and particle characteristic, such as crystalline phase (table 6.1).

6 – POROUS MEMBRANES OF BaTiO3/P(VDF-TrFE)
112
Figure 6.9 presents information about the mechanical and electrical properties of
the composite membranes: tensile stress strain, the impedance, ionic conductivity and
the electrochemical behaviour.
0 100 200 300
0.0
0.3
0.6
0.9
1.2
1.5
1.8
2.1
a)
10 nm
100 nm
500 nm
Strain (%)
Str
ess (
MP
a)
0 2000 4000 6000 8000
0
5000
10000
15000
20000
b)
-Z''
()
Z' ()
10 nm
100 nm
500 nm
10 nm
100 nm
500 nm
2.6 2.8 3.0 3.2 3.4
-5.5
-5.0
-4.5
-4.0
-3.5
-3.0
-2.5
c)
Log
i (S
/cm
)
1000/T (K-1)
-2 0 2 4 6
0
2x10⁻⁷
4x10⁻⁷
6x10⁻⁷
8x10⁻⁷
1x10⁻⁶
1x10⁻⁶
d)
E vs Li/Li+ (V)
10 nm
100 nm
500 nm
I (A
)
Figure 6.9: a) Tensile stress-strain measurements, b) Nyquist plot at 25 ºC, c) Log i as a function of 1000/T and d) cyclic voltammetry, of BaTiO3/P(VDF-TrFE) composites with 16 wt% filler content.
The figure 6.9a shows that the overall mechanical properties are very similar for
all composites. The elastic modulus and yield stress are in the same value range for all
membranes, 3-4 and 0.5 MPa respectively. Nevertheless, it is noted a dependence on
ceramic size, due to better wetting and stronger electrostatic surface interactions of the
polymer with the smaller ceramic particles, related to the larger surface to volume ratio
(figure 6.9a).
In the Nyquist plot of figure 6.9b is notorious the absence of the high frequency
semicircle, which also indicates higher ionic mobility for all ceramic size.

6 – POROUS MEMBRANES OF BaTiO3/P(VDF-TrFE)
113
The ionic conductivity (figure 6.9c) is similar for the membranes with 500 and
100 nm average diameter fillers. This is an interesting fact as the 500 nm diameter filler
presents ferroelectric properties due to the tetragonal crystallographic form, showing
therefore a large polarity that could lead to larger interactions with the ions present in
the electrolyte [50]. The lowest ionic conductivity is observed for the samples prepared
with 10 nm fillers, so filler size appears to be the most relevant parameter influencing
ionic conductivity due to increased filler surface area and, therefore, electrolyte-filler
interaction.
The voltammograms presented in figure 6.9d show that all composite membranes
have a stable operation window between -2.0 and 4.0 V, with a small reduction peak for
all samples around 1.0 V.
Overall, it can be concluded that filler size, as well as filler content, is relevant
and affects the performance of the membranes for Li-ion battery applications.
6.3. Conclusion
BaTiO3/P(VDF-TrFE) porous membranes with different filler contents and sizes
were prepared by thermally induced phase separation (TIPS). Filler inclusion leads to an
increase in the pore size up to 90 m and in the porosity up to 74 %. The inclusion of
the fillers does not influence the phase of the polymer and the Tc and Tm remain
unaltered with respect to the values found in the pristine polymer. The main effects of
the fillers are a decrease of the degree of crystallinity to 20 %, a slight enhancement of
the mechanical properties and an increase of the ionic conductivity from 5.2410-7
to
1.0410-4
S/cm for pristine polymer and 4 wt% filler content, respectively. The cyclic
voltammetry reveals a stable operation window between -2.0 and 4.0 V vs Li/Li+ for all
membranes. Filler size, on the other hand show relevant effects on membrane
performance (ionic conductivity) despite a slight increase of pore size for the smaller
particles. It can be concluded that BaTiO3/P(VDF-TrFE) composite membranes show
adequate morphological, thermal, mechanical and electrochemical properties for being
used as separators in lithium ion batteries. Furthermore, the addition of Ø = 500 nm
BaTiO3 ceramic particles up to 4 % enhances the mechanical properties and increases

6 – POROUS MEMBRANES OF BaTiO3/P(VDF-TrFE)
114
significantly the ionic conductivity without affecting the stable operation window of the
membrane separators.

6 – POROUS MEMBRANES OF BaTiO3/P(VDF-TrFE)
115
6.4. References
1. Tarascon, J.-M. Key challenges in future Li-battery research. Philosophical
Transactions of the Royal Society A: Mathematical, Physical and Engineering
Sciences, 2010. 368(1923): p. 3227-3241.
2. Park, J.-K. Principles and applications of lithium secondary batteries. 2012,
Weinheim: Wiley-VCH.
3. Tarascon, J.M. and M. Armand. Issues and challenges facing rechargeable
lithium batteries. Nature, 2001. 414(6861): p. 359-367.
4. Linden, D. and T.B. Reddy. Handbook of batteries. 2002, New York: McGraw-
Hill.
5. Huang, X. Separator technologies for lithium-ion batteries. Journal of Solid
State Electrochemistry, 2011. 15(4): p. 649-662.
6. Arora, P. and Z. Zhang. Battery Separators. Chemical Reviews, 2004. 35(50): p.
4419-4462.
7. Costa, C.M., J. Nunes-Pereira, L.C. Rodrigues, M.M. Silva, J.L.G. Ribelles, and
S.Lanceros-Méndez. Novel poly(vinylidene fluoride-
trifluoroethylene)/poly(ethylene oxide) blends for battery separators in lithium-
ion applications. Electrochimica Acta, 2013. 88(0): p. 473-476.
8. Ibrahim, S., S.M.M. Yasin, M.N. Ng, R. Ahmad, and M.R. Johan. Impedance
spectroscopy of carbon nanotube/solid polymer electrolyte composites. Solid
State Communications, 2011. 151(23): p. 1828-1832.
9. Persi, L., F. Croce, B. Scrosati, E. Plichta, and M.A. Hendrickson. Poly(ethylene
oxide)-Based, Nanocomposite Electrolytes as Improved Separators for
Rechargeable Lithium Polymer Batteries. Journal of The Electrochemical
Society, 2002. 149(2): p. A212-A216.
10. Angulakshmi, N., K.S. Nahm, J.R. Nair, C. Gerbaldi, R. Bongiovanni, N.
Penazzi, and A.M. Stephan. Cycling profile of MgAl2O4-incorporated composite
electrolytes composed of PEO and LiPF6 for lithium polymer batteries.
Electrochimica Acta, 2013. 90(0): p. 179-185.
11. Huai, Y., J. Gao, Z. Deng, and J. Suo. Preparation and characterization of a
special structural poly(acrylonitrile)-based microporous membrane for lithium-
ion batteries. Ionics, 2010. 16(7): p. 603-611.
12. Liang, Y., Z. Lin, Y. Qiu, and X. Zhang. Fabrication and characterization of
LATP/PAN composite fiber-based lithium-ion battery separators.
Electrochimica Acta, 2011. 56(18): p. 6474-6480.

6 – POROUS MEMBRANES OF BaTiO3/P(VDF-TrFE)
116
13. Miao, Y.-E., G.-N. Zhu, H. Hou, Y.-Y. Xia, and T. Liu. Electrospun polyimide
nanofiber-based nonwoven separators for lithium-ion batteries. Journal of
Power Sources, 2013. 226(0): p. 82-86.
14. Costa, C.M., L.C. Rodrigues, V. Sencadas, M.M. Silva, J.G. Rocha, and S.
Lanceros-Méndez. Effect of degree of porosity on the properties of
poly(vinylidene fluoride–trifluorethylene) for Li-ion battery separators. Journal
of Membrane Science, 2012. 407–408(0): p. 193-201.
15. Costa, C.M., V. Sencadas, J.G. Rocha, M.M. Silva, and S. Lanceros-Méndez.
Evaluation of the main processing parameters influencing the performance of
poly(vinylidene fluoride–trifluoroethylene) lithium-ion battery separators.
Journal of Solid State Electrochemistry, 2013. 17(3): p. 861-870.
16. Costa, C.M., M.M. Silva, and S. Lanceros-Mendez. Battery separators based on
vinylidene fluoride (VDF) polymers and copolymers for lithium ion battery
applications. RSC Advances, 2013. 3(29): p. 11404-11417.
17. Djian, D., F. Alloin, S. Martinet, and H. Lignier. Macroporous poly(vinylidene
fluoride) membrane as a separator for lithium-ion batteries with high charge
rate capacity. Journal of Power Sources, 2009. 187(2): p. 575-580.
18. Huang, X. Cellular porous polyvinylidene fluoride composite membranes for
lithium-ion batteries. Journal of Solid State Electrochemistry, 2013. 17(3): p.
591-597.
19. Liu, J., W. Li, X. Zuo, S. Liu, and Z. Li. Polyethylene-supported polyvinylidene
fluoride–cellulose acetate butyrate blended polymer electrolyte for lithium ion
battery. Journal of Power Sources, 2013. 226(0): p. 101-106.
20. Xiao, W., X. Li, H. Guo, Z. Wang, Y. Zhang, and X. Zhang. Preparation of
core–shell structural single ionic conductor SiO2@Li+ and its application in
PVDF–HFP-based composite polymer electrolyte. Electrochimica Acta, 2012.
85(0): p. 612-621.
21. Nunes-Pereira, J., A.C. Lopes, C.M. Costa, R. Leones, M.M. Silva, and S.
Lanceros-Méndez. Porous Membranes of Montmorillonite/Poly(vinylidene
fluoride-trifluorethylene) for Li-Ion Battery Separators. Electroanalysis, 2012.
24(11): p. 2147-2156.
22. Nunes-Pereira, J., A.C. Lopes, C.M. Costa, L.C. Rodrigues, M.M. Silva, and S.
Lanceros-Méndez. Microporous membranes of NaY zeolite/poly(vinylidene
fluoride–trifluoroethylene) for Li-ion battery separators. Journal of
Electroanalytical Chemistry, 2013. 689(0): p. 223-232.
23. Nalwa, H.S. Ferroelectric polymers : chemistry, physics, and applications.
1995, New York: Dekker.

6 – POROUS MEMBRANES OF BaTiO3/P(VDF-TrFE)
117
24. Jung, S., D. Kim, S. Lee, M. Cheong, D. Nguyen, B. Cho, and H. Kim. Fillers
for Solid-State Polymer Electrolytes : Highlight. Bull. Korean Chem. Soc.,
2009. 30(10): p. 2355-2361.
25. Nunes-Pereira, J., C.M. Costa, R. Leones, M.M. Silva, and S. Lanceros-Méndez.
Li-ion battery separator membranes based on poly(vinylidene fluoride-
trifluoroethylene)/carbon nanotube composites. Solid State Ionics, 2013. 249–
250(0): p. 63-71.
26. Moreno, M., R. Quijada, M.A. Santa Ana, E. Benavente, P. Gomez-Romero, and
G. González. Electrical and mechanical properties of poly(ethylene
oxide)/intercalated clay polymer electrolyte. Electrochimica Acta, 2011. 58(0):
p. 112-118.
27. Lee, L., S.-J. Park, and S. Kim. Effect of nano-sized barium titanate addition on
PEO/PVDF blend-based composite polymer electrolytes. Solid State Ionics,
2013. 234(0): p. 19-24.
28. Sun, H.Y., H.J. Sohn, O. Yamamoto, Y. Takeda, and N. Imanishi. Enhanced
Lithium-Ion Transport in PEO-Based Composite Polymer Electrolytes with
Ferroelectric BaTiO3. Journal of The Electrochemical Society, 1999. 146(5): p.
1672-1676.
29. Li, Q., N. Imanishi, Y. Takeda, A. Hirano, and O. Yamamoto. PEO-based
composite lithium polymer electrolyte, PEO-BaTiO3-Li(C2F5SO2)2N. Ionics,
2002. 8(1-2): p. 79-84.
30. Cross, L.E. Ferroelectric materials for electromechanical transducer
applications. Materials Chemistry and Physics, 1996. 43(2): p. 108-115.
31. Roberts, S. Dielectric and Piezoelectric Properties of Barium Titanate. Physical
Review, 1947. 71(12): p. 890-895.
32. Damjanovic, D., F. Brem, and N. Setter. Crystal orientation dependence of the
piezoelectric d33 coefficient in tetragonal BaTiO3 as a function of temperature.
Applied Physics Letters, 2002. 80(4): p. 652-654.
33. Mostaghaci, H. and R.J. Brook. Microstructure development and dielectric
properties of fast-fired BaTiO3 ceramics. Journal of Materials Science, 1986.
21(10): p. 3575-3580.
34. Chao, F. and C. Liangyan. Domain structure of nano BaTiO3 ceramic described
by a second-order transition model. in Computer Science and Automation
Engineering (CSAE), 2012 IEEE International Conference on. 2012.
35. Nanoamor®. Nanostructured & Amorphous Materials, Inc. 2001 [cited 2013;
Available from: http://www.nanoamor-
europe.com/catalogsearch/result/?q=barium+titanate.

6 – POROUS MEMBRANES OF BaTiO3/P(VDF-TrFE)
118
36. California, A., V.F. Cardoso, C.M. Costa, V. Sencadas, G. Botelho, J.L. Gómez-
Ribelles, and S. Lanceros-Mendez. Tailoring porous structure of ferroelectric
poly(vinylidene fluoride-trifluoroethylene) by controlling solvent/polymer ratio
and solvent evaporation rate. European Polymer Journal, 2011. 47(12): p. 2442-
2450.
37. Ferreira, A., J. Silva, V. Sencadas, J.L.G. Ribelles, and S. Lanceros-Méndez.
Poly[(vinylidene fluoride)-co-trifluoroethylene] Membranes Obtained by
Isothermal Crystallization from Solution. Macromolecular Materials and
Engineering, 2010. 295(6): p. 523-528.
38. Xu, K. Nonaqueous Liquid Electrolytes for Lithium-Based Rechargeable
Batteries. Chemical Reviews, 2004. 104(10): p. 4303-4418.
39. Prabu, A.A., J.S. Lee, K.J. Kim, and H.S. Lee. Infrared spectroscopic studies on
crystallization and Curie transition behavior of ultrathin films of P(VDF/TrFE)
(72/28). Vibrational Spectroscopy, 2006. 41(1): p. 1-13.
40. Sencadas, V., S. Lanceros-Méndez, and J.F. Mano. Thermal characterization of
a vinylidene fluoride-trifluorethylene (75–25) (%mol) copolymer film. Journal of
Non-Crystalline Solids, 2006. 352(50–51): p. 5376-5381.
41. Costa, C.M., S. Firmino Mendes, V. Sencadas, A. Ferreira, R. Gregorio Jr, J.L.
Gómez Ribelles, and S. Lanceros-Méndez. Influence of processing parameters
on the polymer phase, microstructure and macroscopic properties of
poly(vinilidene fluoride)/Pb(Zr0.53Ti0.47)O3 composites. Journal of Non-
Crystalline Solids, 2010. 356(41–42): p. 2127-2133.
42. Vacche, S., F. Oliveira, Y. Leterrier, V. Michaud, D. Damjanovic, and J.-A.
Månson. The effect of processing conditions on the morphology,
thermomechanical, dielectric, and piezoelectric properties of P(VDF-
TrFE)/BaTiO3 composites. Journal of Materials Science, 2012. 47(11): p. 4763-
4774.
43. Ulaganathan, M., R. Nithya, and S. Rajendran. Surface Analysis Studies on
Polymer Electrolyte Membranes Using Scanning Electron Microscope and
Atomic Force Microscope, in Scanning Electron Microscopy. 2012.
44. Chang, B.-Y. and S.-M. Park. Electrochemical Impedance Spectroscopy. Annual
Review of Analytical Chemistry, 2010. 3(1): p. 207-229.
45. Park, M., X. Zhang, M. Chung, G.B. Less, and A.M. Sastry. A review of
conduction phenomena in Li-ion batteries. Journal of Power Sources, 2010.
195(24): p. 7904-7929.
46. Ulaganathan, M. and S. Rajendran. Studies on MWCNT-Incorporated Composite
Polymer Electrolytes for Electrochemical Applications. Soft Materials, 2010.
8(4): p. 358-369.

6 – POROUS MEMBRANES OF BaTiO3/P(VDF-TrFE)
119
47. Nissen, D.A. A Study of the Anode-Electrolyte Interface in a Thermal Battery.
Journal of The Electrochemical Society, 1979. 126(2): p. 176-180.
48. Brett, A.M.C.F.O. and C.M.A. Brett. Electroquímica : princípios, métodos e
aplicações. 1996, Coimbra: Almedina.
49. Nakanishi, K. and N. Soga. Phase Separation in Gelling Silica–Organic
Polymer Solution: Systems Containing Poly(sodium styrenesulfonate). Journal
of the American Ceramic Society, 1991. 74(10): p. 2518-2530.
50. Hsiang, H.-I. and F.-S. Yen. Effect of Crystallite Size on the Ferroelectric
Domain Growth of Ultrafine BaTiO3 Powders. Journal of the American Ceramic
Society, 1996. 79(4): p. 1053-1060.


7 - Energy harvesting performance of PVDF based electrospun fibers
This chapter is based on the following publication:
Nunes-Pereira, J., V. Sencadas, V. Correia, J.G. Rocha, and S. Lanceros-Méndez.
Energy harvesting performance of piezoelectric electrospun polymer fibers and
polymer/ceramic composites. Sensors and Actuators A: Physical, 2013. 196: p. 55-62.


7 – ENERGY HARVESTING PERFORMANCE OF PVDF BASED ELECTROSPUN FIBERS
123
7.1. Introduction
Energy harvesting from mechanical vibrations has become increasingly important
over the last years [1-3] mainly due to low power requirement of small electronic
components, such as wireless sensor networks used in monitoring applications.
Powering small electronics using the vibrational energy available in their environment
could reduce the requirement of external power sources, like batteries, and thus
avoiding the associated maintenance costs [1-3].
There are three basic vibration-to-electrical conversion mechanisms:
electromagnetic, electrostatic and piezoelectric transductions [3-4]. Piezoelectric
transduction has received the largest attention when compared to the other transductions
systems due to its main advantages, such as large power density, easy application
(piezoelectric devices could be fabricated both in macro and micro scale due to well
established production techniques), and that the output voltage is obtained directly from
piezoelectric material itself, that suppresses the requirement of an external voltage input
[1].
The energy conversion in piezoelectric materials is based on variations in the
dipolar moment when a strain is applied and therefore the formation of a potential
difference that can be used to power devices [3].
In recent years a large efforts has been developed focused in improving the
efficiency of piezoelectric power harvesting systems. The most common type of
piezoelectrics used for power harvesting are ceramics like lead zirconate titanate (PZT)
or BaTiO3 [3]. Nevertheless, piezoceramics are susceptible to fatigue crack when
subjected to high frequency cyclic loading, which created the need to search for
alternatives as poly(vinylidene fluoride) (PVDF), a piezoelectric polymer with high
flexibility when compared with ceramics materials [5-7].
PVDF and poly(vinylidene fluoride-co-trifluoroethylene) (P(VDF-TrFE))
copolymer have attracted scientific and technological interest due to their chemical
resistance, good mechanical properties and excellent electroactive properties. P(VDF-
TrFE) has a ferroelectric to paraelectric (FE-PE) phase transition at a Curie temperature
(Tc) that occurs in the bulk material at temperatures melting temperature (Tm), and has a
large electromechanical coupling coefficient at room temperature [8-9].

7 – ENERGY HARVESTING PERFORMANCE OF PVDF BASED ELECTROSPUN FIBERS
124
PVDF and VDF copolymers crystalline structures in the ferroelectric phase are
packed in an “all-trans”, TTT, planar zigzag polymer chain configuration [8]. In (VDF-
TrFE), the paraelectric crystalline structure above Tc is hexagonal, essentially consisting
in a statistical configuration of TT, TG and TG’ rotational isomers [10]. The FE-PE
transition temperature is highly dependent upon VDF content, but other factors such as
heat treatments, electrical poling and processing history can also affect the transition
[11-13].
New research fields are emerging based on the exploration of the nanoscale
properties of such materials improving the possibilities of piezoelectric materials
become a real choice for energy harvesting devices [14]. In this sense, it was reported a
nanogenerator, based on PZT aligned nanofibers on a silicon substrate with
interdigitated electrodes, which reaches an output voltage peak of 1.63 V and a power
generation of 0.03 W [15] and another piezoelectric nanogenerator based on BaTiO3
on plastic substrate connected by interdigitated electrodes [16] with an output voltage
up to 1.0 V and a power density of 7 mW/cm3. This later nanogenerator needs extra
poling treatment after processing in order to enhance the piezoelectric properties of the
materials. Output voltages of nearly 40 V after poling has been reported for micropower
harvesters based on PZT/PVDF and PZT/PP, [17] but the generated power was not
reported.
Polymer nanofibers offer the possibility to tailor materials properties and increase
performance for a number of applications, including energy generation and storage.
Micro and nanofibers can be produced by several techniques such as drawing, template
synthesis, phase separation self-assembly and electrospinning, [18] the latter is the most
straightforward, convenient and scalable technique for nanomaterials production, [18-
19] allowing the production of continuum fibers with diameters of a hundreds of
nanometers up to few micrometers [20]. Electrospinning is process for producing
nanofibers by forcing a viscous solution trough a spinneret subjected to an electric field.
Crossing the spinneret the solution drips and the high applied voltage leads the drop into
an elongated cone; with appropriated viscosity and surface tension a stable solution jet
erupts from the solution droplet. The process makes use of fluid applied charges to
provide a stretching force to a collector where is a potential gradient. This mechanism
ensures the fibers polarization [18, 21].

7 – ENERGY HARVESTING PERFORMANCE OF PVDF BASED ELECTROSPUN FIBERS
125
Several parameters have influence in electrospun fibers morphology and
properties and can be divided in three main groups: initial polymer solution, jet
formation and finally the collection procedure [18].
Electrospun piezoelectric nanofibers offers excellent flexibility and improved
strength, so it is expected their exploitation in a wide variety of applications [22].
Generators based on randomly electrospun PVDF fibers have been developed [23] that
when submitted to periodic oscillations between 1 and 10 Hz achieved output voltages
between 0.43 and 6.3 V. The reported current, around 5 A, seems to be too high for an
insulating material such as PVDF. Even so, the output power generated was around 0.03
W [24].
PZT and BaTiO3 are known to be excellent piezoelectric materials, with high
dielectric and piezoelectric values [25-26]. It seems interesting in this way to explore
the possibility to prepare electrospun composite fibers of PVDF and P(VDF-TrFE) with
BaTiO3 on top of an interdigitated circuit in a single step process (no poling of the
fibers is further needed) in order to study the influence of the ceramic filler in the
energy harvesting efficiency of the polymer. In this way, both the influence of the
processing parameters on the fiber characteristics and the nanogenerator performances
will be addressed.
7.2. Results and discussion
7.2.1. Morphology
The influence of the electrospun processing parameters on average PVDF [27]
and P(VDF-TrFE) [28] fibers size and characteristics such as electroactive phase
content and degree of crystallinity have been study previously, and this section will
focus on the composite fibers. The influence of the applied electric field in the
BaTiO3/P(VDF-TrFE) electrospun fibers nanocomposites has been evaluated keeping
constant the needle inner diameter of 0.5 mm and the flow rate of 0.5 mL/h.

7 – ENERGY HARVESTING PERFORMANCE OF PVDF BASED ELECTROSPUN FIBERS
126
Generally, BaTiO3/P(VDF-TrFE) electrospun membranes show a random distribution
and smooth, and bead free fibers with average diameter of 450 ± 100 nm (figure 7.1).
Figure 7.1: BaTiO3/P(VDF-TrFE) electrospun membrane obtained at 15/85 polymer/solution and with 5 % BaTiO3 nanoparticles with particle size of Ø = 100 nm: a) 20 kV, b) 35 kV, c) 25 kV and d) backscattering image of sample obtained at 25 kV (image b). Traveling distance of 20 cm, needle inner diameter of 0.5 mm and flow rate of 0.5 mL/h.
A histogram of the fiber diameter distribution was obtained trough scanning
electron microscopy (SEM) images and the fiber average diameter was obtained from
40 measurements of the nanofibers present in each image.

7 – ENERGY HARVESTING PERFORMANCE OF PVDF BASED ELECTROSPUN FIBERS
127
Following a similar procedure, from the systematic variation of the other main
parameters affecting the electrospinning process their influence on the average fiber
diameter has been obtained (figure 7.2).
1.0 1.5 2.0300
400
500
600
700
800a)
Fib
er
dia
me
ter
(nm
)
Electric field (kV/cm)
0.5 1.0 1.5300
400
500
600
700
800b)
Fib
er
dia
me
ter
(nm
)Needle inner diameter (mm)
0 2 4 6 8300
400
500
600
700
800
c)
Fib
er
dia
me
ter
(nm
)
Flow rate (mL/h)
0 5 10 15 20300
400
500
600
700
800
d)
Fib
er
dia
me
ter
(nm
)
BaTiO3 amount (%)
Figure 7.2: a) Influence of applied electric field on the mean diameter of the electrospun BaTiO3/P(VDF-TrFE) fibers, the flow rate was 0.5 mL/h and needle inner diameter of 0.5 mm; b) Influence of tip inner diameter on the mean diameter of the electrospun BaTiO3/P(VDF-TrFE) fibers, the flow rate was 0.5 mL/h and applied electric field of 1.25 kV/cm; c) Influence of flow rate on the mean diameter of the electrospun BaTiO3/P(VDF-TrFE) fibers, the tip inner diameter was 0.5 mm and the applied electric field of 1.25 kV/cm; d) Influence of BaTiO3 content on the fiber mean diameter for the electrospun BaTiO3/P(VDF-TrFE) membrane, the tip inner diameter was 0.5 mm, applied electric field of 1.25 kV/cm and a flow rate of 0.5 mL/h. Average filler size: Ø = 100 nm; filler concentration in a), b) and c) 5 %.
It was observed that the applied electric field does have no influence on the fiber
diameter and distribution (figure 7.2a). On other hand, for a constant applied electric
field, flow rate and for the same polymer/ceramic concentration, an increase of the
average fiber diameter was observed with the increase of the needle inner diameter
(figure 7.2b).

7 – ENERGY HARVESTING PERFORMANCE OF PVDF BASED ELECTROSPUN FIBERS
128
Fiber average diameter and its distribution are strongly affected by the flow rate,
demonstrated by an increase of the mean fiber diameter from 422 ± 27 nm to 649 ± 127
nm by increasing the flow rate from 0.5 mL/h to 8 mL/h (figure 7.2c). Feed rate
determines the amount of solution available at the needle tip for electrospinning. When
feed rate increases, there is a corresponding increase on the fiber diameter due to the
larger volume of solution that is drawn away from the needle tip [18].
It was interesting to note that the inclusion of ceramic BaTiO3 nanoparticles in the
polymer solution does not influence the fiber average diameter and distribution
(figure 7.2d).
The effect of BaTiO3 particle average diameter in the fiber size and distribution
was characterized for ceramic particles with 10, 100 and 500 nm (figure 7.3) for the
fibers with 20 % BaTiO3 volume content. All membranes show no polymer beads,
however some particle clusters were identified as result of the large ceramic content for
the given fiber average diameter.
Figure 7.3: Influence of BaTiO3 particle average size in the composite fiber diameter: a) 10 nm, b) 500 nm, c) backscattering image of electrospun fibers with 20 % BaTiO3 (Ø = 100 nm) and d) electrospun BaTiO3/P(VDF-TrFE) (20 % BaTiO3 and Ø = 100 nm) membrane obtained at 750 rpm. For all samples, tip inner diameter was 0.5 mm, applied electric field of 1.25 kV/cm and a flow rate of 0.5 mL/h.
With respect to the particle average size, particles with a mean diameter lower
than 100 nm are trapped inside the fiber (figure 7.3a and d), but the particles with an

7 – ENERGY HARVESTING PERFORMANCE OF PVDF BASED ELECTROSPUN FIBERS
129
average diameter of 500 nm are randomly dispersed out and inside the fibers due to the
fact that the fiber average diameter is smaller than the BaTiO3 single particles and
clusters (figure 7.3b). The average fiber diameter for the BaTiO3/P(VDF-TrFE)
composites with 10 nm particles diameter is 469 ± 136 nm, for the composite with 100
nm particles is 543 ± 92 nm and for the membrane with 500 nm particles size shows an
mean diameter of 377 ± 70 nm, which is smaller than the particles itself making
impossible entrapment of the filler inside the polymer fiber (figure 7.3).
The sample obtained in the drum collector (figure 7.3d) presents a preferential
fiber orientation with an average fiber diameter of 525 ± 126 nm and with a compact
structure. For randomly and aligned fibers, it was noted that composites fibers are
uniformly filled with discontinuous ceramic particles that are essentially inside of the
fibers giving origin to a self-assemble BaTiO3 fiber morphology (figure 7.3c and d).
This preferential arrangement of electroactive ceramic particles is probably due to the
difference of specific density between the polymer matrix and the filler.
7.2.2. Polymer phase and crystallinity
The nature of the polymer crystalline phase present in the electrospun
BaTiO3/P(VDF-TrFE) fibers can be identified by Fourier transformed infrared
spectroscopy (FTIR) (figure 7.4a) and by differential scanning calorimetry (DSC)
(figure 7.4b).
800 1000 1200 1400 1600
a)8.0 mL/h
PVDF
P(VDF-TrFE)
1.0 mL/h
Tra
nsm
itta
nce
(a
.u.)
Wavenumber (cm-1)
100 120 140 160 180 200
b)8.0 mL/h
1.0 mL/h
P(VDF-TrFE)
PVDF
.
Q (
W/g
)
Temperature (ºC)
endo
1 W
/g
Figure 7.4: a) Infrared measurements for the PVDF and BaTiO3/P(VDF-TrFE) electrospun membranes with a tip inner diameter of 0.5 mm, applied voltage of 25 kV, distance between tip and collector of 20 cm and a flow rate of 1.0 and 8.0 mL/h; b) DSC results for the PVDF and BaTiO3/P(VDF-TrFE) electrospun membranes with a tip inner diameter of 0.5 mm, applied voltage of 25 kV and a distance between tip and collector of 20 cm and a flow rate of 1.0 and 8.0 mL/h.

7 – ENERGY HARVESTING PERFORMANCE OF PVDF BASED ELECTROSPUN FIBERS
130
FTIR spectra showed that nanocomposite crystallization occurs in the polymer
ferroelectric phase due to the presence of the characteristic absorption band at 840 cm-1
[27] (figure 7.4a). It was observed that changes in electrospinning processing
conditions do not affect polymer crystallization, because any suppression of polymer
absorption bands was noted.
Poly(vinylidene-fluoride) DSC thermogram shows a peak around 160 ºC which
corresponds to the melting temperature of the polymer (figure 7.4b). The DSC
thermogram of the P(VDF-TrFE) shows two characteristic peaks: the one at lower
temperatures corresponds to the ferroelectric-paraelectric transition and occurs around
117 ºC, the second peak correspond to the melting of the paraelectric phase and is
located around 145 ºC (figure 7.4b). The DSC thermograms of BaTiO3/P(VDF-TrFE)
composites show the same two peaks, located at the same temperatures, which confirms
that changes in the electrospinning conditions does not change the ferroelectric polymer
phase. The inclusion of different filler contents also does not affect the polymer polar
phase, as has been demonstrated in previous works [29].
7.2.3. Energy harvesting response
Piezoelectric properties are being used for sensors and actuators as well as for
energy harvesting applications, taking advantage of nanoscale materials such as
nanowires, nanorods and nanofibers from PZT, BaTiO3 or ZnO [15-16, 22].
It has been demonstrated the capability of PVDF film, [17] PZT [15] and BaTiO3
[16] fibers as energy harvesters once the materials have been processed and poled. It
was also demonstrated that the electrospinning process results in electrically poled
fibers in a single step production process due to the high electric field involved during
the processing stage [28].
BaTiO3/P(VDF-TrFE) composite fiber as well as pure PVDF and P(VDF-TrFE)
electrospun fibers were directly spun into a interdigitated array (figure 7.4b) at an
electric field of 1.25 kV/cm, a needle inner diameter of 0.5 mm and a flow rate of 1

7 – ENERGY HARVESTING PERFORMANCE OF PVDF BASED ELECTROSPUN FIBERS
131
mL/h. It was observed previously by Sencadas et al. that the PVDF electrospun fibers
are poled when the fiber travel from the needle to the collector [28], and is unnecessary
to perform an extra poling procedure after fiber processing. Electrospun samples were
submitted to a periodic bending oscillation at different frequencies. The energy
harvesting device was then submitted to mechanical excitations in the frequency range
between 1 Hz to 1 kHz using an electromechanical vibration generator (figure 2.3c), in
which the polymer and polymer/ceramic fibers are working in longitudinal mode with
the alternating pressure results in surface charge variations in the fibers due to their
combined tensile and bending stresses. A voltage difference between two adjacent
electrodes is thereby induced; interdigitated electrodes enhance the power output of the
generator as the piezoelectric fibers between each pair of adjacent electrodes results in a
power generating unit connected in parallel to other units.
In order to align the fibers, the interdigitated electrodes were grounded on two
terminals in a process similar to the one suggested by Ramakrishma et al. [18]. The
distance between the anode and the cathode was about 0.5, 0.2 and 0.1 mm as showed
in figure 2.3b.
The piezoelectric fiber generators were tested under two different conditions. In
the first one, the output voltage of the PVDF, P(VDF-TrFE) and BaTiO3/P(VDF-TrFE)
(20 % ceramic loading at the different filler average sizes) electrospun fibers was
measured by applying a periodic deformation at different frequencies.

7 – ENERGY HARVESTING PERFORMANCE OF PVDF BASED ELECTROSPUN FIBERS
132
As presented in figure 7.5, the generated voltage induced by piezopotential
reached 150 mV for the PVDF fibers. On the other hand, P(VDF-TrFE) fibers showed
a maximum piezopotential around 110 mV and the electrical output voltage measured
for the BaTiO3/P(VDF-TrFE) electrospun fibers decreases with increasing ceramic
particle average diameter for a fixed fiber loading. An average piezopotential of ~100
mV was found for the fibers with BaTiO3 particles of ~10 nm, which is higher to the
one found for the pure polymer matrix, the piezopotential strongly decreases with
increasing filler size (figure 7.5c).
0 2 4 6
-100
-50
0
50
100
Vpp
1 kHza)
Time (ms)
Vo
lta
ge
(m
V)
100
101
102
103
40
60
80
100
120
140
160
180 b) PVDF
P(VDF-TrFE)
10 nm
100 nm
500 nm
|V| m
ax (
mV
)
Frequency (Hz)
0 100 200 300 400 50050
60
70
80
90
100
Vo
lta
ge
(m
V)
BaTiO3 particle diameter (nm)
c)
100
101
102
103
0.0
5.0x10⁻³
1.0x10⁻²
1.5x10⁻²
2.0x10⁻²
2.5x10⁻²
d)
Pm
ax (W
)
Frequency (Hz)
PVDF
P(VDF-TrFE)
10 nm
100 nm
500 nm
Figure 7.5: Voltage generated during 6 ms at a frequency of 1 kHz, of an electrospun sample of BaTiO3/P(VDF-TrFE) with 20 % of ceramic 10 nm; b) maximum voltage generated at different frequencies for all type of samples produced; c) piezopotential obtained at 1 kHz for P(VDF-TrFE) and BaTiO3/P(VDF-TrFE) with 20 % ceramic filler and d) maximum power generated by the electrospun membranes as a function of frequency.
The negative voltage signal observed in figure 7.5a is generated by reverse
flowing carriers when the external load is removed and the piezopotential vanish. The

7 – ENERGY HARVESTING PERFORMANCE OF PVDF BASED ELECTROSPUN FIBERS
133
fibers generated power promoted by the periodic harmonic vibration can be calculated
through equation 2.9.
In this setup, where the fibers are attached to each pair of adjacent electrodes, the
piezoelectric coefficient that mostly contributes for the electrical output voltage is the
one along the fiber longitudinal direction, commonly denominated as d31, where the
polymer chains are stretched along the fiber and the output electrical signal is measured
in the thickness direction.
Goldfard and Jones [30] investigated the efficiency of a piezoelectric material in a
stack configuration for converting mechanical harmonic excitation into electric energy.
In general, the conversion efficiency can be improved with a larger coupling coefficient
and smaller damping. Table 7.1 shows the characteristic electroactive properties of
PVDF, P(VDF-TrE) and BaTiO3.
Table 7.1: Characteristic physical properties of electroactive PVDF, P(VDF-TrFE) and BaTiO3 [26, 31].
PVDF P(VDF-TrFE) BaTiO3
d31 (pC/N) 8 - 22 12 -34
d33 (pC/N) -24 to -34 -38 125
k33 0.20 0.29 12.6
’ 6 - 12 18 1700
Table 7.1 shows that piezoelectric coefficients of the ceramic filler and its
electromechanical coupling coefficient are larger than pure polymer and therefore will
tend to increase electromechanical conversion and power output. On the other hand, the
electromechanical system can be modeled by a coupled spring-mass-damper system,
[32] and in the case of the BaTiO3/P(VDF-TrFE) the ceramic nanoparticles acts as
defects in fibers (figure 7.3), contributing for the increase of the damping of the
composite fibers and consequently for the decrease of the mechanical to electrical
energy conversion. As observed in figure 7.5, the reduction of the electromechanical
conversion due to increased damping is larger than positive contribution of the larger
coupling coefficient of the fillers, resulting in an overall decrease of the power output. It
should be noted that, despite the larger electromechanical coupling coefficient, the
output power for P(VDF-TrFE) fibers is also lower due to lower piezoelectric
coefficient and larger damping, related to the increase of stiffness with respect to the
pure polymer. Additional contributions to the decrease of the output power in the
composites can arise from the random orientation of the BaTiO3 electroactive domains,

7 – ENERGY HARVESTING PERFORMANCE OF PVDF BASED ELECTROSPUN FIBERS
134
leading to an overall reduction of the effective dipolar moment of the electroactive
composite fibers when compared to the single polymer. The piezoelectric coefficients of
organic and inorganic phases are opposed, which can lead to counteract effects [33-34].
It’s important to notice that among all the used ceramic particles only the particles with
500 nm are tetragonal and therefore piezoelectric (table 7.2), the particles with 10 and
100 nm are cubic and then non-piezoelectric, contributing to an increase of the dielectric
constant but without direct piezoelectric contribution to the final composite response.
Table 7.2: Structural properties of the BaTiO3 ceramic particles [35].
Ø = 10 nm Ø = 100 nm Ø = 500 nm
Purity (%) 99.8 99.9 99.9
Crystallographic form cubic Cubic tetragonal
Consequently, the maximum output power is obtained for the PVDF fibers (0.02
W) and a decrease of the generated power was observed for the P(VDF-TrFE) and for
the BaTiO3/P(VDF-TrFE) fibers (figure 7.5d). It is interesting to notice that the output
power is nearly frequency independent in the 100 Hz to 1 kHz frequency range under
study, which is interesting for a broad range of applications.
In order to study the effect of larger deformations on the output voltage of the
electroactive polymer fibers and fiber composites, the finger (protected by an insulator
glove to prevent interferences from human bioelectricity) was used to apply a periodic
dynamic loading on the top of the generator by simple tapping during which, the
positive and the negative output voltage was measured (figure 7.6).
28.4 28.5 28.6 28.7 28.8
0
1
2
3
4
5 b)
Vo
lta
ge
(V
)
Time (ms)
Figure 7.6: a) Diagram of a bending test performed with a finger; b) Positive output voltage generated during a test performed with finger deformation for the PVDF electrospun fibers.

7 – ENERGY HARVESTING PERFORMANCE OF PVDF BASED ELECTROSPUN FIBERS
135
The highest output voltage record during the finger experiment was 5.02 V,
allowing concluding that amplitude of the voltage output depends on the amount of the
strain imposed to the surface generator, being higher for higher mechanical
deformations (figure 7.6b) as larger strains provide more mechanical energy available
for conversion into electrical energy. The maximum output power generated for higher
strains was 25 W, which confers large interest to these piezoelectric vibration-to-
electricity converters for micromechanical memory devices [36] and bioapplications in
order to harvest human motion to power in-body biosensors.
Chen et al. [15] studied the characteristics of a piezoelectric nanowires of only
PZT on top of interdigitated electrodes and obtained a power generation of 0.03 W
for higher deformations. In another work, the same amount of power was generated
with poled BaTiO3, Park et al. [16] obtained by magnetron sputtering on top of a
flexible interdigitated electrodes substrate an under higher mechanical deformation.
7.3. Conclusion
As a conclusion, the largest energy harvesting efficiency is obtained for the pure
poly(vinylidene fluoride) fibers, with power outputs up to 0.02 W and 25 W under
low and high mechanical deformation. The copolymer and the polymer/ceramic
composites show reduced power output due to increased mechanical stiffness. The
obtained values, among the largest found in the literature, the easy processing and the
low cost and robustness of the polymer, demonstrate the applicability of the developed
system.

7 – ENERGY HARVESTING PERFORMANCE OF PVDF BASED ELECTROSPUN FIBERS
136
7.4. References
1. Alper Erturk and D.J. Inman. Introduction to Piezoelectric Energy Harvesting,
in Piezoelectric Energy Harvesting, Alper Erturk and D.J. Inman, Editors. 2011,
John Wiley & Sons, Ltd: Chichester, UK. p. 1-14.
2. Hyunuk Kim, Yonas Tadesse, and S. Priya. Piezoelectric Energy Harvesting, in
Energy Harvesting Technologies, Shashank Priya and D.J. Inman, Editors. 2009,
Springer: New York, USA. p. 3-36.
3. Anton, S.R. and H.A. Sodano. A review of power harvesting using piezoelectric
materials (2003–2006). Smart Materials and Structures, 2007. 16(3): p. R1.
4. Williams, C.B. and R.B. Yates. Analysis of a micro-electric generator for
microsystems. Sensors and Actuators A: Physical, 1996. 52(1–3): p. 8-11.
5. Rocha, J.G., L.M. Goncalves, P.F. Rocha, M.P. Silva, and S. Lanceros-Mendez.
Energy Harvesting From Piezoelectric Materials Fully Integrated in Footwear.
Industrial Electronics, IEEE Transactions on, 2010. 57(3): p. 813-819.
6. Lee, C.S., J. Joo, S. Han, and S.K. Koh. Multifunctional transducer using poly
(vinylidene fluoride) active layer and highly conducting poly (3,4-
ethylenedioxythiophene) electrode: Actuator and generator. Applied Physics
Letters, 2004. 85(10): p. 1841-1843.
7. Lee, C.S., J. Joo, S. Han, J.H. Lee, and S.K. Koh. Poly (vinylidene fluoride)
transducers with highly conducting poly (3,4-ethylenedioxythiophene)
electrodes. Synthetic Metals, 2005. 152(1–3): p. 49-52.
8. Tashiro, K. Crystal Structure and Phase Transition of PVDF and Related
Copolymers in Ferroelectric Polymers: chemistry, physics, and applications,
H.S. Nalwa, Editor. 1995, Marcel Dekker, Inc: New York, USA. p. 63-.
9. Brown, L.F. Design considerations for piezoelectric polymer ultrasound
transducers. Ultrasonics, Ferroelectrics and Frequency Control, IEEE
Transactions on, 2000. 47(6): p. 1377-1396.
10. Sencadas, V., S. Lanceros-Méndez, and J.F. Mano. Effect of the mechanical
stretching on the ferroelectric properties of a (VDF/TrFE) (75/25) copolymer
film. Solid State Communications, 2004. 129(1): p. 5-8.
11. Kap Jin, K. and K. Gwan Bum. Curie transition, ferroelectric crystal structure
and ferroelectricity of a VDF/TrFE (75
/25) copolymer: 2. The effect of poling on
Curie transition and ferroelectric crystal structure. Polymer, 1997. 38(19): p.
4881-4889.
12. Sencadas, V., S. Lanceros-Méndez, and J.F. Mano. Thermal characterization of
a vinylidene fluoride-trifluorethylene (75–25) (%mol) copolymer film. Journal of
Non-Crystalline Solids, 2006. 352(50-51): p. 5376-5381.

7 – ENERGY HARVESTING PERFORMANCE OF PVDF BASED ELECTROSPUN FIBERS
137
13. Tanaka, R., K. Tashiro, and M. Kobayashi. Annealing effect on the ferroelectric
phase transition behavior and domain structure of vinylidene fluoride (VDF)–
trifluoroethylene copolymers: a comparison between uniaxially oriented VDF
73 and 65% copolymers. Polymer, 1999. 40(13): p. 3855-3865.
14. Wang, Z.L. and J. Song. Piezoelectric Nanogenerators Based on Zinc Oxide
Nanowire Arrays. Science, 2006. 312(5771): p. 242-246.
15. Chen, X., S. Xu, N. Yao, and Y. Shi. 1.6 V Nanogenerator for Mechanical
Energy Harvesting Using PZT Nanofibers. Nano Letters, 2010. 10(6): p. 2133-
2137.
16. Park, K.-I., S. Xu, Y. Liu, G.-T. Hwang, S.-J.L. Kang, Z.L. Wang, and K.J. Lee.
Piezoelectric BaTiO3 Thin Film Nanogenerator on Plastic Substrates. Nano
Letters, 2010. 10(12): p. 4939-4943.
17. Patel, I., E. Siores, and T. Shah. Utilisation of smart polymers and ceramic
based piezoelectric materials for scavenging wasted energy. Sensors and
Actuators A: Physical, 2010. 159(2): p. 213-218.
18. S. Ramakrishma, K. Fujihara, W. Teo, T. Lim, and Z. Ma. Introduction, in An
Introduction to Electrospinning and Nanofibers, S. Ramakrishma, K. Fujihara,
W. Teo, T. Lim, and Z. Ma, Editors. 2005, World Scientific Printers Co. Pte.
Ltd.: Singapore. p. 1-18.
19. Andrady, A.L. Introduction, in Science and Technology of Polymer Nanofibers
A.L. Andrady, Editor. 2008, Jonh Wiley & Sons, Inc.: New Jersey, USA. p. 1-
26.
20. Greiner, A. and J.H. Wendorff. Electrospinning: A Fascinating Method for the
Preparation of Ultrathin Fibers. Angewandte Chemie International Edition,
2007. 46(30): p. 5670-5703.
21. He, J.-H. Electrospun Nanofibres and Their Applications. 2008, Shawbury,
Shrewsbury, Shropshire, U.K.: iSmithers.
22. Dong, Z., S.J. Kennedy, and Y. Wu. Electrospinning materials for energy-
related applications and devices. Journal of Power Sources, 2011. 196(11): p.
4886-4904.
23. Fang, J., X. Wang, and T. Lin. Electrical power generator from randomly
oriented electrospun poly(vinylidene fluoride) nanofibre membranes. Journal of
Materials Chemistry, 2011. 21(30): p. 11088-11091.
24. Vullers, R.J.M., R. van Schaijk, I. Doms, C. Van Hoof, and R. Mertens.
Micropower energy harvesting. Solid-State Electronics, 2009. 53(7): p. 684-693.
25. Chao-Nan, X., M. Akiyama, K. Nonaka, and T. Watanabe. Electrical power
generation characteristics of PZT piezoelectric ceramics. Ultrasonics,

7 – ENERGY HARVESTING PERFORMANCE OF PVDF BASED ELECTROSPUN FIBERS
138
Ferroelectrics and Frequency Control, IEEE Transactions on, 1998. 45(4): p.
1065-1070.
26. Liu, D. and J. Li. The enhanced and optimal piezoelectric coefficients in single
crystalline barium titanate with engineered domain configurations. Applied
Physics Letters, 2003. 83(6): p. 1193-1195.
27. Ribeiro, C., V. Sencadas, J.L.G. Ribelles, and S. Lanceros-Méndez. Influence of
Processing Conditions on Polymorphism and Nanofiber Morphology of
Electroactive Poly(vinylidene fluoride) Electrospun Membranes. Soft Materials,
2010. 8(3): p. 274-287.
28. Sencadas, V., C. Ribeiro, I.K. Bdikin, A.L. Kholkin, and S. Lanceros-Mendez.
Local piezoelectric response of single poly(vinylidene fluoride) electrospun
fibers. physica status solidi (a), 2012. 209(12): p. 2605-2609.
29. Mendes, S.F., C.M. Costa, C. Caparros, V. Sencadas, and S. Lanceros-Méndez.
Effect of filler size and concentration on the structure and properties of
poly(vinylidene fluoride)/BaTiO3 nanocomposites. Journal of Materials Science,
2012. 47(3): p. 1378-1388.
30. Goldfarb, M. and L.D. Jones. On the Efficiency of Electric Power Generation
With Piezoelectric Ceramic. Journal of Dynamic Systems, Measurement, and
Control, 1999. 121(3): p. 566-571.
31. Martins, P., A.C. Lopes, and S. Lanceros-Mendez. Electroactive phases of
poly(vinylidene fluoride): Determination, processing and applications. Progress
in Polymer Science, (0).
32. Erturk, A. and D.J. Inman. Issues in mathematical modeling of piezoelectric
energy harvesters. Smart Materials and Structures, 2008. 17(6): p. 065016.
33. Lam, K.H. and H.L.W. Chan. Piezoelectric and pyroelectric properties of
65PMN-35PT/P(VDF-TrFE) 0–3 composites. Composites Science and
Technology, 2005. 65(7–8): p. 1107-1111.
34. Chan, H.L.W., M.C. Cheung, and C.L. Choy. Study on BaTiO3/P(VDF-TrFE)
0–3 composites. Ferroelectrics, 1999. 224(1): p. 113-120.
35. Nanoamor®. Nanostructured & Amorphous Materials, Inc. 2001 [cited 2013;
Available from: http://www.nanoamor-
europe.com/catalogsearch/result/?q=barium+titanate.
36. Shu, Y.C. and I.C. Lien. Efficiency of energy conversion for a piezoelectric
power harvesting system. Journal of Micromechanics and Microengineering,
2006. 16(11): p. 2429.

8 - Final remarks, conclusions and future work
In this chapter some final remarks are presented comparing the characteristics of
the different porous composite membranes prepared in this work for battery
applications. The main conclusions of this study and some possibilities for the future
work are also presented.


8 – FINAL REMARKS, CONCLUSION AND FUTURE WORK
141
8.1. Final remarks
A battery separator should meet some requirements, such as being ionic
conductor, electronic insulator, to show mechanical and dimensional stability,
physically strength to allow easily handling, to be readily wetted by electrolyte
solutions, to show resistant to chemical and thermal degradation, uniform thickness and
structure, among others [1-3].
In this sense, among all prepared composites the 16 wt% NaY/P(VDF-TrFE), 4
wt% MMT/P(VDF-TrFE), 0.1 wt% MWCNT/P(VDF-TrFE) and 16 wt%
BaTiO3/P(VDF-TrFE) (Ø = 500 nm) were the ones with the best overall results [4-7] for
each filler type, so their results are presented and compared below.
All tested composites present a uniform and homogenous porous structure, as
shown in figure 8.1.
Figure 8.1: Cross section images of: a) pristine P(VDF-TrFE), b) 16 wt% NaY/P(VDF-TrFE), c) 4 wt%
MMT/ P(VDF-TrFE), d) 0.1 wt% MWCNT/ P(VDF-TrFE) and e) 16 wt% BaTiO3/ P(VDF-TrFE)
membranes.
The inclusion of the different fillers into the P(VDF-TrFE) polymer matrix does
not affect the homogeneity of the polymer porous structure.

8 – FINAL REMARKS, CONCLUSION AND FUTURE WORK
142
The pore size and porosity largely affects the permeability and the electrolyte
uptake of the separator [1]. Table 8.1 and figure 8.2 show the pore size, porosity and
electrolyte solution uptake of the composite membranes.
Table 8.1: Average pore size, porosity and electrolyte uptake of the membranes.
Sample Average pore size (µm) Porosity (%) Uptake (%)
P(VDF-TrFE) 7.9 ± 2.7 70.0 ± 3.5 223.1 ± 8.7
16 wt% NaY/P(VDF-TrFE) 20.6 ± 4.2 36.0 ± 1.8 232.8 ± 14.3
4 wt% MMT/P(VDF-TrFE) 11.3 ± 6.4 82.8 ± 4.1 327.4 ± 16.4
0.1 wt% MWCNT/P(VDF-TrFE) 59.8 ± 14.9 75.7 ± 9.9 252.3 ± 8.9
16 wt% BaTiO3/P(VDF-TrFE) 43.1 ± 5.9 80.2 ± 8.4 303.5 ± 13.0
Figure 8.2: a) Average pore size and b) porosity and uptake for the P(VDF-TrFE), 16 wt% NaY/P(VDF-
TrFE), 4 wt% MMT/P(VDF-TrFE), 0.1 wt% MWCNT/P(VDF-TrFE) and 16 wt% BaTiO3/P(VDF-TrFE)
membranes.
The pore size tends to be higher for the composite membranes, when compared to
the pure copolymer, being markedly larger for MWCNT and BaTiO3 composite
membranes. The only exception is NaY composite membranes. This increase is
reflected in the electrolyte solution uptake which is higher for MMT, MWCNT and
BaTiO3 membranes, and just slightly higher in NaY membrane, when compared to the
pure co-polymer. This can be taken as an advantage of the NaY membranes, since too
large uptakes can affect mechanical and thermal stabilities [8].
The electrochemical behaviour of the separator is crucial for the battery
performance, as it affects the charge/discharge capacities [2-3]. The ionic conductivity
P(VDF-TrFE) NaY MMT MWCNT BaTiO3
0
10
20
30
40
50
60
70
80 a)
Ave
rag
e p
ore
siz
e (m
)
Samples
P(VDF-TrFE) NaY MMT MWCNT BaTiO30
50
100
150
200
250
300
350b)
P
rop
ert
y (
%)
Samples
Porosity
Uptake

8 – FINAL REMARKS, CONCLUSION AND FUTURE WORK
143
strongly depends on electrolyte uptake, which in turn depends on porosity and pore size
[9].
Table 8.2 and figure 8.3 shows the ionic conductivity (σi), tortuosity () and
activation energy (Ea) of the composites, obtained from equation 2.5, 2.6 and 2.7
respectively.
Table 8.2: Room temperature ionic conductivity (σi), tortuosity () and activation energy (Ea) of the membranes filled with 1 M LiClO4.3H2O electrolyte solution; σ0 = 9.8 S/cm at 25 ºC.
Sample σi (S/cm) τ Ea (kJ/mol)
P(VDF-TrFE) 5.24×10⁻⁷ 115 64
16 wt% NaY/P(VDF-TrFE) 2.33×10⁻⁶ 39 44
4 wt% MMT/P(VDF-TrFE) 1.61×10⁻⁶ 117 10
0.1 wt% MWCNT/P(VDF-TrFE) 2.04×10⁻⁶ 61 5
16 wt% BaTiO3/P(VDF-TrFE) 9.22×10⁻⁶ 29 32
Figure 8.3: Room temperature a) ionic conductivity; b) tortuosity and activation energy for the P(VDF-TrFE), 16 wt% NaY/P(VDF-TrFE), 4 wt% MMT/P(VDF-TrFE), 0.1 wt% MWCNT/P(VDF-TrFE) and 16 wt% BaTiO3/P(VDF-TrFE) membranes.
The room temperature ionic conductivity of the composite membranes is about
one order of magnitude higher than for the pure polymer, indicating that fillers inclusion
benefits the ionic conduction process, which is confirmed by the decrease of the
activation energy and tortuosity of almost all composite membranes.
P(VDF-TrFE) NaY MMT MWCNT BaTiO30
2x10⁻⁶
4x10⁻⁶
6x10⁻⁶
8x10⁻⁶
a)
i (
S/c
m)
Samples
P(VDF-TrFE) NaY MMT MWCNT BaTiO30
30
60
90
120
Samples
P(VDF-TrFE) NaY MMT MWCNT BaTiO30
20
40
60
b)
Ea (
kJ/m
ol)

8 – FINAL REMARKS, CONCLUSION AND FUTURE WORK
144
The temperature stability of the ionic conductivity is important for the
temperature range operation of a battery. The temperature dependence of the ionic
conductivity is shown in figure 8.4.
2.6 2.7 2.8 2.9 3.0 3.1 3.2 3.3 3.4
-6
-5
-4
-3
-2
Lo
g
i (S
/cm
)
1000/T (K-1)
P(VDF-TrFE)
NaY
MMT
MWCNT
BaTiO3
Figure 8.4: Log i as function of 1000/T of (VDF-TrFE), 16 wt% NaY/P(VDF-TrFE), 4 wt% MMT/P(VDF-TrFE), 0.1 wt% MWCNT/P(VDF-TrFE) and 16 wt% BaTiO3/P(VDF-TrFE) membranes.
All fillers contribute to diminish ionic conductivity variations with temperature,
namely MMT and MWCNT.
In general, all fillers have specific improvements in the overall membranes
performance, although NaY is the best choice for this application due to the high ionic
conductivity (2.33×10⁻⁶
S/cm) in a large temperature range, suitable porosity and
electrolyte uptake (36.0 and 232.8 %).

8 – FINAL REMARKS, CONCLUSION AND FUTURE WORK
145
8.2. Conclusions
The need to develop efficient energy generation and storage devices was the main
motivation for the present work. In this sense, the combined use of polymer-based
materials (poly(vinylidene fluoride) (PVDF) and its copolymers) with different types of
fillers (zeolites, clays, carbonaceous and ceramics fillers) proved to be a viable and
promising route to improve the performance of these devices.
The thermally induced phase separation technique proved to be adequate to
prepare polymer composite porous membranes based on poly(vinylidene fluoride-co-
trifluoroethylene) (P(VDF-TrFE)) with NaY, montmorillonite (MMT), multiwalled-
carbon nanotubes (MWCNT) and BaTiO3 fillers with suitable properties for batteries
separators applications.
The diverse nature of each filler results in different effects on the properties of the
composite with respect to the pristine polymer. The presence of fillers in the polymeric
matrix tends to increase the average pore size, from 7.9 μm for pristine polymer to
higher values of 43.1 and ~60 μm for BaTiO3 and MWCNT membranes, respectively.
The porosity of the composites also tends to be higher than that of the pristine
polymer, increasing from 70.0 % for P(VDF-TrFE) to a maximum of 83 % for MMT,
with the exception of NaY membrane which presents the lower value of 36.0 %. The
membranes with higher porosities, MMT, MWCNT and BaTiO3, also present higher
electrolyte uptakes, 327, 252 and 304 % respectively, compared to the 223 % of the
pristine polymer. The NaY membrane, despite the lower porosity, also presents a slight
increase in the electrolyte uptake up to 238 %.
The tortuosity and activation energy show a strong decrease for almost all
composites, when compared to the pristine polymer. The tortuosity of 115 is strongly
decreased to 61, 39 and 29 for MWCNT, NaY and BaTiO3 membranes respectively.
The activation energy decreases markedly from 64 kJ/mol for P(VDF-TrFE) to 10 and 5
kJ/mol for MMT and MWCNT composites, respectively.
The inclusion of fillers leads to an increase in the room temperature ionic
conductivity of the pristine polymer (5.24×10⁻⁷
S/cm), up to 2.33×10⁻⁶
S/cm for the
composite with NaY, 1.61×10⁻⁶
S/cm for the MMT composite, 2.04×10⁻⁶
S/cm for the
one with MWCNT and a maximum of 9.22×10⁻⁶
S/cm for the BaTiO3 composite. The
ionic conductivity variation with temperature is also diminished in the presence of

8 – FINAL REMARKS, CONCLUSION AND FUTURE WORK
146
fillers, namely for MMT and MWCNT membranes. All the composite membranes
showed a stable operation window of at least 6.0 V, suitable for applications.
In short, all fillers result in improved properties of the polymeric matrix, however
the NaY particles are the best choice for these applications due to the suitable porosity
(36.0 %), moderate electrolyte uptake (232.8 %) and high ionic conductivity in all
temperature range. Furthermore, the increase in the ionic conductivity of the NaY
membranes is related to the slight reduction in crystallinity from 28 % to 23 % for
pristine polymer and NaY/P(VDF-TrFE) respectively, and not to higher porosity and
electrolyte uptake which would affect the thermal and mechanical stability.
Regarding energy harvesting performance, electrospinning proved to be a suitable
technique for the preparation of polymeric based fibres for energy harvesting systems.
PVDF is more effective than P(VDF-TrFE) and BaTiO3/P(VDF-TrFE) mainly due to
mechanical damping fillers as well as a lower piezoelectric response of the composites.
The generated output powers of 0.02 W and 25 W, under low and high mechanical
deformation respectively, for PVDF fibers are suitable for micromechanical devices and
biosensor applications.
It is concluded that main objectives of this study were successfully achieved and
the work represents an effective contribution to the development of novel polymer-
based materials for energy applications.
8.3. Future work
The obtained results of this study allow opening new lines of research and works
for the future.
The incorporation of individualized specific fillers, in proper amounts, into
polymer matrices has shown to be advantageous in producing porous membranes for
battery applications. In this sense, the combined use of different fillers would be
interesting and promising to tune specific characteristics of the polymeric matrix to
improve its performance in Li-ion batteries separator applications. Further investigation
in different functionalizations of the polymer matrix and/or fillers is also a path to
follow for optimizing these systems. The obtained results also raise the possibility of
upscaling these materials for use in the production of lithium batteries, therefore the

8 – FINAL REMARKS, CONCLUSION AND FUTURE WORK
147
best composites should be tested as separators membranes in batteries, evaluating the
cycling performance and rate capabilities.
The energy harvesting system proposed can be effectively improved by
optimizing the interface between the interdigitated electrodes and fibers, e.g.
encapsulating the fibers, as well as improving the energy collection circuit. These
improvements could make the system able to be upscaled for energy generation
systems.

8 – FINAL REMARKS, CONCLUSION AND FUTURE WORK
148
8.4. References
1. Costa, C.M., M.M. Silva, and S. Lanceros-Mendez. Battery separators based on
vinylidene fluoride (VDF) polymers and copolymers for lithium ion battery
applications. RSC Advances, 2013. 3(29): p. 11404-11417.
2. Arora, P. and Z. Zhang. Battery Separators. Chemical Reviews, 2004. 35(50): p.
4419-4462.
3. Park, J.-K. Principles and applications of lithium secondary batteries. 2012,
Weinheim: Wiley-VCH.
4. Nunes-Pereira, J., A.C. Lopes, C.M. Costa, L.C. Rodrigues, M.M. Silva, and S.
Lanceros-Méndez. Microporous membranes of NaY zeolite/poly(vinylidene
fluoride–trifluoroethylene) for Li-ion battery separators. Journal of
Electroanalytical Chemistry, 2013. 689(0): p. 223-232.
5. Nunes-Pereira, J., A.C. Lopes, C.M. Costa, R. Leones, M.M. Silva, and S.
Lanceros-Méndez. Porous Membranes of Montmorillonite/Poly(vinylidene
fluoride-trifluorethylene) for Li-Ion Battery Separators. Electroanalysis, 2012.
24(11): p. 2147-2156.
6. Nunes-Pereira, J., C.M. Costa, R. Leones, M.M. Silva, and S. Lanceros-Méndez.
Li-ion battery separator membranes based on poly(vinylidene fluoride-
trifluoroethylene)/carbon nanotube composites. Solid State Ionics, 2013. 249–
250(0): p. 63-71.
7. Nunes-Pereira, J., C.M. Costa, R.E. Sousa, A.V. Machado, M.M. Silva, and S.
Lanceros-Méndez. Li-ion battery separator membranes based on barium
titanate and poly(vinylidene fluoride-co-trifluoroethylene) Submited to
Electrochimica Acta (under revision).
8. Saunier, J., F. Alloin, J.Y. Sanchez, and L. Maniguet. Plasticized microporous
poly(vinylidene fluoride) separators for lithium-ion batteries. III. Gel properties
and irreversible modifications of poly(vinylidene fluoride) membranes under
swelling in liquid electrolytes. Journal of Polymer Science Part B: Polymer
Physics, 2004. 42(12): p. 2308-2317.
9. Saito, Y., H. Kataoka, E. Quartarone, and P. Mustarelli. Carrier Migration
Mechanism of Physically Cross-Linked Polymer Gel Electrolytes Based on
PVDF Membranes. The Journal of Physical Chemistry B, 2002. 106(29): p.
7200-7204.