Embed Size (px)
Citation preview

<'iS^«<
A3AHHS
A^iutpg jo

Source Areas of Salinity andTrends of Salt Loads in Streamflow inthe Upper Colorado River, Texas£yJACKRAWSON
GEOLOGICAL SURVEY WATER-SUPPLY PAPER 2084
Prepared in Cooperation with the U.S. Army Corps of Engineers
UNITED STATES GOVERNMENT PRINTING OFFICE, WASHINGTON-.1982

UNITED STATES DEPARTMENT OF THE INTERIOR
JAMES G. WATT, Secretary
GEOLOGICAL SURVEY
Dallas L. Peck, Director
Library of Congress Cataloging in Publication Data
Rawson, Jack.Source areas of salinity and trends of salt loads in streamflow in the upper Colorado River,
Texas.
(Geological Survey water-supply paper ; 2084Supt. of Docs, no.: I 19.13:20841. Saline waters-Colorado River. 2. Stream measurements-Colorado River. I. United
States. Army. Corps of Engineers. II. Title. III. Series: United States. GeologicalSurvey. Water-supply paper ; 2084.
GB705.T4R38 551.48'3'097913 80-607873
For sale by the Distribution Branch, U.S. Geological Survey, 604 South Pickett Street, Alexandria, VA 22304

CONTENTS
Page
Factors for converting inch-pound units to International System units ______ VAbstract _______________________________ _ 1Introduction__________________________________ _ _ 1
Purpose and scope _________________________________ 1Previous studies ___________________________________ 2
Description of drainage area ______________________________ 3Topography, drainage, and diversion _______________________ 3General geology and quality of ground water __________________ 4Location of oil fields ________________________________ 6
Methods of investigation ________________________________ 8Low-flow studies ___________________________________ 8Salt-load trend studies _____________________________ 10
Analysis of data _____________________________________ 11Synopsis of quantity and quality of low flows __________________ 11
General ______________________________________ 11Reach from mile 831.8 to mile 826.3 _____________________ 26Reach from mile 826.3 to mile 810.6 _____________________ 27Reach from mile 810.6 to mile 796.3 _____________________ 28
Delineation of source areas of saline inflow ____________________ 29Synopsis of salt-load trend studies _______________________ 30Reduction of salinity by diversions of saline low flows _____________ 34
Summary of conclusions ________________________________ 34References cited _____________________________________ 35
ILLUSTRATIONS
PLATES 1, 2. Maps showing:1. Geology of the upper Colorado River basin and
chemical composition of low flows of streams ____In pocket2. Locations of oil and gas fields ______________In pocket
Page
FIGURE 1. Map showing location of study area _________________ 3 2. Graph showing duration curves of daily flows for selected sites
in the upper Colorado River basin __________________ 9
in

IV CONTENTS
FIGURES 3-8. Graphs, for selected low-flow periods from February 1975 to March 1978, showing:
3. Dissolved-solids, sodium, and chloride concentrationsand water discharge for the Colorado River ______ 13
4. Dissolved-solids, sodium, and chloride loads for theColorado River ______________________ 20
5. Quantity and quality of ground-water accretions and quantity of water lost along the main stem of the Colorado River _______________________ 22
6. Dissolved-solids, sodium, and chloride loads for ground- water accretions along the main stem of the Colorado River ____________________________ 23
7. Percentage of major dissolved cations and anions for theColorado River _______________________ 24
8. Dissolved-solids, sodium, and chloride yields for ground- water accretions along the main stem of the Colorado River ____________________________ 30
9-11. Graphs showing double-mass curve of cumulative discharge and cumulative dissolved-solids loads, Colorado River:
9. Near Ira, Tex ________________________ 3110. Near Cuthbert, Tex ____________________ 3211. At Colorado City, Tex ___________________ 33
TABLES
TABLE 1. Brine production and disposal in Scurry and Mitchell Counties,Tex ___________________________________ 7
2. Index of continuous streamflow and daily water-quality stationson the upper Colorado River _____________________ 10
3. Locations and descriptions of low-flow data-collection sites in theupper Colorado River basin from February 1975 to March 1978 _ 11
4. Results of chemical analyses and discharge measurements for streams in the upper Colorado River basin during selected low- flow periods from February 1975 to March 1978 __________ 14

CONTENTS
FACTORS FOR CONVERTING INCH-POUND UNITS TO INTERNATIONAL SYSTEM (SI) UNITS
[Most units of measurement used in this report are inch-pound units. For those readers interested in using the SI (metric) system, the inch-pound units may be converted to SI units by the following factors:]
Multiply inch-pound units By To obtain SI units
barrel (bbl) 0.1590 cubic meter (m3)(petroleum, 1 bbl = 42 gal).
cubic foot per second (ft3/s) 0.02832 cubic meter per second (m3/s) foot (ft) 0.3048 meter (m) mile (mi) 1.609 kilometer (km) ton per day (ton/d) 0.9072 megagram per day (Mg/d)
(short ton=2,000 Ib).

SOURCE AREAS OF SALINITY AND TRENDSOF SALT LOADS IN STREAMFLOW IN
THE UPPER COLORADO RIVER, TEXAS
By JACK RAWSON
ABSTRACT
A series of seven studies of the quality and quantity of low flows in a 35.5-mile reach of the Colorado River upstream from Colorado City, Tex., were made from February 1975 to March 1978 to delineate areas of saline inflows. These studies showed generally that ground water contributed throughout the reach is saline but that loads of dissolved con stituents in ground-water accretions are highest in three subreaches. Yields per mile of river channel from these subreaches during the low-flow studies averaged more than 5.5 tons of dissolved solids per day, of which more than 1.8 tons were sodium and 2.9 tons were chloride.
Salt-load trend studies for three long-term continuous streamflow and daily water- quality stations show that the salinity of the flow upstream from Ira, Tex., (mile 826.3) in creased significantly after 1963 but decreased significantly after 1970. Part of the reach upstream from Ira is proximate to oil fields, the production and open-pit disposal of oil field brines in the area increased significantly in the early 1960's, but a ban on open-pit disposal was enacted in 1969. No significantly downward trend in the salinity of flow at other daily water-quality stations downstream from Ira occurred after the ban on open- pit disposal of oil-field brines.
The low-flow and salt-load trend studies indicate that part of the salinity in the flow of the Colorado River has resulted from the inflow of oil-field brine, but preponderant evidence indicates that the major part of the salinity is of natural origin. Neither the ban on open-pit disposal nor pumping of saline ground water has significantly reduced the salinity of flow downstream from Cuthbert, Tex. (mile 810.6).
Diversion of saline low flows from the Colorado River at mile 799.3 upstream from Col orado City since January 1969 has resulted in significant improvement in the quality of water. Decreases in the discharge-weighted averages of dissolved solids and of chloride in the flow of the Colorado River at Colorado City (mile 796.3) during the 1969-78 water years were about 420 milligrams per liter and 280 milligrams per liter, respectfully.
INTRODUCTION
PURPOSE AND SCOPE
The upper Colorado River and some of its tributaries between Lake J. B. Thomas and Colorado City, Tex., yield saline waters that ad versely affect the water quality of the river throughout its downstream course to the Gulf of Mexico.
i

2 SOURCE S OF SALINITY, SALT LOADS, COLORADO RIVER, TEX
Several water-quality management programs and remedial projects, including a ban on the disposal of oil-field brines in open pits, diversion of saline low flows from the river, and lowering of ground-water heads and possibly the saline base flow of the river by large withdrawals of saline ground water for use in secondary recovery of oil, have been ini tiated within the past several years. Recent observations by the Col orado River Municipal Water District (CRMWD) (Green and others 1974, p. 45) have indicated that the remedial projects are reducing the quantity of saline inflow to the upper Colorado River.
Data delineating the source areas of saline inflow and the quantity and quality of the flow are needed for comprehensive basin planning by the Corps of Engineers. The U.S. Geological Survey, in cooperation with the U.S. Army Corps of Engineers, began a study in 1975 to delineate the areas of saline inflow and to determine if water-quality management programs and remedial projects are reducing the salinity loads of the Colorado River. Geologic and ground-water studies of the area were conducted by the Corps of Engineers.
PREVIOUS STUDIES
The Geological Survey, in cooperation with the Corps of Engineers, the Texas Department of Water Resources (and its predecessor agen cies), the Colorado River Municipal Water District, the Lower Colorado River Authority, and other agencies, has operated for many years a network of daily and periodic water-quality stations on streams in the Colorado River basin. Water-quality data collected through the 1972 water year have been summarized by Leifeste and Lansford (1968) and by Rawson and others (1973).
Several other studies concerning the chemical quality of surface waters in the basin have been made since 1946. Most of these studies were directed toward determining the sources of salines inflow to the upper part of the basin. The Geological Survey, in cooperation with the Texas Department of Water Resources and the Texas Electric Service Co., studied the quality of surface waters in the Bull Creek area in Scurry County, Tex., in 1946 and in the Cuthbert area in Mitchell County, Tex., in 1948. The results of these studies were summarized by McDowell (1959) in a report describing instrumentation involved in a salt-load studies.
Reed (1961), in a consulting report to the CRMWD concerning the sources of saline water in the Colorado River between Lake J. B. Thomas and Colorado City, presented evidence that brines entering the river are directly related to oil-field operation.
Rawson (1969), in a report concerning the quantity and quality of low flow in the Colorado River between Lake J. B. Thomas and Robert Lee Reservior, concluded that the salinity probably resulted from inflow of

DESCRIPTION OF DRAINAGE AREA 3
brines from oil fields and from inflow of saline water not related to oil field activities.
Green and others (1974) analyzed data from these and additional studies, supplemented by data collected by the Corps of Engineers dur ing the period from September 1973 to March 1974. They concluded that the data indicate the salinity to be from both natural sources and oil-field activity but the preponderance of evidence indicates oil-field ac tivities to have been the major contributor.
DESCRIPTION OF DRAINAGE AREA
TOPOGRAPHY, DRAINAGE, AND DIVERSIONS
The 35.5-mi (mile) reach of the Colorado River included in this study extends from the mouth of Bull Creek below Lake J. B. Thomas in southwestern Scurry County to near Colorado City in central Mitchell County (fig. 1).
C 0
FIGURE 1. -Location of study area.
4 SOURCES OF SALINITY, SALT LOADS, COLORADO RIVER, TEX
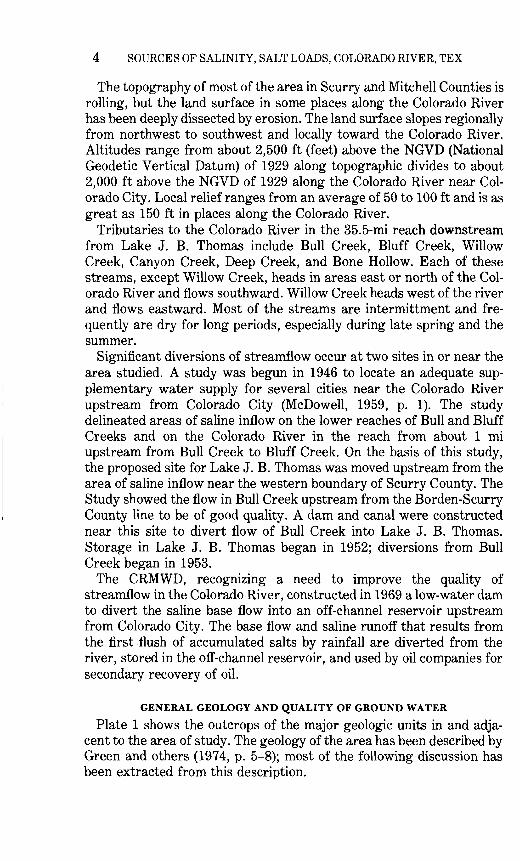
The topography of most of the area in Scurry and Mitchell Counties is rolling, but the land surface in some places along the Colorado River has been deeply dissected by erosion. The land surface slopes regionally from northwest to southwest and locally toward the Colorado River. Altitudes range from about 2,500 ft (feet) above the NGVD (National Geodetic Vertical Datum) of 1929 along topographic divides to about 2,000 ft above the NGVD of 1929 along the Colorado River near Col orado City. Local relief ranges from an average of 50 to 100 ft and is as great as 150 ft in places along the Colorado River.
Tributaries to the Colorado River in the 35.5-mi reach downstream from Lake J. B. Thomas include Bull Creek, Bluff Creek, Willow Creek, Canyon Creek, Deep Creek, and Bone Hollow. Each of these streams, except Willow Creek, heads in areas east or north of the Col orado River and flows southward. Willow Creek heads west of the river and flows eastward. Most of the streams are intermittment and fre quently are dry for long periods, especially during late spring and the summer.
Significant diversions of streamflow occur at two sites in or near the area studied. A study was begun in 1946 to locate an adequate sup plementary water supply for several cities near the Colorado River upstream from Colorado City (McDowell, 1959, p. 1). The study delineated areas of saline inflow on the lower reaches of Bull and Bluff Creeks and on the Colorado River in the reach from about 1 mi upstream from Bull Creek to Bluff Creek. On the basis of this study, the proposed site for Lake J. B. Thomas was moved upstream from the area of saline inflow near the western boundary of Scurry County. The Study showed the flow in Bull Creek upstream from the Borden-Scurry County line to be of good quality. A dam and canal were constructed near this site to divert flow of Bull Creek into Lake J. B. Thomas. Storage in Lake J. B. Thomas began in 1952; diversions from Bull Creek began in 1953.
The CRMWD, recognizing a need to improve the quality of streamflow in the Colorado River, constructed in 1969 a low-water dam to divert the saline base flow into an off-channel reservoir upstream from Colorado City. The base flow and saline runoff that results from the first -flush of accumulated salts by rainfall are diverted from the river, stored in the off-channel reservoir, and used by oil companies for secondary recovery of oil.
GENERAL GEOLOGY AND QUALITY OF GROUND WATER
Plate 1 shows the outcrops of the major geologic units in and adja cent to the area of study. The geology of the area has been described by Green and others (1974, p. 5-8); most of the following discussion has been extracted from this description.

DESCRIPTION OF DRAINAGE AREA 5
Thick sequences of sand, shale, limestone, and evaporites were deposited in the area during the Permian Period and were followed by the deposition of nonmarine sand, shale, and gravel during the Triassic Period. After a period of erosion, Cretaceous seas advanced from the south and deposited another sequence of sand, shale, and limestone. The sediments of Permian and Triassic age dip gently to the northwest; rocks of Cretaceous age dip gently to the southeast.
The principal rocks that crop out in the study area include the Ogallala Formation of Tertiary age and the Dockum Group of Triassic age. The Ogallala Formation, which consists of caliche, sand, and gravel interbedded with clay, crops out in the northeastern part of the study area. Most tributaries to the Colorado River in the area head in the Ogallala Formation.
The Dockum Group consists of both the Santa Rosa Formation and the equivalent of the Chinle Formation, but most of the Triassic sedi mentary rocks in the study area are considered to belong to the Santa Rosa Formation. The Santa Rosa Formation generally consists of a hard, coarse-gravel conglomerate at the base, succeeded upward by al ternating beds of reds and gray micaceous shale, clay, sand, or gravel. The entire reach of the Colorado River in the area studied and the lower reaches of most tributaries are underlain by the Santa Rosa For mation.
The quality of ground water in parts of the upper Colorado River area has been described by Shamburger (1967), Mount and others (1967), and Green and others (1974). Additional studies have been con ducted by the Corps of Engineers.
A comprehensive discussion of the quality of ground water in the area is beyond the scope of this report. However, the following discus sion presents several generalizations that were extracted from previous studies.
The Ogallala Formation is of minor importance as an aquifer in the study area. Information concerning the quality of ground water is meager, but considerable data are available for wells west of and adja cent to the study area.
According to Mount and others (1967, p. 36, 42):The chemical quality of the water in the Ogallala aquifer varies widely within relatively
short distances. Dissolved solids range from several hundred to several thousand parts per million.
Variation in chemical quality of the water in the Ogallala are both natural and man made * * *.
Waters highly mineralized because of natural causes are associated with areas of shallow water-table conditions, notably areas near water-table lakes and near draws. Where the water table is at or very near the land surface, evapotranspiration processes produce highly mineralized ground waters by the concentration of residual salts. Areas of highly mineralized ground water result artificially from surface disposal of oil-field brines and other industrial wastes and possibly from leakage of brine from oil wells. Man-made contamination is a matter of special concern, particularly because of its far reaching

6 SOURCES OF SALINITY, SALT LOADS, COLORADO RIVER, TEX
effects. A contaminant once introduced in the aquifer, spreads from the contaminated area, moving in about the same direction and at the rate as the main body of ground water in the aquifer. Hence, water may be rendered unfit for most beneficial uses over a considerably large area, and because of the slow rate of movement, the effects of con tamination may persist for many decades.
The quality of water in the Santa Rosa Formation is highly variable also. Shamburger (1967, p. 63) has shown that ground water from most wells near the eastern limit of the study area in Mitchell County con tains less than 1,000 mg/L (milligrams per liter) dissolved solids. The water becomes progressively more mineralized westward toward the Colorado River. Water from most wells near the western limit of the study area in Mitchell County contains more than 3,000 mg/L dissolved solids.
The Santa Rosa Formation is underlain by sedimentary rocks of Per mian age. Water associated with petroleum in the Permian rocks is highly mineralized. Several investigators have shown that oil-field brines produced from the Permian rocks have resulted in local degrada tion of the quality of water in the Santa Rosa Formation and in surface runoff (Grouch, 1964, p. 7-9).
According to Green and others (1974, p. 24):It is unknown to what extent if any these brines have charged overlying strata through
natural artesian pressure or exposure through man-made borings. It is well documented, however, that these brines have contributed to pollution of Triassic waters in the study area through improper surface disposal methods. Due to relatively high chloride concen trations encountered in the Santa Rosa Formation on the west side of the river (ranging from approximately 220 ppm north of the town of Westbrook to 30,000 ppm near Lake J. B. Thomas) it might be suggested that there is a hydraulic connection, at least locally, be tween the Permian System and the unconformably overlying Triassic.
LOCATIONS OF OIL FIELDS
Several of the preceding paragraphs have indicated that brines from oil fields have contributed to the degradation of the quality of surface and ground waters in the upper Colorado River basin. Locations of oil and gas fields in the area are shown on plate 2.
Green and others (1974, p. 27-28) have summarized the history of oil exporation and production in the study area. The first well in Scurry County was completed in 1920. Exploration and development peaked in the late 1950's and declined thereafter.
Green and others (1974, p. 29) have also summarized the production and disposal of oil-field brines in Mitchell and Scurry Counties. Their summary is presented in table 1.
The data in table 1 indicate that annual brine production in Scurry and Mitchell Counties increased from about 29,000 bbl (barrels) in 1956 to more than 13,000,000 bbl in 1961 and to more than 18,000,000 bbl in 1967. More than 4,600,000 bbl of brine produced in 1961 were disposed of in open-surface pits; only about 400,000 bbl of brine produced in 1967 were disposed of in open-pits.
A State law passed in 1969 prohibited open-pit disposal of oil-field brine.

DESCRIPTION OF DRAINAGE AREA
^^
^
f"S
1
11aE<s
03 S <r*
H2o8-
s»
so
1.§*
\
wmH
|-g
t,^ 5*0
osc
-Sc'36
3
S£
"rt
0o.
"SSo.
~Sen
Open-pit d:
V c
j3.2
-1
11H a.
"c
1
M
1
a
^c a>
a)C,
M
1a
cSL.
C,
1 a
Percent
J2
a
i?1.0.
S
I
1
i ( i-H i 1
V
o as (MU3 OO <£>
(Ni (
(M i 1 t>T-l 00
V
O O5 OOo t- coM"ss
t> 05 O
OO i-H ^D i-l CM <£>
i-H t> CO ^ O5
0000
O O CM10 co
t> O5 ^co 05 ooO5 ^ i 1
T-H t§ t§
c-^coco"
(M OO O^ oo mO_C<^O5^
(M ^ O5(NL al
rH i 1
5£> i ( t>
O5 O5 O5
^
2
IISjq
O i-H i-H
V V
O O 00co o
"-1
O C <£>
OC
^gj
C1
o c m£ t~co"^ 05
o i i coCO <N
O i 1 CMo m
o co ^ oo
O 00 ^ O <£>-H V
(N t> i-Hi-l 00 O
i 1 i 1 ^D O5 ^00
(N SO SOi-l (N CO^1,^.^1
05 00<N^^i i co
^D i 1 t>
O5 O5 O5

8 SOURCES OF SALINITY, SALT LOADS, COLORADO RIVER, TEX
METHODS OF INVESTIGATION
LOW-FLOW STUDIES
Some of the earlier studies delineated the general areas of saline inflow (see the section, Previous Studies). To supplement these data and to delineate the areas of saline inflow more precisely, a series of low-flow studies was made for the 35.5-mi reach of the Colorado River upstream from Colorado City. Eight low-flow studies (two studies per water year) were made during the period from February 1975 to March 1978 to cover an anticipated range in climatic conditions. Seven of the low-flow studies were completed after periods of at least a week without significant precipatation, when most of the sustained flow was from ground-water accretions. Preciptation occurred during a study in November 1976 and produced small to moderate rises on some streams. The increase in streamflow at some sites during this study caused a significant decrease in salinity. The results of this study are not included in this report.
Duration curves of daily flows at two long-term stations on the upper Colorado River for periods of record after closure of Lake J. B. Thomas are shown on figure 2. The steep slope of the curves indicates that flows of the upper Colorado River between Lake J. B. Thomas and Colorado City are highly variable and are sustained largely by direct runoff. Sus tained base flow generally occurs during the cool-weather months, when evapotranspiration is minimum; consequently, the seven low-flow studies were made during winter and early spring (January, February, and March).
An earlier study by the Corps of Engineers (Green and others, 1974) indicated the salinity of the Colorado River to be highest in the reach upstream from the Geological Survey's discontinued streamflow sta tion 08119500 Colorado River near Ira (mile 826.3). The study also in dicated that the salinity of Bull and Bluff Creeks increased significantly near the mouths of both steams. To substantiate these conclusions and to locate localized sources of salinity in these areas, field recon naissances of the 1.9-mi reach of Bull Creek upstream from the mouth, the 1.8-mi reach of Bluff Creek upstream from the mouth, the 3.0-mi reach of the Colorado River between Bull and Bluff Creeks were made at the beginning of the low-flow study in February 1975.
No localized source of salinity was found in these reaches during the reconnaissances, but the salinity of each of the three reaches increased significantly as the water flowed downstream. Data on the quality or quantity or both of streamflow were collected at 2 sites on both Bull and Bluff Creeks and at 16 additional sites on the Colorado River and other tributaries during subsequent low-flow studies (pi. 1). Water was impounded or diverted or both at one site (site 19, pi. 1) by the CRMWD. The quantity of water diverted at this site was added to flows at sites downstream to enable the comparison of the quantity and quan tity of flows at these sites with those at sites upstream.

METHODS OF INVESTIGATION
Site 15 --08IZ0700 Colorado River mo Cuthbert Averoge discharge, water yea 1966-78
PERCENTAGE OF DAYS INDICATED WATER DISCHARGE WAS EQUALED OR EXCEEDED
FIGURE 2. Duration curves of daily flows for selected sites in the upper Colorado River basin.

10 SOURCES OF SALINITY, SALT LOADS, COLORADO RIVER, TEX
SALT-LOAD TREND STUDIES
Recent observations by the CRMWD have indicated that such water- quality management programs and remedial projects as the ban on the disposal of oil-field brines in open-pits, diversion of saline low flows from the river, and the lowering of ground-water heads by withdrawals of saline ground water have reduced the salinity loads of the Colorado River.
Cursory examination of water-quality data may be misleading unless variations in streamfiow are considered. A method for studying trends in water-quality by using double-mass curves of the quantity and quali ty of streamflow has been described by Searcy and Hardison (1960, p. 42-44). The graph of the cumulative data for one variable (such as yearly mean dissolved-solids loads) plotted against the cumulative data of a related variable (such as yearly mean water discharges), for exam ple, is a straight line so long as the relation between the variables is a fixed ratio. Breaks in the double-mass curve of such variables reflect changes in the relation between the variables. Poor correlation be tween the variables can prevent detection of inconsistencies in a record but an increase in the length of record tends to offset the effect of poor correlation.
The Geological Survey has operated continuous streamflow and daily water-quality stations at three sites on the Colorado River in the areas of saline inflow near Colorado City (pi. 1). Station 08119500 Colorado River near Ira, which was discontinued in September 1970, was reestablished in November 1974 to provide additional information on the quantity and quality of streamflow in the area studied. The concur rent periods of continuous streamflow and daily water-quality record for these stations are shown in table 2.
TABLE 2. -Index of continuous streamflow and daily water-quality stations on the upperColorado River
Station
08119500 Colorado River near Ira
08120700 Colorado River near Cuthbert08121000 Colorado River at Colorado City
Low-flow site
number (pi. 1)
7
1521
Period of concurrent streamflow and daily water-quality record
Nov. 1958 to Sept.1970, Nov. 1974 to 1979.
Mar. 1965 to 1979.May 1946 to Sept.
1954, Nov. 1956 to 1979.

METHODS OF INVESTIGATION 11
Impoundment of water in Lake J. B. Thomas since 1952 has modified the streamflow and water-quality regimes at sites downstream. Most management programs and remedial projects to improve the water quality downstream from Lake J. B. Thomas were initiated in the late 1950's or early 1960's. Consequently, only those records of streamflow and water quality for complete water years after 1957 were utilized in the salt-load trend studies.
The CRMWD constructed a low-dam in 1969 (pi. 1, site 19) to divert the saline base flow of the Colorado River into an off-channel reservoir located 3.0 mi upstream from Colorado City. To supplement the records of diversions a daily sampling station was established at this site during the 1975 water year. These records, supplemented by con tinuous streamflow and daily water-quality data for station 08121000 Colorado River at Colorado City, were used to determine the effects of the diversions on the quantity and quality of streamflow at the station at Colorado City.
ANALYSIS OF DATA
SYNOPSIS OF THE QUANTITY AND QUALITY OF LOW FLOWS
GENERAL
Locations of 21 sites (11 sites on the main stream, 9 sites on tributaries, and the site of the CRMWD diversion) included in the low- flow studies are shown on plate 1. Descriptions of the sites are given in table 3; results of discharge measurements and chemical analyses are given in table 4.
TABLE 3. -Locations and descriptions of low-flow data-collection sites in the upper Colorado River basin, from February 1975 to March 1978
Site1 Stream Location River mile Remarks
1 _____ Colorado River__ __ Lat 32°34'58", long101°05'42"; 50 ft upstream from Bull Creek.
2 ______ Bull Creek ______ Lat 32°36W, long101°05'38"; 300 ft upstream from bridge on FM 2085.
3 ______ _____ do _____ Lat 32°34'54", long101°05'42"; 30 ft upstream from the Colorado River.
4 ______ Colorado River ____ Lat 32°34'17", long101°03'20"; 40 ft upstream from Bluff Creek.
5 ______ Bluff Creek ______ Lat 32°35'29" long101°03'02"; at bridge on FM 1606.
6 ______ _____ do _____ Lat 32° 34'20" long101°03'21"; 150 ft
7 ______ Colorado River ____upstream from mouth.
Lat 32°32'18" long 101°03'12", at stream- gaging station 08119500.
831.8 Streambed of sand. Grassand scattered trees onbanks.
T-1.9 Streambeds of gravel andsand. Grass and scatteredtrees on banks.
831.8 Do.
828.8 Streambed of gravel and sand. Grass brush, and scattered trees on banks.
T-1.8 Streambed of gravel andsand. Grass and scattered
trees on banks.828.8 Streambed of coarse sand
over sandstone. Grass and thin brush on banks.
826.3 Wide flats and channel with steep banks. Thick stand of saltcedars along banks.

12 SOURCES OF SALINITY, SALT LOADS, COLORADO RIVER, TEX
TABLE 3. -Locations and descriptions of low-flow data-collection sites in the upper Colorado River basin, from February 1975 to March 1978- Continued
Site1
8
9
10 _________
11
12 _
13
14
15
16
17
18 _________
19
20
21
Stream
Colorado River
Willow Creek
Colorado River_ _____
Canyon Creek
Colorado River
Deep Creek
do
Colorado River
do
do
Bone Hollow _______
CRMWD diversion
Colorado River
do
Location
Lat 32°30'43", long101 0 01'42"; 30 ft upstream from Willow Creek
Lat 32°30'42" long101°01'46"; 300 ft upstream from mouth.
Lat 32°32'25" long 100°56'54"; 15 ft upstream from Canyon Creek.
Lat 32°32'26" long100°56'53"; 15 ft upstream from mouth.
Lat 32°30/51" long100°54'46"; 300 ft upstream from Deep Creek.
Lat 32°32'25" long100°54'27"; at stream- gaging station 08120500.
Lat 32°30/51", long100°54'40"; 70 ft upstream from mouth.
Lat 32°28'41", long100°56'54"; at stream- gaging station 08120700.
Lat 32°26'35", long100°56'45"; 1,000 ft downstream from Cedar Bend bridge.
Lat 32°25'51", long100°55'00"; 30 ft upstream from low-water crossing 1 mi northwest of CRMWD diversion station.
Lat 32°25'33", long 100°53'43"; at right of private dam and 300 ft upstream from mouth.
Lat 32°25'08", long100°54'21"; at CRMWD pump station.
Lat 32°24'51", long100°54'28"; 1,500 ft downstream from CRMWD diversion dam.
Lat 32°23'33", long100°52'42"; at stream- gaging station 0812100.
River mile
824.0
824.0
817.8
817.8
814.3
T-8.6
814.3
810.6
804.4
802.1
800.1
799.3
798.9
796.3
Remarks
Streambed of sand and silt.Steep banks with thick stand of saltcedars along left bank.
Streambed of sand. Steepgrassy banks with thick stand of brush.
Streambed of sand. Steep grassy banks with thick stand of saltcedars.
Streambed of gravel andsand. Steep banks with thick
stand of brush and trees. Wide sand channel. Thick
stand of saltcedars along banks.
Streambed of gravel. Steepgrassy banks lined with scattered large trees.
Wide streambed of sand.Steep grassy banks with thick stand of saltcedars.
Wide streambed of gravel andsand. Steep banks with thick stand of saltcedars.
Streambed of gravel. Steepbank with thick stand of saltcedars.
Streambed of gravel. Steepbanks with scattered saltcedars.
Streambed of sandstone and shale. Scattered trees and brush.
Wide streambed of gravelover sandstone. Thick stand of saltcedars along fairly steep banks.
Streambed of gravel withthick stand of saltcedars.
1 Number of site shown on plate 1.
The discharge-weighted averages of principal dissolved constituents in flow at each site during the 7 days of the low-flow studies were calculated from the results of discharge measurements, results of chemical analyses, and records of diversion at the CRMWD diversion dam. The discharge-weighted average of constituents in low-flows represents the approximate concentration of constituents in the water at a site if all water passing that site during a period were impounded in a reservoir and mixed and no adjustments were made for evaporation, rainfall, or chemical change that might occur during storage.
The average discharge and discharge-weighted averages of dissolved constituents in low flow at sites downstream from the CRMWD diver sion dam were adjusted to show the estimated flows and concentrations that would have resulted had no diversion occurred. Profiles of the average discharges and the discharge-weighted averages and loads for selected constituents in the low flows throughout the reach studied are shown on figures 3 and 4. These figures shows generalized areas

ANALYSIS OF DATA 13
where significant gains and losses of streamflows and changes in chemical quality occurred, but the quantity and quality of ground-water accretions are masked somewhat by the effects of inflow from tributaries.
16,000
2,000
8000
4000
n
i
CD O c
'/
^^"^
1
1
i £ : jo 1
3
A7
/^
I i
i c ^
= 5 <-
Dissolved solids
dissolved chloride
Dissolved sodium
N55 J
Disc ha 3/2/
NOTE
, 1 ,
1 ' 1
* « « J!! ol
JO fD-
rge- we ghted averages for: 2/14/75,1/20/76 76, 1/28/77, 3/14/77, 1/16/78, 3/20/78
' Estimated average concentrations are sho dashed line if no water was impounded an(or) d
1
1c3: >
«n
dverted at the CRMWD diversion dam
. 1 ,
=^
i
" diversion
1 dam
1 1 i 1 i 1
I
Average water discharge for: 2/14/75, 1/20/76, 3/2/76, 1/28/77,1/16/78, 3/20/78
NOTE Estimated average discharges are shown as dashed line if no water was impounded and (or) diverted at the CRMWD diversion dom
820 816 812 808
RIVER MILES UPSTREAM FROM MOUTH
FIGURE 3.-Dissolved-solids, sodium, and chloride concentrations and water discharge for the Colorado River during selected low-flow periods from February 1975 to March 1978.

14 SOURCES OF SALINITY, SALT LOADS, COLORADO RIVER, TEX
TABLE 4. -Results of chemical analyses and discharge selected low-flow periods from,
Date Time
Instan taneous
dis charge(fWs)
Specific conduct
ance (micro- mhos
pH (units)
Tem pera ture (°C)
Hard ness
(Ca, Mg) (mg/L)
Non- Dis- car- solved
bonate cal- hard- cium ness (Ca)
(mg/L) (mg/L)
Site 1. Colorado River above
Feb. 14, 1975 Jan. 20, 1976 Mar. 2. 1976 Jan. 28, 1977 Mar. 14, 1977 Jan. 16, 1978 Mar. 20, 1978
0950 0930 0820 1210 0925 0940 0915
0.00 .00 .00 .03 .02
'.09 .00
12,300 20,400 26,100
7.87.7
4.5 11.0 7.0
1,600 1,800 2,200
1,400 390 1,500 380 1,900 450
Site 2. Bull Creek
Feb. 14, 1975 Jan. 20,1976 Mar. 2, 1976 Jan. 28, 1977 Mar. 14, 1977 Jan. 16, 1978 Mar. 20, 1978
0915 0800 0800 1045 0830 0830 0815
0.02 .04 .04 .16 .05 .06 .06
5,850 5,220 6,730 8,600 7,360 6,290 6,080
7.7 7.8 7.6 7.7 7.8 7.8 7.6
8.5 3.5
11.5 5.5
11.0 7.0
12.5
1,400 1,200 1,400 1,400 1,500 1,400 1,400
1,100 350 860 280
1,200 330 1,100 350 1,300 350 1,200 300 1,200 310
Site 3. Bull Creek at
Feb. 14, 1975 Jan. 20, 1976 Mar. 2, 1976 Jan. 28, 1977 Mar. 14, 1977 Jan. 16, 1978 Mar. 20, 1978
1000 0935 0825 1140 0920 1015 0845
0.17 .16 .14 .11 .05 .08 .09
15,200 13,600 16,400 12,200 13,500 16,100 16,100
7.9 7.8 7.6 7.8 7.8 7.7 7.7
12.0 6.5
14.0 5.0
11.0 6.5
12.0
1,700 1,600 1,800 1,600 1,700 1,500 1,800
1,500 410 1,300 370 1,500 410 1,300 390 1,600 400 1,300 390 1,600 410
Site 4. Colorado River above
Feb. 14, 1975 Jan. 20, 1976 Mar. 2, 1976 Jan. 28, 1977 Mar. 14, 1977 Jan. 16, 1978 Mar. 20, 1978
1200 1040 0940 0810 1045 1300 1010
0.13 .22 .13 .30 .06 .13 .04
20,700 19,400 27,500 14,500 20,100 25,600 28,100
8.0 7.9 7.6 7.97.8 7.7 7.5
13.0 4.5
Ti15.0 6.5
13.0
1,800 1,800 2,300 1,500 1,900 2,100 2,300
1,700 430 1,600 400 2,100 490 1,300 360 1,700 380 1,900 440 2,200 490
Site 5. Bluff Creek
Feb. 14, 1975 Jan. 20, 1976 Mar. 2, 1976 Jan. 28, 1977 Mar. 14, 1977 Jan. 16, 1978 Mar. 20, 1978
1045 0955 0855 1000 1000 1120 1000
0.15 .15 .15 .28 .20 .35 .15
3,040 2,740 2,960 2,740 3,160 2,670 3,200
8.0 8.0 7.9 8.1 8.0 8.0 7.9
9.5 5.0
12.0 5.0
11.0 7.0
13.5
950 890 930 930 980 920 930
730 250 640 230 730 230 660 250 770 230 700 230 750 230
Site 6. Bluff Creek at
Feb. 14, 1975 Jan. 20, 1976 Mar. 2, 1976 Jan. 28, 1977 Mar. 14, 1977 Jan. 16, 1978 Mar. 20, 1978
1140 1030 0925 0730 1015 1230 1030
0.19 .12 ,14 .23 .11 .35 .15
5,380 3,700 4,410 3,400 4,000 3,870 4,380
7.9 7.8 7.9 7.9 7.9 7.9 7.9
12.0 5.0
~6~!6
15.0 6.5
14.0
1,100 970
1,200 970
1,100 1,000 1,000
860 270 760 240 970 280 730 250 860 240 800 250 870 260
Site 7. Colorado
Feb. 14, 1975 Jan. 20, 1976 Mar. 2, 1976 Jan. 28, 1977 Mar. 14, 1977 Jan. 16, 1978 Mar. 20, 1978
1320 1120 1020 1255 1340 1325 1400
0.44 .38 .36
1.49 .55 .75 .24
21,100 20,000 24,000 15,100 18,800 24,800 24,700
8.0 7.9 7.87.8 7.9 7.7 7.7
16.0 5.0
14.5 7.0
22.0 5.5
24.0
1,700 1,600 1,900 1,500 1,600 2,200 1,900
1,500 410 1,400 390 1,700 440 1,300 360 1,500 250 2,000 470 1,800 450
1 Unable to collect representative sample from this site. Analysis estimated on basis of analysis from site 3 and site below mouth of Bull Creek.

ANALYSIS OF DATA 15
measurements for streams in the upper Colorado River basin during February 1975 to March 1978
Dis- _.solved D/s- solved maerne- . . sodiumS <Na> SI) <m«'L>
Bull Creek (mile 831
Dis solved potas sium (K)
(mg/L)
.8)
Bicar bonate (HCO,) (mg/L)
Car bonate (COS )
(mg/L)
Dis solved
sul- fate (SO.)
(mg/L)
Dis solved chlo ride (Cl)
(mg/L)
Dis solved silica (Si02 ) (mg/L)
Dissolved solids
(sum of consti tuents) (mg/L)
___
150 2,400 200 4,200 260 5,760
8.5 14 16
284 310 308
0 0 0
1,110 2,100 2,360
3,800 6,100 8,960
2.4 .6
1.8
7,990 13,100 18,000
(mile T-1.9)
130 730 110 680 150 900 120 1,400 150 1,100 150 860 140 850
6.4 6.0 7.0 7.2 7.4 9.4 6.8
328 356 276 276 240 260 240
0 0 0 0 0 0 0
560 480 700 560 710 600 690
1,500 1,300 1,700 2,600 2,100 1,800 1,600
0.9 1.8 1.4 1.8
.5 2.1
.9
3,440 3,030 3,920 5,180 4,530 3,850 3,720
mouth (mile 831.8)
170 3,000 160 2,500 180 3,100 140 2,400 180 2,400 130 3,300 180 3,200
11 10 11 8.5
14 12 12
268 336 280 292 220 270 200
0 0 0 0 0 0 0
1,400 1,400 1,700 1,100 1,500 1,600 1,600
4,600 3,700 4,600 3,700 4,000 4,800 4,800
1.0 2.6 3.0 2.4 1.7 5.2 2.0
9,720 8,310
10,100 7,880 8,600
10,400 10,300
Bluff Creek (mile 828.8)
180 4,300 190 3,800 250 5,900 150 2,900 220 4,000 240 5,500 260 6,000
13 12 18 9.4
17 17 22
188 248 160 220 150 210 120
0 0 0 0 0 0 0
1,500 1,700 2,500 1,300 1,900 2,200 2,300
6,800 5,700 8,700 4,600 6,200 8,400 9,300
0.0 .1 .1 .1 .3 .2 .1
13,300 11,900 17,900 9,430
12,800 16,900 18,500
(mile T-1.8)
80 330 76 275 87 340 74 270 98 340 83 240 87 340
5.4 4.3 4.5 4.7 5.0 4.8 4.6
268 298 252 324 250 260 220
0 0 0 0 0 0 0
670 680 760 730 770 710 720
500 380 460 380 530 380 540
2.7 8.4 3.9 8.9 3.5 5.8 1.9
1,970 1,800 2,010 1,880 2,100 1,780 2,030
mouth (mile 828.8)
96 790 91 480
110 520 84 400
110 550 94 500 97 590
7.1 4.4 5.8 5.5 6.4 5.6 5.6
252 260 220 288 230 260 220
0 0 0 0 0 0 0
770 830 970 760 900 830 870
1,200 690 770 600 740 750 830
1.0 5.8
.4 5.3 1.0 5.3
.4
3,260 2,470 2,770 2,250 2,660 2,560 2,760
River (mile 826.3)
160 4,500 160 4,000 200 5,000 150 3,200 180 3,800 240 5,000 200 5,500
14 12 17 10 22 18 23
172 244 212 228 190 230 160
0 0 0 0 0 0 0
1,500 1,400 1,800 1,300 1,500 1,600 1,800
6,700 6,100 7,600 4,700 5,900 8,000 8,200
2.1 3.7 5.1 1.5 2.5 5.5 4.1
13,400 12,200 15,200 9,830
11,800 15,400 16,300

16 SOURCES OF SALINITY, SALT LOADS, COLORADO RIVER, TEX
TABLE 4. -Results of chemical analyses and discharge selected low-flow periods from February
Date Time
Instan taneous
dis charge (ft»/s)
Specific conduct
ance (micro- mhos
pH (units)
Non- Dis- Tem- Hard- car- solved pera- ness Donate cal- ture (Ca, Mg) hard- cium (°C) (mg/L) ness (Ca)
(mg/L) (mg/L)
Site 8. Colorado River above
Feb. 14, 1975 Jan. 20, 1976 Mar. 2, 1976 Jan. 28, 1977 Mar. 14, 1977 Jan. 16, 1978 Mar. 20, 1978
1430 1205 1105 1340 1200 1410 1120
0.62 .72 .53
1.25 .12
1.17 .27
18,800 17,600 21,700 13,500 16,600 21,000 20,100
7.8 7.9 7.6 7.9 7.8 7.8 7.6
16.0 5.0
14.5 7.0
13.0 6.0
14.0
1,800 1,700 1,900 1,500 1,800 1,900 2,000
1,700 420 1,500 400 1,800 450 1,300 840 1,600 420 1,700 450 1,900 470
Site 9. Willow Creek
Feb. 14, 1975 Jan. 20, 1976 Mar. 2, 1976 Jan. 28, 1977 Mar. 14, 1977 Jan. 16, 1978 Mar. 20, 1978
1415 1220 1115 1340 1200 1200 1115
0.07 .03 .02 .00 .00 .00 .00
11,200 6,690 7,880
7.8 8.2 8.0
14.0 4.5
15.0
1,400 640 740
1,000 330 260 150 410 160
Site 10. Colorado River above
Feb. 14, 1975 Jan. 20, 1976 Mar. 2, 1976 Jan. 28, 1977 Mar. 14, 1977 Jan. 16, 1978 Mar. 20, 1978
Feb. 14, 1975 Jan. 20, 1976 Mar. 2, 1976 Jan. 28, 1977 Mar. 14, 1977 Jan. 16, 1978 Mar. 20, 1978
1540 0920 1255 0920 1240 1450 0900
0930 0930 0820 0900 0945 0925 0910
0.75 .65 .40
1.28 .61 .71 .22
0.66 .57 .52 .98 .68 .53 .51
16,500 16,800 21,400 15,000 18,100 23,800 22,200
4,710 3,930 3,880 4,040 3,870 3,050 3,390
8.0 7.8 7.6 7.9 7.9 7.6 7.6
7.9 7.9 8.0 8.0 8.1 8.1 8.1
16.5 1.0
~eT6
13.5 6.0
14.5
9.0 3.5
14.0 5.5
13.5 6.5
14.0
1,700 1,700 2,100 1,600 2,000 2,100 2,200
Site 11
1,300 1,100 1,100 1,200 1,100 1,000 1,000
1,500 400 1,500 400 2,000 480 1,400 380 1,900 450 2,000 510 2,100 520
. Canyon Creek
990 270 770 210 800 200 800 230 800 200 680 190 730 190
Site 12. Colorado River above
Feb. 14, 1975 Jan. 20, 1976 Mar. 2, 1976 Jan. 28, 1977 Mar. 14, 1977 Jan. 16, 1978 Mar. 20, 1978
Feb. 14, 1975 Jan. 20, 1976 Mar. 2, 1976 Jan. 28, 1977 Mar. 14, 1977 Jan. 16, 1978 Mar. 20. 1978
Feb. 14, 1975 Jan. 20, 1976 Mar. 2, 1976 Jan. 28, 1977 Mar. 14, 1977 Jan. 16, 1978 Mar. 20, 1978
1035 1010 0900 1015 1055 1005 1010
1630 1320 1220 1045 1140 1145 1130
1110 1025 0920 1040 1115 1030 1030
1.42 1.21 1.11 2.79 1.63 2.43 1.09
2.22 1.57 1.68 2.19 1.95 2.30
.79
4.48 2.67 2.95 4.84 4.77 4.70 2.63
11,800 11,900 11,700 11,000 11,900 14,300 11,600
1,470 1,380 1,520
1,720 1,570 1,490
3,210 2,350 2,340 3,030 2,920 2,290 2,620
7.9 7.8 7.8 7.9 7.9 7.7 7.9
7.8 7.5 7.4
7.9 7.8 7.8
7.9 7.7 8.3 7.8 8.2 8.2 8.2
12.5 4.0
14.5 5.0
16.5 7.0
18.0
11.5 6.0
14.5 6.0
14.0 5.5
16.0
9.5 4.0
14.5 5.0
13.0 5.5
15.0
1,600 1,600 1,600 1,500 1,700 1,700 1,600
Site
380 330 320
420 370 360
Site 14
890 650 630 860 880 700 830
1,300 340 1,300 340 1,400 340 1,200 340 1,500 360 1,500 390 1,400 340
13. Deep Creek
140 110 90 94 41 89
110 120 21 100 61 100
. Deep Creek at
600 190 390 150 350 140 550 180 580 190 380 160 530 180

ANALYSIS OF DATA 17
measurements for streams in the upper Colorado River basin during 1975 to March 1978 -Continued
Dis- Dis solved , ~ solved magne- so'ved povas-
sium ^"f slum (Mg) JJJ) (K)
(mg/L) <mg/L) (mg/L)
Willow Creek (mile 824.
190 3,800 170 3,500 200 4,500 150 2,800 190 3,300 200 4,500 200 4,400
0)
13 11 16 8.8
15 15 18
Bicar bonate (HC03) (mg/L)
196 240 192 256 230 270 180
Car bonate (CO,)
(mg/L)
0 0 0 0 0 0 0
Dis solved
sul- fate
(SO.) (mg/L)
1,500 1,500 2,100 1,400 1,700 1,700 2,000
Dis solved chlo ride (Cl)
(mg/L)
5,800 5,300 6,600 4,100 5,000 7,100 6,400
Dis solved silica (Si02 ) (mg/L)
0.1 .6 .1
1.2 .5
6.7 .1
Dissolved solids
(sum of consti tuents) (mg/L)
11,800 11,000 14,000 8,930
10,900 14,100 13,600
at mouth (mile 824.0)
130 2,100 64 1,300 83 1,500
Canyon Creek (mile 817
170 3,300 170 3,200 220 4,300 160 3,100 220 3,600 210 4,800 230 4,700
7.5 4.1 4.5
.8)
13 11 16 9.9
18 17 17
416 460 402
184 232 180 260 210 230 160
0 0 0
0 0 0 0 0 0 0
1,500 1,000 1.200
1,200 1,400 2,000 1,500 1,800 1,500 2,000
3,000 1,500 1,700
5,100 4,900 6,600 4,700 5,500 7,900 6,900
0.3 .8 .3
0.5 .9 .6
1.1 .8
2.3 .3
7,270 4,250 4,850
10,300 10,200 13.700 9,980
12,000 15,100 14,400
at mouth (mile 817.8)
160 660 140 540 150 520 150 560 150 550 130 380 130 440
5.1 3.8 3.5 3.9 4.2 3.7 3.7
420 404 382 428 380 400 340
0 0 0 0 0 0 0
1,200 1,200 1,200 1,300 1,200 1,000 1,100
760 530 490 510 450 320 370
2.0 2.1 1.8 4.2 2.2 3.1 1.0
3,260 2,830 2,750 2,960 2,750 2,220 2,400
Deep Creek (mile 814.3)
170 2,100 170 2,200 180 2,100 160 2,200 190 2,100 180 2,700 170 2,100
9.8 8.5 9.0 7.8
12 10 9.0
280 300 288 336 280 320 240
0 0 0 0 0 0 0
1,200 1,300 1,400 1,400 1,500 1,300 1,300
3,100 3,300 3,100 3,200 3,200 4,100 3,200
0.4 .5 .8
2.2 .9
3.4 .7
7,060 7,470 7,270 7,480 7,700 8,840 7,240
(mile T-8.6)
26 170 23 150 23 200
~30 ~~210 28 190 26 190
9.1 10 14fa 11 9.8
292 292 336
380 420 360
0 0 0
0 0 0
210 180 190
~250 190 190
190 170 190
230 190 190
11 9.0
22
18 15 11
871 782 896
1,060 931 894
mouth (mile 814.3)
100 420 67 290 68 280 99 380 98 340 73 260 92 310
10 10 11 8.2
11 9.2 8.4
348 320 336 380 370 390 360
0 0 0 0 0 0 0
760 610 620 910 840 600 790
520 260 250 340 330 250 280
7.3 4.2
14 6.9 6.3 7.8 3.3
2,180 1,550 1,550 2,110 2,000 1,550 1,840

18 SOURCES OF SALINITY, SALT LOADS, COLORADO RIVER, TEX
TABLE 4. -Results of chemical analyses and discharge selected low-flow periods from February
Date Time
Instan taneous
dis charge (fP/s)
Specific conduct
ance (micro- mhos
pH (units)
Tem pera ture (°C)
Hard ness
(Ca, Mg) (mg/L)
Non- Dis- car- solved
bonate cal- hard- cium ness (Ca)
(mg/L) (mg/L)
Site 15. Colorado
Feb. 14, 1975 Jan. 20, 1976 Mar. 2, 1976 Jan. 28, 1977 Mar. 14, 1977 Jan. 16, 1978 Mar. 20, 1978
1230 1120 1010 1000 1030 1050 1035
7.16 3.80 4.42 8.72 5.26 5.73 2.27
5,790 5,860 5,450 6,210 6,010 6,070 5,710
8.0 7.9 8.3 8.1 8.3 8.1 8.2
10.5 3.5
14.5 7.0
13.0 6.0
15.0
1,000 960 980
1,100 1,200 1,100
990
740 230 690 220 700 210 820 250 900 260 750 240 710 200
Site 16. Colorado
Feb. 14, 1975 Jan. 20, 1976 Mar. 2, 1976 Jan. 28, 1977 Mar. 14, 1977 Jan. 16, 1978 Mar. 20, 1978
1330 1210 1040 1135 1215 1120 1125
6.38 4.37 4.95 8.57 5.84 6.19 4.29
6,780 6,480 6,380 6,480 6,860 6,600 6,570
8.3 8.2 8.3 8.2 7.7 8.1 7.6
13.5 5.0
16.5 6.5
15.5 7.0
17.5
1,100 1,100 1,100 1,200 1,300 1,100 1,100
840 250 770 240 860 240 900 260
1,000 260 820 250 870 230
Site 17. Colorado
Feb. 14, 1975 Jan. 20, 1976 Mar. 2, 1976 Jan. 28, 1977 Mar. 14, 1977 Jan. 16, 1978 Mar. 20, 1978
Feb. 14, 1975 Jan. 20, 1976 Mar. 2, 1976 Jan. 28, 1977 Mar. 14, 1977 Jan. 16, 1978 Mar. 20, 1978
1440 1250 1130 1230 1315 1200 1215
1630 1410 1245 1435 1500 1325 1400
6.94 4.44 4.73 7.86 6.47 6.88 4.36
0.004 .04 .03 .04 .04 .17 .09
7,340 6,610 7,540 7,610 7,240 8,790 7,840
2,620 3,100 3,800 3,740 4,200 3,710 3,970
8.4 8.4 8.3 8.17.7 8.1 7.7
8.1 8.1 7.9 7.9 7.7 8.0 8.0
16.0 7.0
17.5 6.5
20.0 7.0
19.0
16.5 8.5
18.5 8.0
23.0 6.0
22.0
1,200 1,100 1,200 1,200 1,400 1,300 1,200
Site
760 1,100 1,400 1,300 1,600 1,300 1,400
890 250 800 250 920 250 950 280
1,100 280 960 290
1,000 260
18. Bone Hollow
610 190 920 230
1,200 260 1,100 270 1,400 330 1,100 250 1,100 260
Site 19. Colorado River Municipal Water District
Feb. 14, 1975 Jan. 20, 1976: Mar. 2, 1976: Jan. 28, 1977: Mar. 14, 1977: Jan. 16, 1978: Mar. 20, 1978:
Water was flowing over low-water dam; no pumping during preceding week. No pumping during preceding week; however, all flow was being impounded by low-water dam. Entire flow of river at this site was being impounded by low-water dam and being pumped into
Do. Do. Do. Do.
Site 20. Colorado
Feb. 14, 1975 Jan. 20, 1976 Mar. 2, 1976 Jan. 28, 1977 Mar. 14, 1977 Jan. 16, 1978 Mar. 20, 1978
1600 1320 1200 1325 1420 1245 1320
8.99 .08 .00 .12 .07 .15 .09
8,830 60,600
15,000 61,100 65,600 79,200
8.4 7.3
7.7 6.7 6.7 7.2
15.5 7.5
11.0 26.0
7.0 27.0
1,200 4,400
1,500 4,200 3,900 5,800
990 270 4,200 1,100
1,400 330 4,100 1,000 3.700 810 5,800 1,500
Site 21. Colorado
Feb. 14, 1975 Jan. 20, 1976 Mar. 2, 1976 Jan. 28, 1977 Mar. 14, 1977 Jan. 16, 1978 Mar. 20, 1978
1550 1445 1320 0855 0930 0935 0920
11.1 .16 .19 .21 .34 .48 .20
8,940 13,500 12,700 8,240
10,100 22,200 24,300
8.4 7.7 7.5 7.8 7.6 7.5 7.4
15.0 9.5
18.5 4.0
13.5 6.5
14.0
1,200 1,700 2,100 1,500 1,700 2,100 2,300
1,100 270 1,400 340 1,900 460 1,200 300 1,500 330 1,900 480 2,100 520

ANALYSIS OF DATA 19
measurements for streams in the upper Colorado River basin during 1975 to March 1978- Continued
Dis- Dis solved , ls" solved magne- so!ved potas
sium s^r""n sium (Mg) mN^ (K)
(mg/L) (mg/L)
Bicar- Car bonate bonate (HC03 ) (C03 ) (mg/L) (mg/L)
Dis solved
sul- fate
(S0«) (mg/L)
Dis solved chlo ride(CD
(mg/L)
Dis solved silica (Si02 ) (mg/L)
Dissolved solids
(sum of consti tuents) (mg/L)
River (mile 810.6)
110 900100 910110 860120 1,000130 950110 950120 960
9.910138.2
15109.4
352336340360350370350
0000000
920810860
1,1001,000
860900
1,2001,3001,2001,4001,3001,4001,300
2.71.33.02.21.34.3
.3
3,5503,5203,4203,9603,8303,7603,660
River (mile 804.4)
120 1,100110 1,110130 1.000130 1,100150 1,000120 1,000120 1,000
1010128.0
121010
344340332346290360240
0000000
970880
1,0001,0001,100
9801,000
1,5001,5001,4001,5001,6001,6001,500
0.3.3.2.6.4
3.4.1
4,1204,0103,9504,1704,3704,2404,080
River (mile 802.1)
130 1,200110 1,100130 1,300130 1,400160 1,200130 1,600130 1,400
109.7
178.7
121111
308 12324292346270360230
800000
850950
1,1001,1001,2001,1001,100
1,8001,5001,9001,9001,7002,4002,000
0.0.3.1.6.4
2.9.1
4,4004,0904,8404,9904,6905,7105,010
at mouth (mile 800.1)
70 270130 330170 410160 400200 500170 430170 490
10101110169.89.1
180228220268270320280
(CRMWD) diversion dam and pump station
0000000
(mile
7601,1001,4001,3001,5001,3001,400
799.3)
290340460460520460480
0.3.2.1.4.4
5.0.1
1,6802,2502,8202,7303,2002,7802,950
CRMWD off-channel reservoir.
River (mile 798.9)
130390
160410450510
River (mile
130200220180210230250
1,60014,000
3,20015,00016,00019,000
796.3)
1,6002,5002,4001,4001,8004,6005,300
9.435
124646
130
8.911138.5
131721
240162
12082
17084
232328226324280300240
120
0000
4000000
1,0003,500
1,4003,6003,7004,200
9601,8002,1001,5001,8002,1002,300
2,30022,000
4,70023,00024,00031,000
2,4003,5003,5002,0002,5007,2007,900
0.42.3
.33.75.61.0
0.21.2
.91.21.12.41.0
5,44041,100
9,86043,10045,10056,400
5,4908,5108,8105,5506,790
14,80016,400

20 SOURCES OF SALINITY, SALT LOADS, COLORADO RIVER, TEX
Average loads for! 2/14/75, 1/20/76, 3/2/76, 1/28/77, 3/14/77, 1/16/78,3/20/78
NOTE: Estimated average loads ore shown as dashed line if no water was impounded and (or) diverted at the CRMWD diversion dam
-Dissolved solids
820 816 812 808
RIVER MILES UPSTREAM FROM MOUTH
FIGURE 4.-Dissolved-solids, sodium, and chloride loads for the Colorado River during selected low-flow periods from February 1975 to March 1978.
ANALYSIS OF DATA 21
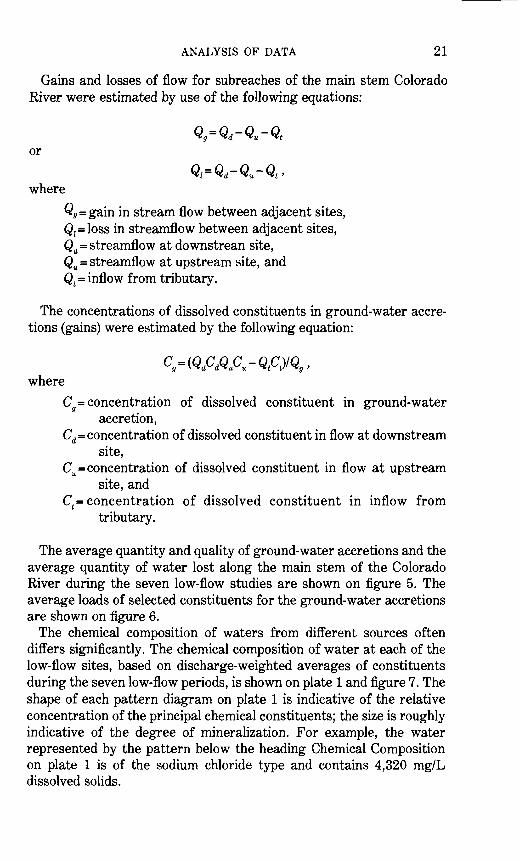
Gains and losses of flow for subreaches of the main stem Colorado River were estimated by use of the following equations:
or
where
Qg =ga.m in stream flow between adjacent sites, Qj=loss in streamflow between adjacent sites, Qd = streamflow at downstrean site, Qu = streamflow at upstream site, and Qt = inflow from tributary.
The concentrations of dissolved constituents in ground-water accre tions (gains) were estimated by the following equation:
whereCg = concentration of dissolved constituent in ground-water
accretion, Cd = concentration of dissolved constituent in flow at downstream
site, Cu = concentration of dissolved constituent in flow at upstream
site, and Ct = concentration of dissolved constituent in inflow from
tributary.
The average quantity and quality of ground-water accretions and the average quantity of water lost along the main stem of the Colorado River during the seven low-flow studies are shown on figure 5. The average loads of selected constituents for the ground-water accretions are shown on figure 6.
The chemical composition of waters from different sources often differs significantly. The chemical composition of water at each of the low-flow sites, based on discharge-weighted averages of constituents during the seven low-flow periods, is shown on plate 1 and figure 7. The shape of each pattern diagram on plate 1 is indicative of the relative concentration of the principal chemical constituents; the size is roughly indicative of the degree of mineralization. For example, the water represented by the pattern below the heading Chemical Composition on plate 1 is of the sodium chloride type and contains 4,320 mg/L dissolved solids.

22 SOURCES OF SALINITY. SALT LOADS. COLORADO RIVER. TEX
820 816 812 808
RIVER MILES UPSTREAM FROM MOUTH
FIGURE 5.-Quantity and quality of ground-water accretions and quantity of water lost along the main stem of the Colorado River during selected low-flow periods from February 1975 to March 1978.

ANALYSIS OF DATA23
8 10
-Dissolved solids
-Dissolved chloride
-Dissolved sodiun
820 816 812 808
RIVER MILES UPSTREAM FROM MOUTH
FIGURE 6.-Dissolved-solids, sodium, and chloride loads for ground-water accretions along the main stem of the Colorado River during selected low-flow periods from February 1975 to March 1978.
Several of the previous sections have indicated that water was im pounded, diverted, or both at mile 799.3 (site 19, pi. 1). To enable the comparison of streamflow and water-quality data for sites downstream from the diversion with similar data for sites upstream, the quantity of water diverted was added to data for flows at sites downstream and the concentrations of dissolved constituents were adjusted according. The data in the following discussion, then, are treated as if no diversion oc curred.
Data represented on figure 3 show that the average flow in the Col orado River during the seven low-flow studies increased from 0.02 ft3/s at mile 831.8 (site 1) to 6.46 ft3/s at mile 796.3 (site 21). Inflow from tributaries averaged 4.87 ft3/s; ground-water accretions averaged 1.57 ft3/s. Although the average flow increased between miles 831.8 and 796.3, losses of flow occurred within some of the subreaches.
24 SOURCES OF SALINITY, SALT LOADS, COLORADO RIVER, TEX
5 60
Percentages are based on discharge-weighted averages of concentrations, in milliequivatents per liter, for: 2/14/75, 1/20/76,3/3/76, 1/28/77,3/14/77, 1/16/78, 3/20/78
60*- Sodiun
20
Percentages are based on discharge-weighted averages of concentrations, in milliequivalents per liter,for :2/l4/75, 1/20/76, 3/2/76, 1/28/77,3/14/77, 1/16/78,3/20/78
Calcium-
820 816 812 808
RIVER MILES UPSTREAM FROM MOUTH
FIGURE 7. - Percentage of major dissolved cations and anions for the Colorado River dur ing selected low-flow periods, from February 1975 to March 1978.
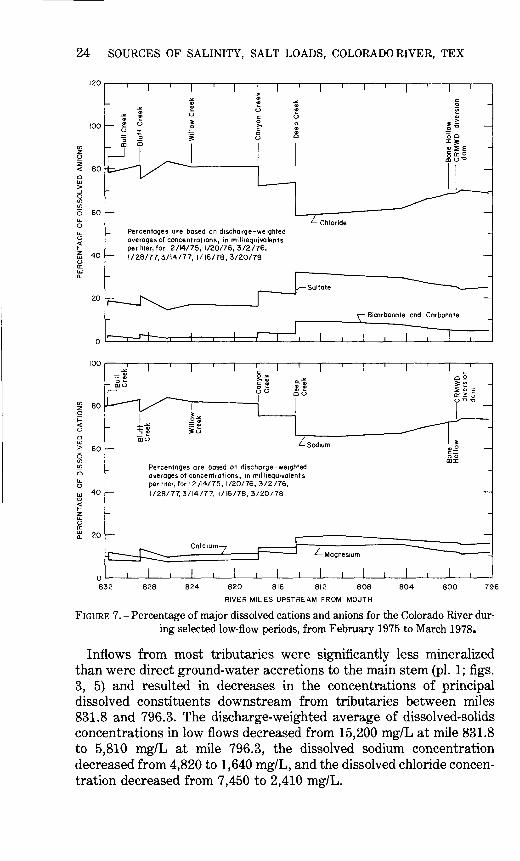
Inflows from most tributaries were significantly less mineralized than were direct ground-water accretions to the main stem (pi. 1; figs. 3, 5) and resulted in decreases in the concentrations of principal dissolved constituents downstream from tributaries between miles 831.8 and 796.3. The discharge-weighted average of dissolved-solids concentrations in low flows decreased from 15,200 mg/L at mile 831.8 to 5,810 mg/L at mile 796.3, the dissolved sodium concentration decreased from 4,820 to 1,640 mg/L, and the dissolved chloride concen tration decreased from 7,450 to 2,410 mg/L.

ANALYSIS OF DATA 25
The concentrations of dissolved solids, chloride, and sodium in inflow from tributaries averaged 2,210, 470, and 430 mg/L, respectively. Con centrations of dissoved solids, chloride, and sodium in direct ground- water accretions to the main stem averaged about 16,900, 8,400, and 5,400 mg/L, respectively. Although the average concentrations of the principal dissolved constituents decreased between miles 831.8 and 796.3, significant increase occurred within some of the subreaches.
Low flow at each of the sites on the main strem Colorado River is of the sodium chloride type (pi. 1; fig. 8). The chemical composition of inflow from tributaries varies. Highly mineralized low flows con tributed by Bull and Willow Creeks (sites 3 and 9, pi. 1), which drain almost entirely from formations of the Dockum Group, are of the sodium chloride type and are similar in chemical character to low flows in the main stem Colorado River. Low flows from other tributaries, most of which head in areas underlain by the Ogallala Formation, are significantly less mineralized and are of mixed chemical types. Inflow of water from these tributaries generally results in a decrease in the salinity and the percentage of sodium and chloride in low flows at sites downstream on the main stem.
Salt loads of streamflow are dependent on both the quantity and quality of the streamflow. Although concentrations of the principal dissolved constituents in low-flows of the Colorado River generally decrease at sites immediately downstream from tributaries (fig. 3), salt loads generally increase (fig. 4). The average load of dissolved solids in low flows of the main stem increased from about 0.8 ton/d (ton per day) at mile 831.8 to more than 101 tons/d mile 796.3. The average loads of dissolved sodium and chloride in the reach increased from less than 0.3 ton/d to more than 28 tons/d and from about 0.4 ton/d to more than 42 tons/d, respectively. The average load of dissolved solids contributed by low flows from tributaries was about 29 tons/d, of which about 6 tons were sodium and 6 tons were chloride. The average load of dissolved solids contributed by ground-water accretions was more than 71 tons/d, of which about 23 tons were sodium and 35 tons were chloride. These data indicate that less than 25 percent of the gain in streamflow in the upper Colorado River was contributed by ground-water accre tions, whereas about 71 percent of the gain in the load of dissolved solids, about 80 percent of the gain in the load of dissolved sodium, and about 85 percent of the gain in the load of dissolved chloride were con tributed by ground-water accretions. Both the quantity and loads of ground-water accretions varied significantly within several subreaches.
The Geological Survey has operated continuous streamflow and daily water-quality stations at three sites on the Colorado River in the area of saline inflow. In the following discussion, the area studied has been

26 SOURCES OF SALINITY, SALT LOADS, COLORADO RIVER, TEX
divided into three reaches on the basis of the locations of these stations. Each of these reaches has been subdivided to delineate the source areas of saline inflow.
REACH FROM MILE 831.8 TO MILE 826.3
Low flows at mile 831.8 (site 1) on the Colorado River, which ranged from 0.00 ft3/s during four of the studies to 0.09 ft3/s on January 16, 1978, averages 0.02 ft3/s. Low flows at mile 826.3 (site 7, station 08119500 Colorado River near Ira), which ranged from 0.24 ft3/s on March 20, 1978, to 1.49 ft3/s on January 28, 1977, averaged 0.60 ft3/s. Inflows from Bull and Bluff Creeks which join the Colorado River in this 5.5-mi reach averaged 0.30 ft3/s. Direct ground-water accretions to the Colorado River averaged 0.28 ft3/s (more than 48 percent of the total gain in flow).
The concentrations of dissolved solids, sodium, and chloride in low flows at mile 831.8 averaged 15,200, 4,820, and 7,450 mg/L, respec tively (fig. 3). The concentrations of dissolved solids, sodium, and chloride in inflow from Bull and Bluff Creeks averaged 5,200, 760, and 2,130 mg/L, respectively. Calculations based on these data indicate that the concentrations of dissolved solids, sodium, and chloride in ground-water accretions between miles 831.8 and 826.3 averaged 20,000, 7,550, and 10,500 mg/L, respectively. The average concentra tions in ground-water accretions were greatest in the subreach be tween the mouths of Bull Creek (mile 831.8) and Bluff Creek (mile 828.8). The concentrations of dissolved solids, sodium, and chloride in ground-water accretions averaged 52,000, 16,800, and 28,500 mg/L, respectively in the 3.0-mi subreach between miles 831.8 and 828.8; and 18,800, 6,430, and 9,800 mg/L respectively in the 2.5-mi subreach be tween miles 828.8 and 826.3.
The average load of dissolved solids during the low-flow studies in creased from about 0.8 ton/d at mile 831.8 to about 20.3 tons/d at mile 826.3 (fig. 4). The average loads of dissolved sodium and chloride in the reach increased from about 0.3 and 0.4 ton/d to about 6.6 and 10.1 tons/d, respectively. Loads of dissolved solids contributed by inflow from Bull and Bluff Creeks averaged about 4.2 tons/d, of which about 0.6 ton was sodium and 1.7 tons were chloride.
The quantity of ground-water accretions and thus the loads of dissolved constituents were highest in the 2.5-mi subreach downstream from the mouth of Bluff Creek (fig. 6). The load of dissolved solids in this subreach averaged about 13.9 tons/d, of which about 4.7 tons were sodium and 7.2 tons were chloride.
A previous study by the Corps of Engineers (Green and others, 1974) indicated the salinity of Bull and Bluff Creeks to increase significantly near the mouths of both streams. Localized sources of salinity were

ANALYSIS OF DATA 27
found on neither of these streams nor on the main stem Colorado River between the mouths of Bull and Bluff Creeks during the recon naissance in February 1975, but results of low-flow studies at two sites on each of these tributaries show the salinity of low flows to increase significantly toward the mouths. The channel of each stream is more deeply incised toward the Colorado River than in the headwaters. Ground water contributed by areas toward the mouths of both Bull and Bluff Creeks near the Colorado River apparently are more mineralized than ground water contributed by areas upstream.
According to Mount and others (1967, p. 36-37), in a discussion con cerning the chemical quality of water in tb Ogallala Formation, "Waters highly mineralized because of natural causes are associated with areas of shallow water table conditions notably near water-table lakes and near draws. Where the water table is at or near the land sur face, evaporation process produce highly mineralized ground waters by the concentration of residual salts."
Ground water in areas near the mouths of Bull and Bluff Creeks is probably significantly nearer the land surface than is ground water in areas upstream, and part of the increase in mineralization of ground- water accretions probably results from concentration by evaporation.
REACH FROM MILE 826.3 TO MILE 810.6
Low flows at mile 810.6 (site 15, station 08120700 Colorado River near Cuthbert), which ranged from 2.27 ft3/s on March 20,1978, to 8.72 ft3/s on January 28, 1977, averaged 5.34 ft3/s (pi. 1; fig. 3).
The gain in low flows of the 15.7-mi. reach of the Colorado River be tween mile 826.3 (site 7) and mile 810.6 (site 15) averaged 4.74 ft3/s. In flows from Willow, Canyon, and Deep Creeks, which join the Colorado River in this reach, averaged 4.52 ft3/s. Direct ground-water accretions to the main stem averaged only about 0.22 ft3/s (less than 5 percent of the total gain in flow).
The concentration of dissolved solids, sodium, and chloride in low flows at mile 810.6 averaged 3,710, 940 and 1,310 mg/L, respectively. The concentration of dissolved solids, sodium, and chloride in inflow from tributaries averaged 2,010, 360, and 360 mg/L, respectively. In flow from Deep Creek (site 14) averaged 3.86 ft3/s (more than 80 per cent of the total gain in flow between mile 826.3 and mile 810.6). The concentration of dissolved solids, sodium, and chloride in inflow from Deep Creek averaged 1,860, 330, and 330 mg/L, respectively.
Calculations based on these data indicate that the concentrations of dissolved solids, sodium, and chloride in ground-water accretion be tween miles 826.3 and 810.6 averaged 14,000, 4,160, and 7,330 mg/L, respectively. Losses of flow occurred within two subreaches of the

28 SOURCES OF SALINITY, SALT LOADS, COLORADO RIVER, TEX
main stem during most of the low-flow studies (figs. 3, 5). Losses of flow averaged less than 0.03 ft3/s in the 6.2-mi subreach of the main stem between the mouths of Willow and Canyon Creeks (miles 824.0 and 817.8) and about 0.20 ft3/s in the 3.7-mi subreach downstream from the mouth of Deep Creek (miles 814.3 and 810.6). Gains resulting from ground-water inflow and the concentrations of dissolved constituents were greatest in the 3.5-mi subreach between the mouths of Canyon and Deep Creeks (miles 817.8 and 814.3). The quantity of ground-water accretions in this subreach average about 0.37 ft3/s; the concentrations of dissolved solids, sodium, and chloride in the ground-water accretions averaged 9,190, 2,750, and 4,250 mg/L, respectively.
The average load of dissolved solids for this 15.7-mi reach of the main stem Colorado River during the low-flow studies increased from about 20.3 tons/d at mile 826.3 to about 53.5 tons/d at mile 826.3 to about 53.5 tons/d at mile 810.6. The average loads of dissolved sodium and chloride in the reach increased from about 6.6 and 10.1 tons/d to about 13.6 and 18.9 tons/d, respectively (fig. 4). Loads of dissolved solids con tributed by inflow from tributaries averaged about 24.5 tons/d, of which about 4.4 tons were sodium and 4.4 tons were chloride. Losses of flow, and thus part of the loads of dissolved constituents, occurred in the 6.2-mi subreach between the mouth of Willow and Canyon Creeks and the 3.7-mi. subreach downstream from the mouth of Deep Creek.
The quantity of ground-water accretions and thus the loads of dissolved constituents were greatest in the 3.5-mi subreach between the mouths of Canyon and Deep Creeks (miles 817.8 and 814.3). The load of dissolved solids contributed by ground water in this subreach averaged about 9.3 tons/d, of which about 2.8 tons were sodium and 4.3 tons were chloride.
REACH FROM MILE 810.6 TO MILE 796.3
Low flows at mile 796.3 (site 21, station 08121000 Colorado River at Colorado City) plus low flows impounded or diverted or both at mile 799.3 (site 19) averaged 6.46 ft3/s (pi. 1; fig.3). The gain in low flows of the 14.3-mi reach of the Colorado River between mile 810.6 (site 15) and mile 796.3 (site 21) averaged 1.12 ft3/s. Inflow from Bone Hollow, the only tributary in the reach, average 0.06 ft3/s. Direct ground-water accretions to the main stem averaged 1.06 ft3/s (about 95 percent of the total gain in flow).
The concentrations of dissolved solids, sodium, and chloride in low flows at mile 810.6 plus low flows impounded or diverted or both at mile 799.3 averaged 5,810,1,640, and 2,410 mg/L, respectively. The concen trations of dissolved solids, sodium, and chloride in inflow from Bone Hollow averaged 2,790, 430, and 460 mg/L, respectively.
Calculations based on these data indicate that the concentrations of dissolved solids, sodium, and chloride in ground-water accretions be tween miles 810.6 and 796.3 averaged 16,500, 5,230, and 8,030 mg/L, respectively. Average concentrations of dissolved constituents were

ANALYSIS OF DATA 29
greatest in the ground-water accretions in the subreaches between miles 804.4 and 802.1 and between miles 802.1 and 799.3. The concen trations of dissolved solids, sodium, and chloride in ground-water ac cretions in these subreaches averaged 31,000, 9,940, and 16,100 mg/L, respectively.
The average load of dissolved solids during the low-flow studies in creased from about 53.5 tons/d at mile 810.6 to 101.3 tons/d at mile 796.3. The average loads of dissolved sodium and chloride in the reach increased from about 13.6 and 18.9 tons/d to about 28.6 and 42.0 tons/d, respectively (fig. 4). Loads of dissolved solids in ground-water accretions averaged about 47.3 tons/d, of which about 15.0 tons were sodium and 23.0 tons were chloride. The loads of dissolved constituents in ground-water accretions were largest in the subreach between miles 802.1 and 799.3. The load of dissolved solids averaged about 16.3 tons/d, of which about 5.2 tons were sodium and 8.5 tons were chloride.
All flow of the Colorado River was impounded or diverted or both at mile 799.3 (site 19) during each of the low-flow studies, except for the study on February 14, 1975. The combined flows from small seeps along the river bed and channel about 1,500 ft. downstream from the diversion dam (mile 798.9) ranged from 0.07 ft3/s on March 14,1977, to 0.15 ft3/s on January 16, 1978. The concentration of dissolved solids in the combined flow ranged from 9,860 to 56,400 mg/L. The concentra tion of dissolved sodium ranged from 3,200 to 19,000 mg/L, and the concentration of dissolved chloride ranged from 4,700 to 31,000 mg/L.
DELINEATION OF SOURCE AREAS OF SALINE INFLOW
The small seeps downstream from the diversion dam at mile 798.9 were the only localized sources of saline inflow found during the low- flow studies. Some of the previous sections have shown that ground water contributed throughout most of the area studied is saline. The average concentrations of dissolved solids in ground water contributed directly to the main stem Colorado River during the low-flow studies ranged from 5,620 mg/L in the 2.3-mi subreach between miles 826.3 and 824.0 to 52,000 mg/L in the 3.0-mi subreach between miles 831.8 and 828.8. The average concentrations of dissolved sodium and chloride in ground water contributed to these subreaches ranged from 840 to 16,800 mg/L and from 1,010 to 28,500 mg/L, respectively.
The previous sections have shown generally that the quantities of ground-water inflow and thus the loads of dissolved constituents, vary significantly within the reach studied. The areas of saline inflow and salt yields from subreaches are delineated more precisely on figure 8. Data represented on figure 8 show that the average yields of dissolved solids in ground-water inflow per mile of channel along the main stem Colorado River ranged from less than 0.5 ton/d to more than 5.8 tons/d. The average yields of dissolved sodium and chloride per mile of channel ranged from less than 0.1 ton/d to more than 1.9 tons/d and 2.9 tons/d, respectively.
Yields per mile of channel along three subreaches (between miles 828.8 and 826.3, between miles 804.4 and 802.1, and between 801.2 and

30 SOURCES OF SALINITY, SALT LOADS, COLORADO RIVER, TEX
ULJ U_
9 og.5 S 2
i£
Dissolved solids
820 816 812 808
RIVER MILES UPSTREAM FROM MOUTH
800 796
FIGURE 8.-Dissolved-solids, sodium, and chloride yields for ground-water accretions along the main stem of the Colorado River during selected low-flow periods from February 1975 to March 1978.
(799.3) averaged more than 5.5 tons of dissolved solids per day, of which more than 1.8 tons were sodium and more than 2.9 tons were chloride.
A comparison of the locations of these subreaches with the locations of oil fields in the area studied (pls.l, 2) shows that only the subreach between miles 828.8 and 826.3 is proximate to oil fields. Salt yields from some of the intervening subreaches (between miles 826.3 and 804.4) that traverse oil fields are significantly less than those downstream from mile 804.4. These data indicate that a large part of salinity probably results from the inflow of saline water of natural origin.
SYNOPSIS OF SALT-LOAD TREND STUDIES
Recent observations by the CRMWD have indicated that the ban on the disposal of oil-field brines in open pits and withdrawal of saline ground water have reduced the salinity loads of the Colorado River.
Double-mass curves of cumulative yearly mean dissolved-solids loads and yearly mean water discharges for each of three continuous streamflow and daily water-quality stations (figs. 9, 10, 11) were prepared to show trends in water quality and to determine if the water- quality management projects are reducing the salinity loads of the

ANALYSIS OF DATA 31
1000
800
600
400
200
2400 40 80 120 160 200
CUMULATIVE DISCHARGE, IN CUBIC FEET PER SECOND
FIGURE 9.-Double-mass curve of cumulative discharge and cumulative dissolved-solids loads, Colorado River near Ira, Tex .
Colorado River. Saline low flows upstream from the station at Col orado City have been impounded, diverted, or both since January 1969. The quantity of water diverted at mile 799.3 was added to the flow for the station at Colorado City, and the loads of dissolved solids for the station were adjusted so that the double-mass curve for the 1958-78 water years could be prepared.
Daily water-quality sampling for the station near Ira was discon tinued during the 1971 water year but was reestablished during the 1974 water year. Loads for the 1971-73 water years were estimated from records collected before October 1970 and after November 1974.
Changes in the slope of the double-mass curve (fig. 9) for the station 08119500 Colorado River near Ira (site 7, pi. 1) indicate that significant changes in the relation between the load of dissolved solids and water discharge occurred during two periods. A significant increase in the slope of the curve occurred during the water years from 1963 to 1970; a significant decrease in the slope occurred after 1970. Comparisons of increments of cumulative streamflow for selected periods before 1963 with equal increments of streamflow during the water years from 1963 to 1970 and of the corresponding cumulative dissolved-solids loads

32 SOURCES OF SALINITY, SALT LOADS, COLORADO RIVER, TEX
40 80 120 160 200 240 280 320 360 400
CUMULATIVE DISCHARGE, IN CUBIC FEET PER SECOND
FIGURE 10.-Double-mass curve of cumulative discharge and cumulative dissolved-solids loads, Colorado River near Cuthbert, Tex.
for these periods show that the load and thus the concentration of dis solved solids for a given increment of streamflow increased signifi cantly after 1963. Comparison of these data for the period from 1963 to 1970 with data after 1970 shows that the load and thus the concentra tion of dissolved solids for a given increment of streamflow decreased significantly after 1970. The loads and concentrations of dissolved solids for equal increments of streamflow before 1963 and after 1970 were approximately equal. These data indicate that the salinity of in flow upstream from the station increased significantly after the 1963 but decreased significantly after 1970.
The production and disposal of oil-field brines in Scurry and Mitchell Counties are summarized in the section, Locations of Oil Fields. These data show that the production of oil-field brine increased greatly during the early 1960's (from about 29,000 bbl in 1956 to more than 13,000,000 bbl in 1961). More than 4,600,000 bbl of brine produced in 1961 were disposed in open-surface pits. The production of brine increased to

ANALYSIS OF DATA 33
2800
2400
V)
O 2000
1600
1200
800
400
100 200 300 400 500 600
CUMULATIVE DISCHARGE, IN CUBIC FEET PER SECOND
roo
FIGURE 11.-Double-mass curve of cumulative discharge and cumulative dissolved-solids loads, Colorado River at Colorado City, Tex.
more than 18,000,000 bbl in 1967, but only about 400,000 bbl were disposed of in open pits. A State law prohibiting open-pit disposal was passed 1969.
The increased production of brine and its subsequent disposal in open pits during the early 1960's and the corresponding increase of salinity in flow of the Colorado River near Ira during the period from 1963 to 1970 and the subsequent decrease of salinity after the ban on open-pit disposal are evidence that part of the salinity resulted from oil-field brines. However, the preponderant evidence collected during the low- flow studies and the water-quality trends for other daily sampling sta tions indicate that the major part of the salinity is of natural origin.
No significant breaks are apparent in the double-mass curves of cumulative yearly mean dissolved-solids loads and yearly mean water discharge (figs. 10, 11) for the stations 08120700 Colorado River near Cuthbert (site 15, pi. 1) and 08121000 Colorado River near Colorado

34 SOURCES OF SALINITY, SALT LOADS, COLORADO RIVER, TEX
City (site 21 pi. 1). The correlation between loads and streamflow of each station for one or more years is inconsistent, but the general slope of the curve for each station is constant throughout the period of record. These data indicated that neither the ban on open-pit disposal of oil-field brines nor the pumpage of saline ground water has resulted in significant reduction of the salinity of streamflow at these stations and are additional evidence that the major part of the salinity is of natural origin.
REDUCTION OF SALINITY BY DIVERSIONS OF SALINE LOW FLOWS
Diversions of saline low flow from the Colorado River upstream from Colorado City at mile 799.3 (site 19, pl.l) was begun in January 1969 by the CRMWD. Records indicate that diversions of saline low flows at this site averaged about 5.7 ft3/s during the 1969-78 water years. Water-quality records for this site and for the daily sampling station 08121000 Colorado River at Colorado City indicate that the load of dissolved solids removed by the diversion averaged about 51 tons/d, of which about 30 tons were chloride. Diversion of the saline low flows resulted in a significant improvement in the quality of water at downstream sites. Decreases in the discharge-weighted averages of dissolved solids and chloride in flow of the Colorado River at Colorado City due to the diversions during the 1969-78 water years were about 420 and 280 mg/L, respectively.
SUMMARY OF CONCLUSIONS
The average flow in a 35.5-mi reach of the upper Colorado River dur ing seven low-flow studies from February 1975 to March 1978 in creased from 0.02 3/s at mile 831.8 (upstream from Bull Creek) to 6.46 ft3/s at mile 796.3 (at Colorado City). Inflow from tributaries average 4.87 ft3/s, of which 3.86 ft3/s were contributed by Deep Creek. Direct ground-water accretions to this reach of the main stem Colorado River averaged 1.57 ft3/s.
Inflows from most tributaries were significantly less mineralized than direct ground-water accretions and resulted in a decrease in the concentrations of the principal dissolved constituents in flow of the Col orado River. The discharge-weighted averages of dissolved solids, sodium, and chloride in tributary inflows were 2,210, 470, and 430 mg/L, respectively; those for direct ground-water accretions were 16,900, 8,400, and 5,400 mg/L, respectively. The discharge-weighted average of dissolved solids in low flows in the main stem Colorado River decreased from 15,200 mg/L at mile 831.8 to 5,810 mg/L at mile 796.3. The average concentrations of dissolved sodium and chloride

REFERENCES CITED 35
(the principal constituents) decreased from 4,820 to 1,640 mg/L and from 7,450 to 2,410 mg/L, respectively.
Small seeps downstream from the CRMWD diversion dam at mile 798.9 were the only localized sources of saline inflow found during the low-flow studies. Ground water contributed throughout most of the area studied is saline, but loads of dissolved constituents are highest in three subreaches. Yields from the subreaches of the Colorado River between miles 828.8 and 826.3, between miles 804.4 and 802.1, and be tween miles 802.1 and 799.3 during the low-flow studies averaged more than 5.5 tons of dissolved solids per day per mile of channel, of which more than 1.8 tons were sodium and more than 2.9 tons were chloride. Results of the low-flow studies, records of the production and disposal of oil-field brines, and salt-load trend studies indicate that part of the salinity resulted from oil-field brines, but preponderant evidence in dicates that the major part of the salinity is of natural origin.
Salt-load trend studies for the continuous streamflow and daily water-quality station Colorado River near Ira (mile 826.3) show that the salinity of the flow increased significantly after 1963. The produc tion of oil-field brines and its disposal in open surface pits also in creased greatly during the early 1960's. A ban on open-pit disposal of oil-field brines was enacted in 1969; the salinity of streamflow at the station near Ira decreased significantly after 1970. No significant downward trend of salinity in flow at daily water-quality stations downstream from Ira occured after the ban on open-pit disposal of oil field brine. Neither the ban on open-pit disposal nor pumpage of saline ground water has resulted in significant reduction of the saline inflow downstream from the continuous streamflow and daily water-quality station 08120700 Colorado River near Cuthbert (mile 810.6).
Diversion of saline low flows from the Colorado River at mile 799.3 since January 1969 has averaged about 5.7 ft3/s. The load of dissolved solids removed by the diversion during the 1969-78 water years aver aged about 51 tons/d, of which about 30 tons were chloride. Decreases in the discharge-weighted average of dissolved solids and chloride in flow of the Colorado River downstream from the diversion at Colorado City (mile 796.3) were about 420 and 280 mg/L, respectively.
REFERENCES CITED
Green, M. G., Marr, A. J., and Logan, H. H., 1974, Lake J. B. Thomas to Ballinger salt- pollution study: U.S. Army Corps of Engineers report, 49 p., 1 fig., 8 pis.
Grouch, R. L., 1964, Investigation of alleged ground-water contamination, Tri-Rue and Ride Oil Fields, Scurry County, Texas: Texas Water Commission Report LD-0464- MR, 16 p., 5 figs., 1 pi.
Leifeste, D. K., and Lansford, M. W., 1968, Reconnaissance of the chemical quality of surface waters of the Colorado River basin, Texas: Texas Water Development Board Report 71, 78 p., 13 figs.

36 SOURCES OF SALINITY, SALT LOADS, COLORADO RIVER, TEX
McDowell, H. E., 1959, A study of the salt problem on the upper Colorado River in Texas: Consultant's report to Texas Electric Service Co., December 1959,17P-
Mount, J. R., Rayner, F. A.. Shamburger, V. M., Jr., Peckham, R. C., and Osborne, F. L.,Jr., 1967, Reconaissance investigation of the ground-water resources of the ColoradoRiver basin, Texas: Texas Water Development Board Report 51,107 p., 11 figs., 17pis.
Rawson, Jack, 1969, Quantity and quality of low flow in the upper Colorado River basin,Texas, April 8, 1968: U.S. Geological Survey open-file report, 24 p., 3 figs.
Rawson, Jack, Maderak, M. L., and Hughes, L. S., 1973, Quality of surface waters in theColorado River basin, Texas, 1966-72 water years: U.S. Geological Survey open-filereport, 72 p., 8 figs.
Reed, E. L., 1961, A study of the salt-water pollution of the Colorado River, Scurry andMitchell Counties, Texas: Consultant's report to Colorado River Municipal WaterDistrict, Big Spring, Tex., January 1961, 36 p., 11 figs.
Searcy, J. D., and Hardison, C. H., 1960, Double-mass curves: U.S. Geological SurveyWater-Supply Paper 1541-B, p. 31-66, 8 figs.
Shamburger, V. M., Jr., 1967, Ground-water resources of Mitchell and western NolanCounties, Texas: Texas Water Development Board Report 50, 175 p., 23 figs.
U.S. Geological Survey, 1937, Geologic map of Texas: U.S. Geological Survey geologicmap.
U.S. GOVERNMENT PRINTING OFFICE: 1982-361-6 14/312

UNITED STATES DEPARTMENT OF THE INTERIOR GEOLOGICAL SURVEY WATER-SUPPLY PAPER 2084
PLATE 1
Hermleigh
rr River mile 817.8 T-0.0
River mile 814.3 T-0.0
MITCHELLr
STERLING
EXPLANATION
Geologic Symbols
c.CD U jOOI
(U
o> o o
O 0> Ua
O
Io
. CD </>
S.S
c »- oIE
Sand, gravel,clay,and caliche
Ogallala Formation
Sand , gravel, clay,and caliche
Fredericksburg Group
Limestone,clay.marl,and shale
Trinity GroupSand and gravel
Dockum GroupConglomerate, clay, shale,sandstone, sand, and gravel
cr LJ
o
a:LJ
COz> oLJ
LJrr o
oCO CO< rr
Pease River GroupShale,sandstone,and gypsum
01 LJ Q_
Geologic contact
CHEMICAL COMPOSITION
Millieqivalents per liter60 40 20 0 20 40 60 i I i i i i I i l-
Sodiumt PotassiumCalcium
Magnesium
Average discharge during low-flow studies, in cubic feet per second
ChlorideBicarbonate -I-Carbonate
Sulfate
v Discharge-weighted average of dissolved solids in low flows, in milligrams per liter
River miles measured upstream from mot tributaryfrom mouth "T" indicates
2 SAMPLING SITE NUMBER refers to sites listed in table I
V LOW-FLOW SITE
T DAILY SAMPLING STATION
A CONTINUOUS STREAMFLOW STATION
V DIVERSION SITE
, * Robert Lee-
-X'C*U"L -] Robert Lee Dam (under construction)
Geology adapted from geologic map of Texas, U.S. Geological Survey. 1937
Base from U.S. Geological Survey, 1954 INTERIOR-GEOLOGICAL SURVEY. RESTON, VA. 1981 W80586
SCALE V250000
10 15 20 25 MILES
10 15 20 25 30 35 KILOMETERS
GEOLOGY OF THE UPPER COLORADO RIVER BASIN AND CHEMICAL COMPOSITION OF LOW FLOWS OF STREAMS

UNITED STATES DEPARTMENT OF THE INTERIOR GEOLOGICAL SURVEY
WATER-SUPPLY PAPER 2084PLATE 2
EXPLANATION
Oil or gos field
.--' '-I JY-X/ >
Hermleigh §
SCURRY COUNTY MITCHELL COUNTY
MITCHELL STERLING
COUNTY COUNTY
! COUNTYCOUNTY
10i
15 MILES
I 10
I 15 20 KILOMETERS Robert Lee
-32'
i from U.S. Geological Survey. 1954
LOCATIONS OF OIL AND GAS FIELDS