Embed Size (px)
Citation preview

JLL Breakfast Talk:
Top ASEAN markets for 2017

Jakarta 2017 OutlookTodd Lauchlan
Country Head, Indonesia

Economy Improving
Cyclical Recovery under the way
Will translate into increased demand
Politics stable / Ease of doing business improving
GDP growth in Indonesia
Source: Oxford Economics; Bank Indonesia; JLL Research
USD/IDR exchange rate
4.0%
4.5%
5.0%
5.5%
6.0%
6.5%
7.0%
7.5%
8.0%
2006
2007
2008
2009
2010
2011
2012
2013
2014
2015
2016
2017F
GD
P G
row
th
6,000
7,000
8,000
9,000
10,000
11,000
12,000
13,000
14,000
15,000
16,000
Dec-06
Dec-07
Dec-08
Dec-09
Dec-10
Dec-11
Dec-12
Dec-13
Dec-14
Dec-15
Dec-16
IDR
per
US
D

Office Supply Increasing
CBD supply, demand and occupancy
Source: JLL Research
70%
75%
80%
85%
90%
95%
100%
0
100,000
200,000
300,000
400,000
500,000
600,000
700,000
800,000
2006 2007 2008 2009 2010 2011 2012 2013 2014 2015 2016 2017 2018 2019 2020 2021
Occupancy
Sqm
Net Absorption New Supply Occupancy
Flight to quality underway
Overall demand forecast to improve

Office Rents to continue falling in 2017
Cyclical Recovery under the way
Will translate into increased demand
Politics stable / Ease of doing business improving
Source: JLL Research
CBD Rents
0
50,000
100,000
150,000
200,000
250,000
300,000
350,000
400,000
450,000
500,000
2006 2007 2008 2009 2010 2011 2012 2013 2014 2015 2016 2017 2018 2019 2020 2021
IDR
per
sqm
per
mon
th
Premium Grade A

Office Projects
Capital Place IFC 2

Office Outlook
Demand to improve
Occupancy to fall
Rents to bottom 2018/2019 then recover
Older buildings to suffer

Residential Demand Forecast to Recover
Condominium Sales per annum
Market hit badly by luxury tax changes
Tax amnesty should bolster demand
Structural demand remains
0
2,000
4,000
6,000
8,000
10,000
12,000
14,000
16,000
18,000
2006 2007 2008 2009 2010 2011 2012 2013 2014 2015 2016
Uni
ts
Source: JLL Research

Residential Prices to remain flat as long as sales are low
Condominium prices by segment
Prices remain stable
Competition intense for limited buyers
Good projects selling well
Source: JLL Research
0
5,000,000
10,000,000
15,000,000
20,000,000
25,000,000
30,000,000
35,000,000
40,000,000
45,000,000
50,000,000
55,000,000
60,000,000
1Q
09
2Q
09
3Q
09
4Q
09
1Q
10
2Q
10
3Q
10
4Q
10
1Q
11
2Q
11
3Q
11
4Q
11
1Q
12
2Q
12
3Q
12
4Q
12
1Q
13
2Q
13
3Q
13
4Q
13
1Q
14
2Q
14
3Q
14
4Q
14
1Q
15
2Q
15
3Q
15
4Q
15
1Q
16
2Q
16
3Q
16
4Q
16
IDR
per
sqm
Lower middle Middle Upper High-end Luxury

Residential Projects
West Vista

Residential Outlook
Demand to improve
New Launches to achieve better absorption
Market has bottomed recovery on the way

Retail Demand likely to continue to be supply driven
Very limited Supply
Rising rents and occupancy
Food and Beverage / Cosmetics strong / luxury weak
Source: JLL Research
Retail supply, demand and occupancy
70%
75%
80%
85%
90%
95%
100%
0
50,000
100,000
150,000
200,000
250,000
300,000
2006 2007 2008 2009 2010 2011 2012 2013 2014 2015 2016 2017 2018 2019 2020 2021
Occ
upan
cy
Sqm
New Supply Net absorption Occupancy rate
Slow, steady rental growth likely to continue
Steady growth in rents since GFC
Forecast to continue
Source: JLL Research
Retail rents
300,000
400,000
500,000
600,000
700,000
800,000
900,000
4Q08
2Q09
4Q09
2Q10
4Q10
2Q11
4Q11
2Q12
4Q12
2Q13
4Q13
2Q14
4Q14
2Q15
4Q15
2Q16
4Q16
End-2016
End-2017
End-2018
End-2019
End-2020
End-2020
IDR
per
sqm
per
mon
th

Retail Outlook
Supply Limited
High Occupancy
Rents to Grow

Logistics Market Evolving Rapidly
- Partnership announced in 2015;
- 500,000 sqm of space to be developed
- Three warehouse reportedly under
construction
In early 2016,
Alibaba
acquired a
controlling stake
in Lazada
Mitsui and other investors:
USD 100 million investment
in MatahariMall
Market entry expected in short-term
Also expanding…
Source: JLL

Jakarta Hotels: Upscale Trading Performance
0%
10%
20%
30%
40%
50%
60%
70%
80%
90%
100%
-
500,000
1,000,000
1,500,000
2,000,000
2,500,000
3,000,000
2006 2007 2008 2009 2010 2011 2012 2013 2014 2015 YTD Oct2015
YTD Oct2016
Occ
up
ancy
(%
)
AD
R /
Rev
PA
R (I
DR
)
ADR (IDR) RevPAR (IDR) Occupancy (%)Source: STR Global
Note: Rates inclusive of Service Charge
Arrival numbers continue to grow, new visa rules providing support
50% overall occupancy forces rates down

Bali Hotels: Upscale Trading Performance
0%
10%
20%
30%
40%
50%
60%
70%
80%
90%
100%
-
20
40
60
80
100
120
140
160
180
200
2006 2007 2008 2009 2010 2011 2012 2013 2014 2015 YTD Oct2015
YTD Oct2016
Occ
up
ancy
(%
)
AD
R /
Rev
PA
R (U
SD
)
ADR (USD) RevPAR (USD) Occupancy (%)
Source: STR Global
Note: Rates inclusive of Service Charge
Arrival numbers growing strongly .. up 23.5% YTD
Rates up but supply keeping rates increases in check

Summary
Huge Potential
Infrastructure / Investment driven growth
Urbanisation / Demographics
Logistic / Retail – Top Picks

Vietnam 2016 review and 2017 outlook:
Positive year aheadStephen Wyatt
Country Head, JLL Vietnam

Vietnam Economic Review
20
Source: GSO, Vietnam National Administration of Tourism.
FDI
▲7.1%y-o-y
▲
CPI Intl. Tourist
Credit Growth Interest Rate
y-o-y
6% - 9%9% - 11%
GDP

Vietnam Economic Review
21
South Korea Japan Singapore China
$1.52bnewly registered capital
Real Estate ranked #3
59 newly registered projectsTop FDI Countries
FDI in 2016 By Economic Activities64%
8%
Manufacturing
Retail and whole sale
7% Real estate
4% Technology
18% Others
Source: FIA Vietnam

Vietnam Economic Review
22
0
1
2
3
4
5
6
7
8
India Vietnam China Philippines Indonesia Malaysia Thailand NewZealand
SouthKorea
Singapore Hong Kong Australia Taiwan Japan
y-o-y (%)Real GDP Growth
-1
0
1
2
3
4
5
6
India Vietnam Indonesia Philippines Malaysia Hong Kong China Thailand Australia SouthKorea
NewZealand
Taiwan Singapore Japan
y-o-y (%)CPI Inflation
2016E 2017F
Source: Oxford Economics

Ho Chi Minh City Office Market Overview
‘000 sqm
1,748,843
Total Supply in 2012-2016 (NFA, Sqm)
Source: JLL Research
1,422,768 1,518,357 1,590,035
1,700,616
0
500
1,000
1,500
2,000
2012 2013 2014 2015 2016
. Grade A Grade B Grade C
45%
44%
11%

Ho Chi Minh City Office Market Overview
54 bps
468bps 121bps
211bps
Occupancy Rate
Grade A Grade B95.30%
93.60%
70%
75%
80%
85%
90%
95%
100%
2012 2013 2014 2015 Q1 Q2 Q3 Q4
2016
Grade A Grade B
Source: JLL Research

38.7
22.0
0
5
10
15
20
25
30
35
40
45
2012 2013 2014 2015 Q1 Q2 Q3 Q4
2016
Grade A Grade B
Ho Chi Minh City Office Market Overview
0.2%
1.9% 6.0%
0.8%
Average Rental Rate (US$/sm/month)
Grade A Grade B
Source: JLL Research

Ho Chi Minh City Office Market Overview
43%
50%
7%
Relocation New set-up transactions
Renewals and expansion
2016
Top 5 Industries
43%
50%
7%
201650%
30%
20%
2015
Finance Services
Law
Manufacturing
FMCG
IT
Source: JLL Research

Saigon Centre Phase IIDistrict 1
32,000 sqm
Deutsches HausDistrict 1
26,400 sqm
Etown CentralDistrict 4
35,000 sqm
Viettel CentreDistrict 10
49,500 sqm
Ho Chi Minh City Office Market Overview
127.0K 74.9K 160.0Ksqm (NFA) sqm (NFA) sqm (NFA)
2017 2018 2019 onward*
Grade A Grade B Grade C
Future Supply 2017-2019 Upcoming Projects
Source: JLL Research
*Future supply 2019 onward are tentative and may be subject to change depending on change in development plans.
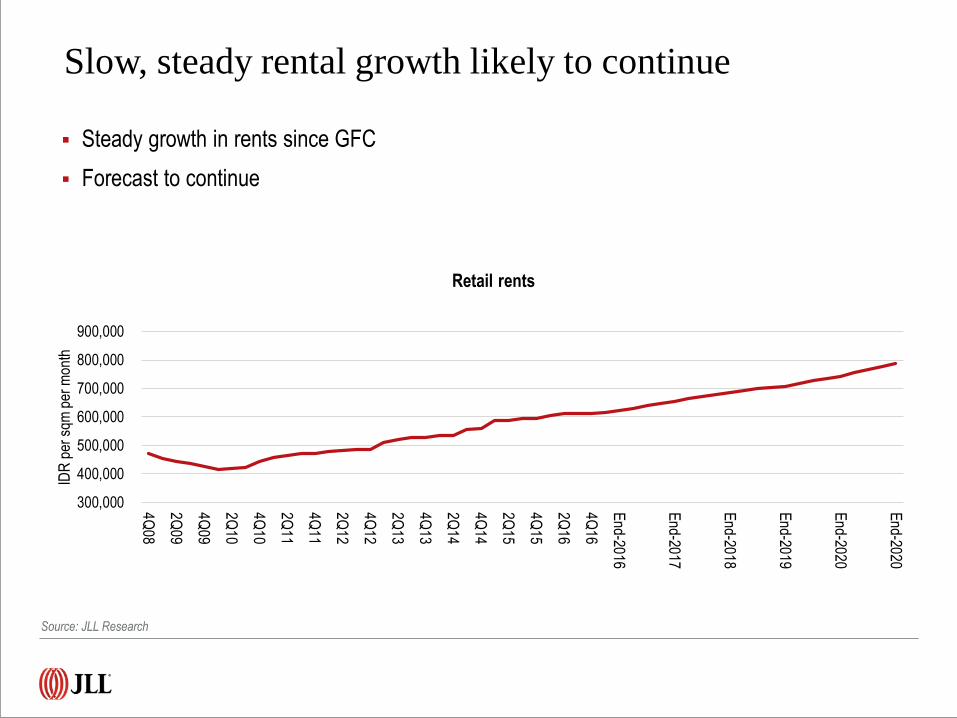
Ho Chi Minh City Apartment Market Overview
28
35,928FY 2016
New Launches per Annum (Units)
FY 2015 24,5729,720
8,896
8,438
8,874
7,500
8,000
8,500
9,000
9,500
10,000
1Q16 2Q16 3Q16 4Q16
New Launches per quarter (units)
Source: JLL Research

Ho Chi Minh City Apartment Market Overview
33,996FY 2016
FY 2015 23,7938,974
7,798
8,438
9,091
7,000
7,500
8,000
8,500
9,000
9,500
1Q16 2Q16 3Q16 4Q16
Units Sold per quarter (units) Units Sold per annum (Units)
Source: JLL Research

Ho Chi Minh City Apartment Market Overview
1,527
1,228
500
700
900
1,100
1,300
1,500
1,700
2011 2012 2013 2014 2015 1Q16 2Q16 3Q16 4Q16
USD/sqm
Primary prices Secondary prices
1,527858
1,474
2,287
4,179
0
500
1000
1500
2000 2500 3000
3500
4000
4500
5000
1,228782
1,379
2,1074,200
0
500
1000
15002000 2500 3000
3500
4000
4500
5000
Average selling prices (US$/sqm) Primary Prices (USD/sqm)
Secondary Prices (USD/sqm)
Affordable Mid-end Premium Luxury
Source: JLL Research

26%
8%
6%28%
8%
20%
4%
13%
8%
14%
10%13%
6%
5%
19%
2015
2016
Ho Chi Minh City Apartment Market Overview
14%
40%
45%
2011 2012 2013 2014 2015 2016
Affordable Mid-end Premium Luxury - less than 1%
41.6K 52.8K 59.7K 67.1K 75.8K 94.1Kunits units units units units units
Total Stock, 2011-16 New launches by Districts
Source: JLL Research

Ho Chi Minh City Apartment Market Overview
D1MENSION - CAPITALAND
“ First residential project in
Vietnam to offer property
management and concierge
services by The Ascott Limited“
SERENITY SKY VILLAS – SONKIM LAND
“ New concept – “Sky Villa”
“ New direction for Elite lifestyle”

Ho Chi Minh City Retail Market Overview
418,350 445,350472,450
630,384
0
100
200
300
400
500
600
700
800
900
2012 2013 2014 2015 2016
. Non-CBD CBD
‘000 sqm
814,435
Total Supply in 2012-2016 (NFA, sqm)
Source: JLL Research
26%
74%

Ho Chi Minh City Retail Market Overview
100bps
250bps 120bps
70bps
Occupancy Rate
CBD Non-CBD
87.0%
92.6%
80%
84%
88%
92%
96%
2012 2013 2014 2015 Q1 Q2 Q3 Q4
2016
CBD Non-CBD
Source: JLL Research

Ho Chi Minh City Retail Market Overview
71.0
37.6
0
20
40
60
80
2012 2013 2014 2015 Q1 Q2 Q3 Q4
2016
CBD Non-CBD
Average Rental Rate (US$/sm/month)
0.7%
0.9% 3.8%
0.5%
CBD Non-CBD
Source: JLL Research

2017 2018 2019 onward *
CBD Shopping Centres Non-CBD Shopping Centres
Ho Chi Minh City Retail Market Overview
45.7K 83.6K 45.0Ksqm (GFA) sqm (GFA) sqm (GFA)
Léman C.T Plaza
Open in 2017
Vincom Landmark 81
Open 2018
12,000 sqm 46,345 sqm
Future supply in 2017-2019 Typical Future Shopping Centres
Source: JLL Research
*Future supply 2019 onward are tentative and may be subject to change depending on change in development plans.

Ho Chi Minh City Retail Market Overview
NEW LIFESTYLE SHOPPING MALLS & FOOD COURTS
Rubik Zoo @ Saigon Zoo
5,000 m2 & over 300 kiosksEco Box Mall @ Tan Phu
3,600 m2 & 300 kiosks
Taka Plaza - Sense Market @ 23/9 Park
2,000 m2 & 250 kiosks
Asiana Food Town
@ 23/9 Park
1,500 m2 & 100 food courts
Food Square
@ Near Big C Tan Phu
1,000 m2 & 70 food courts
Cocochin Food Court
@ Nguyen Hue Pedestrian Street
1,200 m2 & 15 food courts
Street Food Market
@ Ben Thanh Market
700m2 & 70 food courts
Source: JLL Research

INCREASING INTERNATIONAL TOURIST ARRIVALS INTO VIETNAM
affordability compared to other neighbouring destinations.
marketing campaigns to promote the country’s tourism since 2010.
rising disposable incomes.
Hotels: Vietnam International Visitor Arrivals
Source: Vietnam National Administration of Tourism Board
Hong Kong
▲ 67.5% y-o-y
South Korea
▲ 38.7% y-o-y
10,013
26.0%
0%
10%
20%
30%
40%
50%
60%
0
2,000
4,000
6,000
8,000
10,000
12,000
2009 2010 2011 2012 2013 2014 2015 2016
Foreign Visitors Growth Rate (%)
China
▲ 51.4% y-o-y

Ho Chi Minh City Hotel Market Overview
0%
20%
40%
60%
80%
100%
0
40
80
120
160
200
2003 2004 2005 2006 2007 2008 2009 2010 2011 2012 2013 2014 2015 YTDOct
2015
YTDOct
2016
Occ
up
ancy
(%
)
AD
R /
Rev
PA
R (
US
D)
ADR (USD) RevPAR (USD) Occupancy (%)
Source: STR Global
Note: Rates inclusive of Service Charge, Marketwide number
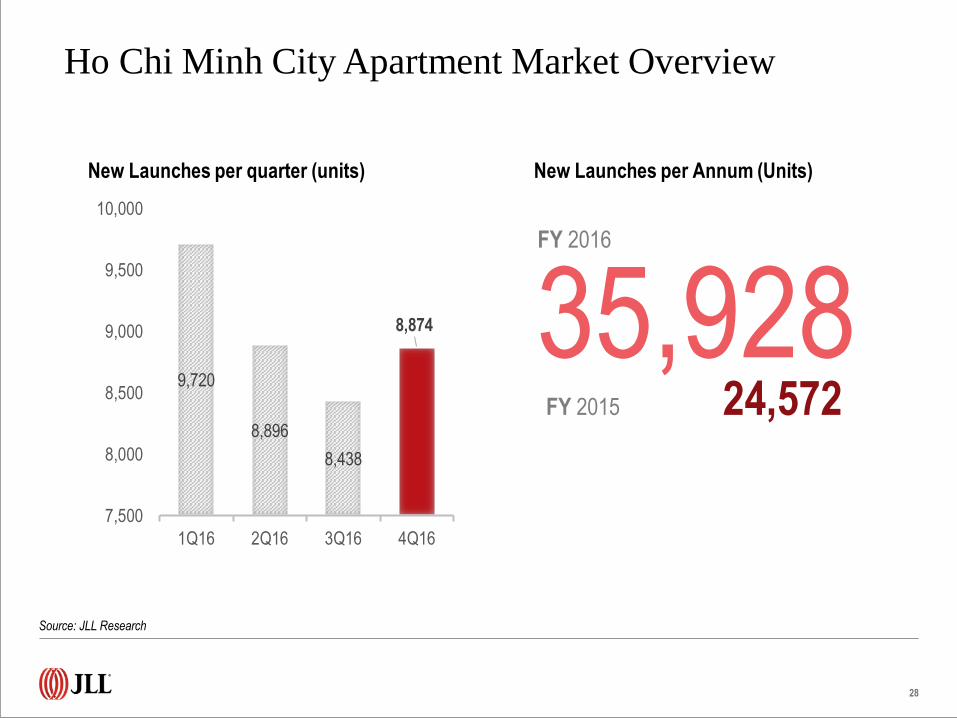
Ho Chi Minh City Hotel Market Overview
MAJESTIC
(extension)
District 1
RITZ CARLTON
District 1
OKURA PRESTIGE
HOTEL
District 1
LAVENUE CROWN
District 1
353 Units 250 Units 250 Units 235 Units
Typical Future 5-STAR Hotels From 2017 ONWARD
Source: JLL Research
*Future supply 2019 onward are tentative and may be subject to change depending on change in development plans.

• Improving InfrastructureImprovements to the city’s infrastructure such as the new metro line and a proposed new airport in Long Thanh
will benefit the hotel and tourism market in the mid-to-long term when these infrastructure are completed.
• Slow SupplyThe supply pipeline for further hotel construction in HCMC has slowed, comprising 1,941 rooms from 2016 onwards. Continued FDI from Japan, China, and South Korea into the country should help to boost corporate demand.
We have identified 16 new hotel projects from 2017 to 2019, supplying approximately 3,500 rooms. More than 700 rooms from five existing three to four star hotels are also awaiting ratings approval
• Strong Growth in Number of TouristsThe country had 62 million domestic travelers in 2016 with total revenue at US 18 billion according to the Vietnam
National Administration of Tourism. Vietnam welcomed its 10 millionth annual foreign visitor on December 25th at
Phu Quoc International Airport, the first time the country has recorded 10 million international arrivals in a calendar
year, up 25% year on year.
Ho Chi Minh City Hotel Market Overview - Outlook

2016 M&A – Some Notable Transactions
A&B TOWER
GHOMES
DEVELOPMENT
D1 PRIME SITE
DUXTON
HOTEL
SAIGON
HCMC Hanoi
TNR TOWER
KEANGNAM
HANOI
LANDMARK TOWER
SEDONA SUITES
Source: RCA, retrieved at Jan 2017
Others
THE NAM HAI
RESORT &
SPA
Quang Nam
SIX SENSE
CON DAO - BR
- VT
SANCTUARY HO
TRAM - BR - VT
THE MANOR
CENTRAL PARK
INTERNATIONAL
CENTRE
BUILDING
KUMHO
ASIANA PLAZA
NOVOTEL
SAIGON CENTRE
EMPIRE CITYSOMERSET
VISTA
~$921mTotal Value Transactions In 2016

2016 M&A – Some Notable Transactions
BIG RETAIL M&A TRANSACTIONS 2016
NEW JVS/ FUNDS FORMED UP
Metro Group completes sale of Metro Cash & Carry Vietnam to TCC
Central Group announces the purchase of Zalora Thailand
French retailer Casino to sell Big C Vietnam
HK’s Sunwah to invest $100m in Vietnam, forms JV with Saigon Asset Management
VinaCapital & Warburg Pincus create $300 million JV
CapitaLand sets $500m target for follow-on Vietnam fund
Indochina Capital teams up with Kajima Corporation
Source: DealStreetAsia, VietnamEconomicTimes, Reuter, TheNation, AsiaProperty

Singapore 2017 outlook: Bottom fishingRegina Lim
Advisory and research, Capital Markets

Expect Singapore GDP to grow 2-3% in 2017-2018
GDP expected to grow c.2% in 2017, recovering slightly from the 1.8% in 2016. ASEAN growth on stronger domestic consumption is supportive. Sectors such as business services, IT and tourism-related services are expanding in Singapore.
While office, retail and F&B demand slowed in 2012-2015, we believe these bottomed in 2016 and we expect a modest recovery of 1-2% growth in 2017-2018.
GDP growth in Singapore and South East Asia
45
Source: Dept of statistics, URA, JLL Research estimates
Growth in office, retail, F&B demand
-4%
-2%
0%
2%
4%
6%
8%
10%
12%
14%
16%
Office demand Retail sales F&B receipts
5.94.6 5 5
1.6 2.3 2.6
-4
-2
0
2
4
6
8
10
12
14
16
18
2005
2006
2007
2008
2009
2010
2011
2012
2013
2014
2015
2016
2017
E
2018
E
ASEAN Singapore

Singapore consumer price index rose in 4Q16 after two years of deflation. Central Bank expects inflation of 0.5-1.5% in 2017.
This paves the way for MAS to maintain a zero SGD appreciation stance or allow slight appreciation. Consensus estimate 1.46 SGD/USD by end-2017 and end-2018
This should allow interest rates to rise slower than US rates, buffering companies from defaults. SGD 10Y govt bond yield is expected to remain stable at 2.4-2.5% till 2018.
46
Inflation returns, paving way for stable SGD and moderate rates
Inflation (CPI yoy change %) SGD/USD
Source: Dept of statistics, JLL Research
0.50
0.55
0.60
0.65
0.70
0.75
0.80
0.85
1Q95
1Q96
1Q97
1Q98
1Q99
1Q00
1Q01
1Q02
1Q03
1Q04
1Q05
1Q06
1Q07
1Q08
1Q09
1Q10
1Q11
1Q12
1Q13
1Q14
1Q15
1Q16
-2.0
-1.5
-1.0
-0.5
0.0
0.5
1.0
1.5
2.0
2.5
3.0
CPI MAS Core Inflation Measure

Foreign manpower policy is gradually loosening
In 2005-2011, Singapore attracted 50,000-80,000 skilled workers but the rapid increase in population and lack of infrastructure resulted in citizen discontent, and curbs in 2012-2015.
We expect a gradual relaxation on inflow of skilled workers, which increased from late 2015. This is expected to boost demand for office, retail and residential property.
47
Source: Dept of statistics, URA, JLL Research estimates
95
-3
4
1118
17 15
-1 -1 -23 2 2 1
82
(10)
(5)
-
5
10
15
20
25
30
35
1H08
2H08
1H09
2H09
1H10
2H10
1H11
2H11
1H12
2H12
1H13
2H13
1H14
2H14
1H15
2H15
1H16
'000
s
PRs Expats
Increase in permanent residents and expats Increase in residents and expats
-20.0
-10.0
0.0
10.0
20.0
30.0
40.0
50.0
60.0
70.0
80.0
90.0
2005 2006 2007 2008 2009 2010 2011 2012 2013 2014 2015
New citizens Perm Residents Expats Total
12.1
9.1
-6.0
-4.0
-2.0
0.0
2.0
4.0
6.0
8.0
10.0
12.0
14.0
16.0
18.0
(1.00)
(0.50)
-
0.50
1.00
1.50
2.00
2.50
3.00
2005 2006 2007 2008 2009 2010 2011 2012 2013 2014 2015 2016E 2017E 2018E 2019E 2020E
Net
letta
ble
area
msf
Supply Net absorption Prime office rent S$psfpm (RHS)
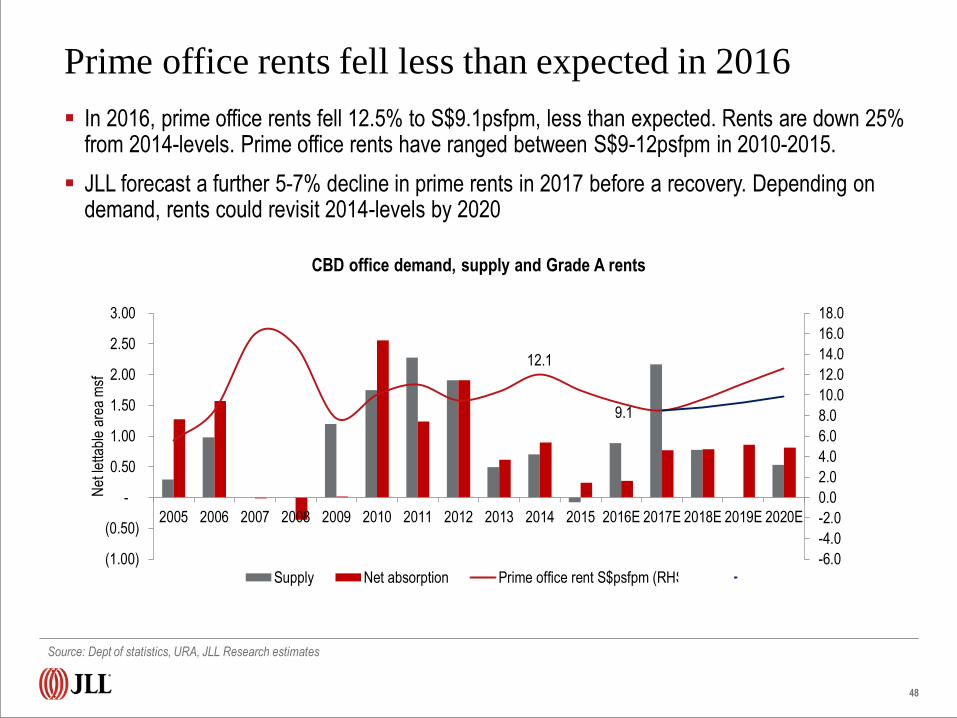
Prime office rents fell less than expected in 2016
In 2016, prime office rents fell 12.5% to S$9.1psfpm, less than expected. Rents are down 25% from 2014-levels. Prime office rents have ranged between S$9-12psfpm in 2010-2015.
JLL forecast a further 5-7% decline in prime rents in 2017 before a recovery. Depending on demand, rents could revisit 2014-levels by 2020
CBD office demand, supply and Grade A rents
48
Source: Dept of statistics, URA, JLL Research estimates

Leasing of 2016-2017 completions healthy
In 2016, new office buildings attracted stronger than expected pre-commitments as tenants relocate from stock with smaller floor plates in a “flight to efficiency”
Overall, about 50% of the office space in buildings completing in 2016-2017 have been leased.
Pre-commitment rates of buildings completing in 2016-2017
49
Source: Dept of statistics, URA, JLL Research estimates
83%
34%
50%
40%
3% 0%
10%
20%
30%
40%
50%
60%
70%
80%
90%
-
0.2
0.4
0.6
0.8
1.0
1.2
1.4
1.6
1.8
2.0
Tanjong Pagar Centre3Q16
DUO 4Q16 Marina One 1Q17 UIC Building 1Q17 Frasers Tower 2Q18
Net
letta
ble
area
(m
sf)
Net lettable area (sf) Precommitment %

Supply after 1H17 is low especially in CBD
In 2017-2020, office completions in the CBD is expected to be low at 0.95msf p.a., 40% lower than the supply in 2010-2016. The 5-year and 10-year average annual absorption rate for CBD office is 0.98msf and 0.87msf respectively.
50
Source: MAS, JLL Research estimates
Singapore office building completions
2010-16 avg CBD: 1.63msf
2017-2020E avg CBD: 0.95msf
0.0
0.5
1.0
1.5
2.0
2.5
3.0
3.5
0.0
0.5
1.0
1.5
2.0
2.5
3.0
3.5
2010 2011 2012 2013 2014 2015 2016E 2017E 2018E 2019E 2020E
Offi
ce N
LA (
msf
)
CBD Strata Decentralised

Land prices rose sharply in 2H16, signalling optimism
Redevelopment schemes in 2H15-1H16 for CPF Building, Afro Asia Building and Park Mall pegged 99-year CBD commercial land prices at c.S$1,170-1,300psfppr.
In Nov 16, the Central Boulevard site was sold for S$1,690psfppr. The developers with the top 4 bids at S$1,400psfppr and above likely expect prime rents to rise 30% to S$12psfpm over the next 5 years.
51
Source: URA, JLL Research estimates
Govt land sale prices in Marina Bay area
Frasers Tower S$1,113psf
(4 bids)
SBF CentreS$ 882psf (3 bids)
Guoco Tower S$1,006psf
(6 bids)
Asia Square 2, Dec 07 S$ 780psf (2 bids)
Asia Square 1, Sep 07S$ 1,409psf (3 bids)
Mapletree Anson, Jul 07 S$ 1,022 psf (5 bids)
Twenty Anson, Aug 07S$ 941psf (3 bids)
MBFC S$405 psf (9 bids)
Sail@Marina BayS$ 227psf (2 bids)
ORQ S$290psf (2 bids)
-
200
400
600
800
1,000
1,200
1,400
1,600
1,800
07/1998 04/2001 01/2004 10/2006 07/2009 04/2012 12/2014 09/2017
South Beach, Jul 07
S$1,069 psf (2 designs)
Central Boulevard, Nov 16
S$1,690 psf (7 bids)

Buy office assets when sentiment, occupancy is weak
Given the cyclical market, buying assets when vacancy and pessimism is high has paid off.
In 2002-2004, buying an office building and selling it in 5 years would yield an average annual return of 18%. In 2009-1H2010, the same strategy would yield a 11% annual return.
We expect vacancy rate to rise above 12% in 2017, providing a buying opportunity.
52
Source: URA, JLL Research estimates
0.0%
2.0%
4.0%
6.0%
8.0%
10.0%
12.0%
14.0%
-15.0%
-10.0%
-5.0%
0.0%
5.0%
10.0%
15.0%
20.0%
25.0%
2000
2000
2001
2002
2003
2003
2004
2005
2006
2006
2007
2008
2009
2009
2010
2011
2012
2012
2013
2014
2015
2015
2016
E
2017
E
Vca
ncy
rate
Ann
ual r
etur
n ov
er 5
yea
rs
Annual return over 5 years Vacancy rate (RHS)

Prime office cap rates vs rent growth and 10y govt bonds
Counter-intuitively, buying assets make sense when yield spreads are low.
In 2002-2004, spread fell to 100-140 bps before rising to 250 bps in 2005-2008. In 2009-2010, when spread fell back to 180 bps, it was another buying opportunity.
We expect the yield spread to stay narrow at 100bps in 2017. Buying an asset at 3.3-3.9% yield in 2017 could provide 4.5-5.3% by 2020 if prime Grade A rents recover to 2014 levels.
53
Source: MAS, JLL Research estimates
Yoy rental growth 32% -13% -14% -18% -4% 28% 53% 89% -8% -48% 29% 10% -14% 9% 16% -14% -14%
4.96 5.22
4.92
4.07 4.23
5.13 5.25 5.52
5.87
4.34 4.17 4.03 3.56 3.65
4.15 3.83
3.50 3.40 4.37
3.56 3.53
2.92 3.23
2.92 3.36
2.88 2.78 2.37 2.40
2.09
1.46
2.06 2.36 2.44 2.50 2.50
-
1.0
2.0
3.0
4.0
5.0
6.0
7.0
2000 2001 2002 2003 2004 2005 2006 2007 2008 2009 2010 2011 2012 2013 2014 2015 2016 2017E
Prime office yield 10Y Gov bond yield

Retail assets still sought after due to resilience
Singapore retail rents and occupancy (above 97%) are highly resilient amid recessions.
Further, asset yield spread above cost of debt is wide compared to other asset classes.
Retail caprates have compressed slightly in the last five years, as observed through retail REITs’ trading prices and recent transactions in 4Q16.
54
Source: Dept of statistics, URA, JLL Research
5.35%
5.79%
4.70%
4.00%
4.50%
5.00%
5.50%
6.00%
6.50%
2009 2010 2011 2012 2013 2014 2015 Dec2016
Valuation caprate Passing yield Implied cap for retail REITs
3.00% 3.0%
1.5%
4.5%
3.5%
2.0%
0.00%
0.50%
1.00%
1.50%
2.00%
2.50%
3.00%
3.50%
4.00%
4.50%
5.00%
Retail Office Residential
Cost of debt Yield spread
Retail yields have compressed slightly over last 5 years Singapore asset yields and spread over cost of debt

Retail supply expected to be low in 2016-2020
Retail supply grew 1.7% CAGR in 1999-2005 as govt sought to increase efficiency of retail space. Supply rose at 7% CAGR in 2006-2014 as malls to attract tourists were built in Orchard Road, Marina Bay. Vacancy rate does not exceed 3%.
The government has disapproved initiation of new retail space since 2013 and capped retail space for new Govt Land Sale sites. Excluding Jewel@Changi, retail supply will grow at 1.4% CAGR in 2016-2020.
55
Source: Dept of statistics, URA, JLL Research
-0.5%
0.0%
0.5%
1.0%
1.5%
2.0%
2.5%
3.0%
3.5%
(0.50)
-
0.50
1.00
1.50
2.00
2.50
3.00
1996
1997
1998
1999
2000
2001
2002
2003
2004
2005
2006
2007
2008
2009
2010
2011
2012
2013
2014
2015
2016
E
2017
E
2018
E
2019
E
2020
E
Vac
ancy
rat
e
Net
letta
ble
area
msf
Ch in stock Ch in demand Vacancy rate
Demand, supply and vacancy rate of retail space in Singapore

Retail and F&B sales recovered slightly in 2H16
After a gradual decline since 2011, retail and F&B sales recovered slightly in 2H16.
We expect stronger tourist arrivals and slightly higher economic growth to boost retail and F&B sales to grow 0-1% in 2017-2018.
Overall, Orchard Road and suburban retail rents have corrected 8% in 2016, but we expect a recovery in 2017-2018.
56
Source: Dept of statistics, URA, JLL Research estimates
Retail sales and F&B receipts
-4%
-2%
0%
2%
4%
6%
8%
10%
12%
14%
16%
2004
2005
2006
2007
2008
2009
2010
2011
2012
2013
2014
2015
2016
2017
E
Retail sales F&B receipts
Prime Orchard and suburban retail rents fell 8% in 2016
15.0 17.0 19.0 21.0 23.0 25.0 27.0 29.0 31.0 33.0 35.0 37.0 39.0
S$p
sfpm
Prime suburban rent S$ psfpm Prime Orchard rent S$ psfpm

Well-positioned assets are gaining market share
While overall retail sales slowed since 2011 and average retail rents fell in 2016, well-positioned assets outperformed.
Larger malls with providing a wide range of retail, F&B, education and entertainment options gained market share and achieved positive rental reversions.
CapitaMall Trust mall traffic, sales and rental revenue Vivocity tenant sales and rental revenue (S$millions)
57
Source: CapitaLand Mall Trust, Mapletree Commercial Trust
180
190
200
210
220
230
240
250
30
32
34
36
38
40
42
44
46
48
50
3Q11
4Q11
1Q12
2Q12
3Q12
4Q12
1Q13
2Q13
3Q13
4Q13
1Q14
2Q14
3Q14
4Q14
1Q15
2Q15
3Q15
4Q15
1Q16
2Q16
Rent revenue Vivocity tenant sales (RHS)Singapore retail sales
98
100
102
104
106
108
110
112
2011 2012 2013 2014 2015 1H16
Traffic Tenant sales
Rent revenue Singapore retail sales

Singapore luxury home prices bottomed in 2016
Private luxury residential sale volume and prices
Source: URA, JLL Research
3,288
2,686
-
1,000
2,000
3,000
4,000
5,000
6,000
1,000
1,500
2,000
2,500
3,000
3,500
200
5Q
3200
6Q
1200
6Q
3200
7Q
1200
7Q
3200
8Q
1200
8Q
3200
9Q
1200
9Q
3201
0Q
1201
0Q
3201
1Q
1201
1Q
3201
2Q
1201
2Q
3201
3Q
1201
3Q
3201
4Q
1201
4Q
3201
5Q
1201
5Q
3201
6Q
1
Prime sales S$m (RHS) High-end residential price S$psf
-
1,000
2,000
3,000
4,000
5,000
6,000
2010 2011 2012 2013 2014 2015 2016
S$m
S$2500-3000psf S$3000-3500psf S$3500-4000psf Over S$4000psf
Transactions above S$2,500psf
Singapore luxury home prices have fallen c.20% in the last 3 years, but reached a turning point in 2016.
Transactions above S$2,500psf fell 67% in 2015 compared to 2010/11 after several rounds of property cooling measures. But in 2016, such transactions doubled yoy and recovered to 2011/12 levels
58

0
500
1000
1500
2000
2500
3000
3500
2005 2006 2007 2008 2009 2010 2011 2012 2013 2014 2015 2016
Singapore PR Foreigner Company
Foreigner buying fell 80% since 2010 but recovered in 2016
Foreigner purchases of units above $2,000psf fell by 80% from 788 units p.a. in 2010-2011
to 160 units in 2015. In 2016, this doubled to 300 units.
Buyers from Indonesia, Malaysia, China, HK and Australia increased 3 times yoy.
Yearly transactions above $2000psf
Source: URA, JLL Research
59
Non-resident buyers of units above S$2,000psf
-
50
100
150
200
250
300
350
400
450
2010 2011 2012 2013 2014 2015 2016
Indonesia Hong Kong Malaysia China

Prime residential prices in London, New York, Hong Kong have continued to rise in the last 5 years. Hong Kong prices are 130% higher than Singapore. New York prices are now 62% higher.
Prime home prices in New York and London were within 10% of Singapore’s prices in 2010. In the last 5 years, these rose 20-25% while those in Singapore fell 20%.
60
Prime residential is compelling compared to other global cities
Source: JLL Research, Corcoran Report 2Q15
53%
Hong Kong, 126%
10%
London, 22%
New York, 62%
-40%
-20%
0%
20%
40%
60%
80%
100%
120%
140%
2010 2011 2012 2013 2014 2015 2016
Pric
e G
ap
Prime residential price gap between Singapore and other major cities in US dollars terms

Due to the correction in Singapore residential prices, home price to income ratio in Singapore has fallen from 7.3 in 2010 to 4.8 times in 2015.
In contrast, homes in London, San Francisco, Tokyo and Hong Kong have all become less affordable.
61
Housing affordability in Singapore improved, global prices soared
Source: demographia.com, JLL Research
Home price to income ratio from 2010-2016
7.3
4.8
7.2
8.5
7.2
9.2
7.1
10 9.6
12.211.4
18.1
-
2.0
4.0
6.0
8.0
10.0
12.0
14.0
16.0
18.0
20.0
2010 2016
Singapore
London
San Francisco
Tokyo
Sydney
Hong Kong

Cost of buying, holding and selling an USD2m residential property ranges from 15-33% in global cities such as London, New York, Hong Kong.
Cost including additional buyer stamp duty for Singapore is in the middle of the range.
Cost of buying in Singapore is much higher than holding costs.
62
Prime residential transaction costs in line with global cities
Source: JLL Research
Cost of buying, holding and selling a USD2m residential property
0.0%
5.0%
10.0%
15.0%
20.0%
25.0%
30.0%
35.0%
HongKong
Tokyo Sydney Singapore Paris New York London SanFrancisco
Dubai Shanghai
Cost of buying Holding (5 years) Cost of selling

Supply of luxury prime residential units in districts 9, 10, 11 is expected to grow by 0.5% p.a. in 2017-18
Supply via collective sale for larger redevelopment is unlikely until the current 15% ABSD on land purchases is amended
Completion of residential units in core central region
2280
2,823
1,899 2,043
4,046
2,281
1,300
600267
0.0%
2.0%
4.0%
6.0%
8.0%
10.0%
0
1000
2000
3000
4000
5000
2010 2011 2012 2013 2014 2015 2016E 2017E 2018E
Completed units Unsold as at 4Q15 %ch
7
Completions falling to 0.5% p.a.
in 2017-18
Upcoming supply in prime districts is limited

Residential block deals dominated in 2016, continue in 2017-18
64
Close to S$ 2bn of residential units were sold via block deals or structured vehicles in 2016 as developers rushed to meet the deadline to sell units within 2 years of completion (mandated by Residential Property Act). Over S$ 1bn of deals are under negotiation.
As the units that were completed in 2015-2016 and subject to these rules are still high, we expect more of such block deals in 2017-2018.
Unsold residential units in prime areas subject to extension charges
Source: Dept of statistics, JLL Research,
0
100
200
300
400
500
600
700
800
900
2013 2014 2015 2016 2017 2018
Res
iden
tial u
nits
Year of completion
Unsold units Subject to QC charges Seeking block deals

Hotels: Tourist arrivals recovered in 2016
YTD till Nov 2016, tourist arrivals rose 8% y-o-y to 14.9 million but still below the peak in 2013
Mainland China visitors rose by 32% y-o-y, due to improved flight connectivity between Singapore and second-tier Chinese cities.
9.7
11.6
13.2
14.515.6 15.1 15.2
13.814.9
-30%
-20%
-10%
0%
10%
20%
30%
40%
50%
0
4
8
12
16
2009 2010 2011 2012 2013 2014 2015 YTD Nov2015
YTDNov2016
Ann
ual G
row
th
Num
ber
of V
isito
rs (
Mill
ions
)
Visitor Arrivals (millions) Annual GrowthSource: Singapore Tourism Board (STB)

Singapore hotels: Upscale Trading Performance
As at YTD October 2016, upscale hotel RevPar fell 2.5%, while occupancy was stable, roomrates fell 3%.
Hotels found increasing room rates with their corporate accounts difficult as companies reduced travel budgets. In particular, the oil and gas industry has been significantly impacted.
New supply in the market has also given corporates more options in selecting where they place their business as new hotels are aggressive in building up their corporate clients.
0%
10%
20%
30%
40%
50%
60%
70%
80%
90%
100%
$0
$50
$100
$150
$200
$250
$300
2007 2008 2009 2010 2011 2012 2013 2014 2015 YTD Oct2015
YTD Oct2016
Occ
up
ancy
(%
)
AD
R /
Rev
PA
R (S
GD
)
ADR (SGD) RevPAR (SGD) Occupancy (%)Source: STR Global
Note: Rates inclusive of Service Charge

Singapore: Supply is low after 2017
In 2015-2017, hotel supply rose by 20%, resulting in falling room rates. The majority of the new supply are in the midscale and budget segments.
Hotel supply is expected to slow to c.1-2% in 2018-2020, as the government has reduced land release for hotels from 2013. This would be positive for hotel RevPar from 2018.
Singapore continues to grow the tourism sector by developing and investing in new initiatives, which makes it a compelling hotel investment market.
49,719 51,579 55,018 57,172 60,90865,627 69,078
1,2743,357 1,773
2,663 4,719
3,4511,284
0
10,000
20,000
30,000
40,000
50,000
60,000
70,000
2012 2013 2014 2015 2016 2017F 2018F
Num
ber
of R
oom
s
Existing Supply Completed Supply New/Future Rooms SupplySource: STB, JLL

Panel Discussion: Top ASEAN markets for 2017
Chris Fossick
Managing Director
Southeast Asia
Todd Lauchlan
Head
Indonesia
Stephen Wyatt
Head
Vietnam
Regina Lim
National Director
Research & Advisory
Mike Batchelor
Managing Director
Hotels & Hospitality
Dr Chua Yang Liang
Head of Research
Southeast Asia