Embed Size (px)
Citation preview

JIT/Lean Production
©2006 Pearson Prentice Hall — Introduction to Operations and Supply Chain Management — Bozarth & Handfield
Chapter 15, Slide 2
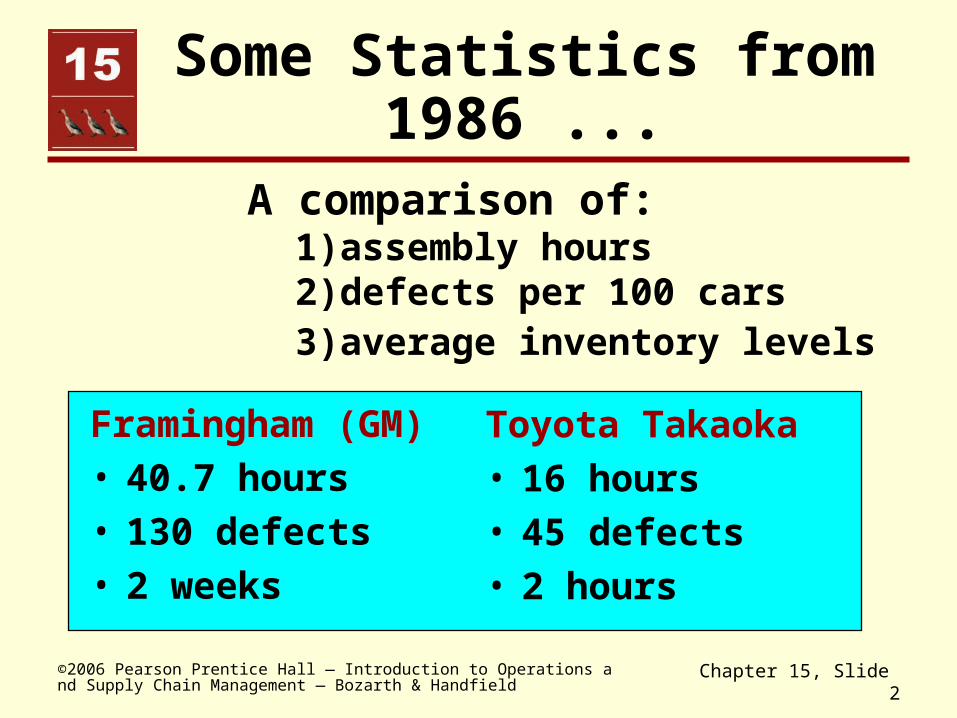
Some Statistics from1986 ...
Framingham (GM)• 40.7 hours• 130 defects• 2 weeks
Toyota Takaoka• 16 hours• 45 defects• 2 hours
A comparison of:1) assembly hours2) defects per 100 cars3) average inventory levels

©2006 Pearson Prentice Hall — Introduction to Operations and Supply Chain Management — Bozarth & Handfield
Chapter 15, Slide 3
Post World War II
• Growing and rebuilding world economy
• Demand > Supply
• US Manufacturing:– Higher volumes– Capital substitution– “Breakthrough” improvements– “The production problem has been
solved”

©2006 Pearson Prentice Hall — Introduction to Operations and Supply Chain Management — Bozarth & Handfield
Chapter 15, Slide 4
View from Japan
• Very little capital• War-ravaged workforce• Little space• Poor or no raw materials• Lower demand levels• Little access to latest technologies
U.S. methods would not work

©2006 Pearson Prentice Hall — Introduction to Operations and Supply Chain Management — Bozarth & Handfield
Chapter 15, Slide 5
Japanese Approach to Operations
• Maximize use of people
• Simplify first, add technology second
• Gradual, but continuous improvement
• Minimize waste (including poor quality)
Led to the development of the approach known as Just-in-Time

©2006 Pearson Prentice Hall — Introduction to Operations and Supply Chain Management — Bozarth & Handfield
Chapter 10, Slide 6
Just-in-Time
Repetitive production system
in which processing and movement of materials and goods occur just as
they are needed

©2006 Pearson Prentice Hall — Introduction to Operations and Supply Chain Management — Bozarth & Handfield
Chapter 15, Slide 7
Pre-JIT: Traditional Mass Production
Big lot sizesLots of inventory”PUSH” material to nextstage
Lowerper unit
cost
Big purchase shipments
Big “pushes” of finished goodsto warehouses or customers
???

©2006 Pearson Prentice Hall — Introduction to Operations and Supply Chain Management — Bozarth & Handfield
Chapter 15, Slide 8
Post-JIT: “Lean Production”
Tighter coordination along the supply chainGoods are pulled along
— only make and ship what is neededSmaller lotsFaster setupsLess inventory, storage space”PULL” material to next stage
Minimalor no
inventoryholding
cost
Smaller shipments
Goods are pulled out ofplant by customer demand

©2006 Pearson Prentice Hall — Introduction to Operations and Supply Chain Management — Bozarth & Handfield
Chapter 15, Slide 9
JIT Goals(throughout the supply chain)
• Eliminate disruptions
• Make the system flexible
• Reduce setup times and lead times
• Minimize inventory
• Eliminate waste

©2006 Pearson Prentice Hall — Introduction to Operations and Supply Chain Management — Bozarth & Handfield
Chapter 15, Slide 10
Waste
Definition:
Waste is ‘anything other than the minimum amount of equipment, materials, parts, space, and worker’s time, which are absolutely essential to add value to the product.’
— Shoichiro Toyoda President, Toyota

©2006 Pearson Prentice Hall — Introduction to Operations and Supply Chain Management — Bozarth & Handfield
Chapter 15, Slide 11
Forms of Waste:
• Overproduction
• Waiting time
• Transportation
• Processing
• Inventory
• Motion
• Product Defects
©2006 Pearson Prentice Hall — Introduction to Operations and Supply Chain Management — Bozarth & Handfield
Chapter 15, Slide 12
Inventory as a Waste
• Requires more storage space
• Requires tracking and counting
• Increases movement activity
• Hides yield, scrap, and rework problems
• Increases risk of loss from theft, damage, obsolescence

©2006 Pearson Prentice Hall — Introduction to Operations and Supply Chain Management — Bozarth & Handfield
Chapter 15, Slide 13
Examples of Eliminating “Wastes”
Big Bob’s Automotive Axles:
Wheels boughtfrom outsidesupplier
Axles made andassembled in house

©2006 Pearson Prentice Hall — Introduction to Operations and Supply Chain Management — Bozarth & Handfield
Chapter 15, Slide 14
BEFORE: Shipping in Wheels
Bob’s
Wheels
Warehouse
Truck Cost: $500 (from Peoria)
Maximum load of wheels: 10,000
Weekly demand of wheels: 500

©2006 Pearson Prentice Hall — Introduction to Operations and Supply Chain Management — Bozarth & Handfield
Chapter 15, Slide 15
AFTER: Shipping in Wheels
Truck Cost: $50 (from Burlington)
Maximum load of wheels: 500
Weekly demand of wheels: 500
What wastes have been reduced?
Bob’sWheels

©2006 Pearson Prentice Hall — Introduction to Operations and Supply Chain Management — Bozarth & Handfield
Chapter 15, Slide 16
Process Design
• “Focused Factories”
• Group Technology
• Simplified layouts with little storage space
• Jidoka and Poka-Yoke
• Minimum setups
©2006 Pearson Prentice Hall — Introduction to Operations and Supply Chain Management — Bozarth & Handfield
Chapter 15, Slide 17
Personnel and Organizational Elements
• Workers as assets
• Cross-trained workers
• Greater responsibility at lower levels
• Leaders as facilitators, not order givers
©2006 Pearson Prentice Hall — Introduction to Operations and Supply Chain Management — Bozarth & Handfield
Chapter 15, Slide 18
Planning and Control Systems
• “Small” JIT
• Stable and level schedules
– Mixed Model Scheduling
• “Push” versus “Pull”
– Kanban Systems

©2006 Pearson Prentice Hall — Introduction to Operations and Supply Chain Management — Bozarth & Handfield
Chapter 15, Slide 19
Kanban
Uses simple visual signals to control production
• Examples:
empty slot in hamburger chute
empty space on floor
kanban card

©2006 Pearson Prentice Hall — Introduction to Operations and Supply Chain Management — Bozarth & Handfield
Chapter 15, Slide 20
Kanban Example
Workcenter B uses parts produced by Workcenter A
How can we control the flow of materials so that B alwayshas parts and A doesn’t overproduce?
Workcenter A Workcenter B

©2006 Pearson Prentice Hall — Introduction to Operations and Supply Chain Management — Bozarth & Handfield
Chapter 15, Slide 21
When a container is opened by Workcenter B, its kanban card is removed and sent back to Workcenter A.This is a signal to Workcenter A to produce another box of parts.
Kanban card: Signal to produce
Workcenter A Workcenter B
Kanban Card

©2006 Pearson Prentice Hall — Introduction to Operations and Supply Chain Management — Bozarth & Handfield
Chapter 15, Slide 22
Empty Box: Signal to pull
Empty box sent back. Signal to pull another full box intoWorkcenter B.Question: How many kanban cards here? Why?
Workcenter A Workcenter B

©2006 Pearson Prentice Hall — Introduction to Operations and Supply Chain Management — Bozarth & Handfield
Chapter 15, Slide 23
How Many Kanbans?
y = number of kanban cardsD = demand per unit of timeT = lead timeC = container capacityX = fudge factor
Cx)DT(1
y