Embed Size (px)
Citation preview
JIPK(JURNAL ILMIAH PERIKANAN DAN KELAUTAN)
e-ISSN:2528-0759; p-ISSN:2085-5842JIPK. Volume 11 No 2. November 2019 DOI=10.20473/jipk.v11i2.13185Sinta 2 (Decree No: 10/E/KPT/2018) Available online at https://e-journal.unair.ac.id/JIPK/index
Research Article
Lobster Population Parameter in Bumbang Bay, Central Lombok
Parameter Populasi Lobster Perairan Teluk Bumbang, Lombok Tengah
Yonvitner1,7, Zulhamsyah Imran2,8, Sulaeman Martasuganda3, Beni Osta Nababan4, Fransiskus Mao Tokan5, Septian Dwi Cahyo6, Rifki Aldi Ramadhani7
1Department of Aquatic Resources Management, Faculty of Fisheries and Marine Sciences. IPB University. Indonesia2Department of Aquatic Resources Management, Faculty of Fisheries and Marine Sciences. IPB University. Indonesia3Department of Fish Harvesting Technology and Management, Faculty of Fisheries and Marine Sciences. IPB University. Indonesia4Department of Natural Resources and Environment Economy, Faculty of Economy and Management. IPB University. Indonesia5Coastal and Marine Management Major, Graduate School IPB. Indonesia6Researcher in Coastal and Marine Study Center, PPM Institution. IPB University. Indonesia7Researcher in Disaster Study Center, PPM Institution. IPB University. Indonesia8Deputy Director of SEAMEO Tropical Biology-Bogor. Indonesia
ARTICLE INFO
Received: Juny 10, 2019Accepted: October 20, 2019
*) Corresponding author:E-mail: [email protected]
Keywords: lobster, Bumbang bay, population structure, management, sustainable
Kata Kunci: lobster, teluk Bumbang, struktur populasi, pengelolaan, berkelanju-tan
AbstractBumbang bay is one of the lobster fishing areas in Central Lombok District, where fishing is carried out at all times and has the potential to disrupt the sustainability of the population in the future. Data is collected from the stock of lobster stocks that are still in fishing cages. Potential risks and fishing pressure could be assessed through length and weight, growth, structure size and potential recruitment analysis. The results of the study found 6 species of lobsters, of which are 2 dominant species were pearl lobster (45.5%) and sand lobster (44.5%) of the total catch. The Length and weight relationship have a negative allometric pattern which is (pearls lobster b = 2.04 and sand lobster = 1.2). The growth rate is rela-tively slow with a growth rate coefficient of 0.2-0.49 per year. Therefore, recruitment per biomass from the population is also low and exploitation rate about 0.6. The population growth and recruitment relatively low and increasing the exploitation rate, potential to unsustainable of the lobster population in the future.
AbstrakPerairan Teluk Bumbang adalah salah satu pusat perikanan lobster di Lombok Tengah, dimana penangkapan dilakukan setiap waktu dan berpotensi mengganggu keberlanjutan populasi dimasa yang akan datang. Potensi risiko dan tekanan penangkapan dapat dikaji melalui analisis panjang dan bobot, pertumbuhan, struktur ukuran dan potensi recruit-ment. Hasil penelitian ditemukan sebanyak 6 jenis lobster, dimana 2 jenis dominan yaitu lobster mutiara (45,5%) dan lobter pasir 44,5% dari total tangkapan. Hubungan panjang dan berat memiliki pola allometrik negatif (lobster mutiara b=2,04 dan lobster pasir =1,2). Pertumbuhan tergolong lambat dengan koefisien laju pertumbuhan 0,2-0,49 per tahun. Begitu juga recruitment per biomass dari populasi juga rendah dan eksploitasi tergolong tinggi yaitu 0,6. Kemampuan tumbuh yang lambat dengan recruitment yang rendah serta eksploitasi tinggi, potensial menganggu keberlanjutan populasi lobster dimasa yang akan datang.
Cite this as: Yonvitner, Zulhamsyah, I., Sulaeman, M., Beni, O. N., Fransiskus, M. T., Septian, D. C., & Rifki, A. R. (2019). Lob-ster Population Parameter in Bumbang Bay, Central Lombok. Jurnal Ilmiah Perikanan dan Kelautan, 11(2):40–50. http://doi.org/10.20473/jipk.v11i2.13185
Copyright ©2019 Universitas Airlangga
This is an open access article under the CC BY-NC-ND license (http://creativecommons.org/licenses/by-nc-nd/4.0/)
40

41 Jurnal Ilmiah Perikanan dan Kelautan
Yonvitner et al. / JIPK, 11(2):40-50
1. Introduction
Bumbang Bay is one of the lobster producers in Lombok Island. There are 500 fishermen in total includ-ing the nursery fishermen, merchant, and 300 heads of the family of catch fishermen. This condition shows a high amount of fishing activity and demands the need to control these activities to prevent overexploitation. To ensure the fishing stays sustainable, there needs to be an indicator of how many are left for reserve and how many are available for fishing.
The population parameters related to stock that have been found are catch composition, size structure, growth, exploitation rate, and recruitment capability. Other than fishing, another factor affecting the stock is competition, e.g. against another species such as green crab (Goldstein et al., 2017) where 33% of all lobsters with carapace size larger than 80 mm are preyed upon by said green crabs.
The growth rates of spiny lobsters are 11.2±0.32 mm per month for its length and 1.81±0.19 grams to 2.28±0.21 grams/month (Syafrizal et al., 2018). Species Panulirus elephans also have a relatively slow growth rate of 1.9 mm a year whether in the wild are in a marine protected area (MPA). Moreover, it has been recorded that the maximum asymptotic length for female lobsters is 116 mm and 185 mm for male lobsters. Meanwhile, the mortality rate (naturally occurring) inside the MPA is 0.41 a year, while outside the MPA is 0.78 a year. Fur-thermore, the mortality rate by fishing is 0.43 from the total population (Bevacqua et al., 2010).
Lobster growth is also determined by density, food availability, extreme environment changes, and also depth. The lobster variant called southern rock lobster in Tasmania is proven to grow slowly in deep waters. Lobster species Jasus edwardsii reached 110 mm of as-ymptotic carapace length for its male and 105 cm for its female (Chandrapavan et al., 2010). From both exam-ples above, it seems that lobster growths generally are relatively slow.
Tropical lobster management is highly dependent on temperature indicator, food, and competition be-tween aquatic biota, so to sustain stock availability and mitigate overfishing, there needs to be a proper scor-ing of population indicator. Another important note on lobster management aside from population parameters, there are also thresholds of size, growth, and mortality, and also yield per recruitment potency to ensure sus-tainability.
Researches about variant availability, size structure of lobster population catches, growth rate, and yield per recruit capability need to be done, therefore relevant in-formation could be obtained and serves as stock sustain-
ability parameter. Next, protection of the fishing area is crucial in keeping mortality rate in check, because natu-rally occurring mortality is already high. Policies need-ed to ensure all things mentioned above are concerning the environment condition, population status, size, and intensity of external pressure to ensure the management of lobster aquaculture stays optimal in the future.
2. Material and Method
2.1 Research Time and LocationThe research was done at Bumbang Bay, Middle
Lombok in June 2017. The research location includes lobster larvae catching area at Bumbang Bay and also its fishermen as shown on the map below (Figure 1).
2.2 Data Collection ProcedureData are collected from all lobster catching and
collecting sites. Because of the lobster catching pro-hibition, data are collected from the stock obtained by fishermen’s lobster traps. All the variants and apparent sizes are observed to obtain needed data. Data obtained are total carapace length (mm), lobster weight (grams), aquatic environment conditions, and much other docu-mentation. No samples were sorting as the sample itself was limited.
2.3 Data AnalysisData obtained among the research sites are lobster
variants caught by fishermen, dimensional data such as length, and weight, catching area and sites, prices, and other interview data relevant to business system done by fishermen.
Analysis done within the research are length analy-sis to determine growth, length, and weight correlation, and lobster recruitment. Data analyses were done using a descriptive statistical approach; determining the mean and standard of deviation (Wallpole, 1993). Length-weight correlation analysis was done using a cubic law approach; W=aLb, where W is the fish mass in grams, L is the total length in mm, and a and b serve as constant acquired through regression.
Group distribution and determination are done us-ing separate normal distribution approach. The normal distribution obtained presents an age group. Steps taken were: 1) Acquired carapace length data were grouped into classes based on length to determine lobster dis-tribution frequency. 2) Frequency distribution data was analyzed with Battacharya’s method of size separation principle. 3) Next, the normal distribution count was analyzed to find the population structure (age class). Normal curve approach principle was determined by the following function: ln(Ni+1) - ln(Ni) = aj + bj·Li , where
JIPK. Volume 11 No 2. November 2019 / Lobster Population Parameter in Bumbang Bay, Central Lombok......
Copyright ©2019 Universitas Airlangga November 2019 42
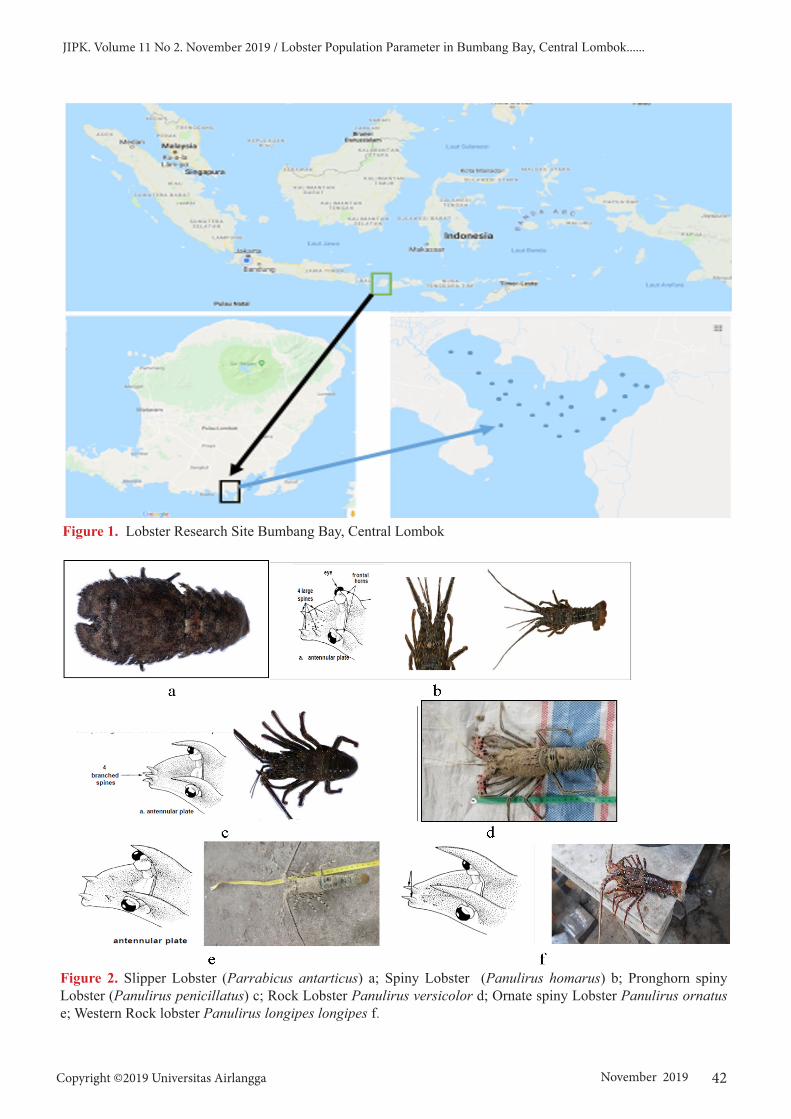
Figure 2. Slipper Lobster (Parrabicus antarticus) a; Spiny Lobster (Panulirus homarus) b; Pronghorn spiny Lobster (Panulirus penicillatus) c; Rock Lobster Panulirus versicolor d; Ornate spiny Lobster Panulirus ornatus e; Western Rock lobster Panulirus longipes longipes f.
Figure 1. Lobster Research Site Bumbang Bay, Central Lombok

43 Jurnal Ilmiah Perikanan dan Kelautan
Yonvitner et al. / JIPK, 11(2):40-50
Ni and Ni+1 are the same sequential components from lobster groups from the sample (e.g., member of j age group) and Li is the upper limit of the class Ni. From here, the mean of normal distribution is Lj=-aj/bj and the standard of deviation is (j) = (-∆L/bj)
1/2, where ∆L is a constant from the age group, then the index of sep-aration (SI) is calculated with SI=ALj/(-∆L). Growth analysis was done using Sheperd’s approach, which is: S = (sA
2 + sB2)½ , where SA and SB are goodness-of-fit
scores (Stz) acquired from Von Bartalanfy Growth Plot (VBGF) analysis of time (tz) from 0 to 0.25.
3. Results and Discussion
3.1 Lobster Variant at Bumbang Bay
There are 6 species of lobster variants at Bumbang Bay. Those caught lobsters were dominated by lobsters from Palinuridae family, Panulirus genus, which in-cludes 5 species, and one variant from the family Scylla-ridae and Parribacus genus. Local names of these lob-sters are fan lobster, sand lobster, bamboo lobster, stone lobster, batik lobster, and pearl lobster. The description of found variants is as follows.
3.2 Catch Composition
The composition is commonly related to adaptation and species conservation. Species with great adaptabili-ty, whether in exploitation zone or no-take zone (NTZ), usually shows high availability. From 6 recorded vari-ants, 312 lobsters were obtained. Catch composition consists of 44.5% sand lobster, 45.5% pearl lobster, and the other 4 variants. Both of these variants are the main catch in Bumbang Bay. Catch composition is shown as follows in Figure 3.
Figure 3. Lobster Catch Composition
Lobster population composition and amount serve as a population indicator in an ecosystem. Lobsters in no-take zones (NTZ) in a conservation area will be abundant (Buglass, 2018). However, an abundance of the population isn’t without risk, because it serves as prey to predators such as reef fishes and other carnivo-rous fish. A higher composition of one variant than the other may be caused by a different dominant fishing technique on certain variants (Driscoll et al., 2015). So the amount of population, other than because of fishing, must be observed simultaneously with other competing or associating species.
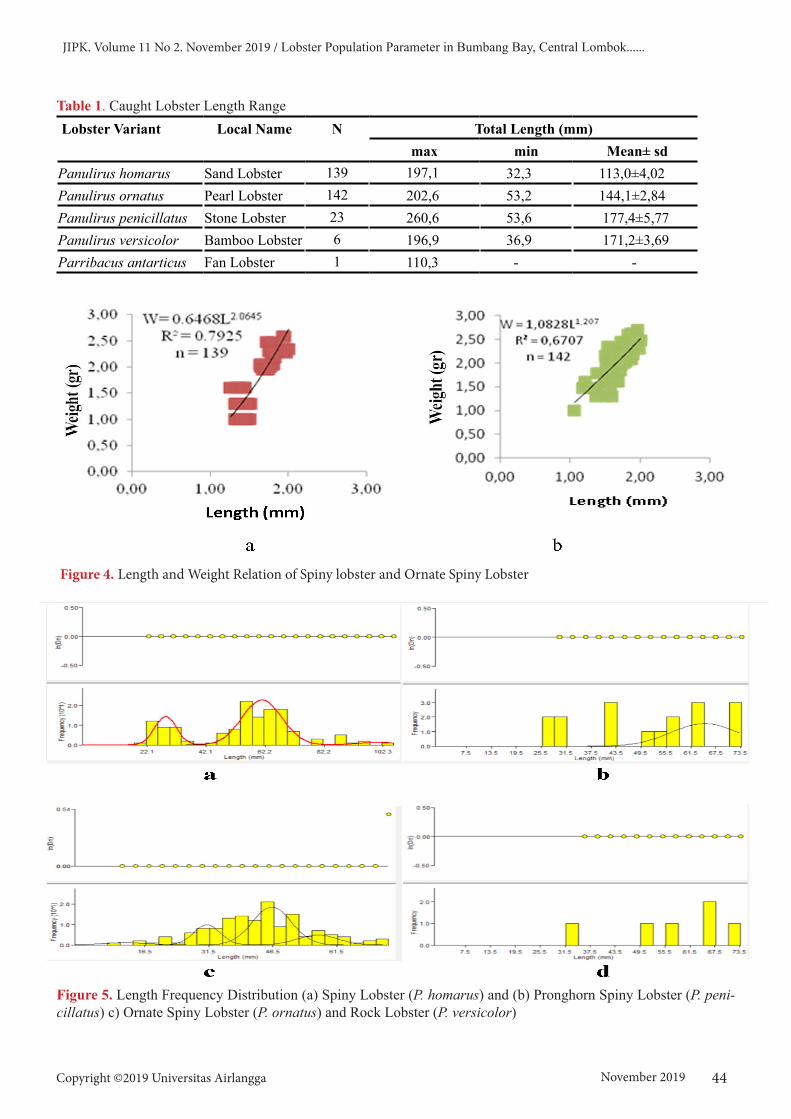
3.3 Weight-Length CorrelationAccording to the result of length and weight calcu-
lation, it was found that the growth pattern of sand lob-ster and pearl lobster caught in Bumbang Bay are nega-tive allometric, meaning that it grows in length quicker than it is in weight (Figure 4). Meanwhile, the analysis of the other variants was not performed.
T-test result came up as 95% true from value b to-wards value 3 for both lobsters, it was also acquired that > ttabel and shows negative allometric. Value b shows low value because of ecological and biological fac-tors (Manik, 2009). Ecological factors include weath-er, water quality, temperature, pH, salinity, geographic position, and sampling technique (Zargar et al., 2012; Jenning et al., 2001). Biological factor includes gonad development, feeding habit, growth phase, and gender (Froese, 2006; Tarkan et al., 2006).3.4 Size Structure
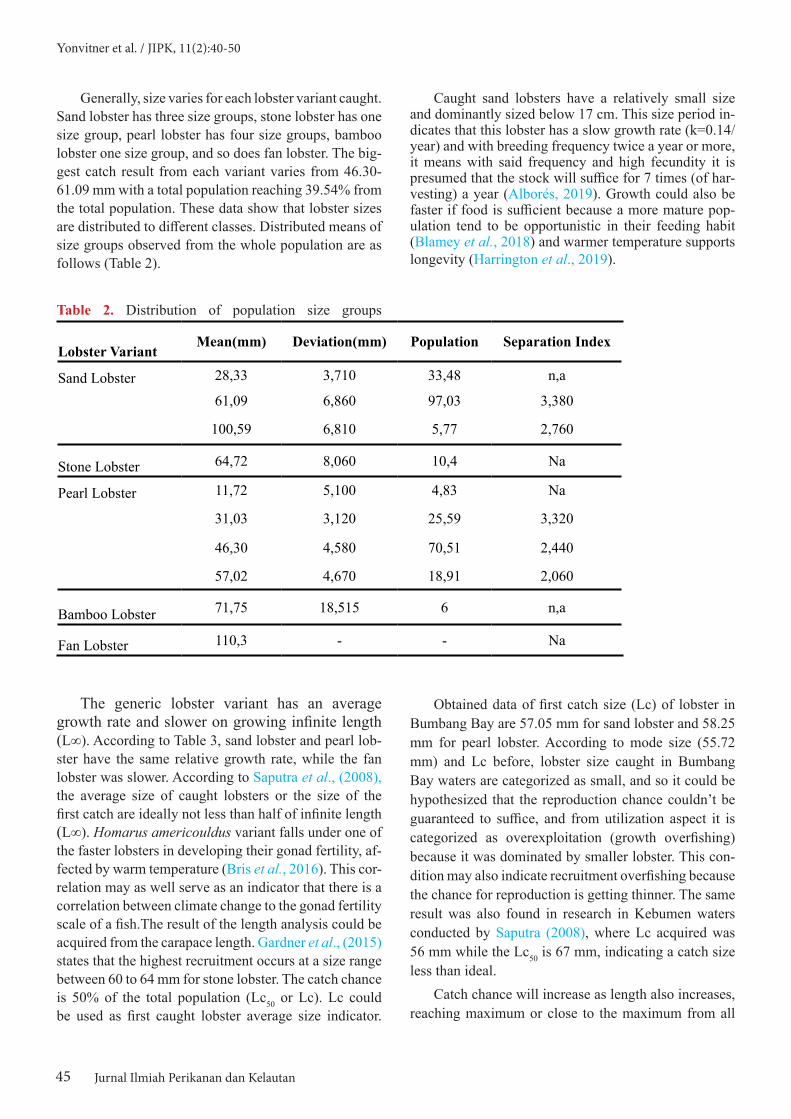
For the smallest sand lobster obtained was 18.22 mm (carapace length) and the longest was 101.88 mm (carapace length). Meanwhile, the smallest pearl lobster obtained was 11.55 mm (carapace length) and the lon-gest was 101.92 mm (carapace length). Lobsters from both variants were taken each day and the mode ob-tained for sand lobster was 55.72 mm (carapace length) with total caught 22 lobsters, and for pearl lobster mode 60.55 mm with total caught 38 lobsters.
From all lobsters recorded, the longest was P. peni-cilatus with 260.mm with mean 177.4 ± 5.77 mm. While variant with the shortest length (smallest) recorded was Parribacus antarcticus with 110.3 mm, other results are as follows (Table 1).
The length-frequency distribution of both lobsters is shown in Figure 5. According to Figure 5, it is known that length-frequency distribution for sand lobster rang-es from 18.22 mm – 101.88 mm, with the highest class interval frequency on interval 54.22 – 57.22 mm. Length frequency distribution of sand lobster ranges from 11.55 to 101.92 mm, with the highest class interval frequency on interval 56.55 – 64.55 mm. Length frequency distri-bution and group size distribution are shown in Figure 5.
JIPK. Volume 11 No 2. November 2019 / Lobster Population Parameter in Bumbang Bay, Central Lombok......
Copyright ©2019 Universitas Airlangga November 2019 44
Table 1. Caught Lobster Length Range Lobster Variant Local Name N Total Length (mm)
max min Mean± sdPanulirus homarus Sand Lobster 139 197,1 32,3 113,0±4,02Panulirus ornatus Pearl Lobster 142 202,6 53,2 144,1±2,84Panulirus penicillatus Stone Lobster 23 260,6 53,6 177,4±5,77Panulirus versicolor Bamboo Lobster 6 196,9 36,9 171,2±3,69Parribacus antarticus Fan Lobster 1 110,3 - -
Figure 5. Length Frequency Distribution (a) Spiny Lobster (P. homarus) and (b) Pronghorn Spiny Lobster (P. peni-cillatus) c) Ornate Spiny Lobster (P. ornatus) and Rock Lobster (P. versicolor)
Figure 4. Length and Weight Relation of Spiny lobster and Ornate Spiny Lobster
45 Jurnal Ilmiah Perikanan dan Kelautan
Yonvitner et al. / JIPK, 11(2):40-50
Generally, size varies for each lobster variant caught. Sand lobster has three size groups, stone lobster has one size group, pearl lobster has four size groups, bamboo lobster one size group, and so does fan lobster. The big-gest catch result from each variant varies from 46.30-61.09 mm with a total population reaching 39.54% from the total population. These data show that lobster sizes are distributed to different classes. Distributed means of size groups observed from the whole population are as follows (Table 2).
Table 2. Distribution of population size groups
Lobster VariantMean(mm) Deviation(mm) Population Separation Index
Sand Lobster 28,33 3,710 33,48 n,a
61,09 6,860 97,03 3,380
100,59 6,810 5,77 2,760
Stone Lobster 64,72 8,060 10,4 Na
Pearl Lobster 11,72 5,100 4,83 Na
31,03 3,120 25,59 3,320
46,30 4,580 70,51 2,440
57,02 4,670 18,91 2,060
Bamboo Lobster 71,75 18,515 6 n,a
Fan Lobster 110,3 - - Na
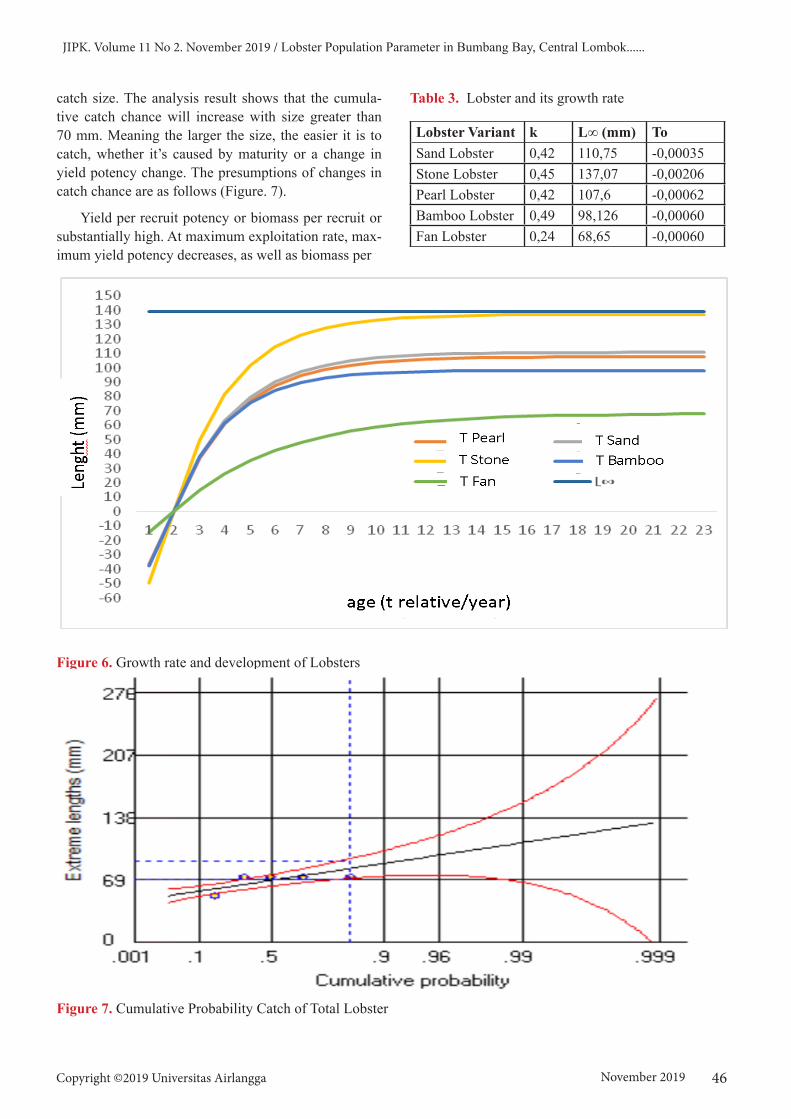
The generic lobster variant has an average growth rate and slower on growing infinite length (L∞). According to Table 3, sand lobster and pearl lob-ster have the same relative growth rate, while the fan lobster was slower. According to Saputra et al., (2008), the average size of caught lobsters or the size of the first catch are ideally not less than half of infinite length (L∞). Homarus americouldus variant falls under one of the faster lobsters in developing their gonad fertility, af-fected by warm temperature (Bris et al., 2016). This cor-relation may as well serve as an indicator that there is a correlation between climate change to the gonad fertility scale of a fish.The result of the length analysis could be acquired from the carapace length. Gardner et al., (2015) states that the highest recruitment occurs at a size range between 60 to 64 mm for stone lobster. The catch chance is 50% of the total population (Lc50 or Lc). Lc could be used as first caught lobster average size indicator.
Caught sand lobsters have a relatively small size and dominantly sized below 17 cm. This size period in-dicates that this lobster has a slow growth rate (k=0.14/year) and with breeding frequency twice a year or more, it means with said frequency and high fecundity it is presumed that the stock will suffice for 7 times (of har-vesting) a year (Alborés, 2019). Growth could also be faster if food is sufficient because a more mature pop-ulation tend to be opportunistic in their feeding habit (Blamey et al., 2018) and warmer temperature supports longevity (Harrington et al., 2019).
Obtained data of first catch size (Lc) of lobster in Bumbang Bay are 57.05 mm for sand lobster and 58.25 mm for pearl lobster. According to mode size (55.72 mm) and Lc before, lobster size caught in Bumbang Bay waters are categorized as small, and so it could be hypothesized that the reproduction chance couldn’t be guaranteed to suffice, and from utilization aspect it is categorized as overexploitation (growth overfishing) because it was dominated by smaller lobster. This con-dition may also indicate recruitment overfishing because the chance for reproduction is getting thinner. The same result was also found in research in Kebumen waters conducted by Saputra (2008), where Lc acquired was 56 mm while the Lc50 is 67 mm, indicating a catch size less than ideal.
Catch chance will increase as length also increases, reaching maximum or close to the maximum from all
JIPK. Volume 11 No 2. November 2019 / Lobster Population Parameter in Bumbang Bay, Central Lombok......
Copyright ©2019 Universitas Airlangga November 2019 46
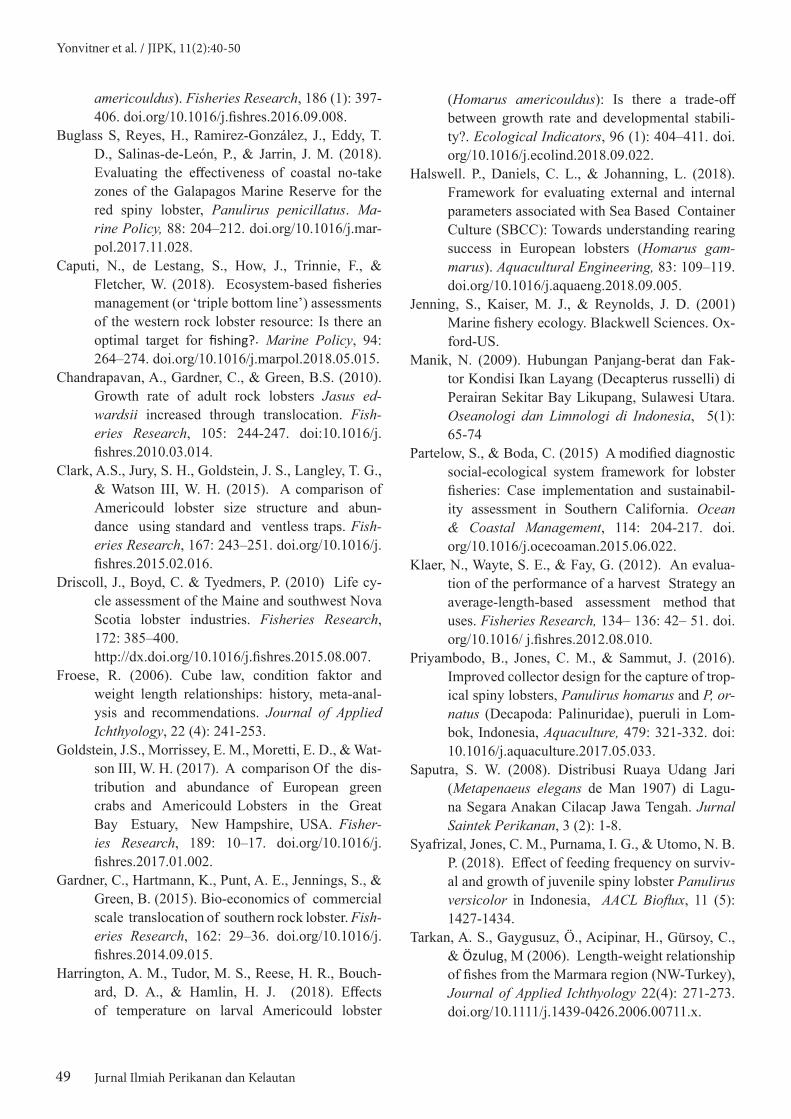
catch size. The analysis result shows that the cumula-tive catch chance will increase with size greater than 70 mm. Meaning the larger the size, the easier it is to catch, whether it’s caused by maturity or a change in yield potency change. The presumptions of changes in catch chance are as follows (Figure. 7).
Yield per recruit potency or biomass per recruit or substantially high. At maximum exploitation rate, max-imum yield potency decreases, as well as biomass per
Figure 6. Growth rate and development of Lobsters
Table 3. Lobster and its growth rate
Lobster Variant k L∞ (mm) ToSand Lobster 0,42 110,75 -0,00035Stone Lobster 0,45 137,07 -0,00206Pearl Lobster 0,42 107,6 -0,00062Bamboo Lobster 0,49 98,126 -0,00060Fan Lobster 0,24 68,65 -0,00060
Figure 7. Cumulative Probability Catch of Total Lobster

47 Jurnal Ilmiah Perikanan dan Kelautan
Yonvitner et al. / JIPK, 11(2):40-50
recruit. From Figure 8, it is shown that with an estimat-ed ratio of catch size against infinity length reaching 109.12 mm, the ratio of yield per recruit is less than 50% as well as biomass per recruit. It could be seen that there is a vulnerable phase of a lobster, if there were no fishing, the population will still decline as naturally occurring mortality still persists. The translocation pro-cess of catch size is necessary to improve the quality of catch size. Lobster fishing in actual conditions that result in a smaller size than the length infinity (L∞) is defined as overfishing, so are mature gonad size that is larger than the average catch size. The high frequency of juve-niles caught may incur three things, 1) high population of juveniles in the water, 2) Indiscriminate fishing tool (as in small mesh size, etc.), and 3) declining population of mature fish. Optimal management design would be the development of aquaculture and nursery, manage-ment and regulation of fishing tool size to catch juvenile fishes.
The amount and size of a new population in the wa-ters are related to the ability in recruiting stock. Biomass recruit and catch stock potential are crucial as a base in determining catch allocation to keep lobster exploita-tion as sustainable (Caputi et al., 2018). The recruitment process shows larvae and juvenile attachment to the sur-face pattern to be relevant with catch size as the behav-ior of the population tends to group up in early days (Priyambodo et al., 2016).
The available stock should be utilized when it’s still in its juvenile state to be prepared for when it’s a mature stock. Because it will undergo an increase in mortality rate caused by predation, competition, or natural mor-tality.
Average lobster size caught in Walis Sand State Beach, Rye, with standard fishing equipment is 61.98±0.61 mm. Fishing without a separation pouch on the equipment yields an average of 62.38±0.12 mm and the average size of lobster caught with scuba gear is 48.06±0.90 mm measured from its carapace (Clark et al., 2015). The amount of catch is highly dependent on lobster density (Clark et al., 2015). Goldstein et al., (2017) found that the lobster distribution in Great Bay Estuary is higher than areas further from the estuary, al-though there is an abundance of another Crustacea such as crabs in the estuary.
The average size of lobster is used as an indicator in developing harvest strategy (Klaer et al., 2012). In many practices of lobster processing, it is known that the complexity and connectivity between social systems and lobster habitat as an ecological system are insepara-ble (Partelow and Boda, 2015).
Lobsters in conservation sites tend to be different than the ones outside conservation sites, in regards to its mortality rate. Panulirus elephas has a mortality rate of 0.41 per year in situ and 0.78 ex-situ, including natural causes and catching (Bevacqua et al., 2010). Other than
Figure 8. Biomass per recruit relative potency. It shows a certain phase relevant to the current catch result.

JIPK. Volume 11 No 2. November 2019 / Lobster Population Parameter in Bumbang Bay, Central Lombok......
Copyright ©2019 Universitas Airlangga November 2019 48
that, the adaptability to current speed and oxygen are also relevant (Halswell et al., 2018).
The adaptive management strategy of the lobster population from the determined Total Allowable Catch (TAC) is to consider growth speed and biomass accu-mulating ability as a basis to determine TAC (Buglass et al., 2018). To ensure an increase in lobster biomass, it is necessary to monitor the catch closing program effectiv-ity. According to Montez et al., (2012) in West Austra-lia, the closed area does not guarantee an abundance, as natural predator persists and may also increase.
Jesus edwardsii lobster shows faster growth in shal-low water than in deep water. Not only water movement and oxygen availability, food availability also caused a high amount of lobster larvae Bumbang Bay (Chan-drapavan et al., 2010).
There exist five dominant lobster variants caught in Bumbang waters by fishermen, or in total there is 71% of the main variant found in Bumbang, meaning it classifies as the prime commodity in Bumbang and Lombok. Caught lobsters are usually juvenile lobsters with a length of no more than 10 cm and weigh less than 250 grams. Meanwhile, mature lobsters caught with size above Lc are 6-7% of all population (of caught lob-sters). This means the juvenile lobster population dom-inates. Lobster has a slow growth rate, high fecundity, and maximum breeding frequency estimate every ma-ture lobster is twice a year. Therefore, there needs to be a great timing in lobster utilization, With high exploita-tion rate (0.6 per year), rapidly decreasing yield per re-cruit level, as well as biomass per recruit.
4. ConclusionThe higher the ratios of lobster catch size against the
maximum allowed catch length, the higher the exploita-tion rate and lower the recruitment potency. Meaning there needs to be a utilization scenario on a certain time so that the lobster stock could be utilized in other ven-tures. The fishing activity should pay attention to criti-cal phrases and the population of juvenile lobsters. To further increase the benefit, lobster seed utilization for aquaculture should be taken into account. There needs to be monitoring towards various competitor biota and predators, especially in larvae or juvenile stadiums of the lobster population.
Acknowledgment
On this occasion, the author would like to express gratitude to the research and technology ministry and
the university for the financial support given through the scheme MP3EI, and also to all members supporting this research.
Author’s Contributions
All authors discussed the results and contribut-ed to from the start to final manuscript; Yon: Conduct research on population and export population biology teams, Zul: The research team coordinator and coordi-nate the team and are responsible for the social ecology system material, Su: As a research team for the fishing gear / lobster, Ben: As a lobster economic valuation re-search team, Fran: Survey Team that carries out field data collection, Sef: Survey Team that carries out field data collection, Rif: Survey Team that carries out field data collection
Conflict of Interest
The authors declare that they have no competing interests
Funding Information
This research is part of the MP3EI research pro-gram of the Ministry of Technology Research and Higher Education with No Contract No: 011 / SP2H / LT / DRPM / VIII / 2017.
References
Alborés, I., Soler, C. G., & Fernandes, L. (2019). Repro-ductive biology of the slipper lobster Scyllarus arctus in Galicia (NW Spain): Implications for fisheries management. Fisheries Research, 212 : 1–11. doi.org/10.1016/j.fishres.2018.12.001.
Bevacqua, D., Melià, P., Follesa, M. C., De Leo, G. A., Gatto, M., & Cau, A. (2010). Body growth and mortality of the spiny lobster Palinurus ele-phas within and outside a small marine protect-ed area. Fisheries Research, 106 (3): 543–549. doi:10.1016/j.fishres.2010.10.008.
Blamey, L. K., de Lecea, A. M., Jones, L. D.S., & Branch, G. M. (2018) Diet of the Spiny Lobster Jasus paulensis from the Tristan da Cunha Archipelagi: Comparison between Island, Depth and Lobster Sizes. Estuarine, Coastal and Shelf Science, 219: 262-272. doi.org/10.1016/j.ecss.2019.02.021.
Bris, A. L., Pershing, A. J., Gaudette, J., Pugh, T. L., & Reardon, K. M. (2016). Multi-scale quantifi-cation of the-effects of temperature on size at maturity in the Americould lobster (Homarus
49 Jurnal Ilmiah Perikanan dan Kelautan
Yonvitner et al. / JIPK, 11(2):40-50
americouldus). Fisheries Research, 186 (1): 397-406. doi.org/10.1016/j.fishres.2016.09.008.
Buglass S, Reyes, H., Ramirez-González, J., Eddy, T. D., Salinas-de-León, P., & Jarrin, J. M. (2018). Evaluating the effectiveness of coastal no-take zones of the Galapagos Marine Reserve for the red spiny lobster, Panulirus penicillatus. Ma-rine Policy, 88: 204–212. doi.org/10.1016/j.mar-pol.2017.11.028.
Caputi, N., de Lestang, S., How, J., Trinnie, F., & Fletcher, W. (2018). Ecosystem-based fisheries management (or ‘triple bottom line’) assessments of the western rock lobster resource: Is there an optimal target for fishing?. Marine Policy, 94: 264–274. doi.org/10.1016/j.marpol.2018.05.015.
Chandrapavan, A., Gardner, C., & Green, B.S. (2010). Growth rate of adult rock lobsters Jasus ed-wardsii increased through translocation. Fish-eries Research, 105: 244-247. doi:10.1016/j.fishres.2010.03.014.
Clark, A.S., Jury, S. H., Goldstein, J. S., Langley, T. G., & Watson III, W. H. (2015). A comparison of Americould lobster size structure and abun-dance using standard and ventless traps. Fish-eries Research, 167: 243–251. doi.org/10.1016/j.fishres.2015.02.016.
Driscoll, J., Boyd, C. & Tyedmers, P. (2010) Life cy-cle assessment of the Maine and southwest Nova Scotia lobster industries. Fisheries Research, 172: 385–400.
http://dx.doi.org/10.1016/j.fishres.2015.08.007.Froese, R. (2006). Cube law, condition faktor and
weight length relationships: history, meta-anal-ysis and recommendations. Journal of Applied Ichthyology, 22 (4): 241-253.
Goldstein, J.S., Morrissey, E. M., Moretti, E. D., & Wat-son III, W. H. (2017). A comparison Of the dis-tribution and abundance of European green crabs and Americould Lobsters in the Great Bay Estuary, New Hampshire, USA. Fisher-ies Research, 189: 10–17. doi.org/10.1016/j.fishres.2017.01.002.
Gardner, C., Hartmann, K., Punt, A. E., Jennings, S., & Green, B. (2015). Bio-economics of commercial scale translocation of southern rock lobster. Fish-eries Research, 162: 29–36. doi.org/10.1016/j.fishres.2014.09.015.
Harrington, A. M., Tudor, M. S., Reese, H. R., Bouch-ard, D. A., & Hamlin, H. J. (2018). Effects of temperature on larval Americould lobster
(Homarus americouldus): Is there a trade-off between growth rate and developmental stabili-ty?. Ecological Indicators, 96 (1): 404–411. doi.org/10.1016/j.ecolind.2018.09.022.
Halswell. P., Daniels, C. L., & Johanning, L. (2018). Framework for evaluating external and internal parameters associated with Sea Based Container Culture (SBCC): Towards understanding rearing success in European lobsters (Homarus gam-marus). Aquacultural Engineering, 83: 109–119. doi.org/10.1016/j.aquaeng.2018.09.005.
Jenning, S., Kaiser, M. J., & Reynolds, J. D. (2001) Marine fishery ecology. Blackwell Sciences. Ox-ford-US.
Manik, N. (2009). Hubungan Panjang-berat dan Fak-tor Kondisi Ikan Layang (Decapterus russelli) di Perairan Sekitar Bay Likupang, Sulawesi Utara. Oseanologi dan Limnologi di Indonesia, 5(1): 65-74
Partelow, S., & Boda, C. (2015) A modified diagnostic social-ecological system framework for lobster fisheries: Case implementation and sustainabil-ity assessment in Southern California. Ocean & Coastal Management, 114: 204-217. doi.org/10.1016/j.ocecoaman.2015.06.022.
Klaer, N., Wayte, S. E., & Fay, G. (2012). An evalua-tion of the performance of a harvest Strategy an average-length-based assessment method that uses. Fisheries Research, 134– 136: 42– 51. doi.org/10.1016/ j.fishres.2012.08.010.
Priyambodo, B., Jones, C. M., & Sammut, J. (2016). Improved collector design for the capture of trop-ical spiny lobsters, Panulirus homarus and P, or-natus (Decapoda: Palinuridae), pueruli in Lom-bok, Indonesia, Aquaculture, 479: 321-332. doi: 10.1016/j.aquaculture.2017.05.033.
Saputra, S. W. (2008). Distribusi Ruaya Udang Jari (Metapenaeus elegans de Man 1907) di Lagu-na Segara Anakan Cilacap Jawa Tengah. Jurnal Saintek Perikanan, 3 (2): 1-8.
Syafrizal, Jones, C. M., Purnama, I. G., & Utomo, N. B. P. (2018). Effect of feeding frequency on surviv-al and growth of juvenile spiny lobster Panulirus versicolor in Indonesia, AACL Bioflux, 11 (5): 1427-1434.
Tarkan, A. S., Gaygusuz, Ö., Acipinar, H., Gürsoy, C., & Özulug, M (2006). Length-weight relationship of fishes from the Marmara region (NW-Turkey), Journal of Applied Ichthyology 22(4): 271-273. doi.org/10.1111/j.1439-0426.2006.00711.x.
JIPK. Volume 11 No 2. November 2019 / Lobster Population Parameter in Bumbang Bay, Central Lombok......
Copyright ©2019 Universitas Airlangga November 2019 50
Walpole, R. E. (1993). Pengantar Statistika. Jakarta: PT Gramedia Pustaka Utama.
Zargar, U. R., Yousuf, A. R., Mushtaq, B. & Jan, D. (2012). Length–Weight Relationship of the Cru-cian carp, Carassius carassius in Relation to Wa-ter Quality, Sex and Season in Some Lentic Water Bodies of Kashmir Himalayas. Turkish Journal of Fisheries and Aquatic Sciences, 12: 685-691.
![Husserl Studies Volume 8 Issue 2 1991 [Doi 10.1007%2Fbf00123540] Barry Smith -- Husserl Bibliography](https://img.dokumen.tips/doc/110x75/577cd07e1a28ab9e789267ab/husserl-studies-volume-8-issue-2-1991-doi-1010072fbf00123540-barry-smith.jpg)


![INTERNATIONAL JOURNAL OF ENERGY DOI: … · Athens, Greece. A SORC model for reverse osmosis desalination was designed [4] ... DOI: 10.46300/91010.2020.14.1 Volume 14, 2020 ISSN:](https://img.dokumen.tips/doc/110x75/5f3a65bab4abb422e102aca8/international-journal-of-energy-doi-athens-greece-a-sorc-model-for-reverse-osmosis.jpg)
![Phronesis Volume 19 Issue 1 1974 [Doi 10.2307%2F4181923] Gary Young -- Socrates and Obedience](https://img.dokumen.tips/doc/110x75/55cf8ff9550346703ba1dfc2/phronesis-volume-19-issue-1-1974-doi-1023072f4181923-gary-young-socrates.jpg)


![Cahiers hjhde Sociologie Volume 1 Issue 1946 [Doi 10.2307_40688775] MIKEL DUFRENNE -- Existentialisme Et Sociologie](https://img.dokumen.tips/doc/110x75/577c849e1a28abe054b9aa57/cahiers-hjhde-sociologie-volume-1-issue-1946-doi-10230740688775-mikel-dufrenne.jpg)
![Chemical Society Reviews Volume 42 Issue 7 [Doi 10.1039%2FC2CS35289C]](https://img.dokumen.tips/doc/110x75/577c85f11a28abe054bf2825/chemical-society-reviews-volume-42-issue-7-doi-1010392fc2cs35289c.jpg)


![Phronesis Volume 10 Issue 2 1965 [Doi 10.2307%2F4181767] G. Ryle -- The Timaeus Locrus](https://img.dokumen.tips/doc/110x75/55cf9002550346703ba251a2/phronesis-volume-10-issue-2-1965-doi-1023072f4181767-g-ryle-the-timaeus.jpg)


![Nano Letters Volume Issue [Doi 10.2514%2F6.1997-3137] --](https://img.dokumen.tips/doc/110x75/577cc4ba1a28aba7119a3dcc/nano-letters-volume-issue-doi-1025142f61997-3137-.jpg)


![Volume issue [doi 10.1016_j.apt.2013.08.002] --](https://img.dokumen.tips/doc/110x75/55725c23497959da6be8a7ce/volume-issue-doi-101016japt201308002-.jpg)