Embed Size (px)
Citation preview

JICA-EPU 60 YEARS & BEYOND: THE WAY FORWARD
“CAPACITY BUILDING FOR ECONOMIC TRANSFORMATION”
18 MAY 2017 (THURSDAY)
MRS YUSLINDAL YAAKUB DEPUTY DIRECTOR OF HUMAN CAPITAL DEVELOPMENT SECTION
ECONOMIC PLANNING UNIT, PRIME MINISTER’S DEPARTMENT

Experience and Specialisation
Institution
10 years of experience in the public sector focusing on providing consultation regarding human resource management and organisational development to the government agencies below:
• Department of Occupational Safety and Health (DOSH), Ministry of Human Resources
• Public Higher Learning Institutions • Ministry of Women, Family and Community Development
Economic Planning Unit: - Deputy Director of Human Capital
Development Section (2016 – current)
Public Service Department: - Principal Assistant Director of
Organisational Development Section (2011-2014)
Yuslindal binti Yaakub Deputy Director Human Capital Development Section Economic Planning Unit Prime Minister's Department
Tel: 03-8872 5315 Email: [email protected]
Education
Bachelor of Economics (Industrial Economics) National University of Malaysia, 1999
Master of Economics (Human Resource Economics) National University of Malaysia, 2016
Ministry of Human Resources: - Principal Assistant Director of Human
Resource Management Section, Department of Occupational Safety and Health (2001-2010)

MALAYSIA’S CURRENT ECONOMIC CONDITIONS AND
CHALLENGES

THE MALAYSIA ECONOMIC PERFORMANCE
Note: Based on GDP (2010 = base year)

ECONOMIC FUNDAMENTAL: DIVERSE ECONOMIC STRUCTURE
Note: Based on GDP (2010 = base year)
1997 1998 2008 2009 2014 2015e 2016p
Services 41.4 43.6 48.8 50.9 53.5 53.5 53.7
Manufacturing 24.1 22.2 24.3 22.5 23.0 23.0 23.0
Agriculture 12.0 12.5 10.4 10.6 9.2 8.8 8.5
Mining 14.9 16.0 12.5 11.8 9.0 8.9 8.9
Construction 5.5 4.5 3.1 3.3 4.3 4.4 4.5
GDP 100.0 100.0 100.0 100.0 100.0 100.0 100.0
Economic structure, 1997-2015 (% to GDP)
Note: e estimation; p projection
'97 '98 '08 '09 '14 '15 '16
Services Manufacturing Agriculture Mining Construction
Economic structure, 1997-2016 (RM bn)
488
776
1,013 1,063
452
764
1,106
a u

UNCERTAIN GLOBAL MARKET : DOMESTIC CONSUMPTION DRIVEN
Source: Malaysia Economic Monitor December 2016 – The Quest for Productivity Growth

DEVELOPMENT EXPENDITURE FOCUSING ON ECONOMIC AND SOCIAL SECTOR
RMKe-1
'66-'70
RMKe-3
'76-'80
RMKe-4
'81-'85
RMKe-5
'86-'90
RMKe-6
'91-'95
RMKe-7
'96-'00
RMKe-2
'71-'75
63.3
26.3
3.3
17.6
16.1
17.7
7.8
3.5
4.6
15.7
12.5
3.2
3.2
100.0
4.2
50.6
18.3
14.6
14.4
2.9
13.1
7.1
1.9
1.7
10.4
7.8
2.6
1.5
100.0
9.8
54.4
18.7
13.0
16.0
6.3
14.6
6.2
1.2
5.2
14.2
10.7
3.4
1.9
100.0
24.9
60.5
16.3
13.6
20.2
9.9
21.5
10.1
1.6
8.5
16.2
12.6
3.5
1.8
100.0
46.3
64.8
20.8
11.3
21.5
10.2
24.8
16.1
2.6
4.1
7.2
4.2
2.9
3.2
100.0
35.3
50.6
11.6
7.4
22.5
7.8
24.8
13.4
4.4
3.3
20.1
16.9
3.2
4.5
100.0
54.7
47.6
8.2
11.4
21.0
5.5
31.6
19.9
3.8
3.4
11.8
9.6
2.2
9.0
100.0
99.0
DE budget (% to total)
RMKe-8
'01-'05
38.5
4.6
6.0
19.0
7.5
40.8
25.7
5.6
4.1
13.0
10.2
2.8
7.7
100.0
170.0
RMKe-9
‘06-’10
51.5
5.8
9.0
20.7
10.6
30.7
17.8
3.9
3.9
12.7
9.3
3.4
5.1
100.0
230.0
60.8
5.5
21.3
23.7
10.3
26.8
20.3
4.0
2.6
9.3
7.7
1.6
3.2
100.0
230.0
Economy
Agriculture
Industrialisation
Infrastructure
Utility
Social
Education
Health
Housing
Security
Defence
Internal security
Administration
TOTAL
RM bilion
RMKe-10
‘11-’15
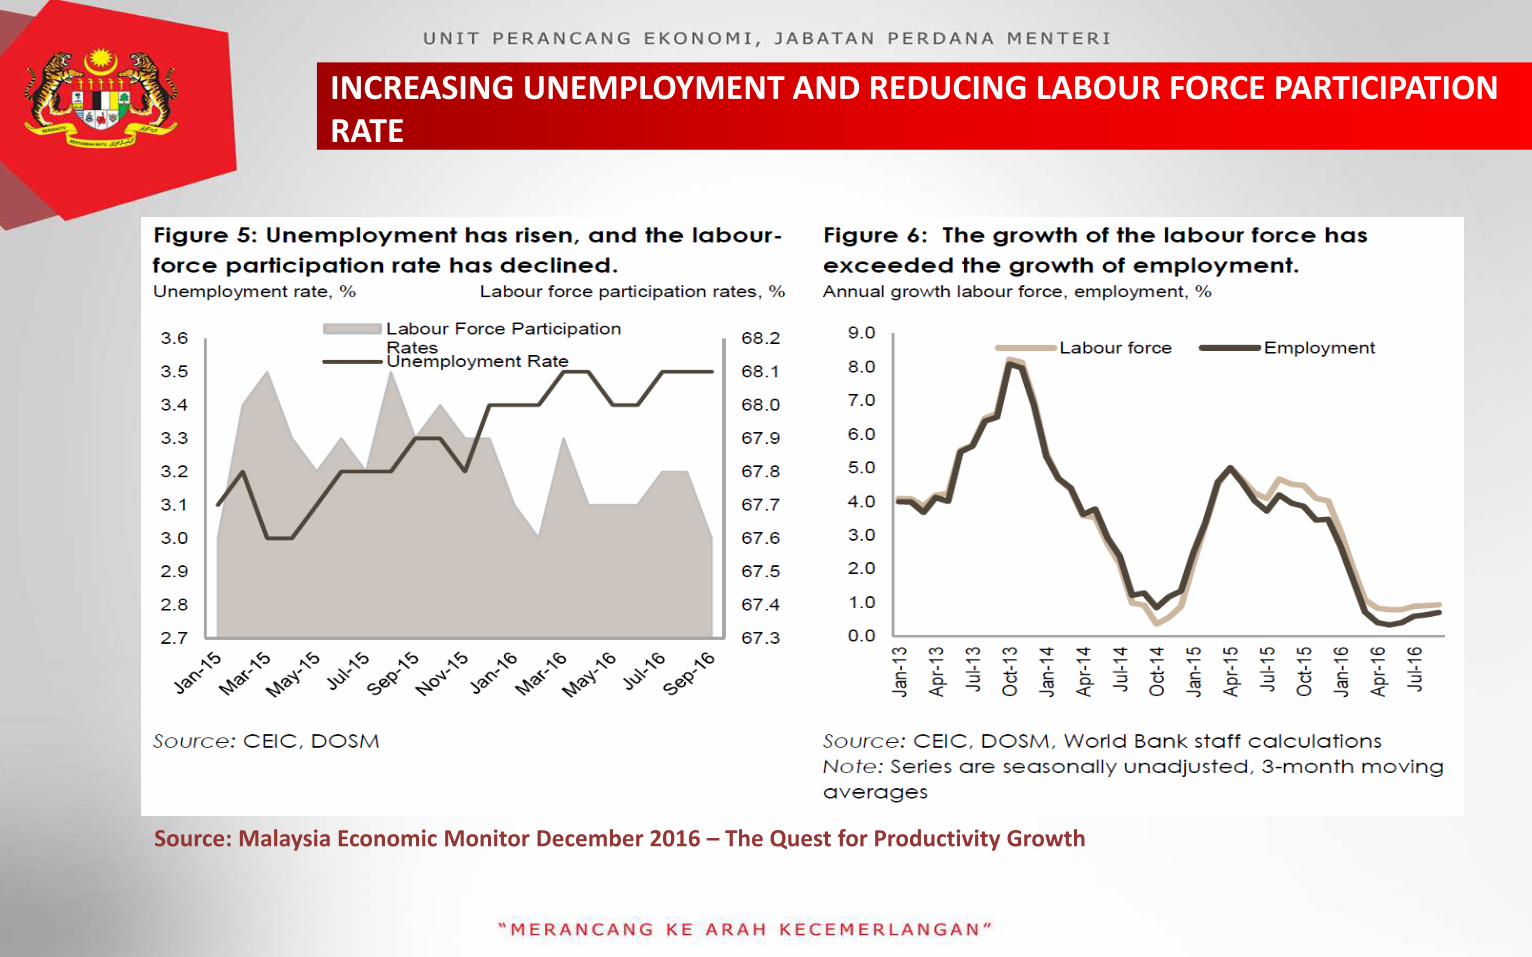
INCREASING UNEMPLOYMENT AND REDUCING LABOUR FORCE PARTICIPATION RATE
Source: Malaysia Economic Monitor December 2016 – The Quest for Productivity Growth

MALAYSIA’S DIRECTION
1. NEW ECONOMIC MODEL
2. ELEVENTH MALAYSIA PLAN, 2016-2020
3. SUSTAINABLE DEVELOPMENT GOALS
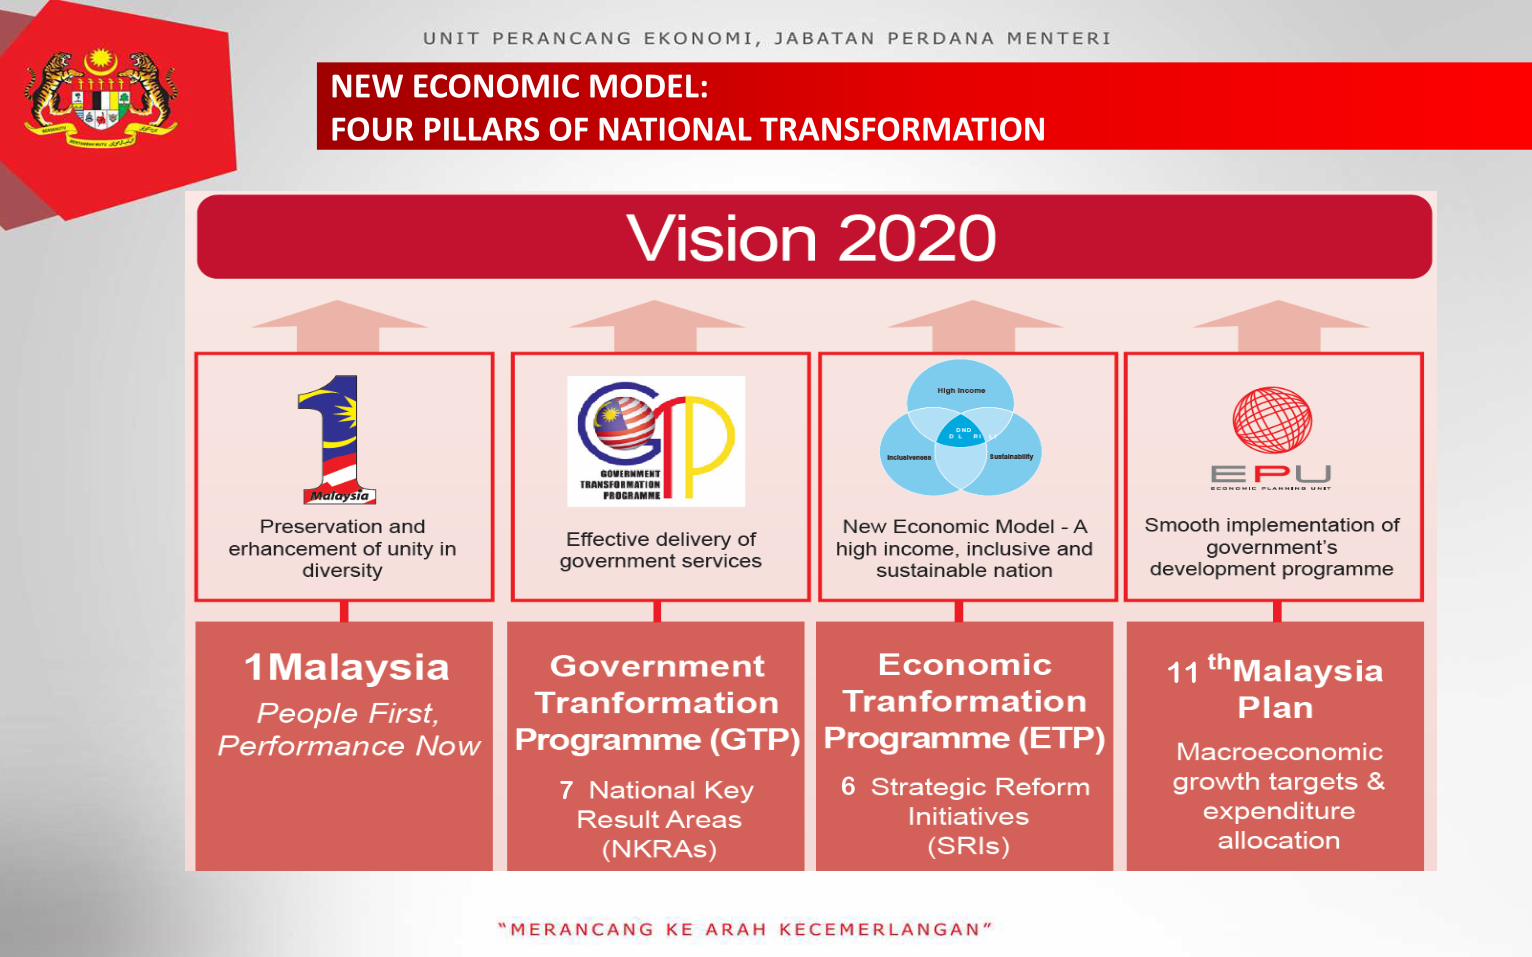
NEW ECONOMIC MODEL: FOUR PILLARS OF NATIONAL TRANSFORMATION
11
7 6

NEW ECONOMIC MODEL: ELEVENTH MALAYSIA PLAN, 2016-2020
1 2 3
4 5
Enhancing
inclusiveness towards an equitable society
Improving
wellbeing
for all
Accelerating
human capital development for an advanced nation
Pursuing
green growth for sustainability and
resilience
Strengthening
infrastructure to support economic expansion
Re-engineering
growth for greater prosperity
6 S
trat
egi
c Th
rust
s
Uplifting B40 households towards a middle-class society
Enabling industry-led Technical and Vocational Education and Training (TVET)
Embarking on green growth
Unlocking the potential of productivity
Innovation ecosystem
Building cities for global competitiveness
6 G
ame
Ch
ange
rs
6

ACCELERATING HUMAN CAPITAL DEVELOPMENT FOR AN ADVANCED NATION
Transforming TVET to meet industry demand
Strengthening the governance of TVET for better management
Enhancing quality and delivery of TVET programmes to improve graduate employability
Rebranding TVET to increase its attractiveness
Strengthening lifelong learning for skills enhancement
Improving effectiveness of programmes to meet learning needs
Improving regulatory and funding support to broaden access
Improving the quality of education for better student outcomes and institutional excellence
Enhancing access and quality to improve student outcomes
Enhancing governance and stakeholder partnerships for better school support
Raising the quality of graduates and programmes, and strengthening research for innovation
Strengthening IHE governance and financial sustainability towards institutional excellence
Improving labour market efficiency to accelerate
economic growth
Improving labour productivity and wages through the shift to high skilled jobs
Enhancing labour market operations to maximize efficiency and effectiveness
Improving management of foreign workers

UN’S SUSTAINABLE DEVELOPMENT GOALS
17 Goals
169 Targets
241 Indicators

ENSURING UNITY AND ECONOMIC GROWTH, INCLUSIVE PRUDENT SPENDING, WELL-BEING OF THE RAKYAT
• Increase rakyat’s income • Improve human capital • Empowering early childhood and preschool education • Enhance TVET programmes • Improve primary and secondary education • Empowering higher education • Strengthen women development and family wellbeing • Strengthen entrepreneurship • Empowering economy of Bumiputera • Improve healthcare • Help Chinese and Indian community • Increase home ownership • Improve social safety net • Enhance lifestyle tax relief • Provide some subsidies and incentives • Provide 1Malaysia People’s Aid (BR1M) • Appreciate the role of religious men and KEMAS • Improve welfare of Orang Asli • Provide incentives for taxi drivers • Appreciate civil servants
Capital Economy Initiatives 1
• Stimulate private investment • Invigorate capital market • Build and upgrade infrastructure project • Increase export • Accelerate tourism sector • Enhance sports development • Boost digital economy • Strengthen security and public order • Upgrade public transport • Increase food production with competitive prices • Reduce corporate tax • Amendment to Bankruptcy Act 1967 • National Blue Ocean Strategy (NBOS) initiatives • Strengthen fiscal sustainability
Revenue : RM219.7 bn
Operating Expenditure (RM214.8 bn) Development Expenditure (RM46.0 bn)
Economic, 56.2%
Economic, (RM25.9
bn; 56.2%) Security (RM5.3 bn;
11.5%)
Social (RM12.2 bn;
26.5% of total)
Supplies and Services (RM32.0 bn; 14.9%)
Human Economy Initiatives
Direct tax (RM120.7 bn; 55.0%)
2
Indirect tax (RM59.8 bn;
27.2%)
Note: GST in 2017 = RM40 bn (18.2%)
Non-tax revenue (RM39.2 bn;
17.8% of total)
Grants and fixed
Charges (RM103.9 bn;
48.4%)
Emoluments (RM77.4 bn; 36%)
Others (RM1.5 bn; 0.7% of total)
General Administration (RM2.7 bn; 5.8%)
MALAYSIA’S CAPACITY BUILDING: OVERCOMING KNOWLEDGE
GAPS AND SKILL MISMATCH

STRUCTURE OF MALAYSIA’S LABOUR FORCE, 2016
Working Age Population
(‘000)
20,335.4
Outside Labour Force
6,700.8
Unemployment rate
3.1%
Labour force participation rate
(LFPR)
67.0%
Labour Force
13,634.6
Employed
13,210.0
Unemployed
424.6
Source: Labour Force Survey Report 2016, Department of Statistics, Malaysia
21,655.4
14,667.8
6,987.6
14,163.7
504.1 3.4%
67.7% 80.2% 54.3%
9,012.1 5,655.7
8,729.7 5,434.0
3.1% 3.9% 282.4 221.7
2,229.7 4,757.9
11,241.8 10,413.6

PROFILE OF CURRENT LABOUR FORCE (2016)
Younger LF
14,667.8
Labour Force 2016
(‘000 person)
Male dominated
Urban centric
Middle level education
Concentration
Areas to improve
17.8% 34.1% 23.0% 17.2% 7.8%
15-24 25-34 35-44 45-54 55-64
61.4% 38.6%
Male Female
76.7% 23.3%
Urban Rural
27.7% 55.2% 14.4% 2.6%
Tertiary Secondary Primary No formal edu
22.1% 5.5% 38.4% 13.5% 12.3% 8.2%
UPSR PMR SPM Degree + dip
STPM + cert No Cert + others

EMPLOYMENT BY MAJOR SECTORS, 2010 – 2050 ('000 PERSONS)
Annual Growth
INDUSTRY 2010 2015 2020 2025 2030 2050 2011 - 2015
2016 -
2020
2021-
2030 2031 -2050
Agriculture, Forestry, Livestock &
Fishing 1,604.0 1,615.9 1,610.2 1,607.1 1,600.0 1,533.5 0.15 -0.07 -0.06 -0.21
Mining & Quarrying 82.5 81.7 82.7 83.7 84.5 87.3 -0.19 0.24 0.22 0.16
Manufacturing 2,038.6 2,462.5 2,772.7 3,013.5 3,229.7 3,987.3 3.85 2.40 1.54 1.06
Construction 1,141.7 1,221.0 1,261.3 1,295.7 1,329.9 1,439.9 1.35 0.65 0.53 0.40
Services Sector 7,091.7 8,401.6 9,576.1 10,302.6 11,014.5 13,557.6 3.45 2.65 1.41 1.04
Electricity, Gas & Water 111.5 120.0 126.3 132.6 139.1 167.4 1.48 1.02 0.97 0.93
Transport, Storage & Communications 760.0 960.0 1,131.1 1,283.2 1,429.0 1,939.6 4.79 3.33 2.37 1.54
Wholesale & Retail Trade, Hotels &
Restaurants 2,487.5 3,134.9 3,704.5 4,040.2 4,394.7 5,690.1 4.74 3.40 1.72 1.30
Finance, Insurance, Real Estate &
Business Services 935.3 1,092.1 1,163.8 1,204.9 1,242.8 1,372.6 3.15 1.28 0.66 0.50
Government Services 1,307.8 1,426.1 1,519.5 1,622.5 1,723.7 2,070.4 1.75 1.28 1.27 0.92
Other Services 1,489.6 1,668.4 1,930.8 2,019.2 2,085.2 2,317.5 2.29 2.96 0.77 0.53
TOTAL 11,958.5 13,782.6 15,302.9 16,302.6 17,258.5 20,605.6 2.88 2.11 1.21 0.89
Labour Force ('000 persons) 12,361.3 14,229.1 15,815.2 16,827.5 17,811.7 21,224.7
Unemployed ('000 persons) 402.8 446.5 512.3 524.9 553.1 619.2
Unemployment rate (%) 3.3 3.1 3.2 3.1 3.1 2.9

NEW ECONOMIC MODEL: NATIONAL KEY ECONOMIC AREAS
Occupation 2010 2015 2020 2025 2030 2050 Annual Growth
000' % 000' % 000' % 000' % 000' % 000' % 2011-2015
2016-2020
2021-2025
2021-2050
Legislators, Senior Officials & Managers 860.95 7.20 799.39 5.80 984.76 6.44 1,076.21 6.60 1,168.77 6.77 1,545.42 7.50 -1.47 4.26 1.79 1.51
Professionals 741.06 6.20 1,502.30 10.90 2,110.68 13.79 2,328.29 14.28 2,552.22 14.79 3,502.95 17.00 15.18 7.04 1.98 1.70
Technicians & Associate Professionals 1,704.21 14.25 1,557.43 11.30 2,260.04 14.77 2,542.92 15.60 2,843.26 16.47 4,224.14 20.50 -1.79 7.73 2.39 2.11
Clerical Workers 1,189.07 9.94 1,226.65 8.90 1,328.25 8.68 1,344.95 8.25 1,353.32 7.84 1,318.76 6.40 0.62 1.60 0.25 -0.02
Service Workers & Shop & Market Sales Workers
1,969.32 16.47 2,921.91 21.20 3,301.39 21.57 3,604.55 22.11 3,879.48 22.48 4,594.39 22.30 8.21 2.47 1.77 1.11
Skilled Agricultural & Fishery Workers 1,388.85 11.61 1,171.52 8.50 1,163.82 7.61 1,185.10 7.27 1,199.19 6.95 1,195.12 5.80 -3.35 -0.13 0.36 0.09
Craft & Related Trade Workers 1,234.39 10.32 1,488.52 10.80 1,555.90 10.17 1,612.03 9.89 1,659.70 9.62 1,772.73 8.60 3.82 0.89 0.71 0.44 Plant & Machine Operators & Assemblers
1,510.25 12.63 1,722.83 12.50 1,584.22 10.35 1,595.86 9.79 1,597.51 9.26 1,524.81 7.40 2.67 -1.66 0.15 -0.13
Elementary Occupations 1,360.41 11.38 1,392.04 10.10 1,013.86 6.63 1,012.65 6.21 1,005.10 5.82 927.25 4.50 0.46 -6.14 -0.02 -0.30
Total Employment 11,958.50 100.00 13,782.60 100.00 15,302.93 100.00 16,302.57 100.00 17,258.55 100.00 20,605.57 100.00 2.88 2.11 1.27 1.00
Unemployed 402.77 446.55 512.30 524.93 553.11 619.17
Labour Force 12,361.27 14,229.15 15,815.23 16,827.50 17,811.65 21,224.73
Skilled Workers 3,306.21 27.65 3,859.13 28.00 5,355.47 35.00 5,947.42 36.48 6,564.25 38.03 9,272.51 45.00

SUPPLY PIPELINE BY EDUCATION LEVEL
DIPLOMA
&
ABOVE
CERTIFICATES

SUPPLY PIPELINE BY FIELD OF STUDY

SUPPLY PIPELINE BY FIELD OF STUDY (CONT)

LABOUR MARKET INITIATIVES UNDER 11TH MP
Improving Productivity, Job Creation and Wage Structure
Enhancing Labour Market Operation
Improving Management of Foreign Workers
Unstructured & Disconnected labour market information
High-skilled jobs
Labour productivity
Wages index
Wage gaps
Mismatch in the labour market
Women Participation
Youth Unemployment
Effectiveness of Labour Regulation
Management of Foreign Workers
Dependency on Low Skilled Foreign Workers
Eliminate Reduce Raise Create
1
2
3
4
5
6
7
8
9
10
11

HIGH-INCOME NATION REQUIRES EFFICIENT LABOUR MARKET, THAT WILL MATCH DEMAND WITH SUPPLY
24
LM flexibility • Supportive regulation
Modern LM support system • Employment insurance • Comprehensive LMI • Efficient job matching
Development of human capital (quality & quantity)
Sector-driven demand
• Ensure strong pipeline of
quality workforce into the
labour market through
• Education
• TVET
• Upskilling
• Key growth sectors in the
11MP
• Investments & creation of
quality jobs in key growth
sectors
LM initiatives 11MP
Supply Demand
• Slower growth (9MP – 1.9%; 10MP
– 1.3%)
• TFR 2.1 – replacement level in
2013)
• High migration (~152% in 13
years – CAGR 7%)
• Towards ageing by 2035 - 15%
population aged 60> (2013, 9%)
Notes: TFR – total fertility rate: average number of children of a woman in child bearing age of 15-49y
• Technology advancement
• Innovation
• New investment
• New source of growth
• Knowledge based economy
Population Economic growth
Wages Structure
Job creation
Foreign labour
Youth unemployment
Employment safety net
Labour regulation
Labour Market Information
Women in LM
Quality Labour & employment • High-skill jobs • High labour productivity
Labour market efficiency

HUMAN CAPITAL DEVELOPMENT TOWARDS 2050
LMI
Employment
Wages
Skilled workers
TVET
Industrial training
Governance
LLL/RPL
Highly skilled and better delivery
Education
Pre-school
Primary & Secondary
Higher Education
Values & Ethics
Generation gap