Embed Size (px)
Citation preview

J. Electrochem. Sci. Eng. X (20xx) 000-000; doi: 10.5599/jese.2013.0035
Open Access : : ISSN 1847-9286www.jESE-online.org
Original scientific paper
Electrochemical behaviour of PES ionomer and Pt-free catalyst for PEMFCsSTEFANIA GIORDANO, MARIANGELA LONGHI, LEONARDO FORMARO, HERMES FARINA and GIUSEPPE DI SILVESTRODipartimento di Chimica, Università degli Studi di Milano, Via Golgi, 19, 20133, Milano, ItalyCorresponding Author: E-mail: [email protected]; Tel.: +39-50314226; Fax: +39-50314300Received: January 5, 2013; Revised: April 10, 2013; Published: MMMM DD, YYYY
AbstractProton Exchange Membrane Fuel Cells (PEMFCs) represent promising technologies to the world economy, with many applications and low environmental impact. A most important aspect concerning their widespread implementation is the cost of polymeric membranes, typically perfluorinated membranes and platinum-based catalytic electrode materials, all of which are necessary to promote electrode reactions, thus increasing fuel cell energy efficiency. In this work, we present some data about non-fluorinated polyetheresulphone (PES) membranes and Pt-free catalysts, as possible substitutes of the above materials. Their electrochemical behaviour in oxygen reduction reaction in acidic media are investigated and compared with available reference materials.
KeywordsORR, Pt-free catalyst, PES, PEMFC.
IntroductionPolymer electrolyte membrane fuel cells (PEMFCs) have achieved significant progress over the
past few decades. They are considered one of the most promising fuel cell technologies for both stationary and mobile applications owing to their high energy efficiency, convenient operation, and environmentally friendly characteristics. The main objective in fuel cell technologies is to develop low cost, high-performance and durable materials [1-6]. At present, platinum is the best cathode catalyst for oxygen reduction reaction (ORR) in PEMFCs; however, because of the scarcity and cost of the metal, there is a strong effort to find alternative metals or alloys with similar activity [7-10]. Promising advances have been made with new composites (non-precious metals/heteroatomic polymers), pyrolysed metal porphyrins (cobalt or iron porphyrins viewed as the most promising precursors) or bio-inspired materials. As they are capable of combining high oxygen-reduction activity with good performance, these materials appear viable alternative catalysts for ORR [11-17]. In PEMFC, catalysts are commonly supported on proton conductive
doi: 10.5599/jese.2013.0035 1

J. Electrochem. Sci. Eng. X(Y) (20xx) 000-000 PES IONOMER AND Pt-FREE CATALYST FOR PEMFCs
membranes. The most common material of this kind is DuPont’s Nafion®, a perfluorinated sulphonic acid polymer with many noteworthy features: good conductivity up to 80°C, which decreases beyond 80°C by dehydration; however, this also has a high cost. Extensive research has been done to produce cheaper membranes to replace Nafion®. New electrolyte membranes obtained by grafting with styrene and sulphonic acid look promising and further development is underway to improve their performance [18-20].
Considering the above mentioned critical aspects, in this work we are looking for new materials for PEMFCs applications, i.e. non-fluorinated polymeric membranes and platinum-free catalysts. As possible Nafion substitutes, we synthesised non-fluorinated polyetheresulphones (PES) with different degrees of sulphonation. Polymers were obtained starting from different ratios of sulphonated and non-sulphonated co-monomers. Varying the monomers ratio it was possible to obtain polymers with different values of ion exchange capacity, swelling, hydrodynamic volume and rigidity. PES membranes have been characterised by thermogravimetric analysis (TGA) and differential scanning calorimetry (DSC) in order to study thermal stability and water retention. On the side of Pt-free catalysts, the one presented below was synthesised by a sugar pyrolysis route in the presence of a nitrogen precursor and a non-precious transition metal. Thiamine was chosen as the precursor because, besides nitrogen, it also contains sulphur that may be a useful carbon-doping element [21]. Iron was used as the transition metal. To increase catalyst surface area and to control porosity in the mesoporosity range, a hard template method was adopted using a silica gel in water [22]. Catalyst surface area and porosity were determined by BET and BJH theory, respectively. The electrochemical behaviour of the PES membrane and thiamine catalyst in oxygen reduction (ORR) conditions were investigated and compared to reference materials, i.e. Nafion 1100 and EC-20 catalyst (20 % Pt dispersed on Vulcan XC72R). An ORR study was carried on in acidic media by cyclic voltammetry using a rotating disk electrode (RDE).
Experimental
MaterialsGlucose, thiamine, Fe(II) acetate, glacial acetic acid, sodium hydroxide, silica (Silica Gel 60 HR),
HCl (37 %), H2SO4 (95-97 %), ethanol, N-methylpyrrolidone (NMP), dimethyl acetamide (DMAc), and Nafion® 1100 (5 wt. % suspension) were purchased from Aldrich and used as received. HClO4
and K2CO3, dimethyl sulphoxide (DMSO) were obtained from Fluka and Carlo Erba, respectively. High purity water from a MilliQ system (Millipore) was used. Nitrogen and oxygen (5.5 and 5 nines respectively) were purchased from Sapio.
Catalyst synthesisThe Pt-based catalyst EC-20 was used as received. Home-made catalyst carbon was obtained by
the following procedure. Thiamine was added to a nearly saturated glucose-in-water solution (1.68 mol L-1) in a 1:10 molar ratio. Thiamine dissolution was aided by equimolar glacial acetic acid. Thereafter, acetate iron salt was added (0.96 wt. % on total amount of non-water reactants). Ten millilitres of the solution was stirred with 4.3 g of silica in order to form a gel. Then, the suspension was loaded in a quartz reactor, degassed with nitrogen and inserted in a preheated vertical oven at 600°C for one hour to carbonise the precursors as fast as possible. Silica was removed in 3 M boiling sodium hydroxide followed by repeated carbon washing/filtering. Products were dried in nitrogen (100°C, 24 hours) and finely ground. Materials were heat-activated in a second step at 900 °C (ramping at 6°C min-1, three hours standing) under constant nitrogen flow.
2
S. Giordano et al. J. Electrochem. Sci. Eng. X(Y) (20xx) 000-000
Catalyst specific surface area and porositySurface area and porosity were determined using a TriStar® II 3020 apparatus (Micromeritics
Instrument Corporation system). Before measurement, samples were outgassed at 150 °C for 4 hours under nitrogen in a FlowPrep 060 degas system. Surface area was determined by low temperature BET (Brunauer, Emmett and Teller) N2 adsorption. Pore size and pore size distribution were calculated by the Barrett, Joyner, Halenda (BJH) method.
Polyetheresulphones (PES) synthesisPES copolymers were synthesised by a co-polycondensation method in NMP solution at high
temperatures in the presence of K2CO3. Different ratios of sulphonated and non-sulphonated co-monomers were used. PES membranes were prepared by casting from DMAc solutions.
PES thermal analysisThermal stability and PES water retention were determined by TGA (using a Perkin Elmer TGA
400 system, T = 25-900 °C, 20 °C min-1) and DSC (using a Mettler Toledo DSC 1 system, T = 25-400°C, 20 °C min–1). Data were recorded in N2. Similar data were recorded for Nafion 1100.
Electrochemical characterizationBefore measurement, all glassware was first washed in HCl (37 %), then H2SO4 (95-97 %) and
finally rinsed with MilliQ water. The working electrode was a rotating disk electrode (RDE-EDI 101 Radiometer) with a glassy carbon tip (cross-sectional area of 0.07 cm2) embedded in a Teflon sheath. Before use, the carbon tip was gently cleaned with soft sandpaper, polished with diamond powder (Aldrich) and finally degreased with ethanol. The thin film rotating disk electrode method (TF-RDE) was used to immobilise small catalyst amounts onto the polished carbon tip. To improve reproducibility the electrode was initially conditioned by cycling in O2 saturated solution for 50 min (10 mV s-1 without electrode rotation) in the potential range E = –0.275/+0.800 V vs. Ag/AgCl. Measurements were thereafter recorded in a range of rotation rates (300–1600 rpm) at 5 mV s -1. When performing measurements on Pt-containing-materials, a Pt counter-electrode was used (0.6 cm2); a glassy carbon rod (5.5 cm2) was used instead for Pt-free materials. I/E recordings were obtained by means of an Amel 7050 Potentiostat in a standard three-electrode electrochemical cell with an Ag/AgCl external reference electrode in 3 M NaCl. All potentials are reported on the Normal Hydrogen Electrode scale (NHE). Measurements were carried out in 0.1M HClO4 solution at room temperature.
The electrode preparation consisted of two successive deposition steps: the first with a catalyst suspension in water (ink) and the second with an ionomer solution as catalyst binder. In the first step, 10 mg of catalyst was dispersed in 1 mL water and sonicated for 30 min; 7 µL of this mixture was pipetted onto the electrode tip and dried in a bottom-up position under a tungsten lamp. In the second step a few µL of an ionomer solution (see details below) were deposited onto the catalyst layer. This operation was found to be critical, especially in the case of the homemade PES ionomer which, besides being insoluble in water, was also found to be less effective in “gluing” the catalyst layer onto the RDE tip. Because of solubility, organic solvents had to be used for PES; these were also good wetting agents for the RDE Teflon sheath. This feature is unfortunate because it may hamper the accurate determination of the ionomer mass per catalyst surface area, depending on the more or less effective wetting by ionomer solutions of the Teflon sheath that surrounds the graphite tip. Therefore, different ionomer deposition procedures were adopted depending on the ionomer used. For Nafion, deposition was straightforward because water is the
doi: 10.5599/jese.2013.0035 3
J. Electrochem. Sci. Eng. X(Y) (20xx) 000-000 PES IONOMER AND Pt-FREE CATALYST FOR PEMFCs
Nafion suspension solvent and does not wet Teflon. For PES, several solvents were tested (DMAc, NMP, DMSO). Among them NMP and DMSO were found to be suitable; for DMAc a compromise had to be obtained by mixing DMAc with water in various ratios.
Detailed ionomer deposition conditions were as follows: for Nafion, 7 L of a Nafion solution in water (3.5 10-4 g mL-1) was deposited on the electrode tip giving rise to a final Nafion loading of 3.51 10-5 g cm-2; for PES, 4 L of a PES solution (10-2 g mL-1) was used with a final PES electrode loading of 5.7 10-4 g cm-2. The adopted PES solvent and solvent composition will be specified when reporting electrochemical results.
Results and Discussion
Catalyst surface area and porosityAfter heat-activation at 900°C, the catalyst surface area was about 800 m2 g-1, which is lower
than that after the first heat treatment at T = 600°C. Fractional pore volume distributions were found to be essentially independent of heating temperature. The pore size distribution shows a maximum (70 %) at about 40-50 nm; however, there was a sizeable presence of micropores (10 %). The high percentage of 40 nm mesopores is presumably useful to ORR behaviour, providing easy diffusional access to the reactive catalyst surface and to the Nafion ionomer units [23, 24].
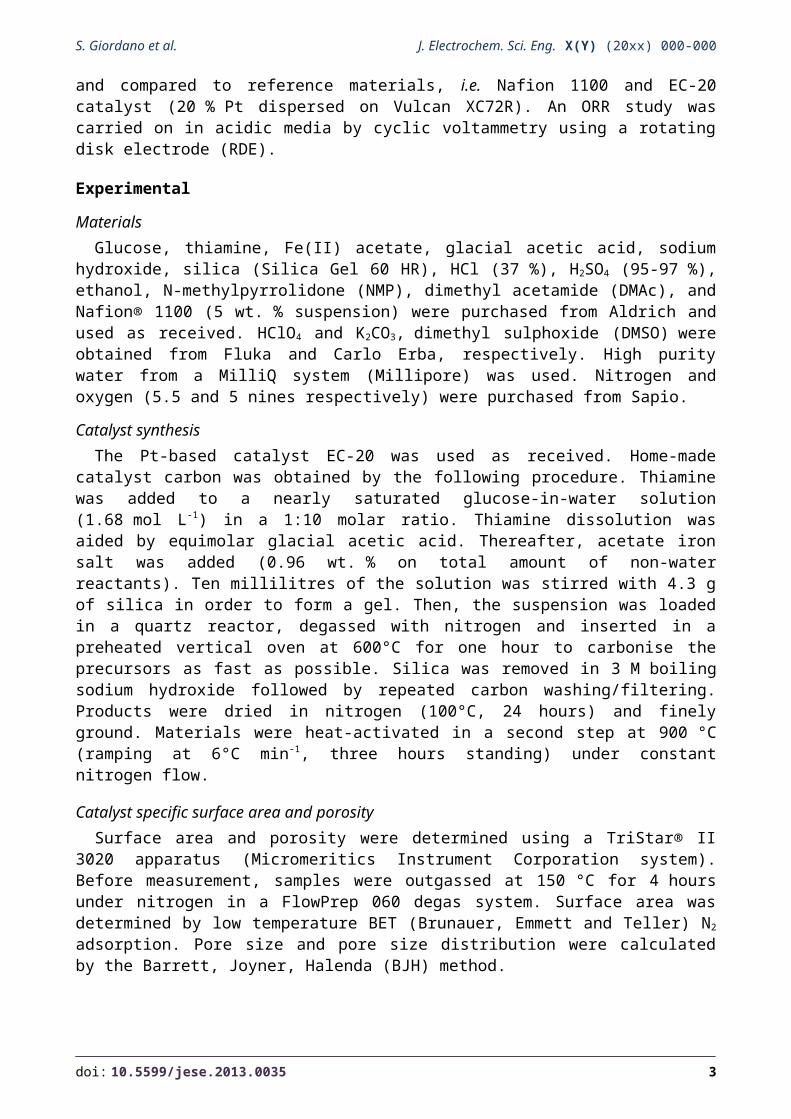
PES and Nafion thermal analysisTGA: To increase the PES water storing capability, the virgin polymer was conditioned in HCl
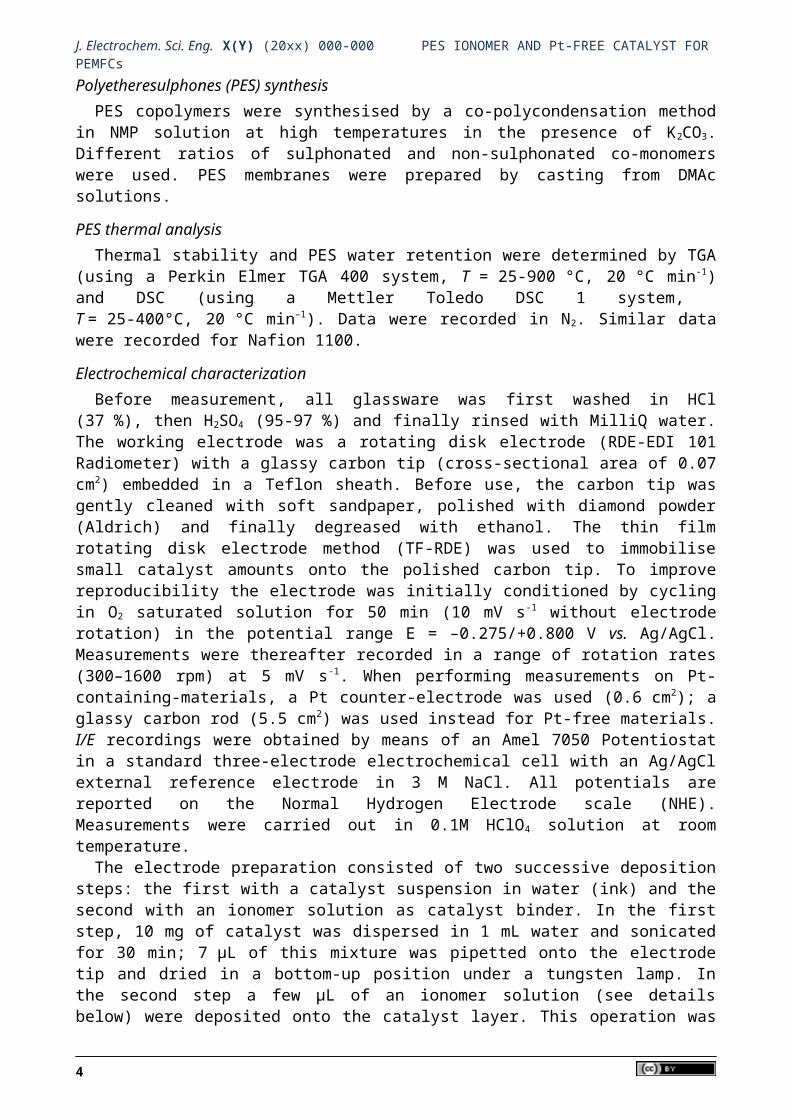
and HClO4 (compare the red and green curves in Figure 1). It can be noted that the two acidic conditionings give indistinguishable results. Figure 1 also reports the PES behaviour without acid conditioning (light blue curve). As seen in the figure, acidic conditioning definitely decreases the polymer water retention. Figure 2 reports a comparison between PES and Nafion 1100, with both of them HCl conditioned (red and blue curve, respectively). The most notable feature is the greater PES mass loss in the respect of Nafion up to the crossing point of the curves, at T 480 °C. At higher temperatures, the Nafion mass losses become much greater than the PES ones. In a further aspect, the PES mass loss up to T 100-120 °C, which is the upper project temperature for PEMFCs operation, is greater than for Nafion. At high temperatures, Nafion behaviour can be interpreted by references to literature data. According to Wilkie et al. [25], Almeida and Kawano [26, 27] fluorocarbon polymers exhibit high thermal stability and decompose by a first step (290–400 °C) that may be associated with a polymer desulphonation process, then by a second step (400–470 °C) related to side-chain decomposition and, finally, by a third one (470–560 °C), due to the PTFE backbone decomposition. In comparison, Figure 2 shows similar thermal degradation on PES after the completion of water removal at T = 200-220 °C. At present, no details are available on PES decomposition processes.
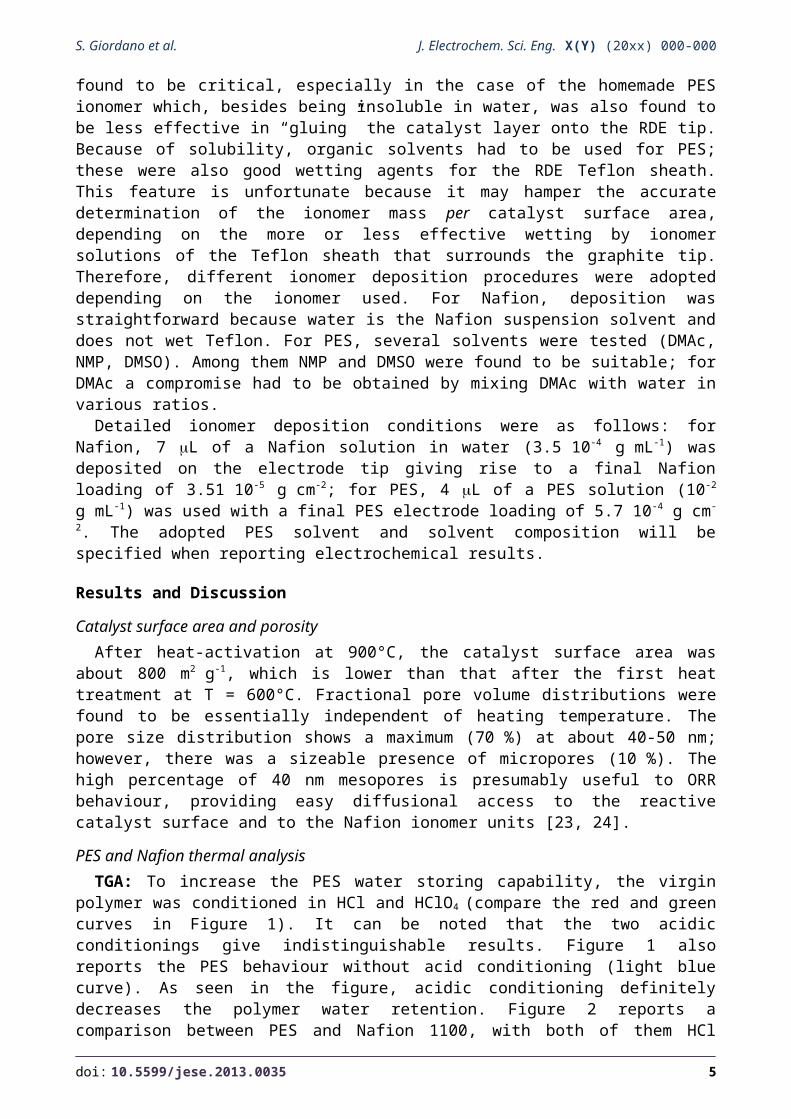
DSC: Figure 3 shows some features of the virgin PES (see the black curve) and after acidic conditioning (the red curve). In the black curve, a rather weak endothermic maximum extends over a wide temperature range (T 50-170 °C, ΔH = -120 J g-1), followed at higher T by a second sharp endothermal peak that, by comparison with a pure DMAc sample, is due to the removal of residual reaction solvent (DMAc). The sample behaviour is strongly affected by acidic conditioning (red curve). As the most relevant feature, a stronger endothermic process appears in the above-mentioned temperature range (T 50-170°C, with a sharp maximum at T = 110 °C, ΔH = -480 J g-
1). By comparison with TGA results in Figure 1, the process is due to water removal. By the
4
S. Giordano et al. J. Electrochem. Sci. Eng. X(Y) (20xx) 000-000
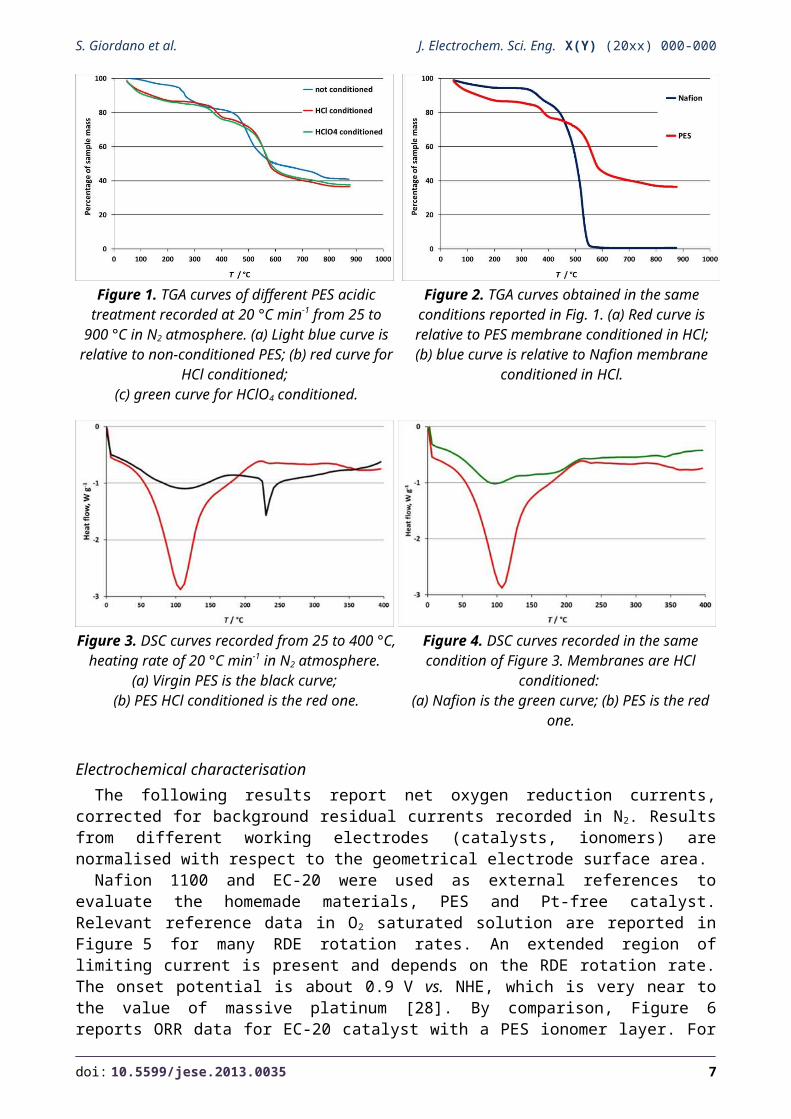
integration of Figure 3 curves, the water amount released from the acid conditioned samples is approximately four times greater than that from the unconditioned ones. At higher temperatures, the water removal is followed by a second, more diffuse endothermic process ending at T 200°C. In comparison, the Nafion behaviour (see Figure 4) is characterised by a sequence of comparatively weaker endothermal (ΔH = -120 J g-1) processes with a first maximum at T 100°C and a second, barely distinguishable one at T 180°C. By reference again to the TGA results in Figure 1, both of these processes are attributed to water removal. Overall, from a PEMFC operative viewpoint, the water amount retained in PES is favourably greater than in Nafion and is, moreover, more thermally stable.
Figure 1. TGA curves of different PES acidic treatment recorded at 20 °C min-1 from 25 to 900 °C in N2
atmosphere. (a) Light blue curve is relative to non-conditioned PES; (b) red curve for HCl conditioned;
(c) green curve for HClO4 conditioned.
Figure 2. TGA curves obtained in the same conditions reported in Fig. 1. (a) Red curve is relative to PES membrane conditioned in HCl; (b) blue curve is relative to Nafion membrane conditioned in HCl.
Figure 3. DSC curves recorded from 25 to 400 °C, heating rate of 20 °C min-1 in N2 atmosphere.
(a) Virgin PES is the black curve; (b) PES HCl conditioned is the red one.
Figure 4. DSC curves recorded in the same condition of Figure 3. Membranes are HCl conditioned:
(a) Nafion is the green curve; (b) PES is the red one.
Electrochemical characterisationThe following results report net oxygen reduction currents, corrected for background residual
currents recorded in N2. Results from different working electrodes (catalysts, ionomers) are normalised with respect to the geometrical electrode surface area.
Nafion 1100 and EC-20 were used as external references to evaluate the homemade materials, PES and Pt-free catalyst. Relevant reference data in O2 saturated solution are reported in Figure 5
doi: 10.5599/jese.2013.0035 5

J. Electrochem. Sci. Eng. X(Y) (20xx) 000-000 PES IONOMER AND Pt-FREE CATALYST FOR PEMFCs
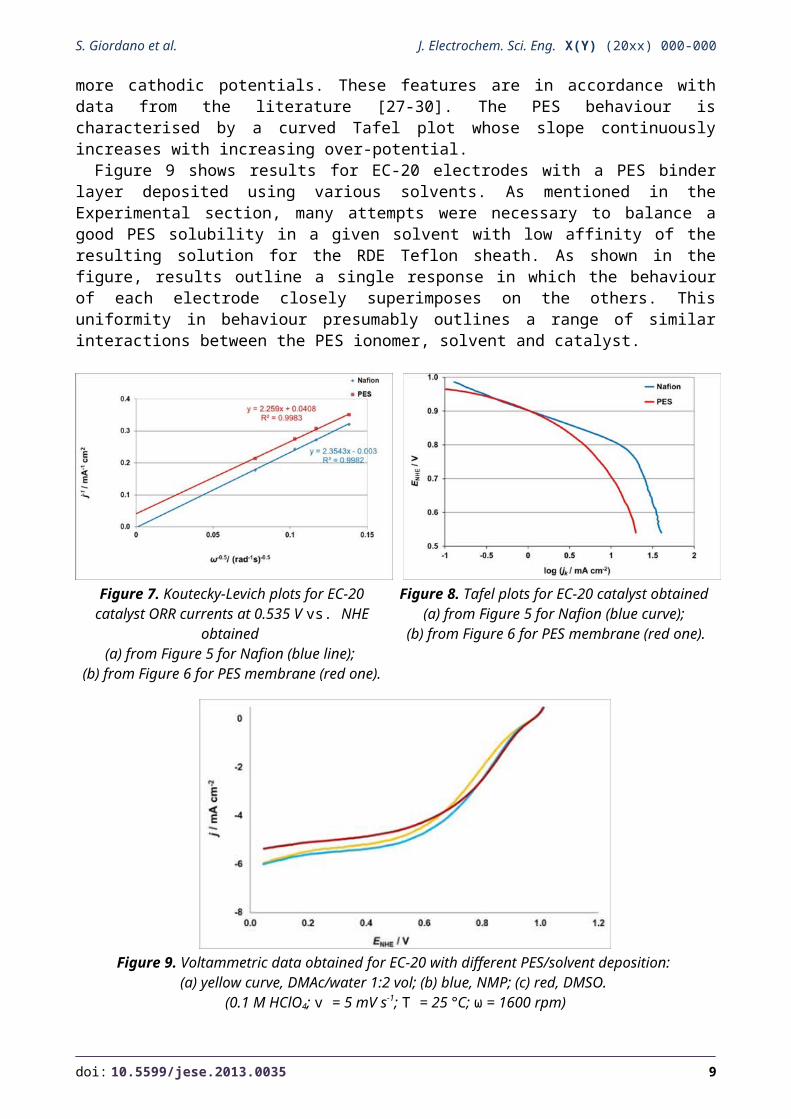
for many RDE rotation rates. An extended region of limiting current is present and depends on the RDE rotation rate. The onset potential is about 0.9 V vs. NHE, which is very near to the value of massive platinum [28]. By comparison, Figure 6 reports ORR data for EC-20 catalyst with a PES ionomer layer. For the steeper current increase with decreasing electrode potential, ORR results obtained with Nafion are clearly better than PES ones. This difference may be due to the greater loading of PES than Nafion (see the Experimental), or to a greater Nafion acidity/conductivity in respect of PES. Despite many attempts, we were unable to decrease the PES amounts due to increasing mechanical instability of the catalyst layer. As a further main feature, PES causes an apparent slope decrease of j/E plots in the mixed control region (E 0.9-0.7 V), and lower limiting current density values at more negative potentials. Figure 7 reports Koutecky-Levich plots for the used Nafion and PES ionomer onto the used Pt catalyst (EC-20). To avoid graphical crowding, the figure is only based on results in the limiting current region (E = 0.535 V vs. NHE).
Figure 5. Voltammetric data for EC-20 with Nafion binder. RDE rotation rates are shown in the figure
label. (0.1 M HClO4; v = 5 mV s-1; T = 25 °C).
Figure 6. Voltammetric data obtained for EC-20 with PES binder (DMSO only). RDE rotation rates
are shown in the figure label. (0.1 M HClO4; v = 5 mV s-1; T = 25 °C).
Nafion data are interpolated by a straight line with an almost exactly zero intercept at the axes origin and a slope from which, also taking into account numerical uncertainties, the number of stoichiometric exchanged electrons, n, ranges from 3.6-3.8.
By comparison, PES data give rise to a straight line with a similar slope, which is in accordance with a comparable kinetic hindrance from diffusion in solution. From this slope, n is 3.8; however, there is a greater intercept that, as mentioned above, might be due to the greater PES amount necessary.
Figure 8 shows the Tafel plots of EC-20/Nafion and EC-20/PES electrodes obtained from Koutecky-Levich plots for many potentials of the investigated range. For Nafion results, a first, extended Tafel region, with a slope of ca. -60 mV dec-1, begins at somewhat more cathodic potentials than the ORR onset and ends at E 0.83 V. A second, much shorter, Tafel section with a higher slope (ca. -120 mV dec-1) can be specified, although with some difficulty, at more cathodic potentials. These features are in accordance with data from the literature [27-30]. The PES behaviour is characterised by a curved Tafel plot whose slope continuously increases with increasing over-potential.
Figure 9 shows results for EC-20 electrodes with a PES binder layer deposited using various solvents. As mentioned in the Experimental section, many attempts were necessary to balance a good PES solubility in a given solvent with low affinity of the resulting solution for the RDE Teflon
6
S. Giordano et al. J. Electrochem. Sci. Eng. X(Y) (20xx) 000-000
sheath. As shown in the figure, results outline a single response in which the behaviour of each electrode closely superimposes on the others. This uniformity in behaviour presumably outlines a range of similar interactions between the PES ionomer, solvent and catalyst.
Figure 7. Koutecky-Levich plots for EC-20 catalyst ORR currents at 0.535 V vs. NHE obtained
(a) from Figure 5 for Nafion (blue line); (b) from Figure 6 for PES membrane (red one).
Figure 8. Tafel plots for EC-20 catalyst obtained (a) from Figure 5 for Nafion (blue curve);
(b) from Figure 6 for PES membrane (red one).
Figure 9. Voltammetric data obtained for EC-20 with different PES/solvent deposition: (a) yellow curve, DMAc/water 1:2 vol; (b) blue, NMP; (c) red, DMSO.
(0.1 M HClO4; v = 5 mV s-1; T = 25 °C; ω = 1600 rpm)
ORR results for the thiamine sample catalyst with a Nafion binder layer are reported in Figure 10 for various RDE rotation rates. Although not exciting, this behaviour is acceptable overall, with a noteworthy and unfavourable shift of the curves towards more negative potentials in respect of the external reference EC-20.
Figure 11 reports the behaviour of the thiamine sample with a PES, instead of Nafion, binder. A dramatic worsening in behaviour is observed in comparison to Figure 10. This becomes more evident by comparison with a similar result for the PES/EC-20 electrode assembly (the relevant curve of Figure 11 is taken from Figure 6).
In the last figure, PES in itself or the PES/solvent mixture used behaves as a real “killer” for the homemade catalyst, while still affording an acceptable response when used on EC-20, even though less satisfactory than Nafion. This brings to light a complexity of the many interactions that may
doi: 10.5599/jese.2013.0035 7

J. Electrochem. Sci. Eng. X(Y) (20xx) 000-000 PES IONOMER AND Pt-FREE CATALYST FOR PEMFCs
occur among separate components necessarily involved in building up a final, well behaving PEMFCs electrode catalytic assembly.
Figure 10. Voltammetric data obtained for thiamine catalyst with Nafion.
RDE rotation rates are shown in the figure label. (0.1 M HClO4; v= 5 mV s-1; T = 25 °C).
Figure 11. Voltammetric data obtained for PES membrane (in DMSO only) for (a) EC-20 (red curve) and
(b) thiamine catalyst (black curve). (0.1 M HClO4; v = 5 mV s-1; T = 25 °C; ω = 1600 rpm).
ConclusionsThe present homemade catalyst, synthesised by the pyrolysis of sugar thiamine mixtures, is
characterised by unsatisfactory ORR features. It is, however, an element of the catalyst family that is currently under investigation as a substitute for Pt.
Similarly, the reported PES sample belongs to a polymer class that is being investigated for favourable water retention and thermal stability. Improvements may likely concern ionic conductivity in PEMFC operational conditions.
It can be also mentioned that the present homemade catalyst and ionomer afford acceptable results when separately tested with one or another reference material. Their ORR response fails completely when used together. This shows that, in view of real PEMFC applications, many mixed interactions have to be taken into account and optimised in detail.
Acknowledgements: Financial support from Cariplo Foundation (Project 2010-0588 “Non fluorinated polymeric membranes and Platinum-free catalytic systems for Fuel Cells with low cost and high efficiency” ) are gratefully acknowledged.
References[1] X.Z. Yuan, H. Li, S. Zhang, J. Martin, H. Wang, J. Power Sources 208 (2012) 96-119[2] P.J. Ferreira, G.J. la O’, Y. Shao-Horn, D. Morgan, R. Makharia, S. Kocha, H.A. Gasteiger, J.
Electrochem. Soc. 152 (2005) 2256-2271[3] C.W.B. Bezerra, L. Zhang, H. Liu, K. Lee, A.L.B. Marques, E.P. Marques, H. Wang, J. Zhang, J.
Power Sources 173 (2007) 891-908[4] H.A. Gasteiger, S.S. Kocha, B. Sompalli, F.T. Wagner, Appl. Catal. B: Environ. 56 (2005) 9-35[5] K. Sopian, W.R. Wan Daud, Renew. Energ. 31 (2006) 719-727[6] D. Garraín, Y. Lechón, C. de la Rúa, Smart Grid Renew. Energ. 2 (2011) 68-74[7] J.X. Wang, N.M. Markovic, R.R. Adzic, J. Phys. Chem. B 108 (2004) 4127-4133[8] U.A. Paulus, T.J. Schmidt, H.A. Gasteiger, R.J. Behm, J. Electroanal. Chem. 495 (2001) 134-145
8
S. Giordano et al. J. Electrochem. Sci. Eng. X(Y) (20xx) 000-000
[9] M.R. Tarasevich, V.A. Bogdanovskaya, L.N. Kuznetsova, A.D. Modestov, B.N. Efremov, A.E. Chalykh, Y.G. Chirkov, N.A. Kapustina, M.R. Ehrenburg, J. Appl. Electrochem. 37 (2007) 1503-1513
[10] R. Othman, A.L. Dicks, Z. Zhu, Int. J. Hydrogen Energy 37 (2012) 357-372[11] A. Morozan, B. Jousselme, S. Palacin, Energy Environ. Sci. 4 (2011) 1238-1254[12] G. Liu, X. Li, P. Ganesan, B.N. Popov, Appl. Catal. B: Environ. 93 (2009) 156-165[13] F. Jaouen, E. Proietti, M. Lefèvre, R. Chenitz, J.P. Dodelet, G. Wu, H.T. Chung, C.M.
Johnston, P. Zelenay, Energ. Environ. Sci. 4 (2011) 114-130[14] M. Lefèvre, E. Proietti, F. Jaouen, J.P. Dodelet, Science 324 (2009) 71-74[15] M. Annala, S. Lipponen, T. Kallio, J. Seppälä, J. Appl. Polym. Sci. 124 (2012) 1511-1519[16] G. Lalande, R. Côté, D. Guay, J.P. Dodelet, L.T. Weng, P. Bertrand, Electrochim. Acta 42
(1997) 1379-1388[17] F. Jaouen, S. Marcotte, J.P. Dodelet, G. Lindbergh, J. Phys. Chem. B 107 (2003) 1376-1386[18] M.A. Hickner, H. Ghassemi, Y.S. Kim, B.R. Einsla, J.E. McGrath, Chem. Rev. 104 (2004)
4587-4612[19] W. Liu, Y. Xie, J. Liu, X. Jie, J. Gu, Z. Zou, Int. J. Hydrogen Energy 37 (2012) 4673-4677[20] Y. Iwai, T. Yamanishi, Polym. Degrad. Stabil. 94 (2009) 679-687[21] E.J. Biddinger, D.S. Knapke, D. von Deak, U.S. Ozkan, Appl. Catal. B: Environ. 96 (2010) 72-82[22] I. Galbiati, C.L. Bianchi, M. Longhi, A. Carrà, L. Formaro, Fuel Cells 10 (2010) 251-258[23] E. Antolini, Appl. Catal. B: Environ. 88 (2009) 1-24[24] K. Kinoshita, J. Electrochem. Soc. 137 (1990) 845-848[25] C.A. Wilkie, J.R. Thomsen, M.L. Mittleman, J. Appl. Polym. Sci. 42 (1991) 901-909[26] S.H. de Almeida, Y. Kawano, J. Therm. Anal. Calorim. 58 (1999) 569-577[27] L.G. Lage, P.G. Delgado, Y. Kawano, J. Therm. Anal. Calorim. 75 (2004) 521-530[28] K.J.J. Mayrhofer, D. Strmcnik, B.B. Blizanac, V. Stamenkovic, M. Arenz, N.M. Markovic,
Electrochim. Acta 53 (2008) 3181-3188[29] F. Gloaguen, F. Andolfatto, R. Durand, P. Ozil, J. Appl. Electrochem. 24 (1994) 863-869[30] N.M. Markovic, H.A. Gasteiger, P.N. Ross, J. Phys. Chem. 99 (1995) 3411-3415[31] D. van der Vliet, D. Strmcnik, C. Wang, V. Stamenkovic, N.M. Markovic, M.T.M. Koper, J.
Electroanal. Chem. 647 (2010) 29-34
doi: 10.5599/jese.2013.0035 9

J. Electrochem. Sci. Eng. X(Y) (20xx) 000-000 PES IONOMER AND Pt-FREE CATALYST FOR PEMFCs
© 2013 by the authors; licensee IAPC, Zagreb, Croatia. This article is an open-access article distributed under the terms and conditions of the Creative Commons Attribution license
(http://creativecommons.org/licenses/by/3.0/)
10


![[c] PATENTS - marinepharmacology.midwestern.edumarinepharmacology.midwestern.edu/Documents/CCP/Marine Pharmaco… · Web viewDipartimento di Chimica delle Sostanzi Naturali, Universita](https://img.dokumen.tips/doc/110x75/5c68168209d3f226188cb97c/c-patents-pharmaco-web-viewdipartimento-di-chimica-delle-sostanzi-naturali.jpg)