Embed Size (px)
Citation preview

Jemena Electricity Networks (Vic) Ltd
Response to the annual Regulatory Information Notice for the 2015 regulatory year
Public
29 April 2016

TABLE OF CONTENTS
Public—29 April 2016 © Jemena Electricity Networks (Vic) Ltd ii
TABLE OF CONTENTS
Glossary ........................................................................................................................................................................... vi 0. Introduction ........................................................................................................................................................... 8
0.1 Submission purpose .................................................................................................................................... 8 0.2 Submission structure ................................................................................................................................... 8 0.3 Submission values and terminology ............................................................................................................ 9
1. General ................................................................................................................................................................ 10 1.1 Information requirements ........................................................................................................................... 10
1.1.1 information templates ............................................................................................................. 10 1.1.2 Reconciliations ....................................................................................................................... 10 1.1.3 Accounting and capitalisation policies .................................................................................... 10 1.1.4 Cost Allocation Method .......................................................................................................... 11
1.2 Changes in regulatory accounting policies ................................................................................................ 11 1.3 Reasons and quantum of changes ............................................................................................................ 11 1.4 Changes in the policy to determine the allocation of overheads ................................................................ 11 1.5 Reasons and quantum of changes ............................................................................................................ 11 1.6 Variance analysis ....................................................................................................................................... 12
1.6.1 Distribution revenue ............................................................................................................... 12 1.6.2 Operating expenditure ........................................................................................................... 12 1.6.3 Capital expenditure ................................................................................................................ 12 1.6.4 Demand energy ..................................................................................................................... 12
1.7 Reasons for variances ............................................................................................................................... 13 1.7.1 Capital expenditure variance .................................................................................................. 13
1.8 STPIS variances ........................................................................................................................................ 15 1.8.1 STPIS reliability ...................................................................................................................... 15 1.8.2 STPIS customer service......................................................................................................... 16
2. Compliance procedures ..................................................................................................................................... 18 2.1 Service classification ................................................................................................................................. 18 2.2 Negotiated service criteria ......................................................................................................................... 18 2.3 Negative change events ............................................................................................................................ 18
3. Cost allocation .................................................................................................................................................... 20 3.1 Directly attributed and allocated costs ....................................................................................................... 20 3.2 Allocated cost and allocators ..................................................................................................................... 20
3.2.1 Shared cost allocation method ............................................................................................... 27 4. Cost allocation to service segments ................................................................................................................. 28 5. Related Party Transactions ................................................................................................................................ 41
5.1 Related Parties .......................................................................................................................................... 41 5.2 Related Party transactions ......................................................................................................................... 41 5.3 Information on Related Party transactions ................................................................................................. 42
5.3.1 Name of Related Party ........................................................................................................... 42 5.3.2 Counter party ......................................................................................................................... 42 5.3.3 Nature and purpose of Related Party transactions ................................................................ 42 5.3.4 Actual costs ............................................................................................................................ 43 5.3.5 Determining Actual Costs ....................................................................................................... 43 5.3.6 Regulatory reporting .............................................................................................................. 44 5.3.7 Allocating Related Party transaction costs ............................................................................. 44 5.3.8 Allocators and allocation basis ............................................................................................... 44
6. Capitalisation policy ........................................................................................................................................... 47

TABLE OF CONTENTS
Public—29 April 2016 © Jemena Electricity Networks (Vic) Ltd iii
6.1 Changes in capitalisation policy statement ................................................................................................ 47 6.2 Impact of change ....................................................................................................................................... 47
7. Demand Management Incentive Allowance (DMIA) ......................................................................................... 48 7.1 Identification of demand management projects or programs ..................................................................... 48 7.2 Detailed information – Demand response field trial, Phase 1 .................................................................... 48
7.2.1 Compliance ............................................................................................................................ 49 7.2.2 Nature and scope ................................................................................................................... 49 7.2.3 Aims and expectations ........................................................................................................... 50 7.2.4 Selection process ................................................................................................................... 50 7.2.5 Implementation ...................................................................................................................... 51 7.2.6 Implementation costs ............................................................................................................. 51 7.2.7 Benefits .................................................................................................................................. 51 7.2.8 Associated costs .................................................................................................................... 51 7.2.9 Forgone revenue assumptions and / or estimates ................................................................. 52
7.3 Detailed information – Demand response trial Project on 22kV Feeder BD-13 (Phase 1) ......................... 52 7.3.1 Compliance ............................................................................................................................ 52 7.3.2 Nature and scope ................................................................................................................... 53 7.3.3 Aims and expectations ........................................................................................................... 53 7.3.4 Selection process ................................................................................................................... 54 7.3.5 Implementation ...................................................................................................................... 54 7.3.6 Implementation costs ............................................................................................................. 54 7.3.7 Benefits .................................................................................................................................. 55 7.3.8 Associated costs .................................................................................................................... 55 7.3.9 Forgone revenue assumptions and / or estimates ................................................................. 55
7.4 Detailed information – DEMAND MANAGEMENT CONSTRAINT ANALYSIS TOOL (cat) ....................... 55 7.4.1 obligations or requirements .................................................................................................... 55 7.4.2 Nature and scope ................................................................................................................... 56 7.4.3 Aims and expectations ........................................................................................................... 57 7.4.4 Selection process ................................................................................................................... 57 7.4.5 Implementation ...................................................................................................................... 57 7.4.6 Implementation costs ............................................................................................................. 58 7.4.7 Benefits .................................................................................................................................. 58 7.4.8 Associated costs .................................................................................................................... 58 7.4.9 Forgone revenue assumptions and / or estimates ................................................................. 58
7.5 Detailed information – grid battery energy storage system - FEASIBILITY and Concept Design Study ......................................................................................................................................................... 59
7.5.1 Compliance ............................................................................................................................ 59 7.5.2 Nature and scope ................................................................................................................... 59 7.5.3 Aims and expectations ........................................................................................................... 60 7.5.4 Selection process ................................................................................................................... 60 7.5.5 Implementation ...................................................................................................................... 60 7.5.6 Implementation costs ............................................................................................................. 61 7.5.7 Benefits .................................................................................................................................. 61 7.5.8 Associated costs .................................................................................................................... 61 7.5.9 Forgone revenue assumptions and / or estimates ................................................................. 62
7.6 Demand Management Innovation Allowance ............................................................................................ 62 8. Advanced Metering Infrastructure ..................................................................................................................... 63
8.1 Efficiency improvements ............................................................................................................................ 63 8.2 Efficiency improvement (explanation and quantum) .................................................................................. 63
8.2.1 Remote AMI Meter Reading ................................................................................................... 64 8.2.2 Remote AMI Connection and Disconnection .......................................................................... 64 8.2.3 Remote AMI Meter Re-configuration ...................................................................................... 64 8.2.4 Demand Management through Informed AMI Customers ...................................................... 64

TABLE OF CONTENTS
Public—29 April 2016 © Jemena Electricity Networks (Vic) Ltd iv
8.2.5 Improved accuracy of outage identification & NOTIFICATION .............................................. 65 9. Safety and bushfire related expenditure ........................................................................................................... 66
9.1 Asset Categories ....................................................................................................................................... 66 9.2 Variance analysis ....................................................................................................................................... 67
9.2.1 Variance analysis - volume .................................................................................................... 68 9.2.2 Variance analysis - expenditure ............................................................................................. 68 9.2.3 Variance analysis - unit costs ................................................................................................. 69
9.3 Reasons for variances by program ............................................................................................................ 70 9.3.1 Planned non-preferred service replacements ........................................................................ 70 9.3.2 Planned replacement of non-preferred services due to height ............................................... 71 9.3.3 Public lighting switch wire removal ......................................................................................... 71 9.3.4 Replacing existing SWER lines with 22kV overhead bare conductor ..................................... 72 9.3.5 Replacement of crossarms/insulator sets – pole top fIre mitigation ....................................... 72 9.3.6 Replacement of crossarms - based on age and condition ..................................................... 73 9.3.7 Replacement of poles - based on age and condition ............................................................. 73 9.3.8 Stake poles - based on age and condition ............................................................................. 74 9.3.9 Replacement of undersized poles .......................................................................................... 75 9.3.10 Stake undersized poles .......................................................................................................... 75 9.3.11 Replacement of overhead conductor - mainly steel ............................................................... 76 9.3.12 Service line clearance - overhead services requiring relocation ............................................ 77 9.3.13 Service line clearance - overhead services requiring undergrounding ................................... 78 9.3.14 Vibration dampers and armour rods ....................................................................................... 78 9.3.15 Distribution transformer height rectification ............................................................................ 79 9.3.16 Zone substation earth grid replacements ............................................................................... 79 9.3.17 Trial of neutral condition monitor ............................................................................................ 80 9.3.18 Installation of Ground Fault Neutralizers (GFN) and associated equipment at zone
substations ............................................................................................................................. 80 9.4 Reasons for material differences by Asset Category ................................................................................. 80
9.4.1 Volume variance .................................................................................................................... 81 9.4.2 Expenditure variance ............................................................................................................. 81
9.5 Reasons for differences between the actual volumes submitted as part of the ESMS and RAS ............... 82 10. Sponsorship and marketing............................................................................................................................... 83 11. Charts .................................................................................................................................................................. 86
11.1.1 Group corporate structure ...................................................................................................... 86 11.1.2 JEN organisational structure .................................................................................................. 86
12. Audit reports ....................................................................................................................................................... 88 12.1 Regulatory Audit Reports ........................................................................................................................... 88 12.2 Provision of Regulatory Audit Reports to JEN’s management ................................................................... 88
13. Statutory declaration .......................................................................................................................................... 89 14. Attachments ........................................................................................................................................................ 90
List of tables Table 1-1: 2015 Distribution revenue variance ................................................................................................................. 12 Table 1–2: 2015 opex variance ........................................................................................................................................ 12 Table 1-3: 2015 capex variance ....................................................................................................................................... 12 Table 1-4: Demand energy variance ................................................................................................................................ 13 Table 1-5: Breakdown of capex variance ......................................................................................................................... 13 Table 1–6: STPIS reliability .............................................................................................................................................. 16 Table 1–7: STPIS customer service ................................................................................................................................. 16

TABLE OF CONTENTS
Public—29 April 2016 © Jemena Electricity Networks (Vic) Ltd v
Table 1–8: Time series of appointments not met on time ............................................................................................... 17 Table 3–1: Shared cost allocation .................................................................................................................................... 21 Table 4–1: Cost allocation to service segments ............................................................................................................... 29 Table 5–1: Related Party transactions ............................................................................................................................. 42 Table 5-2: Actual Cost Determination .............................................................................................................................. 43 Table 5-3: Related party cost reporting in RAS ................................................................................................................ 44 Table 5-4: Cost categories vs. actual cost allocations ...................................................................................................... 44 Table 5-5 Allocating Related Party Costs ......................................................................................................................... 45 Table 8–1: Customer benefits from remote AMI services performed in 2015................................................................... 63 Table 9–1: Safety and bushfire expenditure and Asset Category .................................................................................... 66 Table 9–2: Actual volume vs forecast volume .................................................................................................................. 68 Table 9–3: Actual expenditure vs forecast expenditure .................................................................................................... 68 Table 9–4: Actual unit costs vs forecast unit costs ........................................................................................................... 69 Table 9–5: Planned non-preferred service replacements ................................................................................................. 70 Table 9–6: Planned replacement of non-preferred service due to height ......................................................................... 71 Table 9–7: Public lighting switch wire removal ................................................................................................................. 72 Table 9–8: Replacing existing SWER lines with 22kV overhead bare conductor ............................................................. 72 Table 9–9: Replacement of crossarms – pole top fire mitigation ...................................................................................... 72 Table 9–10: Replacement of crossarms – based on age and condition ........................................................................... 73 Table 9–11: Replacement of poles – based on age and condition ................................................................................... 73 Table 9–12: Stake poles – based on age and condition ................................................................................................... 74 Table 9–13: Replacement of undersized poles ................................................................................................................ 75 Table 9–14: Stake undersized poles ................................................................................................................................ 76 Table 9–15: Replacing overhead conductor – mainly steel .............................................................................................. 76 Table 9–16: Service line clearance – overhead services requiring relocation .................................................................. 77 Table 9–17: Service line clearance – overhead services requiring undergrounding ........................................................ 78 Table 9–18: Vibration dampers and armour rods ............................................................................................................. 78 Table 9–19: Distribution transformer height rectification .................................................................................................. 79 Table 9–20: Zone substation earth grid replacements ..................................................................................................... 79 Table 9–21: Trial of neutral condition monitor .................................................................................................................. 80 Table 9–22: Volume variance by Asset Category ............................................................................................................ 81 Table 9–23: Expenditure variances by Asset Category .................................................................................................... 81 Table 10–1: JEN’s advertising and marketing expenditure .............................................................................................. 83 Table 10–2: JEN advertising and marketing expenditure not reported in 10.1(a) ............................................................. 84
List of figures Figure 1: Jemena Group structure as at December 2015 ................................................................................................ 86 Figure 2: Jemena Operational Structure as it relates to JEN as at December 2015 ........................................................ 87

GLOSSARY
Public—29 April 2016 © Jemena Electricity Networks (Vic) Ltd vi
GLOSSARY
ABS Australian Bureau of Statistics
ACS Alternate Control Services
AER Australian Energy Regulator
AMA Asset Management Agreement
AMI Advanced Metering Infrastructure
CAM Cost Allocation Methodology
capex Capital expenditure
CPI Consumer Price Index
CSM Customer Supply Monitoring
DMIS Demand Management Incentive Scheme
DR Demand Response
DRFT Demand Response Field Trial
ERP Enterprise Resource Planning
ESMS Electricity Safety Management Scheme
FY Financial Year
GFN Ground Fault Neutraliser
GSL Guaranteed Service Levels
HBRA Hazardous Bushfire Risk Area
HV High Voltage
JEM Jemena Ltd
JEN Jemena Electricity Network (Vic) Ltd
LV Low Voltage
MAIFI Momentary Average Interruption Frequency Index
MED Major Event Day
NEL National Electricity (Victoria) Law
NER National Electricity Rules
O&M Operating and Maintenance Costs
opex Operating expenditure
RAS Regulatory Accounting Statements
RIN Regulatory Information Notice
SAIDI System Average Interruption Duration Index
SAIFI System Average Interruption Frequency Index
SAP System Analysis and Program
SGSPAA SGSP (Australia) Assets Pty Ltd

GLOSSARY
Public—29 April 2016 © Jemena Electricity Networks (Vic) Ltd vii
SPI Singapore Power International
ST Subtransmission
STPIS Service Target Performance Incentive Scheme
SWER Single Wire Earth Return

GLOSSARY
Public—29 April 2016 © Jemena Electricity Networks (Vic) Ltd 8
0. INTRODUCTION
0.1 SUBMISSION PURPOSE
1. This submission is the Jemena Electricity Networks (Vic) Ltd (JEN) response to the Regulatory Information Notice (RIN) that the Australian Energy Regulator (AER) issued to JEN on 6 August 2014 under Division 4 of Part 3 of the National Electricity (Victoria) Law (NEL). This response covers the 2015 regulatory year ending on 31 December 2015.
2. The RIN requires JEN to provide and prepare certain information for the AER to use for performance or exercise of its functions or powers conferred on it under the NEL or the National Electricity Rules (NER), namely for the purposes of:
monitoring JEN’s compliance with the AER’s distribution determination that applies to JEN for the 2011–2015 regulatory period (the 2011-2015 Distribution Determination)
publishing reports on JEN’s financial or operating performance, and
preparing for the making of the 2016-20 distribution determination.
3. This RIN response:
provides the information required in the regulatory accounting statement templates provided by the AER and included at Attachment 1-1,
provides operational performance information required in the non-financial templates provided by the AER and included at Attachment 1-2,
provides a reconciliation that explains adjustments between the Statutory Accounts and the Regulatory Accounting Statements at Attachment 1-3,
provides a basis of preparation demonstrating how JEN has complied with the RIN at Attachment 1-4,
provides the Regulatory Accounting Principles and Policies and the Capitalisation Policy for the 2015 regulatory year at Attachment 1-5 and Attachment 1-6 respectively,
provides a statement of the policy for determining the allocation of overheads in accordance with the AER approved Cost Allocation Methodology (CAM) at Attachment 1-7,
provides a copy of the audit report for financial information and non-financial information at Attachment 1-8,
sets out qualitative and quantitative explanations required in response to Schedule 1 of the RIN
explains reasons for why any specific requested information or an estimate cannot be provided in accordance with Schedule 1 of the RIN, and
provides a copy of the signed statutory declaration from JEN’s Managing Director as Attachment 1-9.
0.2 SUBMISSION STRUCTURE
4. JEN has structured this submission in accordance with each of the regulatory RIN templates as well as the information requested in section 1.1 of Schedule 1 of the RIN. The remainder of this Schedule 1 response is structured as follows:

GLOSSARY
Public—29 April 2016 © Jemena Electricity Networks (Vic) Ltd 9
Section 1 – General
Section 2 – Compliance procedures
Section 3 – Cost allocation
Section 4 – Cost allocation to service segments
Section 5 –Related party transactions
Section 6 – Capitalisation policy
Section 7 – Demand management incentive allowance
Section 8 – Advanced metering infrastructure
Section 9 – Safety and bushfire related expenditure
Section 10 – Sponsorship and marketing
Section 11 – Charts
Section 12 – Audit reports
Section 13 – Statutory declaration
Section 14 – Summary of attachments
0.3 SUBMISSION VALUES AND TERMINOLOGY
5. This submission employs the following standards:
unless otherwise indicated, all numbers are expressed in nominal AUD$2015,
unless otherwise indicated, JEN has adopted actual inflation using the Australian Bureau of Statistics (ABS) Consumer Price Index (CPI) group - Weighted Average of Eight Capital Cities,1
the Relevant Regulatory Year is the 2015 calendar year (CY) ending on 31 December 2015 and the fifth and final year of the 2011-2015 Distribution Determination,
Jemena Group means SGSP (Australia) Assets Pty Ltd (SGSPAA) and all of its wholly owned subsidiaries, and
unless otherwise expressly defined in this response, capitalised terms have the meanings defined in the RIN.
1 JEN uses a one year September on September lag to compute actual inflation consistent with the approach adopted in the 2011-15
electricity distribution price review final decision .

GLOSSARY
Public—29 April 2016 © Jemena Electricity Networks (Vic) Ltd 10
1. GENERAL
6. In this section, JEN responds to section 1 of Schedule 1 to the RIN for Relevant Regulatory Year 2015.
1.1 INFORMATION REQUIREMENTS
1.1.1 INFORMATION TEMPLATES
7. Sections 1.1(a),1.1(b) and 1.1(d) of Schedule 1 to the RIN require JEN to provide the following:
the Regulatory Accounting Statements, being financial information as specified in the AER’s Microsoft Excel workbook (named Appendix B in the RIN)
non-financial information as specified in the AER’s Microsoft Excel workbook (named Appendix C in the RIN), and
a basis of preparation demonstrating how JEN has complied with the RIN.
8. The AER information templates required are attached to JEN’s response as Attachments 1-1, 1-2 and 1-4 respectively.
1.1.2 RECONCILIATIONS
9. Section 1.1(c) of Schedule 1 to the RIN requires JEN to provide a Microsoft Excel workbook that reconciles and explains all movements between Statutory Accounts and the Regulatory Accounting Statements (RAS).
10. As JEN advised in its response to the draft RIN2, JEN is not able to provide a complete set of all such reconciliations. For these reasons, JEN is not able to provide an estimate. JEN arrives at the RAS numbers by making required adjustments to its Statutory Accounts. Those adjustments are not entered into the System Analysis and Program (SAP) development system.
11. JEN has provided reconciliations for profit & loss, capital expenditure (capex) and operating expenses (opex) tables.
12. The reconciliations are provided as Attachment 1-3 to JEN’s response.
1.1.3 ACCOUNTING AND CAPITALISATION POLICIES
13. Section 1.1(e) of Schedule 1 to the RIN requires JEN to provide its Regulatory Accounting Principles and Policies and Capitalisation Policy for the current regulatory year.
14. The Regulatory Accounting Principles and Policies and Capitalisation Policy for 2015 are set out in Attachments 1-5 and 1-6 respectively.
2 JEN’s response to the Draft RIN, 24 February 2012.

GLOSSARY
Public—29 April 2016 © Jemena Electricity Networks (Vic) Ltd 11
1.1.4 COST ALLOCATION METHOD
15. Section 1.1(f) of Schedule 1 to the RIN requires JEN to provide a statement of the policy for determining how it allocates its overheads in accordance with the Cost Allocation Method (CAM)3.
16. A copy of JEN’s AER approved CAM is provided as Attachment 1-7.
17. JEN’s policy is to allocate overheads to distribution services in accordance with the AER approved CAM. JEN’s CAM and approach to allocating shared costs (Enterprise Support Functions (ESF) and residual Asset Management (AM)) did not change during the 2015 regulatory year.
1.2 CHANGES IN REGULATORY ACCOUNTING POLICIES
18. Section 1.2(a) of Schedule 1 to the RIN requires JEN to identify all changes between the Regulatory Accounting Principles and Policies provided in the response to paragraph 1.1(e).
19. JEN advises that the substance of JEN’s Regulatory Accounting Principles and Policies and Capitalisation Policy has not changed. Hence, section 1.2(a) of Schedule 1 to the RIN is not applicable.
1.3 REASONS AND QUANTUM OF CHANGES
20. Section 1.2(b) of Schedule 1 to the RIN requires JEN to explain the nature of and the reason for the change between the Regulatory Accounting Principles and Policies provided in response to section 1.1(e) of the RIN. Section 1.2(b) also requires JEN to quantify the effect of changes identified.
21. JEN advises that there is no change to the substance of JEN’s Regulatory Accounting Principles and Policies and Capitalisation Policy. Hence, section 1.2(b) of Schedule 1 to the RIN is not applicable.
1.4 CHANGES IN THE POLICY TO DETERMINE THE ALLOCATION OF OVERHEADS
22. Section 1.3 of Schedule 1 to the RIN requires JEN to identify all changes in the statements of the policy to determine the allocation of overheads in accordance with the CAM provided in response to section 1.1(f) of the RIN.
23. JEN advises that there is no change to the substance of JEN’s approach to determine the allocation of overheads in accordance with the CAM, as stipulated in section 1.1(f) of Schedule 1 to the RIN.
1.5 REASONS AND QUANTUM OF CHANGES
24. Section 1.3(a) and 1.3(b) of Schedule 1 to the RIN requires JEN to explain the nature of and the reason for any changes in the statements of the policy to determine the allocation of overheads in accordance with the CAM provided in response to section 1.1(f) of the RIN. Section 1.3(b) also requires JEN to quantify the effect of changes identified.
3 JEN’s revised CAM – 19 December 2014

GLOSSARY
Public—29 April 2016 © Jemena Electricity Networks (Vic) Ltd 12
25. JEN advises that it submitted a revised CAM to the AER in 2014 which updated its previous CAM for ESF cost centre names and to reflect its current organisation structure. The AER approved JEN’s revised CAM on 19 December 2014—a copy of this CAM is provided at Attachment 1-7 of this response. For the 2015 regulatory year, there was no change to the substance of JEN’s approach to determine the allocation of overheads in accordance with the CAM. Hence, section 1.3 of Schedule 1 to the RIN is not applicable.
1.6 VARIANCE ANALYSIS
26. Section 1.4(a) to 1.4(d) of Schedule 1 to the RIN requires JEN to identify each material (+/- 10%) difference between amounts reported in the RAS and amounts allowed in the AER’s 2011-2015 Distribution Determination for standard control services.
1.6.1 DISTRIBUTION REVENUE
27. Table 1-1 compares forecast distribution revenue (as determined in the AER’s 2011-2015 Distribution Determination) and actual distribution revenue.
Table 1-1: 2015 Distribution revenue variance
Actual ($000) Forecast ($000) Variance ($000) Variance (%)
259,270 242,235 +17,035 +7.03%
1.6.2 OPERATING EXPENDITURE
28. Table 1-2 compares forecast opex (as determined in the AER’s 2011-2015 Distribution Determination) and actual opex (standard control services). Actual costs are inclusive of the related party payments.
Table 1–2: 2015 opex variance
Actual ($000) Forecast ($000) Variance ($000) Variance (%)
75,029 69,585 +5,444 +7.82%
1.6.3 CAPITAL EXPENDITURE
29. Table 1-3 compares forecast capex net of customer contributions (as determined by the AER’s 2011-2015 Distribution Determination) and actual net capex. This variance is explained in section 1.7.1.
Table 1-3: 2015 capex variance
Actual ($000) Forecast ($000) Variance ($000) Variance (%)
130,752 96,010 +34,742 +36.19%
1.6.4 DEMAND ENERGY
30. Table 1-4 compares forecast demand (as determined in the AER’s 2011-2015 Distribution Determination) and actual demand.

GLOSSARY
Public—29 April 2016 © Jemena Electricity Networks (Vic) Ltd 13
Table 1-4: Demand energy variance
Actual Demand (GWh) Forecast (GWh) Variance (GWh) Variance (%)
4,212 4,205 7 0.16%
1.7 REASONS FOR VARIANCES
31. Section 1.5 of Schedule 1 to the RIN requires JEN to explain the reasons for any underlying operational activities or drivers that caused each material difference (where the difference is equal to or greater than 10 per cent) identified in the response to paragraph 1.4.
As the variances for distribution revenue (+7.03%), opex (+7.82%) and energy demand (0.16%) are less than plus or minus 10% variance from the allowance, JEN has only provided an explanation for the capex variance (+36.19%).
1.7.1 CAPITAL EXPENDITURE VARIANCE
32. Table 1-5 compares JEN’s actual net capex and the forecast amounts as determined in the 2011-15 Distribution Determination.
Table 1-5: Breakdown of capex variance
Category Allowed
($m) Actual
($m) Variance
($m) %
Reinforcements 21.530 24.946 3.416 16%
New customer connections (net of customer contribution)
29.849 38.437 8.588 29%
Reliability and quality maintained 15.419 11.113 -4.306 -28%
Environmental, safety and legal obligations (ES&L) 17.655 26.761 9.106 52%
SCADA and network control 0.015 0.016 0.001 7%
Non-network general – IT 6.852 8.796 1.944 28%
Non-network general – others 4.690 20.683 15.993 341%
Total 96.010 130.752 34.742 36%
33. JEN’s actual capex was $34.7M higher than the allowance in the 2011-15 Distribution Determination. The major variances that contribute to the $34.7M are set out below.
Reinforcement (+3.4M variance)
34. The variance is mainly due to the factors listed below.
Distribution System Augmentation (+$2.6M) – In 2015, JEN undertook short term relief work to address the feeder capacity constraint at Flemington zone substation. This project was not included in JEN’s 2010 regulatory proposal.
Distribution Substation Augmentation, load related (-$11.1M) – This activity relates to capacity augmentation such as upgrading pole mounted transformers. JEN delivered less distribution substation augmentation work in 2015 due to slightly lower spatial peak demand in pockets of the network than was forecast in 2010.

GLOSSARY
Public—29 April 2016 © Jemena Electricity Networks (Vic) Ltd 14
Zone Substation Augmentation (+$12.6M) – the increase in this sub-category mainly relates to three zone substations.
– Reinforcement works at Tullamarine and Broadmeadows South zone substations commenced in 2014; and these zone substations were originally scheduled to be completed earlier in the current regulatory period. The commencement of these projects was however deferred until 2014 to align with the timing of the realisation of demand on the network. In addition, the project scope was expanded from the original design to include an additional transformer and significant high-voltage feeder works in response to changing customer demand.
– East Preston zone substation augmentation forms part of the conversion works (from 6.6kV to 22kV) in the Preston/East Preston area. The zone substation work was originally scheduled to be undertaken in 2011. This cost variance is due to timing differences.
New customer connections (+$8.6M variance)
35. In 2015, JEN experienced higher levels of capex in dual and multiple occupancy and medium density housing due to a higher volume of activity and higher unit costs than were forecast in JEN’s 2010 regulatory proposal.
36. The drivers of higher customer initiated connection activities include relaxed council planning restrictions on multiple occupancy housing and increasing numbers of sub-division applications in some of JEN’s local government areas.
37. The increase in customer connection capex is therefore beyond JEN’s control, as JEN is obliged to incur the associated connection costs.
Reliability and Quality Maintained (RQM) (-$4.3M variance)
38. The major areas contributing to the variance are listed below.
North Essendon (NS) zone substation transformer replacement (-$2.5M) – this replacement was deferred until 2015 and will be completed in 2017. Therefore, the full cost of this work has not been incurred in 2015.
Aged relay and switchgear replacement (-$4M) – JEN undertakes aged relay and switchgear replacement in accordance with the actual condition of assets. JEN originally planned to complete the aged relay and switchgear replacement at Airport West zone substation in 2015 however JEN conducted a risk assessment which found that the project could be deferred until 2016 without introducing additional risk to the network.
New control building at Airport West (AW) zone substation (+$1.9M) – this project was not included in JEN’s 2010 regulatory proposal.
Supply quality (+$1.7M) – JEN undertakes distribution and circuit relief works for the purpose of maintaining customers’ current quality of supply. In 2015, JEN undertook a larger volume of relief works than was originally proposed in order to maintain our customer’s current supply quality, rectify network limitations and respond to customer’s needs.
Environmental, safety and legal obligations (ES&L) (+$9.1M variance)
39. Two main areas, as set out below, contributed to the higher than forecast capex for this category.
Service replacements (+$5.8M) – JEN replaced 8,763 services in 2015, i.e. 2,422 services more than forecast. The actual unit cost of $1,014 compared with the allowed unit cost of $345 in the 2011 final determination also contributed to the cost variance.

GLOSSARY
Public—29 April 2016 © Jemena Electricity Networks (Vic) Ltd 15
Pole reinforcements (+$2.9M) – Upon being identified as unserviceable, poles may be either replaced or reinforced. JEN reinforced 2,115 poles in 2015, i.e. 1,672 poles more than forecast. The actual unit cost of $1,230 compared with the allowed unit cost of $836 in the 2011 final determination also contributed to the cost variance also contributed to the cost variance.
Non-network general – IT (+$1.9M variance)
40. The key areas contributing to the variances are:
Expenditure on SAP Operations alignment project (+$0.9M) - the aim of this project is to consolidate and rationalise the number of ERP system used by JEN.
IT establishment and laptop asset refresh project (+$0.9M) – IT set-up costs (IT infrastructure and related laptop upgrade) at JEN’s new consolidated office in Melbourne CBD.
Non-network general – Others (+$16M variance)
41. The variance in this category is mainly due to the following three property projects:
Victorian Property Project (+$17.6M) – JEN rationalised its office accommodation and all non-field based staff in Victoria into a consolidated office in December 2015, this expenditure was not included as a part of JEN’s proposal to the AER in 2010. It is expected to result in lower total property costs in the long term.
Property purchase for Craigieburn North (CBN) zone substation (+$1.5M) – this variance is due to timing difference where the purchase was originally scheduled for the period between 2012 and 2014 but did not occur until 2015.
Motor vehicles (-$3.1M) – This underspend arose from deferring motor vehicle purchases.
1.8 STPIS VARIANCES
42. Section 1.6 of Schedule 1 to the RIN requires JEN to identify each material difference (where the difference is equal to or greater than +/- 10 per cent) between the target performance measure specified in the Service Target Performance Incentive Scheme (STPIS) and actual performance reported in the response to paragraph 1.1(b) of Schedule 1 to the RIN.
43. The material variances and explanations are set out below.
1.8.1 STPIS RELIABILITY
44. The performance measures used in assessing STPIS reliability are as follows:
Urban unplanned average sustained interruptions (System Average Interruption Frequency Index) (SAIFI)
Urban unplanned average minutes off supply (System Average Interruption Duration Index) (SAIDI)
Rural unplanned SAIFI
Rural unplanned SAIDI; and
Rural unplanned average momentary interruptions (MAIFI).

GLOSSARY
Public—29 April 2016 © Jemena Electricity Networks (Vic) Ltd 16
45. The comparison between actual and target STPIS reliability measures is set out in Table 1–6.
Table 1–6: STPIS reliability
Performance Measure 2015 Actual 2015
Target Variance
Urban (after removing excluded events and Major Event Day (MED))
Unplanned SAIDI 46.09 68.50 -33%
Unplanned SAIFI 0.76 1.13 -32%
Unplanned MAIFI 0.81 0.78 4%
Rural (after removing excluded events and MED)
Unplanned SAIDI 63.88 153.15 -58%
Unplanned SAIFI 0.97 2.59 -63%
Unplanned MAIFI 1.21 1.94 -38%
46. Five STPIS performance measures in Table 1–6 show a variance of greater than 10%. All of these variances were associated with better than target levels of performance. The two main factors contributing to the favourable performance are:
JEN’s more stringent vegetation management practices arising from legislative changes to the Electricity Safety (Electric Line Clearance) Regulations in 2010 and JEN’s effective condition based asset replacement, network augmentation and maintenance of current network performance standards; and
Mild temperatures experienced in the 2014/15 summer, along with infrequent storm events during the historically stormy months of August and September.
1.8.2 STPIS CUSTOMER SERVICE
47. The performance measures used in assessing STPIS customer service are as follows:
Appointments not met on time (excluding AMI)
Guaranteed Service Levels (GSL) – New connections not made on or before the date agreed
GSLs – Low reliability payments
GSLs – Street lights and
Call centre performance.
48. The comparison between actual and target STPIS customer service measures is set out in Table 1–7.
Table 1–7: STPIS customer service
Performance Measure 2015 Actual 2015 Target Variance
Appointments not met on time (excluding AMI) (number) 16 6 +167%
GSL – New connections not made on or before the date agreed (number)
24 28 -14%
GSL – Low reliability payments (number) 80 144 -44%
GSL – Street Lights (number) 3 54 -94%

GLOSSARY
Public—29 April 2016 © Jemena Electricity Networks (Vic) Ltd 17
1.8.2.1 Appointments not met on time
49. In 2015, AMI appointments were treated as business as usual activities. 16 appointments were not met on time, compared with a target of six. The main factor that contributed to this unfavourable result is due to the exceptionally low target, which was derived from historical data in 2005-2009; during this time missed appointment numbers were at historical minimums.
50. The customer service outcome in 2015 is in fact the best performance outcome in the 2011-2015 regulatory period in terms of ‘percentage of appointments not met on time’. Table 1–8 demonstrates the improving customer service trend on this measure.
Table 1–8: Time series of appointments not met on time
2011* 2012* 2013* 2014* 2015
Customer arranged appointments
7,040 4,182 3,629 2,840 3,619
Appointments not met on time
90 33 22 42 16
Percentage of appointments not met on time
1.28% 0.79% 0.61% 1.48% 0.44%
(1) 2011-14 Appointments data excludes appointments (AMI rollout) for consistent comparison
1.8.2.2 GSL – new connections not met on or before the date agreed
51. With the new service provider commencing in 2010, more stringent timeframes for new connections were applied. A timeframe of two days for single phase sites and four days for multiple and three phase sites was stipulated in the new service contract. These timeframes are well below the required 10 days. As a result, this customer service performance target is consistently met again in 2015.
1.8.2.3 GSL – low reliability payments
52. The low reliability payments resulted from customers being without their electricity supply for greater than 20 hours. The majority of the low reliability payments were attributable to severe weather conditions on 23 and 28 February 2015 and an emergency interruption to repair a damaged low voltage underground cable on 20 February 2015.
1.8.2.4 GSL – street lights
53. In 2015, 3 JEN customers received a GSL payment for street lights that were not repaired in two working days. This out performance is due to improved business systems and processes that were initially introduced in 2010 and fully implemented in 2011.

GLOSSARY
Public—29 April 2016 © Jemena Electricity Networks (Vic) Ltd 18
2. COMPLIANCE PROCEDURES
2.1 SERVICE CLASSIFICATION
54. Section 2.1 of Schedule 1 of the RIN requires JEN explain the procedures and processes used by JEN to ensure that the distribution services have been classified as determined in the 2011-15 Distribution Determination.
55. Changes in service classification are monitored by JEN’s regulatory group as part of its business as usual activities. Leading up to price review determinations—when service classifications are reviewed—JEN’s regulatory team consult directly with the AER on its approach to service classification.
56. Following a price review determination, JEN’s regulatory and asset management teams review the activity codes for all JEN’s services/activities within JEN’s internal SAP system to ensure that any changes to service classification are mapped to the activity codes within JEN’s internal SAP system. This approach ensures that the services JEN provide are correctly classified throughout the regulatory control period.
57. JEN have recently undergone this process as part of its preparations for its regulatory proposal to the AER on 30 April 2015 and in developing its revised CAM during 2014. The AER approved JEN’s revised CAM on 19 December 2014 which remains consistent with JEN’s approach to allocate costs between service classifications in the 2015 regulatory year.
2.2 NEGOTIATED SERVICE CRITERIA
58. Section 2.2 of Schedule 1 of the RIN requires JEN to explain the procedures and processes used by JEN to ensure that the negotiated service criteria, as set out in the 2011-15 Distribution Determination, have been applied.
59. Similar to the approach described in 2.1 above, compliance with the negotiated service criteria, as set out in the 2011-15 Distribution Determination is monitored by JEN’s regulatory and asset management groups as part of their business as usual activities.
60. JEN’s regulatory and asset management teams periodically review the activity codes for all JEN’s services/activities within our internal SAP system to ensure that our service classifications—including negotiated services—are mapped to the correct activity codes within our internal SAP system. This approach ensures that the negotiated services JEN provide (public lighting services) are correctly classified throughout the regulatory control period and comply with the negotiated service criteria determined in the 2011-15 Distribution Determination.
2.3 NEGATIVE CHANGE EVENTS
61. Section 2.3 of Schedule 1 of the RIN requires JEN to describe the process JEN has in place to identify negative change events under clause 6.6.1(f) of the NER and the threshold of materiality applied to these events.
62. Legislative and regulatory changes as well as changes to technical and services standards are monitored by various groups within JEN (including regulatory, legal and asset management teams) as a part of their business as usual responsibilities. Where a positive or negative change event occurs which may have a material cost impact on the business, the support of the regulation and legal teams is enlisted to assess whether a pass through event has occurred and to (if necessary) prepare the required cost pass through notice.

GLOSSARY
Public—29 April 2016 © Jemena Electricity Networks (Vic) Ltd 19
63. To date, JEN has not made an application for a pass through event however both positive and negative pass through notices have been submitted to the AER by Jemena Gas Networks (NSW) Ltd in the context of the introduction and subsequent repeal of the carbon emission trading scheme. In those cases the identification of the pass through event and the preparation of the required notices occurred as a part of the business as usual process described above.
GLOSSARY
Public—29 April 2016 © Jemena Electricity Networks (Vic) Ltd 20
3. COST ALLOCATION
64. In this section, JEN responds to section 3 of Schedule 1 to the RIN for the 2015 Regulatory Year.
65. JEN has applied its AER approved CAM in all relevant circumstances. The AER approved JEN’s revised CAM on 19 December 2014. This revised CAM applied from 1 January 2015 onwards and is provided at Attachment 1-7.
3.1 DIRECTLY ATTRIBUTED AND ALLOCATED COSTS
66. Section 3.1(a) and (b) of Schedule 1 to the RIN requires JEN to identify each item in the RAS that is allocated to JEN:
not on a directly attributable basis but on a causation basis, or
not allocated on a directly attributable basis and cannot be allocated on a causation basis.
67. The items allocated to JEN have been identified and are listed in Table 3–1 below. Each of these items have been allocated on a causation basis and thus there are no items allocated in the category identified in paragraph 3.1(b) of Schedule 1 to the RIN.
3.2 ALLOCATED COST AND ALLOCATORS
68. Section 3.2(a) and (c) of Schedule 1 to the RIN requires JEN to state, for each item identified in response to paragraph 3.1(a), the amount of the item that has been allocated and the numeric amount of the allocators used. Section 3.2(b) required JEN to explain the method of allocation and reasons for choosing that method.
69. Table 3–1 sets out the amounts of these items and allocators. The causation basis of each cost item is shared, causal and operating in nature, in accordance with section 3.2(a)–(c) of Schedule 1 to the RIN. Sections 3.3 (a)-(d) are therefore not applicable for the above reasons.

GLOSSARY
Public—29 April 2016 © Jemena Electricity Networks (Vic) Ltd 21
Table 3–1: Shared cost allocation
Cost Item
[Section 3.3(a)–(c)]
Quantum ($)
[Section 3.3(a)]
Method of allocation and reason for basis
[Section 3.3(c)]
Allocator %
Chief executive officer (CEO)
Executive oversight and board liaison on asset and financial management, stakeholder relations, and human resources. CEO costs include directors’ travel expenses and fees, CEO compensation, support staff salaries, employee related expenses, procurement of external advice and administration expenses.
[C-I-C ]
Method: time writing.
Reason:
CEO costs support Jemena’s corporate governance and asset management, which directly benefit JEN and other Jemena assets and clients.
CEO costs are attributed to corporate activities based on time writing.
Residual costs were allocated to assets and clients using time writing data. The time writing data reflects the time recorded by staff in Jemena’s systems.
[C-I-C ]
Chief financial officer (CFO)
Executive oversight of financial reporting, management, and fund raising. Costs include CFO compensation, support staff salaries, employee related expenses, travel, procurement of external advice, administration expenses and any significant unbudgeted costs or savings.
[C-I-C ] Method: time writing.
Reason:
CFO costs support Jemena’s corporate governance and financial management, which, like CEO costs, directly benefit JEN and other Jemena assets and clients.
CFO costs are attributed to corporate activities based on time writing.
Residual costs were allocated to assets and clients using time writing data. The time writing data reflects the time recorded by staff in Jemena’s systems.
[C-I-C ]
Financial shared services
Management of finance systems, financial accounting, accounts payable, accounts receivable and payroll. Costs include salaries, employee related expenses, procurement of external advice, and training.
[C-I-C ]
Method: time writing.
Reason:
Financial shared services costs support Jemena’s financial accounting, systems, accounts payable, accounts receivable and payroll, which directly benefit JEN and other assets or clients.
Financial shared services costs are attributed to corporate activities based on time writing.
Residual costs were allocated to assets and clients using time writing data. The time writing data reflects the time recorded by staff in Jemena’s systems.
[C-I-C ]
Financial reporting [C-I-C Method: time writing. [C-I-C

GLOSSARY
Public—29 April 2016 © Jemena Electricity Networks (Vic) Ltd 22
Cost Item
[Section 3.3(a)–(c)]
Quantum ($)
[Section 3.3(a)]
Method of allocation and reason for basis
[Section 3.3(c)]
Allocator %
Management of management reporting, statutory reporting and regulatory reporting. Costs include salaries, employee related expenses, procurement of external advice including audit fees, and training.
] Reason:
Financial reporting costs support Jemena’s financial reporting processes, which directly benefit JEN and other assets or clients.
Financial reporting costs are attributed to corporate activities based on time writing.
Residual costs were allocated to assets and clients using time writing data. The time writing data reflects the time recorded by staff in Jemena’s systems.
]
Financial planning, treasury and financing
Management of financial planning, including budgeting, forecasting, and asset valuation. Costs include salaries, employee related expenses, procurement of external advice and training. Management of Jemena’s fund raising, debt and equity holder relations, and treasury functions. Costs include salaries, employee related expenses, travel for debt raising road shows, credit rating fees, and external advice.
[C-I-C ] Method: time writing.
Reason:
Financial planning costs support Jemena’s long-term network planning and cost reduction initiatives, including development of JEN’s asset management plan.
Treasury and financing costs support Jemena’s raising and management of debt and equity financing, which is essential to the management of JEN and other Jemena assets and clients.
Financial planning, treasury and financing costs are attributed to corporate activities based on time writing.
Residual costs were allocated to assets and clients using time writing data. The time writing data reflects the time recorded by staff in Jemena’s systems.
[C-I-C ]
Business finance partner
Support for regulatory strategy & submissions; and financial support for management of corporate support functions, including budgeting, forecasting, and corporate cost allocation. Costs include salaries, employee related expenses, procurement of external advice and training.
[C-I-C ]
Method: time writing.
Reason:
Business financial partner costs support Jemena’s corporate support functions and support for regulatory strategy & submissions towards long-term network planning and cost reduction initiatives, including development of JEN’s asset management plan.
Business financial partner costs are attributed to corporate activities based on time writing.
Residual costs were allocated to assets and clients using time writing data. The time writing data reflects the time recorded by staff in Jemena’s systems.
[C-I-C ]

GLOSSARY
Public—29 April 2016 © Jemena Electricity Networks (Vic) Ltd 23
Cost Item
[Section 3.3(a)–(c)]
Quantum ($)
[Section 3.3(a)]
Method of allocation and reason for basis
[Section 3.3(c)]
Allocator %
Legal and procurement
Management and advice on economic regulation, environmental law, employment law, property law, and company law, including the role of company secretary. Costs include salaries, employee related expenses, staff training, court and tribunal costs, and engagement of external lawyers.
[C-I-C ] Method: time writing.
Reason:
Legal costs support Jemena’s compliance with its legal obligations, including those of JEN.
Legal costs are attributed to corporate activities based on time writing.
Residual costs were allocated using time writing data. The time writing data reflects the time recorded by staff in Jemena’s systems.
[C-I-C ]
Corporate affairs
Management of corporate communications to stakeholders, including customers, employees, neighbours, and state and federal governments and regulators. Costs include salaries, employee related expenses, travel, communications print costs and subscriptions.
[C-I-C ] Method: time writing.
Reason:
Corporate affairs costs support Jemena’s communications with internal and external stakeholders, which are particularly important for JEN’s customers and other external stakeholders.
Corporate affairs costs are attributed to corporate activities based on time writing.
Residual costs were allocated using time writing data. The time writing data reflects the time recorded by staff in Jemena’s systems.
[C-I-C ]
Health safety and environment (HSEQ)
Management of employee Health and safety training, performance, quality and adverse impact on the environment. Costs include salaries, employee related expenses, external advice and training services.
[C-I-C ] Method: time writing.
Reason:
HSEQ costs support Jemena’s standards of health, safety and quality and minimise any adverse impact on the environment.
HSEQ costs are attributed to corporate activities based on time writing.
Residual costs were allocated using time writing data. The time writing data reflects the time recorded by staff in Jemena’s systems.
[C-I-C ]

GLOSSARY
Public—29 April 2016 © Jemena Electricity Networks (Vic) Ltd 24
Cost Item
[Section 3.3(a)–(c)]
Quantum ($)
[Section 3.3(a)]
Method of allocation and reason for basis
[Section 3.3(c)]
Allocator %
Human resources
Management of recruitment and remuneration benefit services. Costs include salaries, employee related expenses, recruitment agent fees, training, procurement of external advice and licence fees.
[C-I-C ]
Method: time writing.
Reason:
Human resources support Jemena’s management of its human resources, including those that work directly on JEN-related projects.
Human resources costs are attributed to corporate activities based on time writing.
Residual costs were allocated using time writing data. The time writing data reflects the time recorded by staff in Jemena’s systems.
[C-I-C
Information services
Provision and management of IT infrastructure and services (Information Services ‘IS’). Costs include salaries, employee related expenses, procurement of software and hardware, maintenance and system support, telecommunication costs and procurement of external advice costs.
[C-I-C ]
Method: information systems (IS) driver and time writing.
Reason:
IS costs support the delivery of Jemena’s capital and operating programs, including those of JEN.
IS costs are attributed to information technology activities based on time writing.
Residual IS costs were allocated using causal drivers, including ownership and use of applications, number of service requests and number of PCs used as a share of total Jemena PCs.
[C-I-C ]
Regulatory
Management of regulatory obligations, price reviews, consultations and relationships with governments, regulators and market operators. Costs include salaries, employee related expenses, training, travel, and procurement of external advice.
[C-I-C ] Method: time writing.
Reason:
Regulatory costs support management of Jemena’s regulated assets, including JEN.
Regulatory costs are attributed to regulatory activities based on time writing.
Residual costs were allocated using time writing data. The time writing data reflects the time recorded by staff in Jemena’s systems.
[C-I-C ]

GLOSSARY
Public—29 April 2016 © Jemena Electricity Networks (Vic) Ltd 25
Cost Item
[Section 3.3(a)–(c)]
Quantum ($)
[Section 3.3(a)]
Method of allocation and reason for basis
[Section 3.3(c)]
Allocator %
Risk and insurance
Procurement of insurance and management of risk, including for bushfire and other natural disasters. Costs include salaries, employee related expenses and insurance premiums.
[C-I-C ]
Method: insurance driver, which is based on declared values, exposure to risks and claims history.
Reason:
Risk and insurance costs support the effective management of Jemena’s risks, including those faced by JEN.
Risk and insurance costs were allocated to assets using the declared (or insured) values, exposure to risk and claims history as the causal drivers. These values are used to determine the insurance premiums and other related paid by Jemena on behalf of all its assets.
[C-I-C ]
Internal audit
Management of internal audits. Costs include salaries, employee related expenses, and procurement of external advice.
[C-I-C ] Method: time writing.
Reason:
Internal audit costs support Jemena’s corporate governance, which directly benefit JEN and other Jemena assets and clients.
Internal audit costs are attributed to corporate activities based on time writing.
Residual costs were allocated using time writing data. The time writing data reflects the time recorded by staff in Jemena’s systems.
[C-I-C ]
Business planning and improvement
Management of business planning and continuous improvements, including business re-organization costs. Costs include salaries, employee related expenses, procurement of external advice, and training.
[C-I-C ]
Method: time writing.
Reason:
Business planning and improvement costs support Jemena’s asset management and continuous improvement initiatives, which benefit each asset within the Jemena Group.
Business planning costs are attributed to corporate activities based on time writing.
Residual costs were allocated using time writing data. The time writing data reflects the time recorded by staff in Jemena’s systems.
[C-I-C ]

GLOSSARY
Public—29 April 2016 © Jemena Electricity Networks (Vic) Ltd 26
Cost Item
[Section 3.3(a)–(c)]
Quantum ($)
[Section 3.3(a)]
Method of allocation and reason for basis
[Section 3.3(c)]
Allocator %
Taxation
Management of indirect and direct tax compliance and planning. Costs include salaries, employee related expenses, and procurement of external advice.
[C-I-C ] Method: time writing.
Reason:
Taxation costs support Jemena’s obligations under tax law, including those of JEN.
Taxation costs are attributed to corporate activities based on time writing.
Residual costs were allocated using time writing data. The time writing data reflects the time recorded by staff in Jemena’s systems.
[C-I-C ]
Commercial
Management of commercial activities including marketing strategy, regulated tariff, revenue forecasting, market analysis & research, contract management and establishing & maintaining customer relationships. Costs include salaries, employee related expenses, and procurement of external advice.
[C-I-C ]
Method: time writing.
Reason:
Commercial costs support Jemena’s commercial obligations, including those of JEN.
Commercial costs are attributed to corporate activities based on time writing.
Residual costs are allocated using time writing data. The time writing data reflects the time recorded by staff in Jemena’s systems.
[C-I-C ]

GLOSSARY
Public—29 April 2016 © Jemena Electricity Networks (Vic) Ltd 27
3.2.1 SHARED COST ALLOCATION METHOD
70. Section 3.2(b) of Schedule 1 to the RIN requires JEN to explain the allocation method and reasons for choosing that method in relation to items identified in 3.1(b).
71. The allocation methods for each item and reasons for choosing the methods are listed in Table 3–1.
72. It is clear that where costs can be allocated using time writing they are allocated on this basis. In the case where costs cannot be allocated using this driver, costs are allocated to JEN on a specific driver or adjusted fair value driver. For example, Risk and Insurance cost centre costs are allocated based on an insurance driver (declared value).
GLOSSARY
Public—29 April 2016 © Jemena Electricity Networks (Vic) Ltd 28
4. COST ALLOCATION TO SERVICE SEGMENTS
73. In this section, JEN responds to section 4 of Schedule 1 to the RIN for the 2015 Relevant Regulatory Year.
74. JEN has applied its applicable AER approved CAM in all relevant circumstances. A copy of this CAM is provided in Attachment 1-7. Section 4.1 parts (a) and (b) of Schedule 1 to the RIN requires JEN to identify each item in the RAS that is allocated to JEN’s cost categories that is:
not allocated on a directly attributable basis but is allocated on a causation basis to a service segment and;
not allocated on a directly attributable basis and cannot be allocated on a causation basis to a service segment.
75. Section 4.2(a) and (c) of Schedule 1 to the RIN requires JEN to state, for each item identified in response to paragraph 4.1(a), the quantum of the item that has been allocated and the numeric quantum of the allocators used.
76. Section 4.2(b) of Schedule 1 to the RIN requires JEN to explain the allocation method and reasons for choosing that method in relation to items identified in 4.1(a).
The items allocated to JEN on causation basis and JEN’s responses to 4.2 are listed in
77. Table 4–1: Cost allocation to service segments below.
78. Section 4.3 of Schedule 1 to the RIN requires JEN to state that each item in response to section 4.1(b) has not been allocated on a directly attributable basis and cannot be allocated on a causation basis from the distribution business to a service segment.
79. This requirement is not applicable as there are no instances in JEN’s response where operating, maintenance and fixed asset costs were not allocated to an activity area in part on a directly attributable basis or on a causation basis (or both) to a service segment. All costs were allocated in a way that is consistent with JEN’s approved CAM.

GLOSSARY
Public—29 April 2016 © Jemena Electricity Networks (Vic) Ltd 29
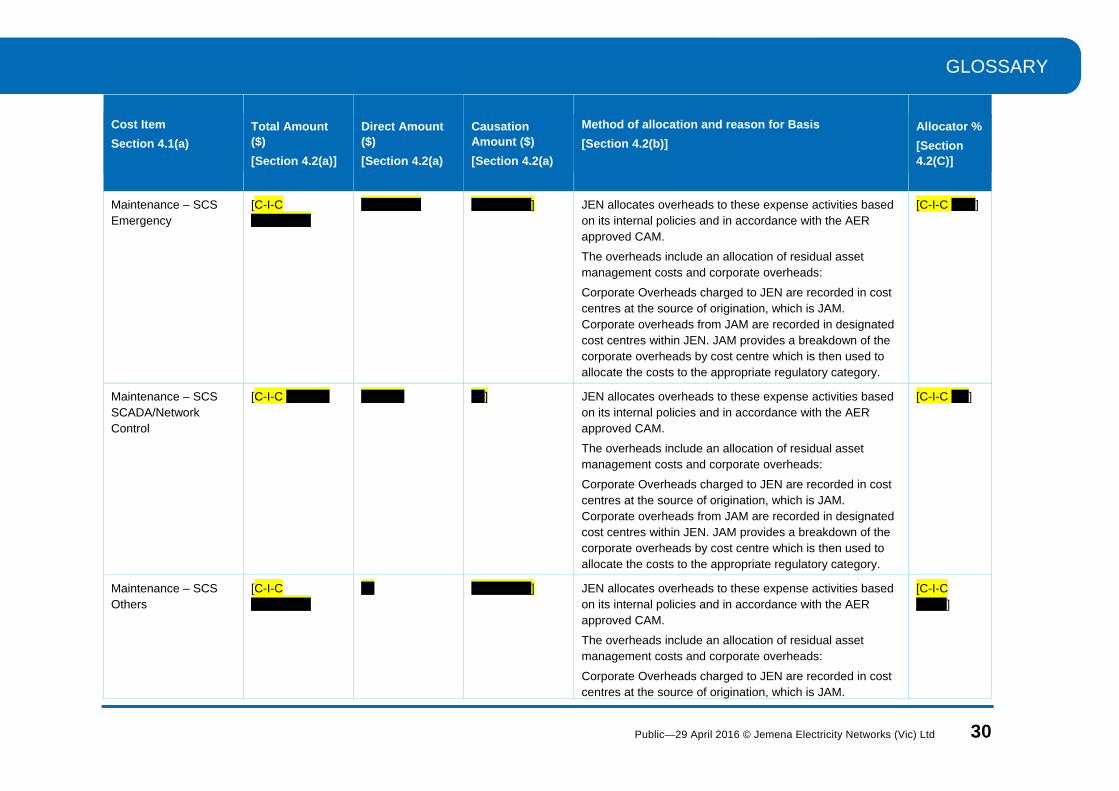
Table 4–1: Cost allocation to service segments
Cost Item
Section 4.1(a)
Total Amount ($)
[Section 4.2(a)]
Direct Amount ($)
[Section 4.2(a)
Causation Amount ($)
[Section 4.2(a)
Method of allocation and reason for Basis
[Section 4.2(b)]
Allocator %
[Section 4.2(C)]
Maintenance – SCS Routine
[C-I-C
] JEN allocates overheads to these expense activities based on its internal policies and in accordance with the AER approved Cost Allocation Method (CAM).
The overheads include an allocation of residual asset management costs and corporate overheads:
Corporate Overheads charged to JEN are recorded in cost centres at the source of origination, which is Jemena Asset Management Pty Ltd (JAM). Corporate overheads from JAM are recorded in designated cost centres within JEN. JAM provides a breakdown of the corporate overheads by cost centre which is then used to allocate the costs to the appropriate regulatory category.
[C-I-C ]
Maintenance – SCS Condition Based
[C-I-C
] JEN allocates overheads to these expense activities based on its internal policies and in accordance with the AER approved CAM.
The overheads include an allocation of residual asset management costs and corporate overheads:
Corporate Overheads charged to JEN are recorded in cost centres at the source of origination, which is JAM. Corporate overheads from JAM are recorded in designated cost centres within JEN. JAM provides a breakdown of the corporate overheads by cost centre which is then used to allocate the costs to the appropriate regulatory category.
[C-I-C ]
GLOSSARY
Public—29 April 2016 © Jemena Electricity Networks (Vic) Ltd 30
Cost Item
Section 4.1(a)
Total Amount ($)
[Section 4.2(a)]
Direct Amount ($)
[Section 4.2(a)
Causation Amount ($)
[Section 4.2(a)
Method of allocation and reason for Basis
[Section 4.2(b)]
Allocator %
[Section 4.2(C)]
Maintenance – SCS Emergency
[C-I-C
] JEN allocates overheads to these expense activities based on its internal policies and in accordance with the AER approved CAM.
The overheads include an allocation of residual asset management costs and corporate overheads:
Corporate Overheads charged to JEN are recorded in cost centres at the source of origination, which is JAM. Corporate overheads from JAM are recorded in designated cost centres within JEN. JAM provides a breakdown of the corporate overheads by cost centre which is then used to allocate the costs to the appropriate regulatory category.
[C-I-C ]
Maintenance – SCS SCADA/Network Control
[C-I-C ] JEN allocates overheads to these expense activities based on its internal policies and in accordance with the AER approved CAM.
The overheads include an allocation of residual asset management costs and corporate overheads:
Corporate Overheads charged to JEN are recorded in cost centres at the source of origination, which is JAM. Corporate overheads from JAM are recorded in designated cost centres within JEN. JAM provides a breakdown of the corporate overheads by cost centre which is then used to allocate the costs to the appropriate regulatory category.
[C-I-C ]
Maintenance – SCS Others
[C-I-C
] JEN allocates overheads to these expense activities based on its internal policies and in accordance with the AER approved CAM.
The overheads include an allocation of residual asset management costs and corporate overheads:
Corporate Overheads charged to JEN are recorded in cost centres at the source of origination, which is JAM.
[C-I-C ]

GLOSSARY
Public—29 April 2016 © Jemena Electricity Networks (Vic) Ltd 31
Cost Item
Section 4.1(a)
Total Amount ($)
[Section 4.2(a)]
Direct Amount ($)
[Section 4.2(a)
Causation Amount ($)
[Section 4.2(a)
Method of allocation and reason for Basis
[Section 4.2(b)]
Allocator %
[Section 4.2(C)]
Corporate overheads from JAM are recorded in designated cost centres within JEN. JAM provides a breakdown of the corporate overheads by cost centre which is then used to allocate the costs to the appropriate regulatory category.
AMI [C-I-C
] JEN allocates overheads to these expense activities based on its internal policies and in accordance with the AER approved CAM.
The overheads include an allocation of residual asset management costs and corporate overheads:
Corporate Overheads charged to JEN are recorded in cost centres at the source of origination, which is JAM. Corporate overheads from JAM are recorded in designated cost centres within JEN. JAM provides a breakdown of the corporate overheads by cost centre which is then used to allocate the costs to the appropriate regulatory category.
[C-I-C ]
Public Lighting Costs [C-I-C
] JEN allocates overheads to these expense activities based on its internal policies and in accordance with the AER approved CAM.
The overheads include an allocation of residual asset management costs and corporate overheads:
Corporate Overheads charged to JEN are recorded in cost centres at the source of origination, which is JAM. Corporate overheads from JAM are recorded in designated cost centres within JEN. JAM provides a breakdown of the corporate overheads by cost centre which is then used to allocate the costs to the appropriate regulatory category.
[C-I-C ]
Alternative Control Costs- Other
[C-I-C ] JEN allocates overheads to these expense activities based on its internal policies and in accordance with the AER approved CAM.
[C-I-C ]

GLOSSARY
Public—29 April 2016 © Jemena Electricity Networks (Vic) Ltd 32
Cost Item
Section 4.1(a)
Total Amount ($)
[Section 4.2(a)]
Direct Amount ($)
[Section 4.2(a)
Causation Amount ($)
[Section 4.2(a)
Method of allocation and reason for Basis
[Section 4.2(b)]
Allocator %
[Section 4.2(C)]
The overheads include an allocation of residual asset management costs and corporate overheads:
Corporate Overheads charged to JEN are recorded in cost centres at the source of origination, which is JAM. Corporate overheads from JAM are recorded in designated cost centres within JEN. JAM provides a breakdown of the corporate overheads by cost centre which is then used to allocate the costs to the appropriate regulatory category.
Network Operating Costs
[C-I-C
] JEN allocates overheads to these expense activities based on its internal policies and in accordance with the AER approved CAM.
The overheads include an allocation of residual asset management costs and corporate overheads:
Corporate Overheads charged to JEN are recorded in cost centres at the source of origination, which is JAM. Corporate overheads from JAM are recorded in designated cost centres within JEN. JAM provides a breakdown of the corporate overheads by cost centre which is then used to allocate the costs to the appropriate regulatory category.
[C-I-C ]
Billing & Revenue Collection Costs
[C-I-C ] JEN allocates overheads to these expense activities based on its internal policies and in accordance with the AER approved CAM.
The overheads include an allocation of residual asset management costs and corporate overheads:
Corporate Overheads charged to JEN are recorded in cost centres at the source of origination, which is JAM. Corporate overheads from JAM are recorded in designated cost centres within JEN. JAM provides a breakdown of the corporate overheads by cost centre which is then used to
[C-I-C ]

GLOSSARY
Public—29 April 2016 © Jemena Electricity Networks (Vic) Ltd 33
Cost Item
Section 4.1(a)
Total Amount ($)
[Section 4.2(a)]
Direct Amount ($)
[Section 4.2(a)
Causation Amount ($)
[Section 4.2(a)
Method of allocation and reason for Basis
[Section 4.2(b)]
Allocator %
[Section 4.2(C)]
allocate the costs to the appropriate regulatory category.
Advertising & Marketing Costs
[C-I-C ] JEN allocates overheads to these expense activities based on its internal policies and in accordance with the AER approved CAM.
The overheads include an allocation of residual asset management costs and corporate overheads:
Corporate Overheads charged to JEN are recorded in cost centres at the source of origination, which is JAM. Corporate overheads from JAM are recorded in designated cost centres within JEN. JAM provides a breakdown of the corporate overheads by cost centre which is then used to allocate the costs to the appropriate regulatory category.
[C-I-C ]
Customer Service Costs
[C-I-C
] JEN allocates overheads to these expense activities based on its internal policies and in accordance with the AER approved CAM.
The overheads include an allocation of residual asset management costs and corporate overheads:
Corporate Overheads charged to JEN are recorded in cost centres at the source of origination, which is JAM. Corporate overheads from JAM are recorded in designated cost centres within JEN. JAM provides a breakdown of the corporate overheads by cost centre which is then used to allocate the costs to the appropriate regulatory category.
[C-I-C ]
Regulatory Costs [C-I-C
] JEN allocates overheads to these expense activities based on its internal policies and in accordance with the AER approved CAM.
The overheads include an allocation of residual asset management costs and corporate overheads:
[C-I-C ]

GLOSSARY
Public—29 April 2016 © Jemena Electricity Networks (Vic) Ltd 34
Cost Item
Section 4.1(a)
Total Amount ($)
[Section 4.2(a)]
Direct Amount ($)
[Section 4.2(a)
Causation Amount ($)
[Section 4.2(a)
Method of allocation and reason for Basis
[Section 4.2(b)]
Allocator %
[Section 4.2(C)]
Corporate Overheads charged to JEN are recorded in cost centres at the source of origination, which is JAM. Corporate overheads from JAM are recorded in designated cost centres within JEN. JAM provides a breakdown of the corporate overheads by cost centre which is then used to allocate the costs to the appropriate regulatory category.
Regulatory Reset Costs
[C-I-C
] Directly charged. [C-I-C ]
Information Technology Costs
[C-I-C
] JEN allocates overheads to these expense activities based on its internal policies and in accordance with the AER approved CAM.
The overheads include an allocation of residual asset management costs and corporate overheads:
Corporate Overheads charged to JEN are recorded in cost centres at the source of origination, which is JAM. Corporate overheads from JAM are recorded in designated cost centres within JEN. JAM provides a breakdown of the corporate overheads by cost centre which is then used to allocate the costs to the appropriate regulatory category.
[C-I-C ]
License Fees [C-I-C ] Directly charged. [C-I-C ]
GSL Payments [C-I-C ] Directly charged. [C-I-C ]
Other Standard Control Services
[C-I-C
] JEN allocates overheads to these expense activities based on its internal policies and in accordance with the AER approved CAM.
The overheads include an allocation of residual asset management costs and corporate overheads:
Corporate Overheads charged to JEN are recorded in cost centres at the source of origination, which is JAM.
[C-I-C ]

GLOSSARY
Public—29 April 2016 © Jemena Electricity Networks (Vic) Ltd 35
Cost Item
Section 4.1(a)
Total Amount ($)
[Section 4.2(a)]
Direct Amount ($)
[Section 4.2(a)
Causation Amount ($)
[Section 4.2(a)
Method of allocation and reason for Basis
[Section 4.2(b)]
Allocator %
[Section 4.2(C)]
Corporate overheads from JAM are recorded in designated cost centres within JEN. JAM provides a breakdown of the corporate overheads by cost centre which is then used to allocate the costs to the appropriate regulatory category.
AMI [C-I-C
] Directly charged. [C-I-C ]
Public Lighting [C-I-C ] JEN allocates overheads to these expense activities based on its internal policies and in accordance with the AER approved CAM.
The overheads include an allocation of residual asset management costs and corporate overheads:
Corporate Overheads charged to JEN are recorded in cost centres at the source of origination, which is JAM. Corporate overheads from JAM are recorded in designated cost centres within JEN. JAM provides a breakdown of the corporate overheads by cost centre which is then used to allocate the costs to the appropriate regulatory category.
[C-I-C ]
Alternative Control – Other
[C-I-C
] JEN allocates overheads to these expense activities based on its internal policies and in accordance with the AER approved CAM.
The overheads include an allocation of residual asset management costs and corporate overheads:
Corporate Overheads charged to JEN are recorded in cost centres at the source of origination, which is JAM. Corporate overheads from JAM are recorded in designated cost centres within JEN. JAM provides a breakdown of the corporate overheads by cost centre which is then used to allocate the costs to the appropriate regulatory category.
[C-I-C ]

GLOSSARY
Public—29 April 2016 © Jemena Electricity Networks (Vic) Ltd 36
Cost Item
Section 4.1(a)
Total Amount ($)
[Section 4.2(a)]
Direct Amount ($)
[Section 4.2(a)
Causation Amount ($)
[Section 4.2(a)
Method of allocation and reason for Basis
[Section 4.2(b)]
Allocator %
[Section 4.2(C)]
Unregulated Services [C-I-C ] Directly charged. [C-I-C ]
CAPEX – Reinforcement
[C-I-C
] JEN allocates overheads to these expense activities based on its internal policies and in accordance with the AER approved CAM.
The overheads include an allocation of residual asset management costs and corporate overheads:
Corporate Overheads charged to JEN are recorded in cost centres at the source of origination, which is JAM. Corporate overheads from JAM are recorded in designated cost centres within JEN. JAM provides a breakdown of the corporate overheads by cost centre which is then used to allocate the costs to the appropriate regulatory category.
[C-I-C ]
CAPEX – New Customer Connections
[C-I-C
] JEN allocates overheads to these expense activities based on its internal policies and in accordance with the AER approved CAM.
The overheads include an allocation of residual asset management costs and corporate overheads:
Corporate Overheads charged to JEN are recorded in cost centres at the source of origination, which is JAM. Corporate overheads from JAM are recorded in designated cost centres within JEN. JAM provides a breakdown of the corporate overheads by cost centre which is then used to allocate the costs to the appropriate regulatory category.
[C-I-C ]
CAPEX – Reliability & Quality Maintained
[C-I-C
] JEN allocates overheads to these expense activities based on its internal policies and in accordance with the AER approved CAM.
The overheads include an allocation of residual asset management costs and corporate overheads:
[C-I-C ]

GLOSSARY
Public—29 April 2016 © Jemena Electricity Networks (Vic) Ltd 37
Cost Item
Section 4.1(a)
Total Amount ($)
[Section 4.2(a)]
Direct Amount ($)
[Section 4.2(a)
Causation Amount ($)
[Section 4.2(a)
Method of allocation and reason for Basis
[Section 4.2(b)]
Allocator %
[Section 4.2(C)]
Corporate Overheads charged to JEN are recorded in cost centres at the source of origination, which is JAM. Corporate overheads from JAM are recorded in designated cost centres within JEN. JAM provides a breakdown of the corporate overheads by cost centre which is then used to allocate the costs to the appropriate regulatory category.
CAPEX – Environment Safety & Legal
[C-I-C
] JEN allocates overheads to these expense activities based on its internal policies and in accordance with the AER approved CAM.
The overheads include an allocation of residual asset management costs and corporate overheads:
Corporate Overheads charged to JEN are recorded in cost centres at the source of origination, which is JAM. Corporate overheads from JAM are recorded in designated cost centres within JEN. JAM provides a breakdown of the corporate overheads by cost centre which is then used to allocate the costs to the appropriate regulatory category.
[C-I-C ]
CAPEX SCADA/Network Control
[C-I-C ] JEN allocates overheads to these expense activities based on its internal policies and in accordance with the AER approved CAM.
The overheads include an allocation of residual asset management costs and corporate overheads:
Corporate Overheads charged to JEN are recorded in cost centres at the source of origination, which is JAM. Corporate overheads from JAM are recorded in designated cost centres within JEN. JAM provides a breakdown of the corporate overheads by cost centre which is then used to allocate the costs to the appropriate regulatory category.
[C-I-C ]
CAPEX – Non Network [C-I-C ] Directly charged. [C-I-C ]

GLOSSARY
Public—29 April 2016 © Jemena Electricity Networks (Vic) Ltd 38
Cost Item
Section 4.1(a)
Total Amount ($)
[Section 4.2(a)]
Direct Amount ($)
[Section 4.2(a)
Causation Amount ($)
[Section 4.2(a)
Method of allocation and reason for Basis
[Section 4.2(b)]
Allocator %
[Section 4.2(C)]
General – IT
CAPEX – Non Network General – Other
[C-I-C
] JEN allocates overheads to these expense activities based on its internal policies and in accordance with the AER approved CAM.
The overheads include an allocation of residual asset management costs and corporate overheads:
Corporate Overheads charged to JEN are recorded in cost centres at the source of origination, which is JAM. Corporate overheads from JAM are recorded in designated cost centres within JEN. JAM provides a breakdown of the corporate overheads by cost centre which is then used to allocate the costs to the appropriate regulatory category.
[C-I-C ]
CAPEX - AMI [C-I-C
] Directly charged. [C-I-C ]
CAPEX - Public Lighting
[C-I-C
] JEN allocates overheads to these expense activities based on its internal policies and in accordance with the AER approved CAM.
The overheads include an allocation of residual asset management costs and corporate overheads:
Corporate Overheads charged to JEN are recorded in cost centres at the source of origination, which is JAM. Corporate overheads from JAM are recorded in designated cost centres within JEN. JAM provides a breakdown of the corporate overheads by cost centre which is then used to allocate the costs to the appropriate regulatory category.
[C-I-C ]
CAPEX Alternative Control Other
[C-I-C
] JEN allocates overheads to these expense activities based on its internal policies and in accordance with the AER approved CAM.
[C-I-C ]

GLOSSARY
Public—29 April 2016 © Jemena Electricity Networks (Vic) Ltd 39
Cost Item
Section 4.1(a)
Total Amount ($)
[Section 4.2(a)]
Direct Amount ($)
[Section 4.2(a)
Causation Amount ($)
[Section 4.2(a)
Method of allocation and reason for Basis
[Section 4.2(b)]
Allocator %
[Section 4.2(C)]
The overheads include an allocation of residual asset management costs and corporate overheads:
Corporate Overheads charged to JEN are recorded in cost centres at the source of origination, which is JAM. Corporate overheads from JAM are recorded in designated cost centres within JEN. JAM provides a breakdown of the corporate overheads by cost centre which is then used to allocate the costs to the appropriate regulatory category.
CAPEX Negotiated Services
[C-I-C
] JEN allocates overheads to these expense activities based on its internal policies and in accordance with the AER approved CAM.
The overheads include an allocation of residual asset management costs and corporate overheads:
Corporate Overheads charged to JEN are recorded in cost centres at the source of origination, which is JAM. Corporate overheads from JAM are recorded in designated cost centres within JEN. JAM provides a breakdown of the corporate overheads by cost centre which is then used to allocate the costs to the appropriate regulatory category.
[C-I-C ]
CAPEX Unregulated Services
[C-I-C ] JEN allocates overheads to these expense activities based on its internal policies and in accordance with the AER approved CAM.
The overheads include an allocation of residual asset management costs and corporate overheads:
Corporate Overheads charged to JEN are recorded in cost centres at the source of origination, which is JAM. Corporate overheads from JAM are recorded in designated cost centres within JEN. JAM provides a breakdown of the corporate overheads by cost centre which is then used to
[C-I-C ]
GLOSSARY
Public—29 April 2016 © Jemena Electricity Networks (Vic) Ltd 40
Cost Item
Section 4.1(a)
Total Amount ($)
[Section 4.2(a)]
Direct Amount ($)
[Section 4.2(a)
Causation Amount ($)
[Section 4.2(a)
Method of allocation and reason for Basis
[Section 4.2(b)]
Allocator %
[Section 4.2(C)]
allocate the costs to the appropriate regulatory category.

GLOSSARY
Public—29 April 2016 © Jemena Electricity Networks (Vic) Ltd 41
5. RELATED PARTY TRANSACTIONS
80. In this section, JEN responds to section 5 of Schedule 1 to the RIN for the 2015 Relevant Regulatory Year.
5.1 RELATED PARTIES
81. Section 5.1 of Schedule 1 to the RIN requires JEN to identify each of JEN’s Related Parties that JEN has conducted a transaction with (during the Relevant Regulatory Year). A definition of Related party is set out in the RIN. . The Related Party entities JEN directly transacts with are:
Jemena Asset Management Pty Ltd (JAM) (ACN 086 013 461)
Jemena Ltd (JEM) (ACN 052 167 405)
AusNet Services (Distribution) Ltd (AusNet Distribution) (ACN 108 788 245), and
AusNet Transmission Group Pty Ltd (AusNet Transmission) (ACN 079 798 173).
82. Since 2009, JEN has procured core network operations and maintenance services by way of its Asset Management Agreement (AMA) with JAM. Since 1 April 2012, JAM has only been entitled to receive its actual costs in performing the AMA services with no related party margin payable under the AMA. The amendments to the AMA, to remove the margin, were described in the 2012 JEN annual RIN submission.
83. [c-i-c
].
5.2 RELATED PARTY TRANSACTIONS
85. Section 5.2 of Schedule 1 to the RIN requires JEN to identify each transaction relating to the provision of standard control services, alternative control services, advanced metering infrastructure (AMI), or negotiated distribution services between JEN and a Related Party, where the transaction amount is greater than five percent of the relevant total expenditure or revenue category. Relevant categories are standard control revenues, alternative control revenues, AMI revenues, negotiated distribution services revenues, standard control capex, alternative control capex, AMI capex, standard control operation expenditure, standard control maintenance expenditure, alternative control operation expenditure, alternative control maintenance expenditure, AMI operations expenditure, AMI maintenance expenditure and negotiated distribution service expenditure.
86. The Related Parties JEN has directly transacted with in the Relevent Regualtory Year are listed in Table 5–1.

GLOSSARY
Table 5–1: Related Party transactions - 2015
Name of Related Party Services Provided Capex
$000
Opex
$000
Jemena Ltd Management Services [C-I-C [C-I-C
Jemena Asset Management Pty Ltd Management Services [C-I-C [C-I-C ]
87. Taking the approach of substance over form, JEN has not included its transactions with AusNet Distribution and AusNet Transmission (covering cross boundary charges and transmission services) as the prices of these transactions are regulated by the AER and have therefore already been assessed as efficient. Consistent with this approach, details of transactions with Ausnet Distribution and Ausnet Transmission have also been excluded from JEN’s responses in section 5.3 below.
5.3 INFORMATION ON RELATED PARTY TRANSACTIONS
5.3.1 NAME OF RELATED PARTY
Section 5.3(a) of Schedule 1 to the RIN requires JEN to state the name of the Related Party for each transaction identified in the response to Section 5.2 of Schedule 1 to the RIN. The names of the Related Parties are listed in Table 5–1.
5.3.2 COUNTER PARTY
88. Section 5.3(b) of Schedule 1 to the RIN also requires JEN to identify other counter parties involved in the transactions identified. JEN advises that there are no other counter parties involved in the transactions identified.
5.3.3 NATURE AND PURPOSE OF RELATED PARTY TRANSACTIONS
89. Section 5.3(c) of Schedule 1 to the RIN requires JEN to explain the nature and purpose of the transaction, including the good(s) or service(s) provided by the Related Party.
[c-i-c5
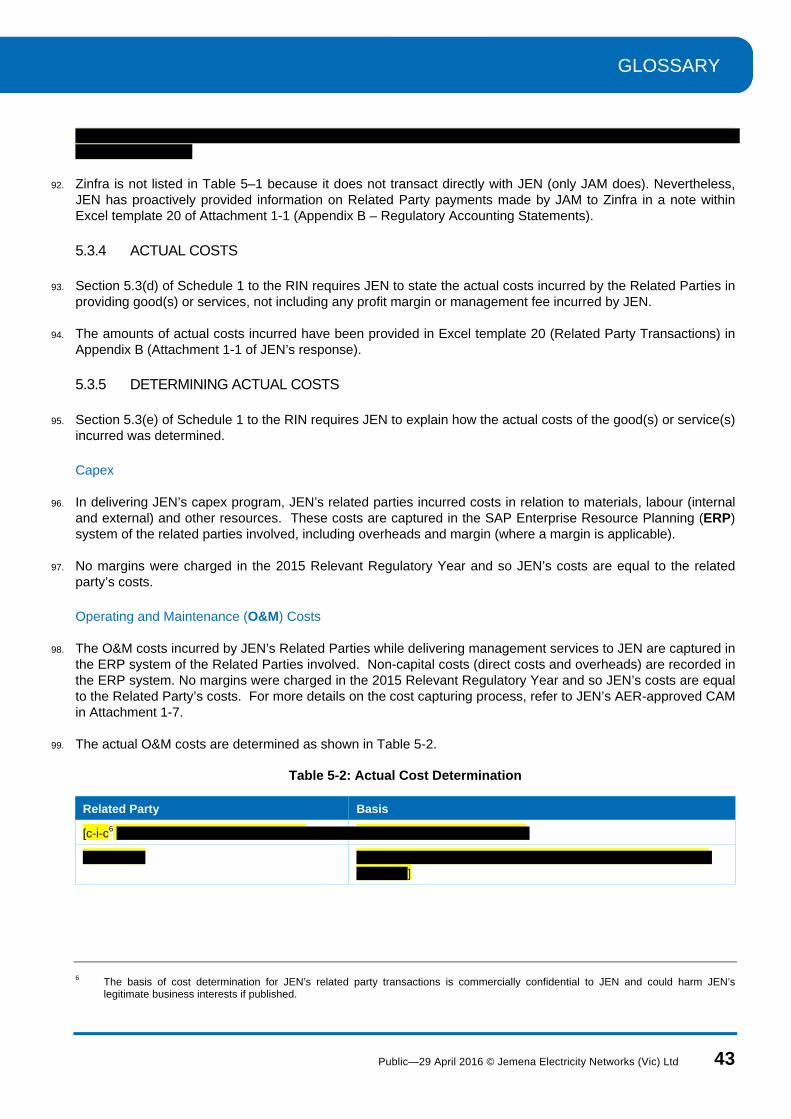
GLOSSARY
Public—29 April 2016 © Jemena Electricity Networks (Vic) Ltd 43
92. Zinfra is not listed in Table 5–1 because it does not transact directly with JEN (only JAM does). Nevertheless, JEN has proactively provided information on Related Party payments made by JAM to Zinfra in a note within Excel template 20 of Attachment 1-1 (Appendix B – Regulatory Accounting Statements).
5.3.4 ACTUAL COSTS
93. Section 5.3(d) of Schedule 1 to the RIN requires JEN to state the actual costs incurred by the Related Parties in providing good(s) or services, not including any profit margin or management fee incurred by JEN.
94. The amounts of actual costs incurred have been provided in Excel template 20 (Related Party Transactions) in Appendix B (Attachment 1-1 of JEN’s response).
5.3.5 DETERMINING ACTUAL COSTS
95. Section 5.3(e) of Schedule 1 to the RIN requires JEN to explain how the actual costs of the good(s) or service(s) incurred was determined.
Capex
96. In delivering JEN’s capex program, JEN’s related parties incurred costs in relation to materials, labour (internal and external) and other resources. These costs are captured in the SAP Enterprise Resource Planning (ERP) system of the related parties involved, including overheads and margin (where a margin is applicable).
97. No margins were charged in the 2015 Relevant Regulatory Year and so JEN’s costs are equal to the related party’s costs.
Operating and Maintenance (O&M) Costs
98. The O&M costs incurred by JEN’s Related Parties while delivering management services to JEN are captured in the ERP system of the Related Parties involved. Non-capital costs (direct costs and overheads) are recorded in the ERP system. No margins were charged in the 2015 Relevant Regulatory Year and so JEN’s costs are equal to the Related Party’s costs. For more details on the cost capturing process, refer to JEN’s AER-approved CAM in Attachment 1-7.
99. The actual O&M costs are determined as shown in Table 5-2.
Table 5-2: Actual Cost Determination
Related Party Basis
[c-i-c6
]
6 The basis of cost determination for JEN’s related party transactions is commercially confidential to JEN and could harm JEN’s
legitimate business interests if published.

GLOSSARY
Public—29 April 2016 © Jemena Electricity Networks (Vic) Ltd 44
5.3.6 REGULATORY REPORTING
100. Section 5.3(f) of Schedule 1 to the RIN requires JEN to explain how the actual costs of the good(s) or service(s) incurred is (are) reflected in the Regulatory Accounting Statements (RAS).
101. Actual costs (not including any Related Party margin) have been reported in the RAS as set out in Table 5-3.
Table 5-3: Related party cost reporting in RAS
Templates in Appendix B (Attachment 1-1 of JEN’s response) Table Categories
6a (maintenance costs total,) 1 and 3 All
8a (operating activities total,) 1 Operating Costs
3a (capex total) 1, 3, 4 , 5 & 6 All
5 (addition by Tax) 1 - 3 Additions
20 (Related Party transactions) 1 All
5.3.7 ALLOCATING RELATED PARTY TRANSACTION COSTS
102. Section 5.3(g) of Schedule 1 to the RIN requires JEN to identify the Asset category, Maintenance Cost category or Operating Cost category to which the actual cost(s) is allocated.
103. Lists of Asset Cost categories, Maintenance Cost categories and Operating Cost categories are set out in Table 5-4.
Table 5-4: Cost categories vs. actual cost allocations
Operating Costs Maintenance Costs Addition to fixed assets
Network operating Routine Reinforcement
Billing & revenue collection Condition based New customer connections
Advertising/marketing Emergency RQM
Customer service SCADA/network control Environmental, safety & legal
Regulatory Other Non network – IT/SCADA
AMI AMI Non network - other
Public lighting Public lighting AMI
ACS ACS Public lighting
Unregulated services ACS/Fee & quoted
IT Negotiated services
Licence fee/GSL/Other SCS Unregulated services
5.3.8 ALLOCATORS AND ALLOCATION BASIS
104. Section 5.3(h) of Schedule 1 to the RIN requires JEN to explain the basis upon which the actual costs of the good(s) or service(s) was or were allocated, as identified in the response to paragraph (g), and state the quantum of any allocator applied.

GLOSSARY
Public—29 April 2016 © Jemena Electricity Networks (Vic) Ltd 45
105. In accordance with the RIN, JEN reports the actual costs attributable to JEN for each Related Party transaction.
106. Where costs that can be directly attributable to an Asset Cost, Operating Cost or Maintenance Cost category (e.g. via general ledger account code or activity code), they are allocated in that category.
107. Where costs cannot be directly attributable, they are allocated to various categories in accordance with the shared cost allocation method, as set out in the CAM.
108. JEN is not able to provide the allocator by which related party transaction charges have been allocated, as JEN’s allocators do not apply specifically to related party costs—rather related party costs are just one component of JEN’s wider cost base, which is allocated using a range of allocators. However, JEN is able to provide an estimate of the proportion of related party transaction charges allocated to the fixed asset, maintenance and operating cost categories. This is JEN’s best estimate because JEN is not aware of a superior estimation method. Table 5-5 lists the proportion and the respective basis.
Table 5-5 Allocating related party costs
Related Party Cost categories Allocator Basis
Jemena Asset Management Pty Ltd Operating Costs [c-i-c 7
Network operating
Billing & Revenue Collection
Advertising & Marketing
Customer Service
Regulatory / Regulatory Reset
IT
Licence fee / GSL
Other - SCS
AMI
Public Lighting
ACS - Other
Unregulated services
Maintenance Costs 2
Routine / Condition based / Emergency / SCADA/Network Control / Public Lighting
Other – ACS / SCS
AMI
Addition to Fixed Assets
7 The allocator basis and value of allocated related party costs are commercially confidential to JEN and could harm JEN’s legitimate
business interests if published.

GLOSSARY
Public—29 April 2016 © Jemena Electricity Networks (Vic) Ltd 46
Related Party Cost categories Allocator Basis
Reinforcement
New Customer Connections
Reliability & Quality Maintained
Environmental, Safety & Legal
Non network general - IT
Non network general - other
AMI
Public Lighting
Other - Alternate Control Services
Negotiated Services
Jemena Ltd Operating Costs
Network Operating Costs
Regulatory
IT
Other - SCS
Maintenance Costs
Other - SCS
Addition to Fixed Assets
SCADA/Network Control
Non Network General – IT
Non network general - other
AMI
Other - Alternate Control Services ]

GLOSSARY
Public—29 April 2016 © Jemena Electricity Networks (Vic) Ltd 47
6. CAPITALISATION POLICY
6.1 CHANGES IN CAPITALISATION POLICY STATEMENT
109. Section 6.1 of Schedule 1 to the RIN requires JEN to identify all changes between the capitalisation policy statements provided in response to Section 1.1(e) of Schedule 1 to the RIN.
110. JEN advises that there was no change to its capitalisation policy for the Relevant Regulatory Year ending 31 December 2015. JEN has attached its current capitalisation policy at Attachment 1-6 of JEN’s response.
6.2 IMPACT OF CHANGE
111. As stated in section 6.1 of JEN’s response, there was no change to its capitalisation policy for 2015. Therefore, Section 6.2 of Schedule 1 to the RIN is not applicable.

GLOSSARY
Public—29 April 2016 © Jemena Electricity Networks (Vic) Ltd 48
7. DEMAND MANAGEMENT INCENTIVE ALLOWANCE (DMIA)
112. In this section, JEN responds to section 7 of Schedule 1 to the RIN for the 2015 Relevant Regulatory Year.
7.1 IDENTIFICATION OF DEMAND MANAGEMENT PROJECTS OR PROGRAMS
113. Section 7.1 of Schedule 1 to the RIN requires JEN to identify each demand management project or program which JEN seeks approval of:
114. JEN seeks approval for four projects for the 2015 Regulatory Year;
1. Demand Response Field Trial – Phase 1
JEN initiated a Demand Response Field Trial (DRFT) project in 2014 to develop our understanding of the benefits, costs, pricing / commercial arrangements and operational structures of customer controlled demand response (DR) programs. The project which included model development and desktop analysis continued into the 2015 Regulatory Year and was completed in January 2015.
2. Demand Response Trial Project on 22kV Feeder BD-13 (Phase 1)
In 2015 JEN undertook a desktop study of controlling the demand of commercial and industrial customers on one of our 22kV feeders (BD-13) as a Demand Response initiative. The desktop study included high level customer screening tests, developing a draft customer DR questionnaire, network constraint analysis, hardware requirements, Information Technology (IT) requirements and training JEN staff in customer acquisition. Subject to business approval, the next phase of the project will involve signing up customers and installing hardware to trial actual demand response in 2016 and 2017.
3. Demand Management Constraint Analysis Tool (CAT)
JEN initiated the development of a Demand Management Constraint Analysis Tool (CAT) in 2015. The software tool allows network planning engineers to undertake a consistent and objective cost benefit analysis of multiple network and non-network options. Development of the tool, which comes with advanced modelling features, continued into the 2016 Regulatory Year.
4. Grid Battery Energy Storage System Feasibility and Concept Design Study
JEN has undertaken a feasibility study into deploying a Grid Battery Energy Storage System (GESS) as a peak shaving technology and assessed its capability in economically addressing capacity constraints in a selected part of JEN. The project, which includes model development and desktop analysis, was completed in January 2016.
7.2 DETAILED INFORMATION – DEMAND RESPONSE FIELD TRIAL, PHASE 1
115. Section 7.2 of Schedule 1 to the RIN requires JEN to provide detailed information for each demand management project or program identified in response to section 7.1 of Schedule 1 to the RIN.

GLOSSARY
Public—29 April 2016 © Jemena Electricity Networks (Vic) Ltd 49
7.2.1 COMPLIANCE
116. Section 7.2(a)(i) of Schedule 1 to the RIN requires JEN to explain how JEN’s initiative complies with the DMIA criteria set out in section 3.1.3 of the Demand Management Incentive Scheme (DMIS).
117. Expenditure associated with JEN’s DRFT in Regulatory Year 2014, was approved by the AER on the basis that the DRFT meets the DMIA criteria as set out in section 3.1.3 of the DMIS. Additional expenditure was incurred in regulatory Year 2015 as this initiative was concluded in January 2015.
118. The DRFT project was initiated in 2014 to develop our understanding of the benefits, costs, pricing / commercial arrangements and operational structures of targeted demand response programmes. Phase 1 of the trial which included model development and desktop analysis continued into the 2015 Regulatory Year and was finalised in January 2015.
119. JEN considers that the continued engagement of a Demand Response technology provider in the 2015 Regulatory Year complies with DMIA criteria, set out in section 3.1.3 of the DMIS, in the following ways:
The project is aimed at developing JEN’s capabilities to reduce peak demand through customer controlled demand response projects, rather than increasing supply capacity through network augmentation (Section 3.1.3-1).
The project is a peak demand management initiative which aims to address specific network constraints by reducing demand on the network at the location and time of the constraint (Section 3.1.3-2).
The project deliverables are to prepare JEN for various elements of customer controlled demand response programs as an effective and efficient demand management solution (Section 3.1.3-3).
The project is a non-tariff based project and the costs are not recovered under any other incentive scheme (Section 3.1.3-4).
The project cost has not been recovered under other schemes. See 7.2.8 of JEN’s response for more details (Section 3.1.3-5).
The nature of expenditure is operating expenditure (Section 3.1.3-6).
7.2.2 NATURE AND SCOPE
120. Section 7.2(a)(ii) of Schedule 1 to the RIN requires JEN to explain the nature and scope of JEN’s initiative.
121. The scope of work for the Demand Response Field Trial – Phase 1 includes the following key deliverables:
DR Benefits Model
The model has the necessary parameters and structures to evaluate the benefits of applying a DR solution to better manage risk across the network; specifically the ability of DR to mitigate and transfer risk (unserved energy) in two key scenarios of network asset deferrals and outage risk transfer. The pricing model described below estimates the costs of building up and operating a DR program for these two scenarios and together with the benefits the model will determine the economic viability of the solution.
DR Pricing Model

GLOSSARY
Public—29 April 2016 © Jemena Electricity Networks (Vic) Ltd 50
The pricing model for a demand response solution includes the relevant pricing points for different classes of customers. The pricing model is developed in a form that JEN can iterate and use to determine pricing for different customer classifications in future pricing assessment of demand response solutions. The pricing model is built around each MVA of the load mitigated on a sub transmission line, associated zone substations and / or HV feeder circuits.
DR Operating Structures
The end-to-end operating structures for a typical DR solution includes options for pre- and post-contingency response, notice period, sales, contracting of load, site monitoring installations, dispatch operations, verification and settlements and implementation timeline.
122. The nature of the project is to develop our understanding of the benefits, costs, pricing / commercial arrangements and operational structures of customer controlled DR programs.
123. JEN engaged a Demand Response technology provider as a consultant to provide the deliverables in the Phase 1 project scope.
7.2.3 AIMS AND EXPECTATIONS
124. Section 7.2(a)(iii) of Schedule 1 to the RIN requires JEN to explain the aims and expectations of JEN’s initiative.
125. The aims and expectations of the Demand Response Field Trial - Phase 1 project are to:
Understand the benefits, costs and operating structures of DR as a viable demand management solution;
Investigate DR for possible future implementation within the JEN electricity network with the objective of deferring network augmentation works or mitigating network outage risk;
Develop JEN’s capabilities in the area so as to facilitate the evaluation and implementation of DR solutions from various market providers, especially in response to JEN’s regulatory investment test (RIT-D) process for large capital projects; and
Lay the foundation for the Demand Response field trial on a 22kV feeder (BD-13), which is aimed at field trialling the learnings and validating the models developed in Phase 1.
7.2.4 SELECTION PROCESS
126. Section 7.2(a)(iv) of Schedule 1 to the RIN requires JEN to explain the process by which JEN’s project was selected, including its business case and consideration of any alternatives.
127. Advances in demand management technologies and approaches represent an opportunity for JEN to manage and transfer risk in ways that have not previously been possible. By undertaking this project, JEN intends to develop and refine its approach and strategy on demand management to provide safe, reliable and cost effective solutions to its customers.
128. DR allows JEN to better manage risk across its network. The economics of doing so and specifically the ability of DR to mitigate and transfer risk (unserved energy) in two key scenarios are investigated; namely network asset deferrals and improving network reliability.
129. JEN can leverage DR to transfer network risk to customers both before and during outages reducing the overall costs of network operation. Regardless of the asset used to undertake DR (customer side generation, curtailment or storage) effective risk transfer can be achieved through DR. The cost effectiveness of risk transfer is driven by the ability of the available customer base, DR technologies, and business processes with a fast enough reaction time to mitigate the impact of network outages.

GLOSSARY
Public—29 April 2016 © Jemena Electricity Networks (Vic) Ltd 51
130. Any operating and contractual model implemented by JEN must be structured in such a way as to allow effective management of DR programs that support asset deferral and network reliability. The effective use of DR as a tool to support network reliability is clearly aligned to business as usual activities for network controllers as it requires a high degree of visibility and control. Likewise, utilizing DR for asset deferral can help JEN achieve the best possible economic outcome for its customers, while maintaining the same level of network reliability. Both scenarios that were investigated conform to the AER’s DMIS criteria and are in line with the recommendations from the AEMC’s Power of Choice review.
7.2.5 IMPLEMENTATION
131. Section 7.2(a)(v) of Schedule 1 to the RIN requires JEN to explain how JEN’s initiative was implemented.
132. The works associated with the Demand Response Field Trial - Phase 1 project that were completed in 2015 have been delivered as follows:
1. Reporting and Recommendations: Prepare a technical report documenting the models developed and key parameters / structures relevant for successful implementation of a DR program.
2. Develop recommendations for field trial on a 22kV feeder (BD-13) with large commercial / industrial customers.
7.2.6 IMPLEMENTATION COSTS
133. Section 7.2(a)(vi) of Schedule 1 to the RIN requires JEN to explain the implementation costs of JEN’s project.
134. The actual expenditure for the Demand Response Field Trial - Phase 1 project incurred in the 2015 Regulatory Year was $26,325, as set out in Appendix B - Template 23 (DMIS – DMIA) (Attachment 1-1 of this response to the RIN). This represented the final instalment (50%) of the contract engagement over two Regulatory Years 2014 and 2015.
7.2.7 BENEFITS
135. Section 7.2(a)(vii) of Schedule 1 to the RIN requires JEN to explain any identifiable benefits that have arisen from JEN’s project, including any off peak or peak demand reduction.
136. As the Demand Response Field Trial – Phase 1 project was limited to desktop analysis and modelling, there have been no quantifiable benefits in terms of reduction in peak demand. However, the learnings from Phase 1 will be directly applicable to Phase 2 of the project where a field trial will be conducted with large commercial / industrial customers in the JEN network, subject to business approval. It is expected that there will be quantifiable benefits in terms of peak demand reduction during the operation of Phase 2.
7.2.8 ASSOCIATED COSTS
137. Section 7.2(b) of Schedule 1 to the RIN requires JEN to state whether the costs associated with JEN’s initiative have been recovered under other schemes.
138. The associated costs for the development of the Demand Response Field Trial – Phase 1 are not:
recoverable under any other jurisdictional incentive scheme,
recoverable under any other Commonwealth or State Government scheme, and
included in the forecast capital or operating expenditure approved in the 2011-15 Distribution Determination or recovered under any other incentive scheme in that determination.

GLOSSARY
Public—29 April 2016 © Jemena Electricity Networks (Vic) Ltd 52
7.2.9 FORGONE REVENUE ASSUMPTIONS AND / OR ESTIMATES
139. Section 7.2(c) of Schedule 1 to the RIN requires JEN to explain any assumptions and/or estimates used in the calculation of forgone revenue, demonstrating the reasonableness of those assumptions and/or estimates in calculating forgone revenue, including the reasons for JEN’s decision to adjust or not to adjust for other factors and the basis for any such adjustments.
140. Phase 1 of the Demand Response Field Trial project is limited to a desktop analysis of DR as a viable DM solution and the development of appropriate models. JEN will field trial DR in Phase 2 of this project and therefore, JEN does not seek to recover forgone revenue resulting from the Demand Response Field Trial - Phase 1 project for the 2015 Regulatory Year.
141. As such, section 7.2(c) of Schedule 1 to the RIN is not applicable.
7.3 DETAILED INFORMATION – DEMAND RESPONSE TRIAL PROJECT ON 22KV FEEDER BD-13 (PHASE 1)
142. Section 7.2 of Schedule 1 to the RIN requires JEN to provide detailed information for each demand management project or program identified in response to section 7.1 of Schedule 1 to the RIN.
7.3.1 COMPLIANCE
143. Section 7.2(a)(i) of Schedule 1 to the RIN requires JEN to explain how JEN’s initiative complies with the DMIA criteria set out in section 3.1.3 of the Demand Management Incentive Scheme (DMIS).
144. JEN undertook a desktop study of controlling the demand of large commercial / industrial customers on one of our 22kV feeder BD-13 as a DR initiative in 2015 to develop our understanding of the DR technology, benefits, costs, pricing / commercial arrangements and operational structures of target customers. The project included high level customer screening tests, customer DR potential questionnaire, network constraint analysis, hardware requirements, IT requirements and training of JEN staff.
145. JEN considers that the desktop study into controlling the demand of large commercial / industrial customers in the 2015 Regulatory Year complies with DMIA criteria, set out in section 3.1.3 of the DMIS, in the following ways:
The project is aimed at developing JEN’s capabilities to reduce peak demand through customer controlled demand response projects, rather than increasing supply capacity through network augmentation (Section 3.1.3-1).
The project is a peak demand management initiative which aims to address specific network constraints by reducing demand on the network at the location and time of the constraint (Section 3.1.3-2).
The project deliverables are to prepare JEN for various elements of customer controlled demand response programs as an effective and efficient demand management solution (Section 3.1.3-3).
The project is a non-tariff based project and the costs are not recovered under any other incentive scheme (Section 3.1.3-4).
The project cost has not been recovered under other schemes. See 7.3.8 of JEN’s response for more details (Section 3.1.3-5).
The nature of expenditure is operating expenditure (Section 3.1.3-6).

GLOSSARY
Public—29 April 2016 © Jemena Electricity Networks (Vic) Ltd 53
7.3.2 NATURE AND SCOPE
146. Section 7.2(a)(ii) of Schedule 1 to the RIN requires JEN to explain the nature and scope of JEN’s initiative.
147. The scope of work for the Demand Response Trial on 22kV feeder BD-13 (Phase 1) includes the following key deliverables:
Constrained Analysis to Determine Target Area (feeder BD-13)
Assessing network risks associated with BD-13 feeder capacity constraints under various network operating scenarios, including network transfer and switching scenarios
High Level Customer Screening Test
Selecting potential commercial and industrial customers that can participate in a DR trial to be run in Regulatory Years 2016 and 2017.
Customer DR Potential Questionnaire
Developing a questionnaire that can be used to seek customers’ willingness and acceptance in participating in a potential DR initiative.
Defining Hardware and Information Technology (IT) Requirements
Defining the hardware and IT requirements for controlling the demand of customers.
Training JEN Staff
Training JEN staff to undertake demand response customer acquisition activity.
148. The nature of the project is to identify ways to control the demand of commercial and industrial customers on one of our 22kV feeders (BD-13) as a Demand Response initiative.
7.3.3 AIMS AND EXPECTATIONS
149. Section 7.2(a)(iii) of Schedule 1 to the RIN requires JEN to explain the aims and expectations of JEN’s initiative.
150. The aims and expectations of the Demand Response Field Trial - Phase 1 project are to:
Understand the hardware and IT requirements of a potential DR initiative as a viable demand management solution;
Investigate DR with the objective of deferring network augmentation works or mitigating network outage risk;
Develop JEN’s capabilities in the area so as to facilitate the evaluation and implementation of DR solutions, and
Lay the foundation for the Phase 2 of the project in 2016 and 2017, aimed at field trialling the technology with large commercial / industrial customers on feeder BD-13.

GLOSSARY
Public—29 April 2016 © Jemena Electricity Networks (Vic) Ltd 54
7.3.4 SELECTION PROCESS
151. Section 7.2(a)(iv) of Schedule 1 to the RIN requires JEN to explain the process by which JEN’s project was selected, including its business case and consideration of any alternatives.
152. Advances in demand management technologies represent an opportunity for JEN to manage and transfer risk in ways that have not previously been possible. By undertaking this project, JEN intends to field trial the DR on feeder BD-13 in 2016 and 2017 and refine its approach and strategy on demand management.
153. DR allows JEN to better manage risk across its network.
154. JEN can leverage DR to transfer network risk to customers both before and during outages reducing the overall costs of network operation. Regardless of the asset used to undertake DR (customer side generation, curtailment or storage) effective risk transfer can be achieved through DR. The cost effectiveness of risk transfer is driven by the ability of the available customer base, DR technologies, and business processes with a fast enough reaction time to mitigate the impact of network outages.
155. Any operating and contractual model implemented by JEN must be structured in such a way as to allow effective management of DR programs that support asset deferral and maintain network reliability. The effective use of DR as a tool to support network reliability is clearly aligned to business as usual activities for network controllers as it requires a high degree of visibility and control. Likewise, utilizing DR for asset deferral can help JEN achieve the best possible economic outcome for its customers, while maintaining the same level of network reliability.
7.3.5 IMPLEMENTATION
156. Section 7.2(a)(v) of Schedule 1 to the RIN requires JEN to explain how JEN’s initiative was implemented.
157. The works associated with the Demand Response Trial Project on 22kV feeder BD-13 (Phase 1) that were completed in 2015 have been delivered as follows:
1. Assessing network risks associated with BD-13 feeder capacity constraints under various network operating scenarios, including network transfer and switching scenarios
2. Identify the aspects of controlling demand of commercial and industrial customers on feeder BD-13 that are most relevant for JEN and seek potential project partners with industry expertise.
3. Developing a questionnaire that can be used to seek customers’ willingness and acceptance in participating in a potential DR initiative.
4. Selecting commercial and industrial customers that can participate in a DR trial to be run in Regulatory Years 2016 and 2017.
5. Defining the hardware and IT requirements for controlling the demand of customers.
6. Training of JEN Staff
7.3.6 IMPLEMENTATION COSTS
158. Section 7.2(a)(vi) of Schedule 1 to the RIN requires JEN to explain the implementation costs of JEN’s project.
159. The actual expenditure for the Demand Response Trial Project on 22kV feeder BD-13 (Phase 1) incurred in the 2015 Regulatory Year was $10,955, as set out in Appendix B - Template 23 (DMIS – DMIA) (Attachment 1-1 of this response to the RIN).

GLOSSARY
Public—29 April 2016 © Jemena Electricity Networks (Vic) Ltd 55
7.3.7 BENEFITS
160. Section 7.2(a)(vii) of Schedule 1 to the RIN requires JEN to explain any identifiable benefits that have arisen from JEN’s project, including any off peak or peak demand reduction.
161. As the Demand Response Trial on 22kV feeder BD-13 (Phase 1) was limited to desktop analysis, there have been no quantifiable benefits in terms of reduction in peak demand. However, the learnings from the project will be directly applicable to Phase 2 of the project where a field trial will be conducted with large commercial / industrial customers on the feeder in 2016 and 2017. It is expected that there will be identifiable benefits in terms of peak demand reduction during the operation of Phase 2.
7.3.8 ASSOCIATED COSTS
162. Section 7.2(b) of Schedule 1 to the RIN requires JEN to state whether the costs associated with JEN’s initiative have been recovered under other schemes.
163. The associated costs for the development of the Demand Response Trial Project on 22kV feeder BD-13 (Phase 1) are not:
recoverable under any other jurisdictional incentive scheme,
recoverable under any other Commonwealth or State Government scheme, and
included in the forecast capital or operating expenditure approved in the 2011-15 Distribution Determination or recovered under any other incentive scheme in that determination.
7.3.9 FORGONE REVENUE ASSUMPTIONS AND / OR ESTIMATES
164. Section 7.2(c) of Schedule 1 to the RIN requires JEN to explain any assumptions and/or estimates used in the calculation of forgone revenue, demonstrating the reasonableness of those assumptions and/or estimates in calculating forgone revenue, including the reasons for JEN’s decision to adjust or not to adjust for other factors and the basis for any such adjustments.
165. Phase 1 of the Demand Response Trial Project on 22kV feeder BD-13 is limited to a desktop assessment of DR technology as a viable DM solution. JEN will field trial DR in Phase 2 of this project and therefore, JEN does not seek to recover forgone revenue resulting from the Demand Response Trial on 22kV feeder BD-13 (Phase 1) for the 2015 Regulatory Year.
As such, section 7.2(c) of Schedule 1 to the RIN is not applicable.
7.4 DETAILED INFORMATION – DEMAND MANAGEMENT CONSTRAINT ANALYSIS TOOL (CAT)
166. Section 7.2 of Schedule 1 to the RIN requires JEN to provide detailed information for each demand management project or program identified in response to section 7.1 of Schedule 1 to the RIN.
7.4.1 OBLIGATIONS OR REQUIREMENTS
167. Section 7.2(a)(i) of Schedule 1 to the RIN requires JEN to explain how JEN’s initiative complies with the DMIA criteria set out in section 3.1.3 of the Demand Management Incentive Scheme (DMIS).

GLOSSARY
Public—29 April 2016 © Jemena Electricity Networks (Vic) Ltd 56
168. JEN initiated the development of a Demand Management Constrained Analysis Tool (CAT) in association with a demand response technology provider in 2015. The software tool allows network planning engineers compare costs and benefits of multiple network and non-network options and undertake a consistent cost benefit analysis of options.
169. JEN considers that the development of a Demand Management CAT in the 2015 Regulatory Year complies with DMIA criteria, set out in section 3.1.3 of the DMIS, in the following ways:
The tool allows network planning engineers apply a consistent approach in analysing and comparing multiple network and non-network options (Section 3.1.3-1).
The project is a broad based Demand Management cost-benefit analysis initiative, and is not aimed at a specific location on the network (Section 3.1.3-2).
The project deliverable is a software tool which can be used to develop and enhance JEN’s capability in comparing and analysing multiple network and non-network options. In return to the upfront capital contribution and co-development effort, JEN can subscribe to the use of the software tool at a discounted price for the next two years after the completion of the development. No commercially available software package that allows the user to apply probabilistic planning methodology to assess the economic benefits of multiple non-network and network augmentation options is currently available (Section 3.1.3-3).
The project is a non-tariff based project and the costs are not recovered under any other incentive scheme (Section 3.1.3-4).
The project cost has not been recovered under other schemes. See 7.4.8 of JEN’s response for more details (Section 3.1.3-5).
The nature of expenditure is operating expenditure (Section 3.1.3-6).
7.4.2 NATURE AND SCOPE
170. Section 7.2(a)(ii) of Schedule 1 to the RIN requires JEN to explain the nature and scope of JEN’s initiative.
171. The nature of the project is to develop a software tool that allows network planning engineers apply a consistent approach in analysing and comparing multiple network and non-network options.
172. The scope of works for the project includes developing a software tool with the following capabilities:
Advanced modelling of network options, including capability to assess benefits under various network operating scenarios, including network transfer and switching scenarios.
Advanced modelling of non-network options, including capability to assess benefits under various Demand Management asset types, various Demand Management portfolios and various network operating scenarios, including network transfer and switching scenarios.
View year-on-year tabulated cost benefit for the duration of the forecasts.
View the optimal deferral length in a chart format.
Export of the results of analysis to other documents, e.g., Business Cases.
173. JEN has engaged a Demand Response technology provider as a consultant to develop the tool and provide the deliverables in the project scope.

GLOSSARY
Public—29 April 2016 © Jemena Electricity Networks (Vic) Ltd 57
7.4.3 AIMS AND EXPECTATIONS
174. Section 7.2(a)(iii) of Schedule 1 to the RIN requires JEN to explain the aims and expectations of JEN’s initiative.
175. The aims and expectations of the project are to:
Develop a software tool that allows costs and benefits of multiple network and non-network options be considered.
Develop a framework and methodology for a consistent and objective cost benefit analysis of multiple network and non-network options.
7.4.4 SELECTION PROCESS
176. Section 7.2(a)(iv) of Schedule 1 to the RIN requires JEN to explain the process by which JEN’s project was selected, including its business case and consideration of any alternatives.
177. To allow demand management options to be considered on the same basis as traditional network options, JEN needs
Support Demand Management objectives of the business by developing a more advanced cost benefit analysis tool that can be applied to both network and non-network options.
Adopting a more accurate cost benefits analysis tool for both network and non-network options with advanced network and Demand Management scenario modelling capability.
7.4.5 IMPLEMENTATION
178. Section 7.2(a)(v) of Schedule 1 to the RIN requires JEN to explain how JEN’s initiative was implemented.
179. JEN surveyed the market and did not find a commercially available software package that allows the user to apply probabilistic planning methodology to assess the economic benefits of multiple non-network and network augmentation options. JEN decided to team up with a demand response technology provider to develop the tool. This collaborative approach allows JEN’s knowledge on grid side issues and network considerations be combined with the Consultant’s expertise of Demand Response technology.
180. The works associated with the Demand Management CAT that were completed in 2015 have been delivered as follows:
Develop a Demand Management CAT trial version with the following capabilities:
– Input of constraint load shapes;
– Input of load growth forecasts;
– Calculation of benefits (Energy at Risk and Expected Unserved Energy);
– Model network augmentation options (including Capacity benefits calculator );
– Model DSM solution options (including Capacity benefits calculator);
– Cost / Benefit analysis of options and comparison.
Develop a Demand Management CAT production version with advanced modelling capabilities:
– Advanced modelling of network augmentation options, including network transfer and switching benefits calculation;
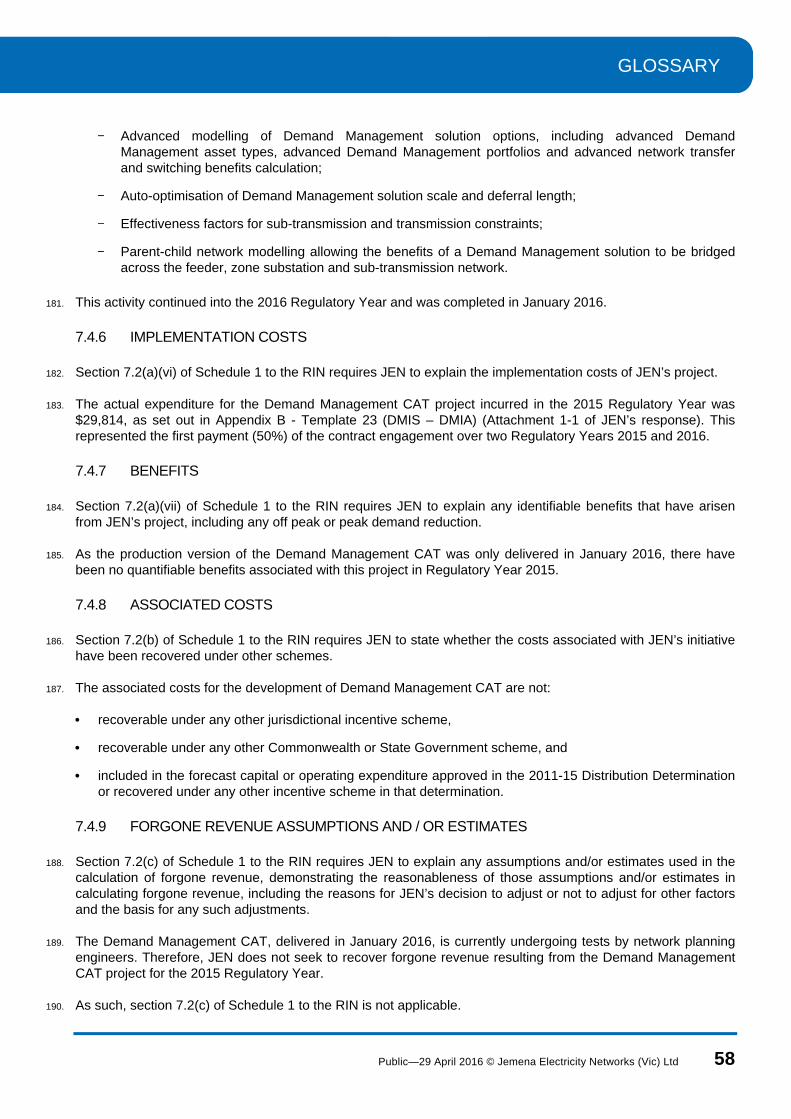
GLOSSARY
Public—29 April 2016 © Jemena Electricity Networks (Vic) Ltd 58
– Advanced modelling of Demand Management solution options, including advanced Demand Management asset types, advanced Demand Management portfolios and advanced network transfer and switching benefits calculation;
– Auto-optimisation of Demand Management solution scale and deferral length;
– Effectiveness factors for sub-transmission and transmission constraints;
– Parent-child network modelling allowing the benefits of a Demand Management solution to be bridged across the feeder, zone substation and sub-transmission network.
181. This activity continued into the 2016 Regulatory Year and was completed in January 2016.
7.4.6 IMPLEMENTATION COSTS
182. Section 7.2(a)(vi) of Schedule 1 to the RIN requires JEN to explain the implementation costs of JEN’s project.
183. The actual expenditure for the Demand Management CAT project incurred in the 2015 Regulatory Year was $29,814, as set out in Appendix B - Template 23 (DMIS – DMIA) (Attachment 1-1 of JEN’s response). This represented the first payment (50%) of the contract engagement over two Regulatory Years 2015 and 2016.
7.4.7 BENEFITS
184. Section 7.2(a)(vii) of Schedule 1 to the RIN requires JEN to explain any identifiable benefits that have arisen from JEN’s project, including any off peak or peak demand reduction.
185. As the production version of the Demand Management CAT was only delivered in January 2016, there have been no quantifiable benefits associated with this project in Regulatory Year 2015.
7.4.8 ASSOCIATED COSTS
186. Section 7.2(b) of Schedule 1 to the RIN requires JEN to state whether the costs associated with JEN’s initiative have been recovered under other schemes.
187. The associated costs for the development of Demand Management CAT are not:
recoverable under any other jurisdictional incentive scheme,
recoverable under any other Commonwealth or State Government scheme, and
included in the forecast capital or operating expenditure approved in the 2011-15 Distribution Determination or recovered under any other incentive scheme in that determination.
7.4.9 FORGONE REVENUE ASSUMPTIONS AND / OR ESTIMATES
188. Section 7.2(c) of Schedule 1 to the RIN requires JEN to explain any assumptions and/or estimates used in the calculation of forgone revenue, demonstrating the reasonableness of those assumptions and/or estimates in calculating forgone revenue, including the reasons for JEN’s decision to adjust or not to adjust for other factors and the basis for any such adjustments.
189. The Demand Management CAT, delivered in January 2016, is currently undergoing tests by network planning engineers. Therefore, JEN does not seek to recover forgone revenue resulting from the Demand Management CAT project for the 2015 Regulatory Year.
190. As such, section 7.2(c) of Schedule 1 to the RIN is not applicable.

GLOSSARY
Public—29 April 2016 © Jemena Electricity Networks (Vic) Ltd 59
7.5 DETAILED INFORMATION – GRID BATTERY ENERGY STORAGE SYSTEM - FEASIBILITY AND CONCEPT DESIGN STUDY
191. Section 7.2 of Schedule 1 to the RIN requires JEN to provide detailed information for each demand management project or program identified in response to section 7.1 of Schedule 1 to the RIN.
7.5.1 COMPLIANCE
192. Section 7.2(a)(i) of Schedule 1 to the RIN requires JEN to explain how JEN’s initiative complies with the DMIA criteria set out in section 3.1.3 of DMIS.
193. JEN initiated a GESS feasibility and design study in 2015 to develop our understanding of utility scale energy storage technology in mitigating peak demand network constraints and its impact on the distribution network and the quality of electricity supply.
194. JEN considers that the feasibility study into the deployment of GESS as a peak shaving technology in the 2015 Regulatory Year complies with DMIA criteria, set out in section 3.1.3 of the DMIS, in the following ways:
The project is aimed at developing JEN’s capabilities to reduce peak demand in constrained parts of the network, rather than increasing supply capacity through network augmentation (Section 3.1.3-1).
The project is a peak demand management initiative which aims to address specific network constraints by reducing demand on the network at the location and time of the constraint (Section 3.1.3-2).
The project deliverables are to develop JEN’s capability in deploying GESS as an effective, economic and efficient peak demand management solution. The primary objectives of the GESS feasibility and design study was to develop load data analysis and battery control simulation tools which enable JEN to do high level design and assessment of GESSs as part of BAU planning processes (Section 3.1.3-3).
The project is a non-tariff based project and the costs are not recovered under any other incentive scheme (Section 3.1.3-4).
The project cost has not been recovered under other schemes. See 7.5.8 of JEN’s response for more details (Section 3.1.3-5).
The nature of expenditure is operating expenditure (Section 3.1.3-6).
7.5.2 NATURE AND SCOPE
195. Section 7.2(a)(ii) of Schedule 1 to the RIN requires JEN to explain the nature and scope of JEN’s initiative.
196. The nature of the project is to develop our understanding of utility scale energy storage technology in mitigating peak demand network constraints, its impact on the distribution network and the quality of electricity supply, with particular focus on the application to the suburban distribution network of JEN.
197. The scope of works for the GESS Feasibility and Concept Design Study includes the following key deliverables:
Develop a concept design for a multi-feeder GESS for an area of the network constrained by sub-transmission, zone substation and distribution feeders
Determine an optimum size of a multi-feeder GESS. This is achieved by analysing historical load and daily load curves and developing a number of load and daily load curve forecast as the basis for determining an optimum size for batteries.
Design and simulate a distributed energy management system for the multi-feeder GESS.

GLOSSARY
Public—29 April 2016 © Jemena Electricity Networks (Vic) Ltd 60
Analyse and assess the impact of the GESS on the network.
Estimate cost of implementing the multi-feeder GESS
Assess the economic benefits of the GESS, including potential deferment or avoidance of large capital expenditure.
Develop a framework for the planning assessment of GESS as a peak demand management tool.
198. JEN engaged a consulting firm as a consultant to provide the deliverables in the project scope.
7.5.3 AIMS AND EXPECTATIONS
199. Section 7.2(a)(iii) of Schedule 1 to the RIN requires JEN to explain the aims and expectations of JEN’s initiative.
200. The aims and expectations of the GESS Feasibility and Concept Design Study are to:
Understand the benefits, costs and operating modes of the GESS as a viable peak demand management solution;
Investigate GESS technology for possible future implementation within the JEN electricity network with the objective of deferring network augmentation works or mitigating network outage risk. Note while a number of grid storage pilot or demonstration projects have been initiated by electricity distribution companies, the majority of these are targeted in “edge-of-grid” applications where battery economics are comparable to network augmentation costs. This is not the case for JEN’s predominantly suburban electricity network;
Develop JEN’s capabilities in the area so as to facilitate the evaluation and implementation of GESS solutions from various technology providers.
Lay the foundation for a GESS field trial project.
7.5.4 SELECTION PROCESS
201. Section 7.2(a)(iv) of Schedule 1 to the RIN requires JEN to explain the process by which JEN’s project was selected, including its business case and consideration of any alternatives.
Advances in GESS technologies represent an opportunity for JEN to manage network risks associated with capacity constraints in ways that have not previously been possible. By undertaking this project, JEN intends to develop and refine its approach and strategy on cost effective peak demand management solutions.
GESS has the potential for economic management of network risks associated with capacity constraint.
JEN can leverage GESS to manage network risk both before and during outages and potentially reduce the overall costs of network operation.
Utilising GESS for asset deferral can help JEN achieve the best possible economic outcome for its customers, while maintaining the same level of network reliability.
7.5.5 IMPLEMENTATION
202. Section 7.2(a)(v) of Schedule 1 to the RIN requires JEN to explain how JEN’s initiative was implemented.

GLOSSARY
Public—29 April 2016 © Jemena Electricity Networks (Vic) Ltd 61
203. JEN has taken a collaborative approach with the Consultant on this project, where JEN’s knowledge on grid side issues and network considerations is combined with the Consultant’s expertise on energy storage design and solutions.
204. The works associated with the GESS Feasibility and Concept Design Study that were completed in 2015 have been delivered as follows:
Selection of a part of JEN network constrained by sub-transmission, zone substation and distribution feeder capacity and development of network models for energy flow analysis.
Development of concept designs for multi-feeder GESS.
Design, development and simulation of two distributed control systems.
o A Parallel Distributed Control System for GESS (battery and inverter)
o A Parallel Distributed Control System for the upstream network.
Development of models including key parameters and GESS operating modes relevant for successful implementation of a trial project.
Complete an economic assessment of the GESS option and compare with traditional network solutions
Preparation of a report documenting the project findings
205. This activity continued into the 2016 Regulatory Year and was completed in January 2016.
7.5.6 IMPLEMENTATION COSTS
206. Section 7.2(a)(vi) of Schedule 1 to the RIN requires JEN to explain the implementation costs of JEN’s project.
207. The actual expenditure for the GESS Feasibility and Concept Design Study incurred in the 2015 Regulatory Year was $27,400, as set out in Appendix B - Template 23 (DMIS – DMIA) (Attachment 1-1 of this response to the RIN). This represented the first payment (55%) of the contract engagement over two Regulatory Years 2015 and 2016.
7.5.7 BENEFITS
208. Section 7.2(a)(vii) of Schedule 1 to the RIN requires JEN to explain any identifiable benefits that have arisen from JEN’s project, including any off peak or peak demand reduction.
209. As the GESS Feasibility and Concept Design Study was limited to desktop modelling, analysis and simulation, there have been no quantifiable benefits in terms of reduction in peak demand. However, the learnings from the study will be directly applicable when JEN begins a trial deployment of a GESS in a constrained part of JEN.
7.5.8 ASSOCIATED COSTS
210. Section 7.2(b) of Schedule 1 to the RIN requires JEN to state whether the costs associated with JEN’s initiative have been recovered under other schemes.
211. The associated costs for the development of the GESS Feasibility and Concept Design Study are not:
recoverable under any other jurisdictional incentive scheme,

GLOSSARY
Public—29 April 2016 © Jemena Electricity Networks (Vic) Ltd 62
recoverable under any other Commonwealth or State Government scheme, and
included in the forecast capital or operating expenditure approved in the 2011-15 Distribution Determination or recovered under any other incentive scheme in that determination.
7.5.9 FORGONE REVENUE ASSUMPTIONS AND / OR ESTIMATES
212. Section 7.2(c) of Schedule 1 to the RIN requires JEN to explain any assumptions and/or estimates used in the calculation of forgone revenue, demonstrating the reasonableness of those assumptions and/or estimates in calculating forgone revenue, including the reasons for JEN’s decision to adjust or not to adjust for other factors and the basis for any such adjustments.
213. The GESS Feasibility and Concept Design Study is limited to a desktop analysis of the technology as a peak demand management tool. Therefore, JEN does not seek to recover forgone revenue resulting from the GESS Feasibility and Concept Design Study for the 2015 Regulatory Year.
214. As such, section 7.2(c) of Schedule 1 to the RIN is not applicable.
7.6 DEMAND MANAGEMENT INNOVATION ALLOWANCE
215. Section 7.3 of Schedule 1 to the RIN requires JEN to state the total amount of the DMIA spent in the Relevant Regulatory Year and explain how it was calculated.
216. The actual costs incurred in the 2015 Regulatory Year for four projects were $94,494 as set out in Excel template 23 (DMIS – DMIA) Appendix B (Attachment 1-1 of this response to the RIN).
217. The project cost (materials, internal labour and external labour) is tracked in JEN’s accounting systems.

GLOSSARY
Public—29 April 2016 © Jemena Electricity Networks (Vic) Ltd 63
8. ADVANCED METERING INFRASTRUCTURE
218. In this section, JEN responds to section 8 of Schedule 1 to the RIN for the 2015 Relevant Regulatory Year.
8.1 EFFICIENCY IMPROVEMENTS
219. Section 8.1 of Schedule 1 to the RIN requires JEN to provide a description and estimate of all efficiency improvements on JEN’s operations directly or indirectly arising from or associated with the roll out of AMI.
220. As at the end of the 2015 Relevant Regulatory Year, no quantifiable efficiency improvements arose in JEN’s operations due to the roll out of AMI. However, JEN estimates that approximately $4.772M in customer benefits have been achieved arising from or associated with the roll out of AMI. These benefits accrue to customers and not to JEN.
Customer benefits realised through remote AMI services in 2015
221. Table 8-1 tabulates the benefits achieved by JEN’s AMI customers in 2015 through the provision of remote AMI services – first by lower charges and second by faster delivery of those services.
Table 8–1: Customer benefits from remote AMI services performed in 2015
Service Remote AMI Services
Remote
AMI Service Charge
Manual Service Charge
Customer benefit
($’000)
Re-energisation 58,916 $9.45 $34.98 $1,504.13
De-energisation 26,438 $9.45 $53.97 $1,177.02
Meter re-configuration 5,427 $49.45 $434.69 $2,090.70
Special meter read 0 $0 $31.24 $0.00
Total 90,781 $4,771.84
222. Remote service benefits accrue to JEN’s customers through lower direct provision costs (avoided site visits) and customer charges. Relevant ACS and excluded services charges are shown in Table 8–1 and demonstrate the differential of remote AMI services when compared to manual services. This differential is the benefit that has been delivered to the customers. The indicated benefits relate to charges by the distributor and hence customer benefit may be greater, once retailer charges are included.
223. JEN notes that the number of remote special meter reads has reduced to zero, as retailer businesses are now using daily reads in lieu of special meter reads for AMI metered sites. The customer / retailer saving associated with avoided manual special meter reads has not been quantified as JEN cannot reasonably quantify the avoided volume of special meter reads. Therefore, the customer benefit is understated in Table 8–1.
8.2 EFFICIENCY IMPROVEMENT (EXPLANATION AND QUANTUM)
224. Section 8.2 of Schedule 1 to the RIN requires JEN to explain, for efficiency improvements in response to paragraph 8.1, how the efficiency improvements arise from the roll out of AMI and to state the quantum of the efficiency improvements (if quantifiable).

GLOSSARY
Public—29 April 2016 © Jemena Electricity Networks (Vic) Ltd 64
225. While no efficiency improvements accrued directly to JEN, at least $4.772M in customer improvements can be directly quantified in section 8.1 as a result of the AMI rollout. Many consumers with AMI meters are realising broader benefits and/or improved services derived from the JEN AMI rollout in the period including:
remote meter reading,
remote connection and disconnection,
remote meter re-configuration,
demand management through the provisions of usage information to customers, and
avoided truck fees.
8.2.1 REMOTE AMI METER READING
226. As of 31 December 2015, a total of 330,887 JEN AMI meters are registered as Type 5 AMI in the market and remotely read with better than 99.8% ‘quality and quantity’ delivery of data to market daily. Therefore, most of JEN’s AMI customers’ metering data:
is available to the market operator by 6AM next business day
is available to the retailer overnight before the opening of the business day;
is available to the customer via the web portal ‘Electricity Outlook’ for analysis and information (customer registration required); and
has improved billing accuracy with streamlined processing and less human intervention.
8.2.2 REMOTE AMI CONNECTION AND DISCONNECTION
227. In 2015, 76,476 connections and 46,613 disconnections were performed, of which 85,354 were performed remotely using AMI enabled systems. Remote connection/disconnection eliminates the need for a site visit and therefore JEN customers benefit directly via lower charges and improved service delivery. Of the total connection and disconnections, 37,735 were performed manually because an AMI meter was either not yet installed, the respective retailer was not registered for remote services or the customer required a manual service for a safety constraint. With 98% of AMI meters deployed at the end of 2015, the requirement for manual fuse removals has dramatically dropped in conjunction with the increased take up rate of remote AMI services. It is important to note that fuse removals and service removals are still required for AMI-enabled network connections when, for instance, electrical works require that the supply be isolated at the fuse or connection point.
8.2.3 REMOTE AMI METER RE-CONFIGURATION
228. When a customer installs co-generation (e.g. solar system), the metering installation is required to be altered to measure energy exported to the network. When an AMI meter has previously been installed, this operation is performed by remote re-configuration and thereby avoids the need for a site visit. JEN customers benefit from this via lower chargesError! Reference source not found.. In 2015, JEN performed 5,427 customer-initiated remote re-configurations.
8.2.4 DEMAND MANAGEMENT THROUGH INFORMED AMI CUSTOMERS
229. Customers gained benefit from receiving prompt feedback of their energy use. By the end of 2015, 7,091 customers registered for the JEN Electricity Outlook web portal to gain access to 30-minute energy consumption data and comparison with other consumers. Customers registered for the Electricity Outlook portal have

GLOSSARY
Public—29 April 2016 © Jemena Electricity Networks (Vic) Ltd 65
immediate access to consumption data file downloads which can then be used by the My Power Planner electricity price comparator using the Switch-On website (http://switchon.vic.gov.au/).
8.2.5 IMPROVED ACCURACY OF OUTAGE IDENTIFICATION & NOTIFICATION
230. Supply loss experienced by customers can be network or customer related. In August 2015 JEN’s customer service representatives started to use the ‘meter ping’ feature of AMI meters when customers called to report loss of supply. The ‘meter ping’ feature allows JEN to determine if the supply loss is on the customer side of the AMI meter, and in this way, avoids sending a truck when the solution requires the customer to engage an electrician to attend to the incident. As JEN normally recovers the cost of wasted truck visits by invoicing the customers, this initiative results in benefits to the customers also. The quantum of this benefit is not quantified for 2015 but should be available in future reports following planned system processing improvements.
In addition, JEN has trialled the use of AMI meter “last gasp” function for outage notification in the control room. The function is on trial and is not integrated with JEN’s outage management system.

GLOSSARY
Public—29 April 2016 © Jemena Electricity Networks (Vic) Ltd 66
9. SAFETY AND BUSHFIRE RELATED EXPENDITURE
231. In this section, JEN responds to section 9 of Schedule 1 to the RIN for the 2015 Regulatory Year.
9.1 ASSET CATEGORIES
232. Section 9.1 of Schedule 1 of the RIN requires JEN to specify and define the relevant Asset Category to which each safety and bushfire related expenditure item relates.
233. The list of each safety and bushfire related expenditure and the relevant Asset Category to which it relates is set out in Table 9–1 below.
Table 9–1: Safety and bushfire expenditure and Asset Category
Safety & bushfire related expenditure Asset Categories
Planned non-preferred services replacements
Conductor – LV Services
Low voltage insulated conductor typically runs from a pole to a point of attachment at the customer’s premise for the purpose of supplying electricity.
Planned replacement of non-preferred services due to height
Conductor – LV Services
Low voltage insulated conductor typically runs from a pole to a point of attachment at the customer’s premise for the purpose of supplying electricity.
Removal of public lighting switch wire (spans)
No applicable asset category
Public lighting switch wire is no longer utilised on the network as the mechanism to turn on street lighting. Today, public lighting is PE cell controlled.
Replacing existing Single Wire Earth Return (SWER) lines with 22kV overhead bare conductor (km)
Conductor - HV Bare Conductor
High voltage uninsulated conductor, which is used as mains conductor on a feeder for the purpose of supplying electricity.
Installing Ground Fault Neutraliser (GFN) and associated equipment at zone substations
Zone Substation – Others
A GFN, also known as a Rapid Earth Fault Current Limiter (REFCL), is installed inside a zone substation and has the purpose of limiting earth fault current.
Replacing crossarms/insulator sets – pole top fire mitigation
Pole top structures – wooden crossarm HV and Pole top structures - wooden crossarm ST
A structure mounted on the top of a pole and, in this case typically consisting of a wooden crossarm and porcelain insulators. The purpose is to support overhead conductors.
Replacing crossarms – based on age and condition
Pole top structures – wooden crossarm ST, Pole top structures – wooden crossarm HV and Pole top structures – wooden crossarm LV
A structure mounted on the top of a pole and, in this case typically consists of a wooden crossarm and porcelain insulators. The purpose is to support overhead conductors.
Replacing poles – based on age and condition
Poles
A pole may be made of wood, steel or concrete, the purpose of which is

GLOSSARY
Public—29 April 2016 © Jemena Electricity Networks (Vic) Ltd 67
Safety & bushfire related expenditure Asset Categories
to support the pole top structure, public lights and overhead conductors.
Stake poles – based on age and condition Poles - Staked Poles
A pole may be made of wood, steel or concrete. The purpose is to support the pole top structure, public lights and overhead conductors. In this case the pole has been reinforced with steel stakes.
Replacing undersized poles Poles
A pole may be made of wood, steel or concrete, the purpose of which is to support the pole top structure, public lights and overhead conductors.
Staking undersized poles Poles – Staked Poles
A pole may be made of wood, steel or concrete. The purpose is to support the pole top structure, public lights and overhead conductors. In this case the pole has been reinforced with steel stakes.
Replacing overhead conductor – mainly steel Conductor - HV Bare Conductor
High voltage uninsulated conductor which is used as mains conductor on a feeder for the purpose of transporting electricity.
Service line clearance – overhead services requiring relocation or undergrounding
Conductor – LV Services
Low voltage insulated conductor typically runs from a pole to a point of attachment at the customers premise for the purpose of supplying electricity.
Distribution Transformer Height Rectification Distribution - Others
Distribution transformers may be installed in kiosks, in ground mounted enclosures, inside buildings or mounted on poles. The purpose of the transformer is to step down the voltage. The distribution transformer height rectification refers to work required to raise the height of pole-mounted transformer.
Vibration Dampers and Armour Rods Conductor - HV Bare Conductor
High voltage uninsulated conductor which is used as mains conductor on a feeder for the purpose of supplying electricity.
Zone Substation Earth Grid replacements Zone Substation – Others
Earth grids at zone substations are designed to reduce the step and touch potential. Step Potential is the difference in voltage between two points on the ground that a person could touch in one step, and Touch Potential is the difference in voltage between a point on the ground and that of a conductive material within arm’s reach.
Trial of Neutral Condition Monitor Others
The purpose of the neutral condition monitor is to improve public health and safety through continuous monitoring of the integrity of the supply neutral.
9.2 VARIANCE ANALYSIS
234. Section 9.2 of Schedule 1 to the RIN requires JEN to identify each material difference (where the difference is equal to or greater than 10 per cent), in relation to the asset categories specified in response to paragraph 9.1.

GLOSSARY
Public—29 April 2016 © Jemena Electricity Networks (Vic) Ltd 68
235. While section 9.2 of Schedule 1 to the RIN requires a variance analysis in relation to asset categories, the forecast volume and expenditure information included in the AER’s 2011-15 Distribution Determination has not always been presented by asset category. As such, JEN has only provided variance analysis by asset category where possible. Otherwise, JEN has provided variance analysis by program in this section.
9.2.1 VARIANCE ANALYSIS - VOLUME
236. Section 9.2(a) of Schedule 1 to the RIN requires JEN to identify each material difference between actual and forecast volumes. The variance analysis for each material difference is set out in Table 9–2.
Table 9–2: Actual volume vs forecast volume
Asset Categories Units Actual Allowance Variance %
Conductor - LV Services services 8,811 6,412 37%
Removal of Public Lighting Switch Wire spans removed - 426 (100%)
Zone Substation - Others zone substation - 1 (100%)
Pole top structures poles 2,351 3,390 (31%)
Pole - Staked Poles poles 2,115 443 378%
(2) Where annual volume data has not been included in the AER’s final determination, JEN divided the five year cumulative amount to derive the forecast for 2015 to facilitate the required variance analysis.
9.2.2 VARIANCE ANALYSIS - EXPENDITURE
237. Section 9.2(b) of Schedule 1 to the RIN requires JEN to identify each material difference between actual and forecast expenditure. The variance analysis for each material difference is set out in Table 9–3. When considering the variances it should be noted that the actual expenditure has been expressed in nominal dollars and the forecast expenditure has been expressed in both 2010 dollars and converted to nominal dollars to facilitate variance analysis.
Table 9–3: Actual expenditure vs forecast expenditure
Asset Category Actual $Nominal
Allowance $Real 2010
Allowance $Nominal
Variance %Nominal
Conductor - LV Services [C-I-C 2.21 2.50 [C-I-C
Removal of Public Lighting Switch Wire 0.08 0.10
Conductor – HV Bare Conductor 1.87 2.12
Zone Substation - Others 0.96 1.09
Poles 2.79 3.17
Pole - Staked Poles ] 0.36 0.40 ]

GLOSSARY
Public—29 April 2016 © Jemena Electricity Networks (Vic) Ltd 69
9.2.3 VARIANCE ANALYSIS - UNIT COSTS
238. Section 9.3(c) requires JEN to identify each material difference between actual and forecast unit costs. The variance analysis for each material difference (by program) is set out in Table 9–4. When considering the variances it should be noted that the actual unit rate has been expressed in nominal dollars and the forecast unit rate has been expressed in both 2010 dollars, as per the AER’s RIN template, as well as nominal dollars to facilitate variance analysis.
Table 9–4: Actual unit costs vs forecast unit costs
Program Actual $Nominal
Allowance $Real2010
Allowance $Nominal
Variance %Nominal
Planned non-preferred services replacements
[C-I-C ]
Planned replacement of non-preferred services due to height
[C-I-C ]
Removal of public lighting switch wire
[C-I-C ]
Replacement of existing SWER lines with 22kV overhead bare conductor
[C-I-C ]
Installation of GFN and associated equipment at zone substations
[C-I-C ]
Replacement of crossarms/insulator sets – pole top fire mitigation
[C-I-C ]
Replacement of crossarms – based on age and condition
[C-I-C ]
Replacement of poles – based on age and condition
[C-I-C ]
Stake poles – based on age and condition
[C-I-C ]
Replacement of undersized poles [C-I-C ]
Stake undersized poles [C-I-C ]
Replacement of overhead conductor – mainly steel
[C-I-C ]
Service line clearance – overhead services requiring relocation
[C-I-C ]
Service line clearance – overhead services requiring undergrounding
[C-I-C ]
Distribution Transformer Height Rectification
[C-I-C [1]
Zone Substation Earth Grid replacements
[C-I-C ]
Trial of Neutral Condition Monitor [C-I-C ]
Vibration Dampers and Armour [C-I-C ]

GLOSSARY
Public—29 April 2016 © Jemena Electricity Networks (Vic) Ltd 70
Program Actual $Nominal
Allowance $Real2010
Allowance $Nominal
Variance %Nominal
Rods
(1) Not meaningful.
9.3 REASONS FOR VARIANCES BY PROGRAM
239. Section 9.3 of Schedule 1 to the RIN requires JEN to provide reasons for each material difference identified in the response to paragraph 9.2.
240. The forecast information included in the 2011-15 Distribution Determination has not always been presented by asset category. Further, the data required and the analysis carried out in Template 22 of Appendix B (Attachment 1-1 of JEN’s response) has been presented by program. Hence, JEN provides reasons for material differences by program in this section. In section (1) of JEN’s response, JEN provides analysis by asset category, where possible, cross referencing to section 1.
9.3.1 PLANNED NON-PREFERRED SERVICE REPLACEMENTS
241. The material variances in relation to planned non-preferred service replacements are set out below.
Table 9–5: Planned non-preferred service replacements
Actual $Nominal
Allowance $Real 2010
Allowance $Nominal
Variance %Nominal
Volume (units) 7,506 6,000 6,000 25%
Expenditure ($M) [C-I-C ] 271%
Unit Cost ($) [C-I-C ] 194%
Volume variance
242. Services are upgraded to current standards as a proactive replacement program and in conjunction with other work such as network augmentation, pole replacement, reconductoring and asset relocation. Particular attention is paid to the types of open wire, red lead and neutral screened services which exhibit historical trends of deterioration.
243. In 2015 JEN has exceeded target volumes for this program in order to reduce the variance between actuals and allowance over the 2011-2015 period.
Unit cost variance
244. The unit rate of [c-i-c ] is the actual unit rate cost to replace non-preferred services and non-compliant services due to height. JEN is unable to report the unit rates for each type of replacement, as the data is not collected separately. Examining the project cost and number of services replaced as part of JEN’s Service Rectification Program, the 2015 replacement cost was determined.
245. JEN’s proposed unit rate of [c-i-c ] was based on assuming that economies of scale were achieved through replacing services on consecutive premises. This would be achieved through reducing travel time between jobs both at the time of construction and auditing. There would also be a reduction in traffic management costs. These economies of scale have not been realised, because in 2015, JEN has continued to address the services

GLOSSARY
Public—29 April 2016 © Jemena Electricity Networks (Vic) Ltd 71
with the lowest ground clearance in order to minimise the risk associated with low services. These services are located across the network rather than in concentrated locations.
246. Note that the unit cost is not equal to expenditure divided by volume. The volume of services replaced is inclusive of those occurring as part of other works, for instance a pole replacement, whereas the expenditure is only for the cost of the non-preferred service replacement project. To derive a more accurate unit cost, JEN has only included the volume of service replacements from the specific project
Expenditure variance
247. The expenditure variance is due to both increased volumes and including expenditure for the planned replacement of non-preferred services due to height, which has a higher unit rate. JEN is unable to report the expenditure for each type of replacement, as the cost for the two programs is not collected separately. The higher unit cost has contributed to a materially higher than forecast expenditure in 2015.
9.3.2 PLANNED REPLACEMENT OF NON-PREFERRED SERVICES DUE TO HEIGHT
248. The material variances in relation to planned replacement of non-preferred service due to height are set out below.
Table 9–6: Planned replacement of non-preferred service due to height
Actual $Nominal
Allowance $Real 2010
Allowance $Nominal
Variance %
Volume (units) 1,257 341 341 269%
Expenditure ($M) - 0.11 0.13 (100%)
Unit Cost ($) [C-I-C ] 194%
Volume variance
249. The materially higher volume than allowance of work completed in 2015 was to reduce the variance between actuals and allowance over the 2011-2015 period and due to priority being given to a similar, but distinct type of replacement—‘Planned replacement of non-preferred services due to height’.
Unit cost variance
250. As stated above, the unit rate of [c-i-c ] is the actual unit rate cost to replace non-preferred services and non-compliant services due to height. JEN is unable to report on the unit rate costs separately in 2015, as the data is not collected separately. JEN’s proposed unit rate of [c-i-c ] was based on assuming economies of scale were achieved by replacing services on consecutive premises. As described above, JEN has not achieved these economies of scale.
Expenditure variance
251. The expenditure variance is due to the relevant costs having been reported under planned non-preferred service replacements. JEN is unable to report the expenditure for each type of replacement as the cost is not collected separately.
9.3.3 PUBLIC LIGHTING SWITCH WIRE REMOVAL
252. JEN completed the public lighting switch wire removal project in 2014, therefore no expenditure and volumes were reported for 2015.

GLOSSARY
Public—29 April 2016 © Jemena Electricity Networks (Vic) Ltd 72
Table 9–7: Public lighting switch wire removal
Actual $Nominal
Allowance $Real 2010
Allowance $Nominal
Variance %Nominal
Volume (units) - 426 426 (100%)
Expenditure ($M) - 0.08 0.09 (100%)
Unit Cost ($) - 184 204 (100%)
Volume, Expenditure and Unit Rate variance
253. JEN completed the public lighting switch wire removal project prior to 2015 and as such no expenditure or volumes were reported in 2015.
9.3.4 REPLACING EXISTING SWER LINES WITH 22KV OVERHEAD BARE CONDUCTOR
254. JEN completed replacement of existing SWER lines with 22kV overhead bare conductor in 2013, therefore no expenditure and volumes were reported for 2015.
Table 9–8: Replacing existing SWER lines with 22kV overhead bare conductor
Actual $Nominal
Allowance $Real 2010
Allowance $Nominal
Variance %Nominal
Volume (units) - 3 3 (100%)
Expenditure ($M) - 0.50 0.56 (100%)
Unit Cost ($) - 177 196 (100%)
Volume, Expenditure and Unit Rate variance
255. JEN completed the replacement of all SWER lines prior to 2015 and as such no expenditure or volumes were recorded in 2015.
9.3.5 REPLACEMENT OF CROSSARMS/INSULATOR SETS – POLE TOP FIRE MITIGATION
256. The material variances for replacing crossarms – pole top fore mitigation are set out below.
Table 9–9: Replacement of crossarms – pole top fire mitigation
Actual $Nominal
Allowance $Real 2010
Allowance $Nominal
Variance %Nominal
Volume (units) 520 567 567 (8%)
Expenditure ($M) [C-I-C ] 36%
Unit Cost ($) [C-I-C ] 43%
Unit cost variance
257. In its EDPR submission, the AER determined a single unit rate for pole top replacement based on a weighted average calculation. The actual unit rate varies depending on the proportion of complex pole top structures that were completed in 2015.

GLOSSARY
Public—29 April 2016 © Jemena Electricity Networks (Vic) Ltd 73
Expenditure variance
258. The higher unit cost has contributed to the expenditure variance.
9.3.6 REPLACEMENT OF CROSSARMS - BASED ON AGE AND CONDITION
259. The material variances for replacing crossarms – based on age and condition are set out below.
Table 9–10: Replacement of crossarms – based on age and condition
Actual $Nominal
Allowance $Real 2010
Allowance $Nominal
Variance %Nominal
Volume (units) 1,831 2,823 2,823 (35%)
Expenditure ($M) [C-I-C ] (1%)
Unit Cost ($) [C-I-C ] 68%
Volume variance
260. JEN’s asset inspection program assesses the serviceability of crossarms based on condition. Crossarms are replaced when they reach the end of their service life. This means the actual volume of crossarms replaced may show variation from year to year, depending on the asset inspection program and the areas covered in each year’s program.
261. However, the forecast included in the 2011-15 Distribution Determination is determined by dividing the cumulative amount by five – to accord with the five year regulatory control period.
Unit cost variance
262. In its 2011-15 EDPR submission, JEN proposed separate unit replacement rates and volumes for low voltage (LV), high voltage (HV) and subtransmission (ST) crossarms. The AER determined a single unit rate for crossarm replacement based on a weighted average calculation. The result was a unit rate weighted in favour of LV crossarms which has the lowest unit rate and the highest proposed volume in JEN’s 5-year proposal (the split between LV, HV, ST crossarm volumes was 80, 16 and 4% respectively). Moreover, in the final determination the AER reduced JEN’s proposed unit cost by 15%.
263. JEN cannot determine the unit cost by simply dividing the total expenditure with the volume of crossarm replacements. JEN has examined a large number of work orders for crossarm replacements undertaken in 2015 in detail to determine the replacement cost for 2015. In 2015 the ratio of LV, HV & ST crossarms replaced was 46 and 54% respectively. As the unit replacement cost for HV and ST crossarms is higher than that of an LV crossarm due to the complexity of the pole structure, the weighted average unit rate for 2015 is higher than the AER’s unit rate.
9.3.7 REPLACEMENT OF POLES - BASED ON AGE AND CONDITION
264. The material variances for replacing poles – based on age and condition are set out below.
Table 9–11: Replacement of poles – based on age and condition
Actual $Nominal
Allowance $Real 2010
Allowance $Nominal
Variance %Nominal
Volume (units) 341 259 259 32%

GLOSSARY
Public—29 April 2016 © Jemena Electricity Networks (Vic) Ltd 74
Actual $Nominal
Allowance $Real 2010
Allowance $Nominal
Variance %Nominal
Expenditure ($M) [C-I-C ] 119%
Unit Cost ($) [C-I-C ] 193%
Volume variance
265. JEN’s asset inspection program comprises a technical measurement procedure to determine the serviceability of wood and steel poles. Poles are replaced after reaching the end of their service life and are unsuitable for staking. As poles are replaced based on condition, pole replacement volume is expected to vary from year to year.
266. The volume and complexity of the poles that require replacement each year will be influenced by the characteristics of the particular pole inspection zone (geographical area) that is inspected in that year. Some inspection zones will result in higher volumes and more complex poles to be replaced when compared with other zones.
Unit cost variance
267. The higher than forecast unit cost is the result of the variation in the ratio of subtransmission, high voltage, low voltage and public lighting poles that require replacement. In other words, if there is a high proportion of complex poles, particularly high voltage, the unit cost will be higher than forecast.
268. Further, the forecast unit cost was calculated using a total replacement volume and cost over a number of years, rather than just one year.
269. JEN believes this different calculation basis contributed to the variance.
Expenditure variance
270. The higher than forecast unit cost and volume have contributed to the higher actual expenditure.
9.3.8 STAKE POLES - BASED ON AGE AND CONDITION
271. The material variances for stake poles – based on age and condition are set out below.
Table 9–12: Stake poles – based on age and condition
Actual $Nominal
Allowance $Real 2010
Allowance $Nominal
Variance %Nominal
Volume (units) 1,761 223 223 690%
Expenditure ($M) [C-I-C ] 1,106%
Unit Cost ($) [C-I-C ] 47%
Volume variance
272. JEN’s asset inspection program comprises a technical measurement procedure to determine the serviceability of wood and steel poles. Poles that are assessed as being suitable are staked after reaching the end of their service life. As poles are staked based on condition, pole staking volume is expected to vary from year to year.
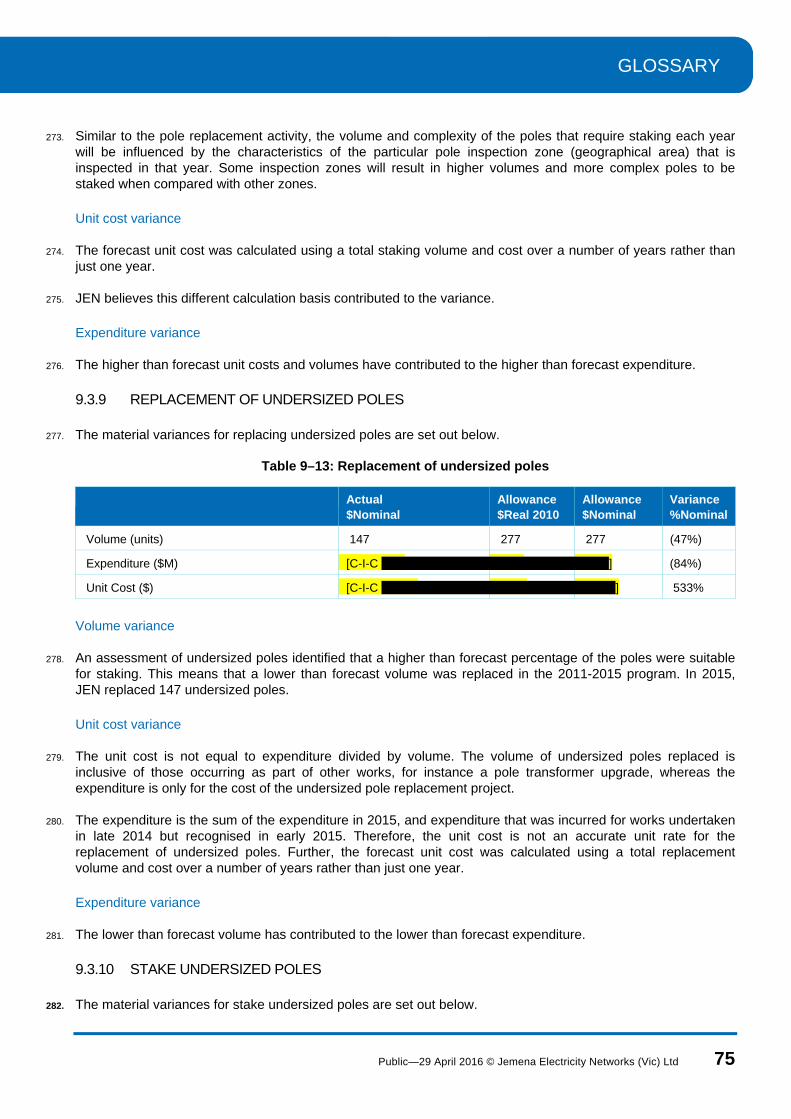
GLOSSARY
Public—29 April 2016 © Jemena Electricity Networks (Vic) Ltd 75
273. Similar to the pole replacement activity, the volume and complexity of the poles that require staking each year will be influenced by the characteristics of the particular pole inspection zone (geographical area) that is inspected in that year. Some inspection zones will result in higher volumes and more complex poles to be staked when compared with other zones.
Unit cost variance
274. The forecast unit cost was calculated using a total staking volume and cost over a number of years rather than just one year.
275. JEN believes this different calculation basis contributed to the variance.
Expenditure variance
276. The higher than forecast unit costs and volumes have contributed to the higher than forecast expenditure.
9.3.9 REPLACEMENT OF UNDERSIZED POLES
277. The material variances for replacing undersized poles are set out below.
Table 9–13: Replacement of undersized poles
Actual $Nominal
Allowance $Real 2010
Allowance $Nominal
Variance %Nominal
Volume (units) 147 277 277 (47%)
Expenditure ($M) [C-I-C ] (84%)
Unit Cost ($) [C-I-C ] 533%
Volume variance
278. An assessment of undersized poles identified that a higher than forecast percentage of the poles were suitable for staking. This means that a lower than forecast volume was replaced in the 2011-2015 program. In 2015, JEN replaced 147 undersized poles.
Unit cost variance
279. The unit cost is not equal to expenditure divided by volume. The volume of undersized poles replaced is inclusive of those occurring as part of other works, for instance a pole transformer upgrade, whereas the expenditure is only for the cost of the undersized pole replacement project.
280. The expenditure is the sum of the expenditure in 2015, and expenditure that was incurred for works undertaken in late 2014 but recognised in early 2015. Therefore, the unit cost is not an accurate unit rate for the replacement of undersized poles. Further, the forecast unit cost was calculated using a total replacement volume and cost over a number of years rather than just one year.
Expenditure variance
281. The lower than forecast volume has contributed to the lower than forecast expenditure.
9.3.10 STAKE UNDERSIZED POLES
282. The material variances for stake undersized poles are set out below.

GLOSSARY
Public—29 April 2016 © Jemena Electricity Networks (Vic) Ltd 76
Table 9–14: Stake undersized poles
Actual $Nominal
Allowance $Real 2010
Allowance $Nominal
Variance %Nominal
Volume (units) 354 220 220 61%
Expenditure ($M) [C-I-C ] 369%
Unit Cost ($) [C-I-C ] 192%
Volume variance
283. An assessment of undersized poles identified that a higher than forecast percentage of the poles were suitable for staking. This means that a higher than forecast volume was staked in the 2011-2015 program. In 2015, JEN staked 354 undersized poles.
Unit cost variance
284. The expenditure is the sum of the expenditure in 2015, and expenditure that was incurred for works undertaken in late 2014 but recognised in early 2015. Therefore, the unit cost is not an accurate unit rate for the staking of undersized poles. Further, the forecast unit cost was calculated using a total replacement volume and cost over a number of years rather than just one year.
Expenditure variance
285. The higher than forecast unit cost and higher than forecast completed volume has contributed to the higher than forecast expenditure.
9.3.11 REPLACEMENT OF OVERHEAD CONDUCTOR - MAINLY STEEL
286. The material variances for replacing overhead conductor – mainly steel are set out below.
Table 9–15: Replacing overhead conductor – mainly steel
Actual $Nominal
Allowance $Real 2010
Allowance $Nominal
Variance %Nominal
Volume (units) 23 22 22 1%
Expenditure ($M) [C-I-C ] (24%)
Unit Cost ($) [C-I-C ] (28%)
Volume variance
287. The volume was higher than forecast for 2015 and the overhead conductor replacement program was completed in the Hazardous Bushfire Risk Area (HBRA) for the 2011-15 Distribution Determination period.
Unit cost variance
288. The unit rate cost will vary depending on the complexity of the specific project. The complexity is impacted by the ability to obtain access to the assets when the work needs to be undertaken and the length of the conductor replacement. JEN experienced a higher proportion of longer length projects in 2015, resulting in more efficient project delivery.
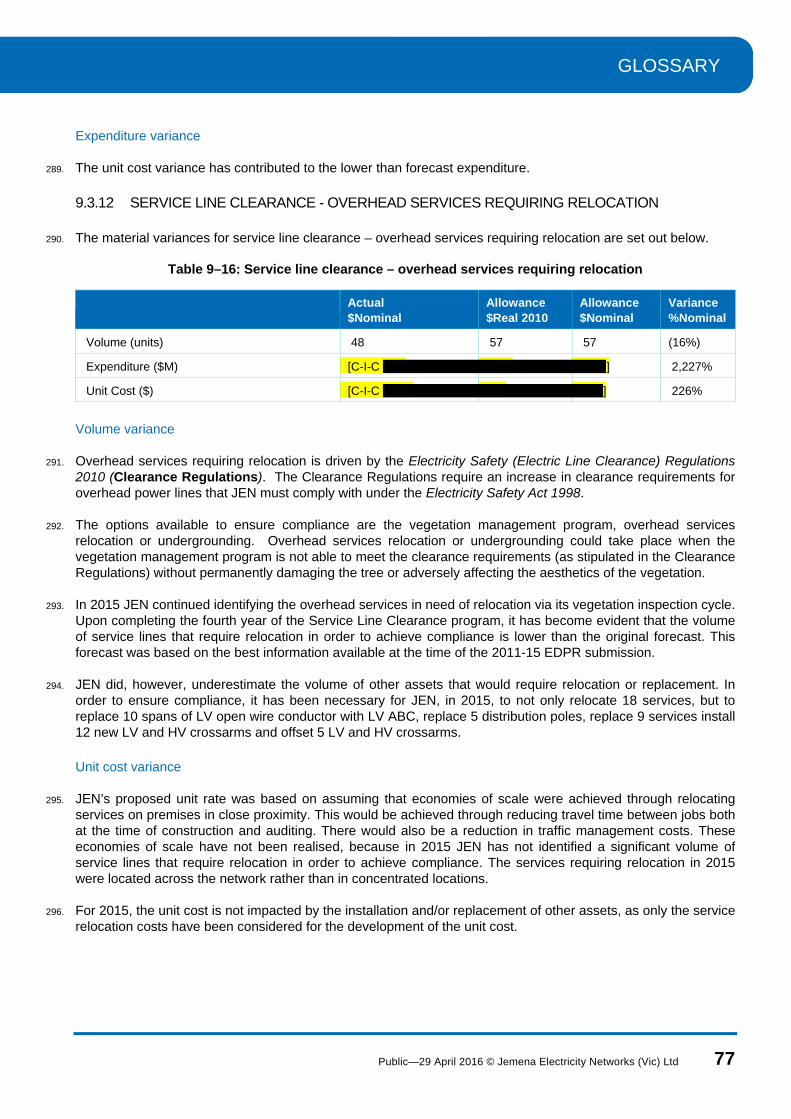
GLOSSARY
Public—29 April 2016 © Jemena Electricity Networks (Vic) Ltd 77
Expenditure variance
289. The unit cost variance has contributed to the lower than forecast expenditure.
9.3.12 SERVICE LINE CLEARANCE - OVERHEAD SERVICES REQUIRING RELOCATION
290. The material variances for service line clearance – overhead services requiring relocation are set out below.
Table 9–16: Service line clearance – overhead services requiring relocation
Actual $Nominal
Allowance $Real 2010
Allowance $Nominal
Variance %Nominal
Volume (units) 48 57 57 (16%)
Expenditure ($M) [C-I-C ] 2,227%
Unit Cost ($) [C-I-C ] 226%
Volume variance
291. Overhead services requiring relocation is driven by the Electricity Safety (Electric Line Clearance) Regulations 2010 (Clearance Regulations). The Clearance Regulations require an increase in clearance requirements for overhead power lines that JEN must comply with under the Electricity Safety Act 1998.
292. The options available to ensure compliance are the vegetation management program, overhead services relocation or undergrounding. Overhead services relocation or undergrounding could take place when the vegetation management program is not able to meet the clearance requirements (as stipulated in the Clearance Regulations) without permanently damaging the tree or adversely affecting the aesthetics of the vegetation.
293. In 2015 JEN continued identifying the overhead services in need of relocation via its vegetation inspection cycle. Upon completing the fourth year of the Service Line Clearance program, it has become evident that the volume of service lines that require relocation in order to achieve compliance is lower than the original forecast. This forecast was based on the best information available at the time of the 2011-15 EDPR submission.
294. JEN did, however, underestimate the volume of other assets that would require relocation or replacement. In order to ensure compliance, it has been necessary for JEN, in 2015, to not only relocate 18 services, but to replace 10 spans of LV open wire conductor with LV ABC, replace 5 distribution poles, replace 9 services install 12 new LV and HV crossarms and offset 5 LV and HV crossarms.
Unit cost variance
295. JEN’s proposed unit rate was based on assuming that economies of scale were achieved through relocating services on premises in close proximity. This would be achieved through reducing travel time between jobs both at the time of construction and auditing. There would also be a reduction in traffic management costs. These economies of scale have not been realised, because in 2015 JEN has not identified a significant volume of service lines that require relocation in order to achieve compliance. The services requiring relocation in 2015 were located across the network rather than in concentrated locations.
296. For 2015, the unit cost is not impacted by the installation and/or replacement of other assets, as only the service relocation costs have been considered for the development of the unit cost.
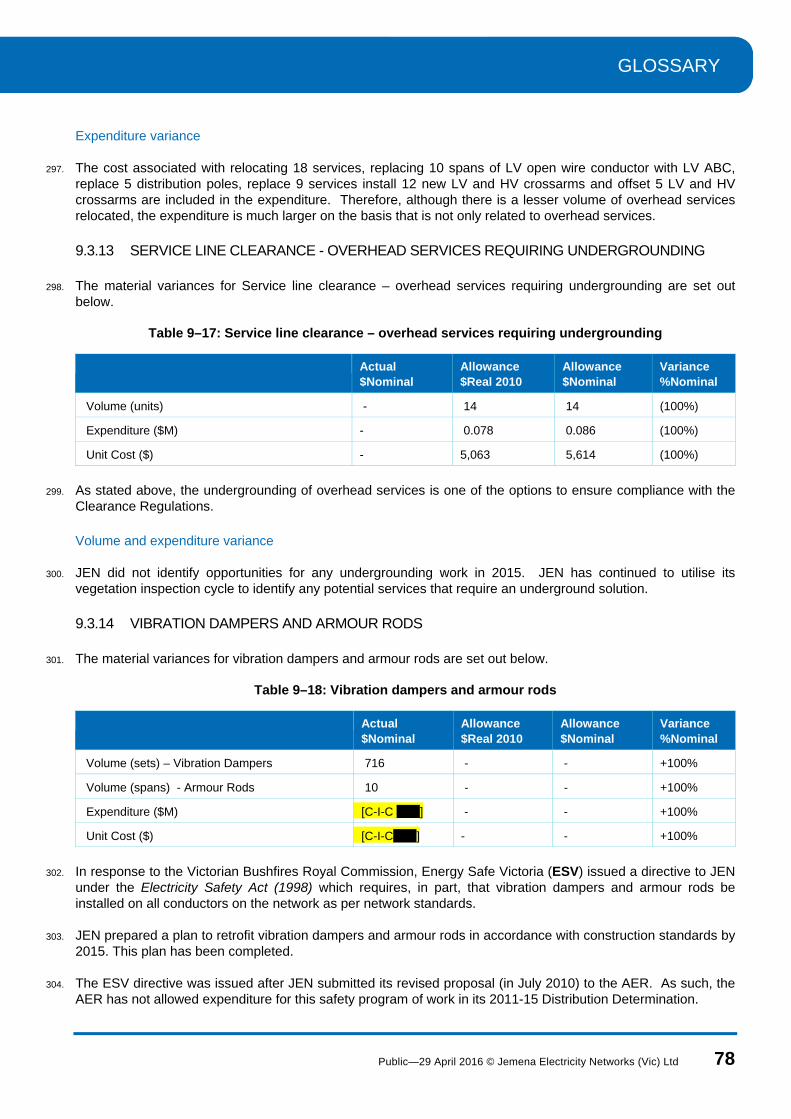
GLOSSARY
Public—29 April 2016 © Jemena Electricity Networks (Vic) Ltd 78
Expenditure variance
297. The cost associated with relocating 18 services, replacing 10 spans of LV open wire conductor with LV ABC, replace 5 distribution poles, replace 9 services install 12 new LV and HV crossarms and offset 5 LV and HV crossarms are included in the expenditure. Therefore, although there is a lesser volume of overhead services relocated, the expenditure is much larger on the basis that is not only related to overhead services.
9.3.13 SERVICE LINE CLEARANCE - OVERHEAD SERVICES REQUIRING UNDERGROUNDING
298. The material variances for Service line clearance – overhead services requiring undergrounding are set out below.
Table 9–17: Service line clearance – overhead services requiring undergrounding
Actual $Nominal
Allowance $Real 2010
Allowance $Nominal
Variance %Nominal
Volume (units) - 14 14 (100%)
Expenditure ($M) - 0.078 0.086 (100%)
Unit Cost ($) - 5,063 5,614 (100%)
299. As stated above, the undergrounding of overhead services is one of the options to ensure compliance with the Clearance Regulations.
Volume and expenditure variance
300. JEN did not identify opportunities for any undergrounding work in 2015. JEN has continued to utilise its vegetation inspection cycle to identify any potential services that require an underground solution.
9.3.14 VIBRATION DAMPERS AND ARMOUR RODS
301. The material variances for vibration dampers and armour rods are set out below.
Table 9–18: Vibration dampers and armour rods
Actual $Nominal
Allowance $Real 2010
Allowance $Nominal
Variance %Nominal
Volume (sets) – Vibration Dampers 716 - - +100%
Volume (spans) - Armour Rods 10 - - +100%
Expenditure ($M) [C-I-C ] - - +100%
Unit Cost ($) [C-I-C ] - - +100%
302. In response to the Victorian Bushfires Royal Commission, Energy Safe Victoria (ESV) issued a directive to JEN under the Electricity Safety Act (1998) which requires, in part, that vibration dampers and armour rods be installed on all conductors on the network as per network standards.
303. JEN prepared a plan to retrofit vibration dampers and armour rods in accordance with construction standards by 2015. This plan has been completed.
304. The ESV directive was issued after JEN submitted its revised proposal (in July 2010) to the AER. As such, the AER has not allowed expenditure for this safety program of work in its 2011-15 Distribution Determination.
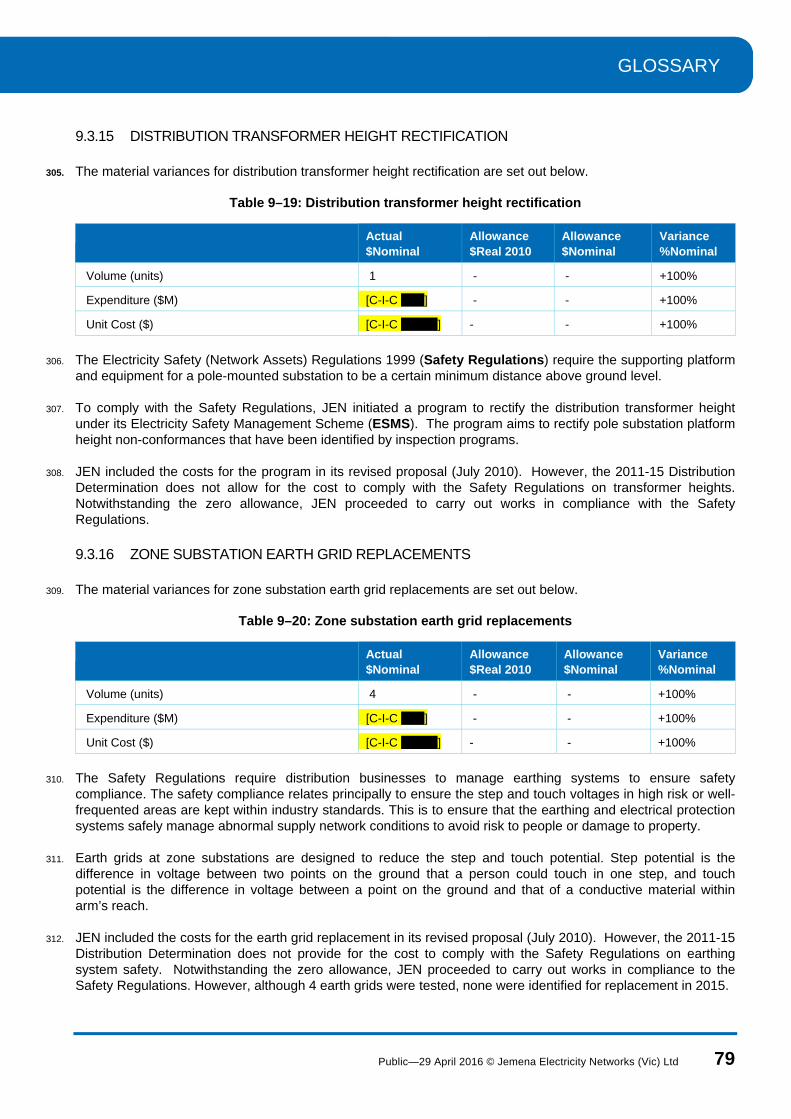
GLOSSARY
Public—29 April 2016 © Jemena Electricity Networks (Vic) Ltd 79
9.3.15 DISTRIBUTION TRANSFORMER HEIGHT RECTIFICATION
305. The material variances for distribution transformer height rectification are set out below.
Table 9–19: Distribution transformer height rectification
Actual $Nominal
Allowance $Real 2010
Allowance $Nominal
Variance %Nominal
Volume (units) 1 - - +100%
Expenditure ($M) [C-I-C ] - - +100%
Unit Cost ($) [C-I-C ] - - +100%
306. The Electricity Safety (Network Assets) Regulations 1999 (Safety Regulations) require the supporting platform and equipment for a pole-mounted substation to be a certain minimum distance above ground level.
307. To comply with the Safety Regulations, JEN initiated a program to rectify the distribution transformer height under its Electricity Safety Management Scheme (ESMS). The program aims to rectify pole substation platform height non-conformances that have been identified by inspection programs.
308. JEN included the costs for the program in its revised proposal (July 2010). However, the 2011-15 Distribution Determination does not allow for the cost to comply with the Safety Regulations on transformer heights. Notwithstanding the zero allowance, JEN proceeded to carry out works in compliance with the Safety Regulations.
9.3.16 ZONE SUBSTATION EARTH GRID REPLACEMENTS
309. The material variances for zone substation earth grid replacements are set out below.
Table 9–20: Zone substation earth grid replacements
Actual $Nominal
Allowance $Real 2010
Allowance $Nominal
Variance %Nominal
Volume (units) 4 - - +100%
Expenditure ($M) [C-I-C ] - - +100%
Unit Cost ($) [C-I-C ] - - +100%
310. The Safety Regulations require distribution businesses to manage earthing systems to ensure safety compliance. The safety compliance relates principally to ensure the step and touch voltages in high risk or well-frequented areas are kept within industry standards. This is to ensure that the earthing and electrical protection systems safely manage abnormal supply network conditions to avoid risk to people or damage to property.
311. Earth grids at zone substations are designed to reduce the step and touch potential. Step potential is the difference in voltage between two points on the ground that a person could touch in one step, and touch potential is the difference in voltage between a point on the ground and that of a conductive material within arm’s reach.
312. JEN included the costs for the earth grid replacement in its revised proposal (July 2010). However, the 2011-15 Distribution Determination does not provide for the cost to comply with the Safety Regulations on earthing system safety. Notwithstanding the zero allowance, JEN proceeded to carry out works in compliance to the Safety Regulations. However, although 4 earth grids were tested, none were identified for replacement in 2015.

GLOSSARY
Public—29 April 2016 © Jemena Electricity Networks (Vic) Ltd 80
9.3.17 TRIAL OF NEUTRAL CONDITION MONITOR
313. The material variances for trial of neutral condition monitor are set out below.
Table 9–21: Trial of neutral condition monitor
Actual $Nominal
Allowance $Real 2010
Allowance $Nominal
Variance %Nominal
Volume - - - -
Expenditure - - - -
314. JEN included a proposal for the trial of a neutral condition monitors in its 2010 regulatory proposal. The trial aims to improve public health and safety through continuous monitoring of the integrity of the supply neutral.
315. In 2010 and 2011, JEN developed an algorithm called Customer Supply Monitoring (CSM) that can be deployed into existing generation of smart meters installed on JEN’s network to achieve the neutral condition monitor function.
316. JEN then began the process of seeking a partner to commercialise the algorithm. Unfortunately, no commercial partner has been found.
317. As a result, JEN did not incur expenditure in 2015 on the neutral condition monitor trial.
9.3.18 INSTALLATION OF GROUND FAULT NEUTRALIZERS (GFN) AND ASSOCIATED EQUIPMENT AT ZONE SUBSTATIONS
318. JEN did not install any GFN or associated equipment at zone substations in 2015 and as such no expenditure or volumes were reported.
Table 9–22: Installation of GFN and associated equipment at zone substations
Actual $Nominal
Allowance $Real 2010
Allowance $Nominal
Variance %Nominal
Volume (units) - - - -
Expenditure ($M) - $1,458 $1,654 (100%)
Unit Cost ($) - - - (100%)
Volume, Expenditure and Unit Rate variance
All front-end engineering work (such as scoping & risk assessments) was completed previously. Work will commence to install the device in early 2016.
9.4 REASONS FOR MATERIAL DIFFERENCES BY ASSET CATEGORY
319. Section 9.3 of Schedule 1 to the RIN requires JEN to provide reasons for each material difference identified in the response to paragraph 9.2.

GLOSSARY
Public—29 April 2016 © Jemena Electricity Networks (Vic) Ltd 81
320. Due to the limitations stated at the beginning of section (1) of JEN’s response, JEN provides reasons for each material difference by program in that section. In this section 9.4, JEN provides variance analysis by asset category where possible, cross referencing to section (1).
9.4.1 VOLUME VARIANCE
321. The volume variances by asset category are set out below.
Table 9–23: Volume variance by Asset Category
Asset Category Variance Reasons for Variance
Conductor - LV Services Actual volume materially higher than forecast
Refer to section 9.3.1, 9.3.2, 9.3.3, 9.3.11, 9.3.12, 9.3.13 and 9.3.17 of JEN’s response
Removal of Public Lighting Switch Wire
No actual volume for 2015 due to program completion in 2014
Refer to section 9.3.3 of JEN’s response
Zone Substation - Others Actual volume materially lower than forecast
Refer to section 9.3.16 of JEN’s response
Pole top structures Actual volume materially lower than forecast
Refer to section 9.3.5 and 9.3.6 of JEN’s response
Pole - Staked Poles Actual volume materially higher than forecast
Refer to sections 9.3.8 and 9.3.10 of JEN’s response
9.4.2 EXPENDITURE VARIANCE
322. The expenditure variances by asset category are set out in Table 9–24.
Table 9–24: Expenditure variances by Asset Category
Asset Category Variance Reasons for Variance
Conductor - LV Services Actual expenditure materially higher than forecast
Refer to section 9.3.1, 9.3.2, 9.3.3, 9.3.11, 9.3.12, 9.3.13 and 9.3.17 of JEN’s response
Removal of Public Lighting Switch Wire
No actual expenditure for 2015 due to program completion in 2014
Refer to section 9.3.3 of JEN’s response
Conductor – HV Bare Conductor Actual expenditure materially lower than forecast
Refer to section 9.3.11 of JEN’s response
Zone Substation - Others Actual expenditure materially lower than forecast
Refer to section 9.3.16 of JEN’s response
Poles Actual expenditure materially higher than forecast
Refer to sections 9.3.7and 9.3.9 of JEN’s response
Pole - Staked Poles Actual expenditure materially higher than forecast
Refer to sections 9.3.8 and 9.3.10 of JEN’s response

GLOSSARY
Public—29 April 2016 © Jemena Electricity Networks (Vic) Ltd 82
9.5 REASONS FOR DIFFERENCES BETWEEN THE ACTUAL VOLUMES SUBMITTED AS PART OF THE ESMS AND RAS
323. Section 9.4 of Schedule 1 to the RIN requires JEN to provide reasons for any difference between the actual volumes submitted as part of the ESMS to Energy Safe Victoria and that in the RAS.
324. This requirement is not applicable as there is no difference between the actual volumes submitted as part of the ESMS and that in the RAS.

GLOSSARY
Public—29 April 2016 © Jemena Electricity Networks (Vic) Ltd 83
10. SPONSORSHIP AND MARKETING
325. In this section, JEN responds to Section 10 of Schedule 1 of the RIN for the 2015 Relevant Regulatory Year. Section 10.1 of Schedule 1 to the RIN requires JEN to provide information for all advertising/marketing expenditure allocated to the distribution business.
326. Section 10(a) requires JEN to list the expenditure greater than five percent of the advertising/marketing allocated to the distribution business:
327. JEN’s sponsorship and marketing costs are managed at the Jemena Ltd (JEM) corporate level. JEM governs the decisions relating to who the beneficiaries are and the amount to be contributed. In the instances below, JEN was able to isolate the specific advertising and marketing costs to the JEN business. The sources of these costs are supplier invoices.
Table 10–1: JEN’s advertising and marketing expenditure
Beneficiary Amount ($’000)
Purpose
Description of activities undertaken by the beneficiary
Proportion of the total advertising / marketing expenditure allocated to JEN
[C-I-C
Safety or Safety awareness - 60%
Managing consumer demand - 20%
Awareness of Jemena brand - 20%
]
328. Section 10(b) of the RIN notice requires JEN to list all advertising/marketing expenditure allocated to the distribution business that is not reported under 10.1(a).

GLOSSARY
Public—29 April 2016 © Jemena Electricity Networks (Vic) Ltd 84
Table 10–2: JEN advertising and marketing expenditure not reported in 10.1(a)
Beneficiary Amount ($’000)
Purpose
Description of activities undertaken by the beneficiary
Proportion of the total advertising / marketing expenditure allocated to JEN
[C-I-C
Safety or Safety awareness - 60%
Managing consumer demand - 20%
Awareness of Jemena brand - 20%
.
]

GLOSSARY
Public—29 April 2016 © Jemena Electricity Networks (Vic) Ltd 85
329. Section 10.2 of Schedule 1 to the RIN requires JEN to identify the expenditure item in the statutory accounts from which each of the items in paragraph 10.1(a) was derived.
330. JEN advises that these costs cannot be identified as a line item in JEN’s statutory accounts as they are sourced from the JEM corporate portfolio accounts. The expenditure reported above is sourced from Jemena’s Policy and External Affairs cost centre.

GLOSSARY
Public—29 April 2016 © Jemena Electricity Networks (Vic) Ltd 86
11. CHARTS
331. In this section, JEN responds to section 11 of Schedule 1 to the RIN for the 2015 Relevant Regulatory Year.
11.1.1 GROUP CORPORATE STRUCTURE
332. Section 11 of Schedule 1 to the RIN requires JEN to provide a chart showing the group corporate structure which JEN is a part of. The group structure is summarised in Figure 1.
Figure 1: Jemena Group structure as at December 2015
333. As shown in Figure 1 in CY2015 JEN was a 100 per cent owned subsidiary of JEM. JEM was a wholly owned indirect subsidiary of SGSPAA, which is in turn 60 per cent owned by State Grid Corporation of China and 40 per cent owned by Singapore Power International (SPI).
11.1.2 JEN ORGANISATIONAL STRUCTURE
334. Section 11 of Schedule 1 to the RIN requires JEN to provide a chart showing the organisational structure of JEN.
335. While JEN owns the electricity network assets, enterprise support services such as legal, finance and human resources are provided to JEN by JEM. JEM’s operational structure in relation to JEN is set out in Figure 2.

GLOSSARY
Public—29 April 2016 © Jemena Electricity Networks (Vic) Ltd 87
Figure 2: Jemena Operational Structure as it relates to JEN as at December 2015
336. For 2015 the asset management functions were performed at the JEN/JEM level, with JAM focusing on maintenance and other operational network services.

GLOSSARY
Public—29 April 2016 © Jemena Electricity Networks (Vic) Ltd 88
12. AUDIT REPORTS
337. In this section, JEN responds to section 12 of Schedule 1 to the RIN for the 2015 Relevant Regulatory Year.
12.1 REGULATORY AUDIT REPORTS
338. Section 12.1 of Schedule 1 to the RIN requires JEN to provide a Regulatory Audit Report in the form of:
a Special Purpose Financial Report in accordance with the requirements set out at Appendix E; and
an Audit Report (for non-financial information) in accordance with the requirements set out in Appendix E of the RIN.
12.2 PROVISION OF REGULATORY AUDIT REPORTS TO JEN’S MANAGEMENT
339. Section 12.2 of Schedule 1 of the RIN requires JEN to provide all reports from the Auditors to JEN’s management regarding the audit review and/or auditors’ opinions or assessments.
340. The report from the Auditor to JEN’s management regarding the audit review and/or auditor’s opinions or assessment are provided in Attachment 1-8 of this response and have been provided to JEN’s management.

GLOSSARY
Public—29 April 2016 © Jemena Electricity Networks (Vic) Ltd 89
13. STATUTORY DECLARATION
342. In this section, JEN responds to page one, paragraph three, point (c) of the RIN for the 2015 Relevant Regulatory Year.
343. Page one, paragraph three, point (c) of the RIN requires JEN to verify, by way of a statutory declaration, the information specified in the RIN submission in accordance with Appendix D of the RIN.
344. JEN has provided the statutory declaration in Attachment 1-9 of JEN’s response.

GLOSSARY
Public—29 April 2016 © Jemena Electricity Networks (Vic) Ltd 90
14. ATTACHMENTS
No. Attachment titles
1-1 RIN template Appendix B – regulatory accounting statement templates
1-2 RIN template Appendix C – non-financial information templates
1-3 Reconciliation between special purpose financial statements and regulatory accounting statements
1-4 Basis of preparation document
1-5 JEN regulatory accounting principles and policies (2015)
1-6 JEN capitalisation policy (2015)
1-7 Cost allocation methodology (2014)
1-8 KPMG audit opinion of financial and non-financial information
1-9 RIN template Appendix D – statutory declaration