Embed Size (px)
Citation preview

Jeffrey C Quick, Utah Geological Survey
http://geology.utah.gov/emp/mercury/index.htm
Sara Pletcher, Project Manager National Energy Technology Laboratory
Geological Society of America, Annual MeetingSalt Lake City, Utah16-19 October 2005
This report was prepared as an account of work sponsored by an agency of the United States Government. Neither the United States Government nor any agency thereof, nor any of their employees, makes any warranty, express or implied, or assumes any legal liability or responsibility for the accuracy, completeness, or usefulness of any information, apparatus, product, or process disclosed, or represents that its use would not infringe privately owned rights. Reference herein to any specific commercial product, process, or service by trade name, trademark, manufacturer, or otherwise does not necessarily constitute or imply its endorsement, recommendation, or favoring by the United States Government or any agency thereof. The views and opinions of authors expressed herein do not necessarily state or reflect those of the United States Government or any agency thereof.
Technology-Specific Mercury Emissions from Coal Combustion by
U.S. County of Origin
Technology-Specific Mercury Emissions from Coal Combustion by
U.S. County of Origin
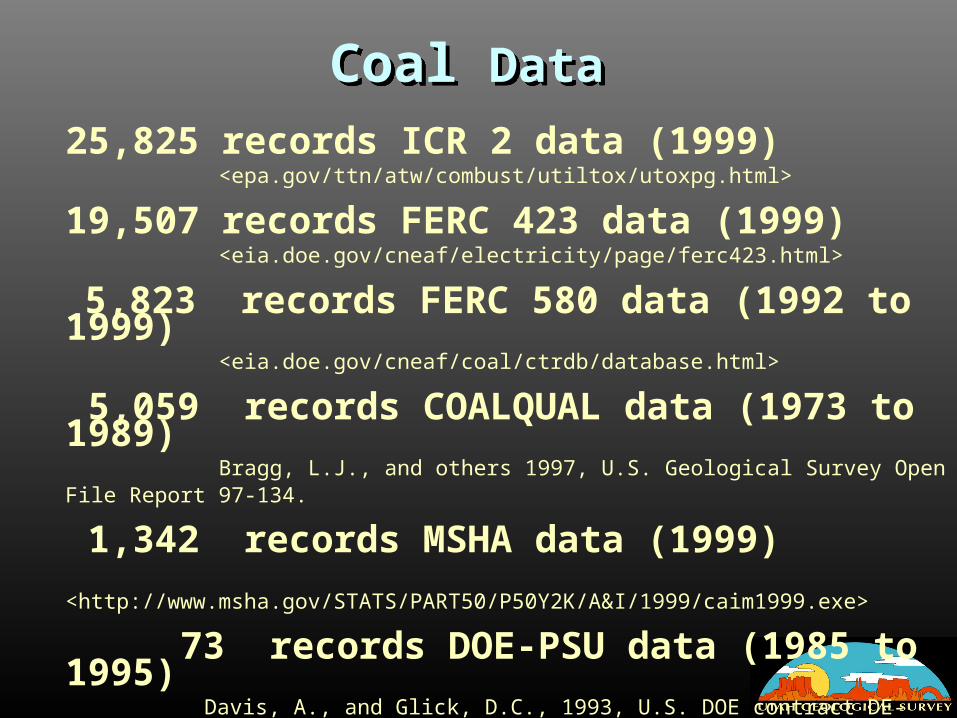
25,825 records ICR 2 data (1999) <epa.gov/ttn/atw/combust/utiltox/utoxpg.html>
19,507 records FERC 423 data (1999) <eia.doe.gov/cneaf/electricity/page/ferc423.html>
5,823 records FERC 580 data (1992 to 1999) <eia.doe.gov/cneaf/coal/ctrdb/database.html>
5,059 records COALQUAL data (1973 to 1989) Bragg, L.J., and others 1997, U.S. Geological Survey Open File Report 97-134.
1,342 records MSHA data (1999) <http://www.msha.gov/STATS/PART50/P50Y2K/A&I/1999/caim1999.exe>
73 records DOE-PSU data (1985 to 1995) Davis, A., and Glick, D.C., 1993, U.S. DOE contract DE-RP22-87PC79997 Scaroni, A.W., and others, 1999, U.S. DOE contract DE-AC22-93PC93051
Coal DataCoal Data
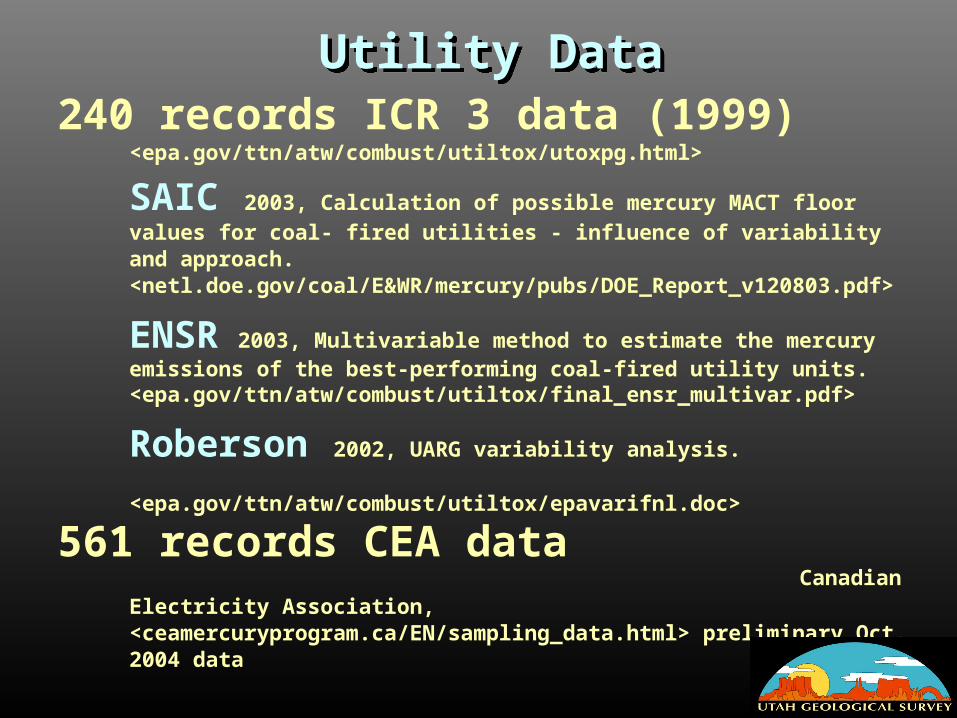
240 records ICR 3 data (1999)
<epa.gov/ttn/atw/combust/utiltox/utoxpg.html>
SAIC 2003, Calculation of possible mercury MACT floor values for coal-
fired utilities - influence of variability and approach. <netl.doe.gov/coal/E&WR/mercury/pubs/DOE_Report_v120803.pdf>
ENSR 2003, Multivariable method to estimate the mercury emissions of the best-performing coal-fired utility units. <epa.gov/ttn/atw/combust/utiltox/final_ensr_multivar.pdf>
Roberson 2002, UARG variability analysis. <epa.gov/ttn/atw/combust/utiltox/epavarifnl.doc>
561 records CEA data Canadian Electricity Association, <ceamercuryprogram.ca/EN/sampling_data.html> preliminary Oct. 2004 data
Utility DataUtility Data
Mer
cury
Ou
t S
tack
(lb
s p
er 1
012 B
tu)
0
5
10
15
5 10 15Mercury in Coal
(lbs per 1012 Btu)
0
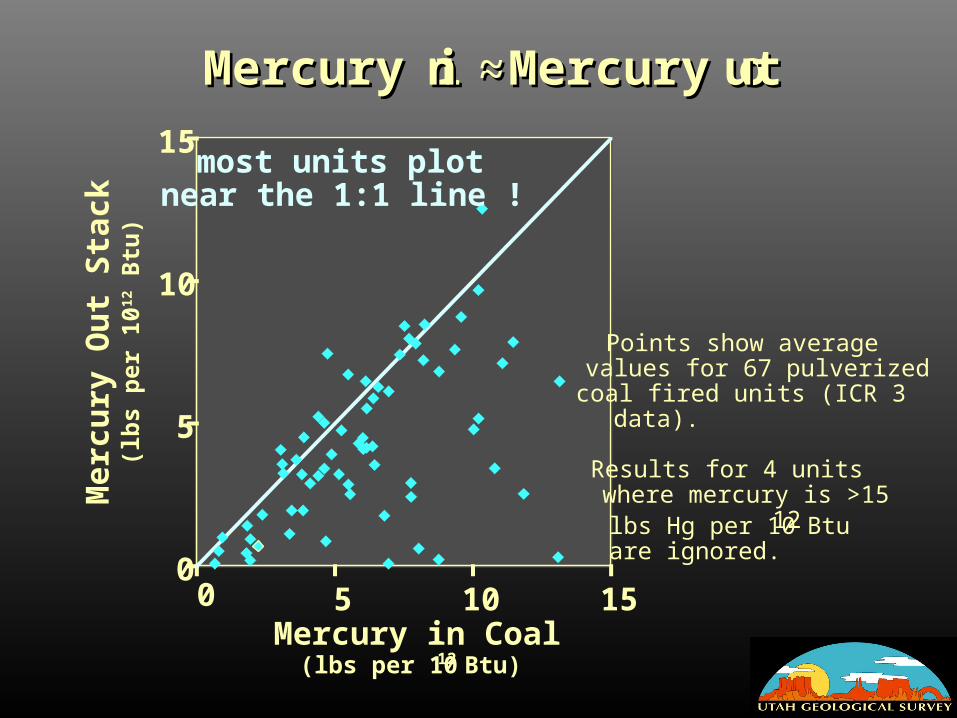
Points show averagevalues for 67 pulverizedcoal fired units (ICR 3data).
Results for 4 unitswhere mercury is >15lbs Hg per 1012 Btuare ignored.
most units plotnear the 1:1 line !
Mercury iMercury in n Mercury o Mercury outut~~~~
Mer
cury
Ou
t S
tack
(lb
s H
g p
er 1
012 B
tu)
0Mercury in Coal
(lbs per 1012 Btu)
0
5
10
15
5 10 15
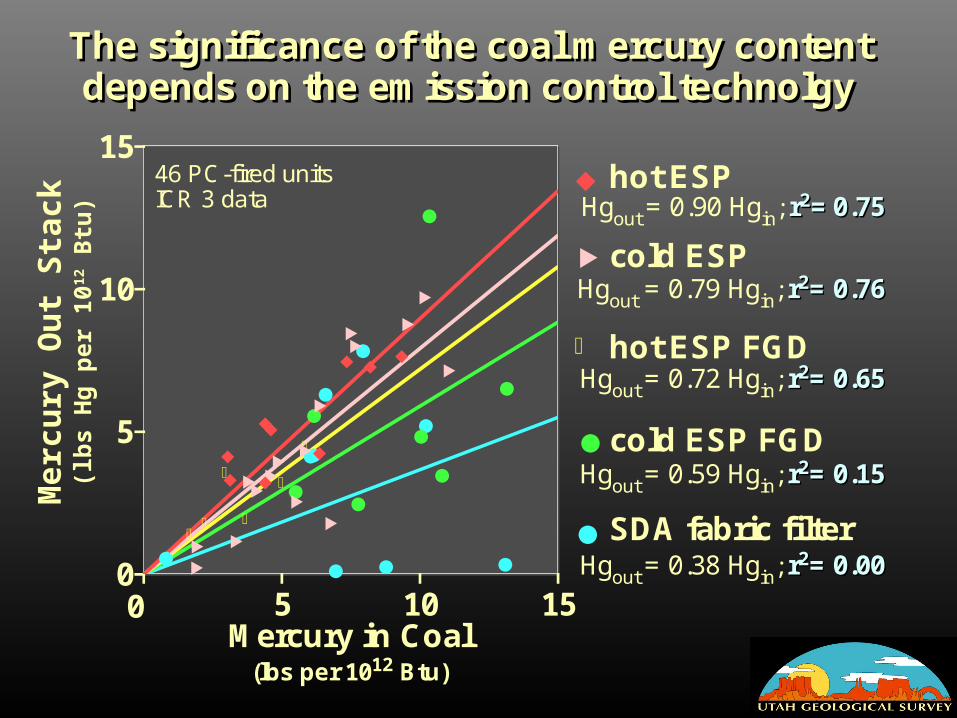
The significance of the coal mercury contentThe significance of the coal mercury contentdepends on the emission control technolgydepends on the emission control technolgy
46 PC-fired unitsICR 3 data
SDA fabric filter
cold ESP
hot ESP FGD
cold ESP FGD
hot ESPHgout = 0.90 Hgin; rr22== 0.750.75
Hgout = 0.79 Hgin; rr22= 0.76= 0.76
Hgout = 0.72 Hgin; rr22= 0.65= 0.65
Hgout = 0.59 Hgin; rr22= 0.15= 0.15
Hgout = 0.38 Hgin; rr22= 0.00= 0.00
0%
20%
40%
60%
80%
100%
50 100 1,000 2,000Chlorine (ppm, dry)
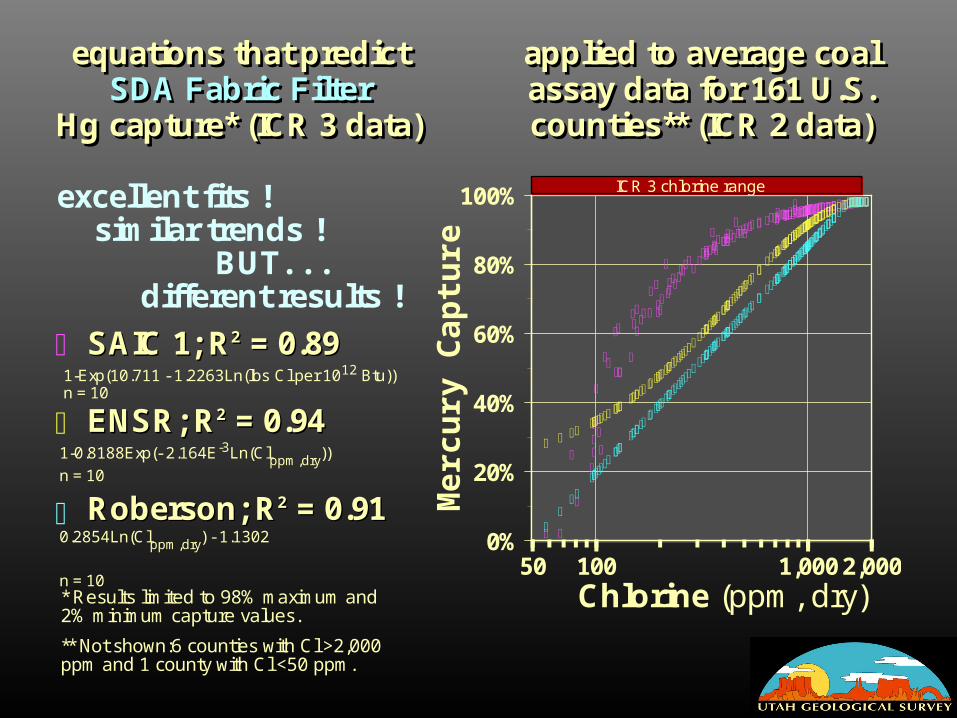
equations that predictequations that predictSDA Fabric FilterSDA Fabric Filter
Hg capture* (ICR 3 data)Hg capture* (ICR 3 data)
applied to average coalapplied to average coalassay data for 161 U.S.assay data for 161 U.S.counties** (ICR 2 data)counties** (ICR 2 data)
ICR 3 chlorine range
SAIC 1; RSAIC 1; R22 = 0.89= 0.891-Exp(10.711 - 1.2263Ln(lbs Cl per 1012 Btu))n = 10
** Not shown:6 counties with Cl >2,000ppm and 1 county with Cl <50 ppm.
* Results limited to 98% maximum and2% minimum capture values.
Roberson; R Roberson; R22 = 0.91 = 0.910.2854Ln(Clppm,dry) - 1.1302
n = 10
ENSR; RENSR; R22 = 0.94 = 0.941-0.8188Exp(- 2.164E-3Ln(Clppm,dry))
n = 10
excellent fits ! similar trends ! BUT. . . different results !
Mer
cury
Cap
ture
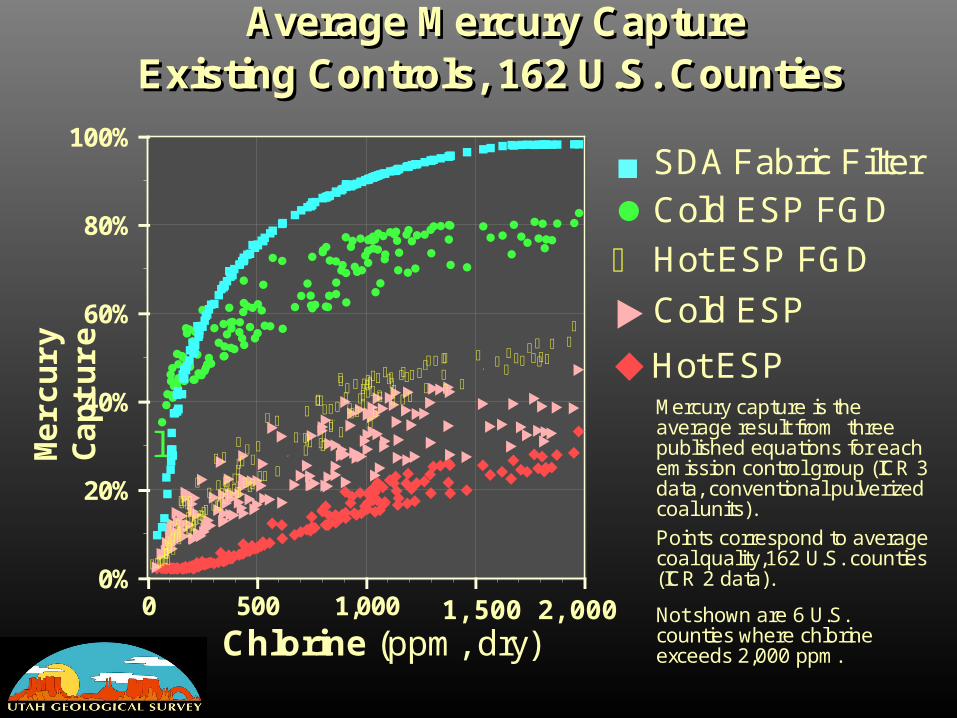
Average Mercury Capture Average Mercury CaptureExisting Controls, 162 U.S. CountiesExisting Controls, 162 U.S. Counties
Chlorine (ppm, dry)
Points correspond to averagecoal quality,162 U.S. counties(ICR 2 data).
Not shown are 6 U.S.counties where chlorineexceeds 2,000 ppm.
Mercury capture is theaverage result from threepublished equations for eachemission control group (ICR 3data, conventional pulverizedcoal units).
Hot ESP
Hot ESP FGD
Cold ESP
Cold ESP FGDSDA Fabric Filter
p
p
p
p
p
l
l
l
0%
20%
40%
60%
80%
100%
0 500 1,000
1,500 2,000
Mer
cury
Cap
ture
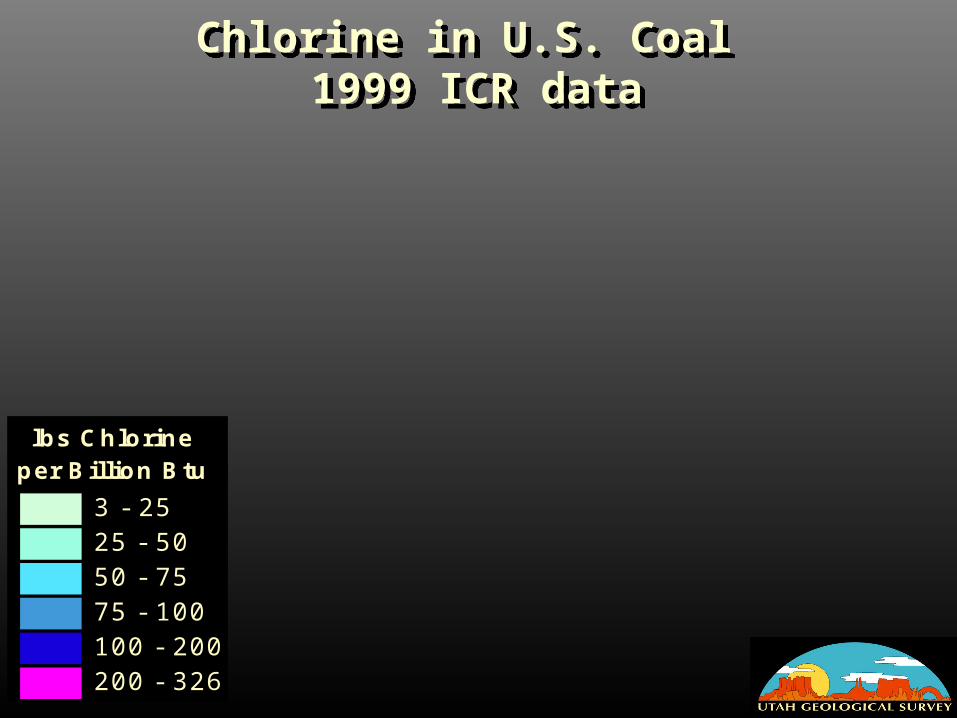
lbs Chlorineper Billion Btu
3 - 2525 - 5050 - 7575 - 100100 - 200200 - 326
Chlorine in U.S. Coal 1999 ICR data
Chlorine in U.S. Coal 1999 ICR data
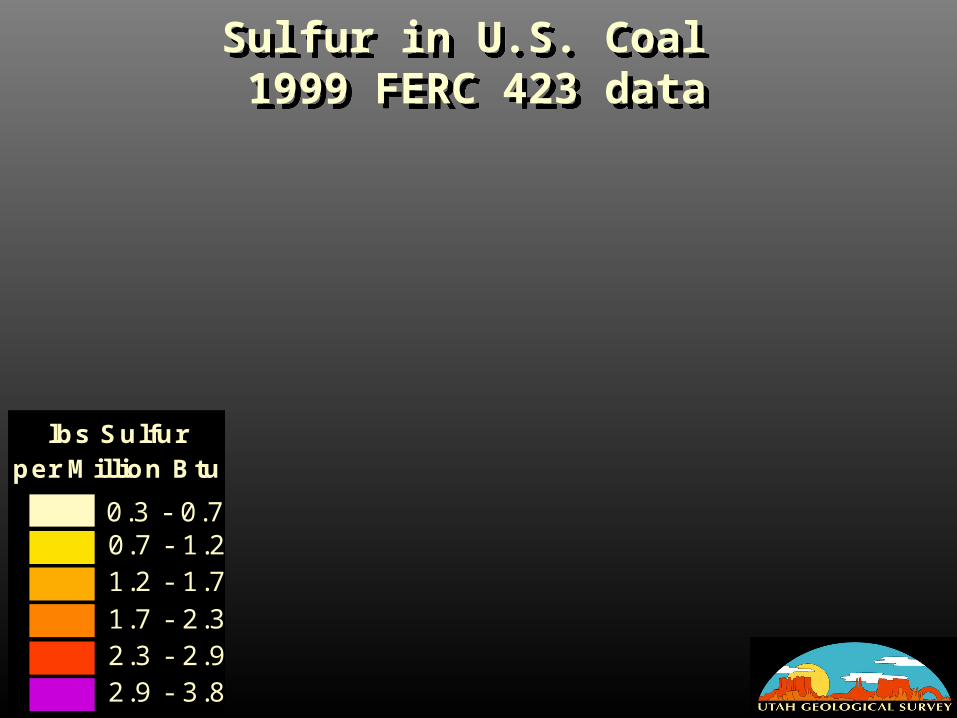
Sulfur in U.S. Coal 1999 FERC 423 dataSulfur in U.S. Coal 1999 FERC 423 data
lbs Sulfurper Million Btu
0.7 - 1.21.2 - 1.71.7 - 2.32.3 - 2.92.9 - 3.8
0.3 - 0.7

% Hg capturecold ESP/FGD
30 - 4040 - 5050 - 6060 - 7070 - 8080 - 90
for units with cold ESP/FGD emission controls for units with cold ESP/FGD emission controlsEstimated % Hg capture, by coal originEstimated % Hg capture, by coal origin
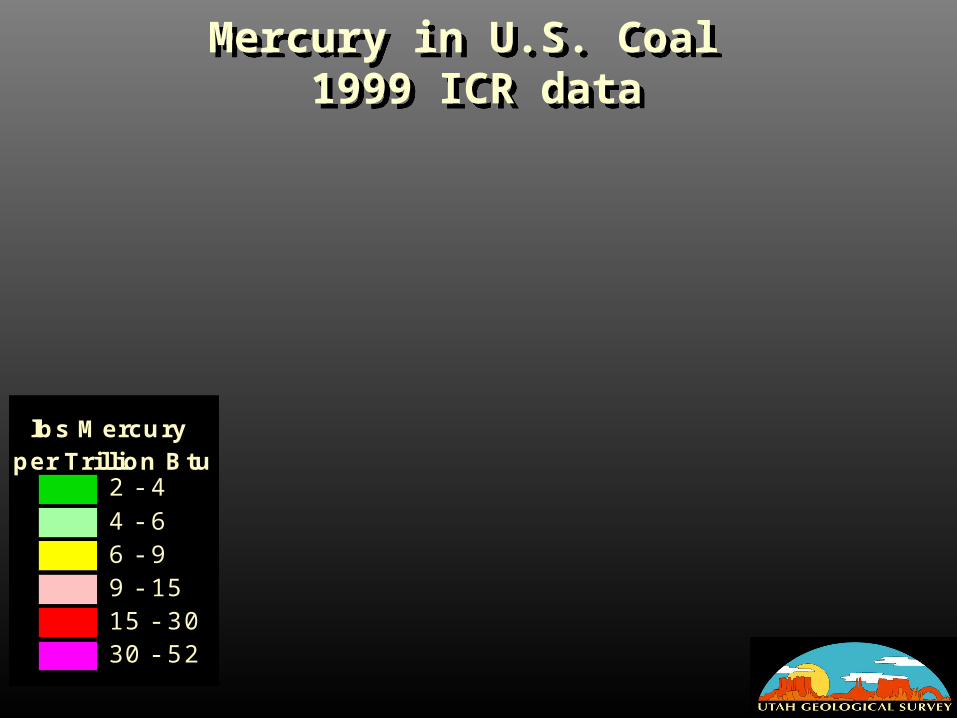
Mercury in U.S. Coal 1999 ICR data
Mercury in U.S. Coal 1999 ICR data
2 - 44 - 66 - 99 - 1515 - 3030 - 52
lbs Mercury per Trillion Btu
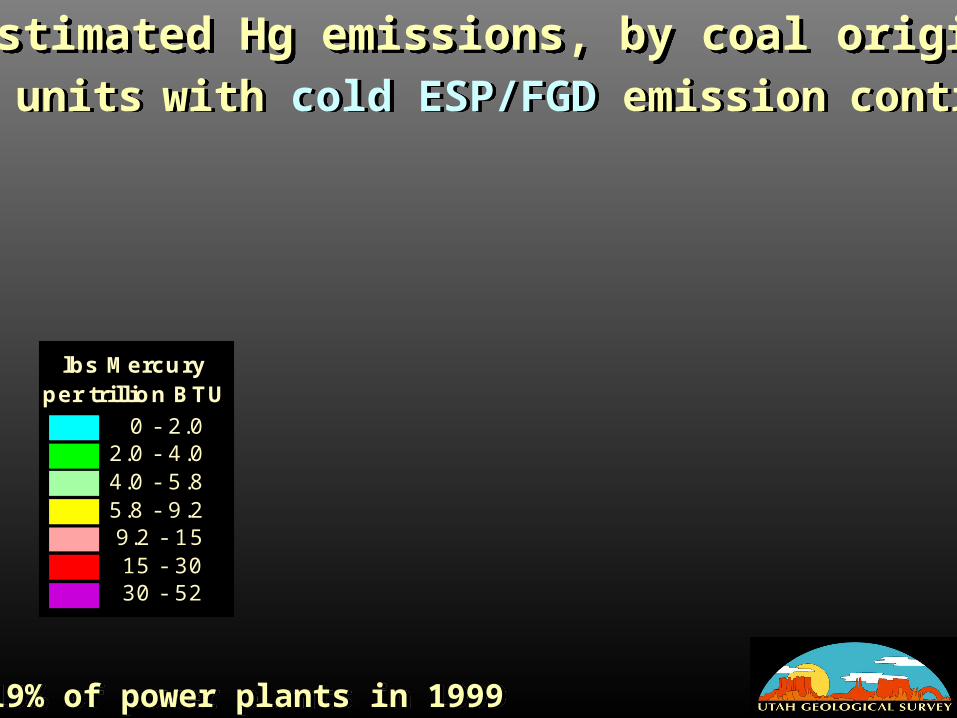
0 - 2.02.0 - 4.0
5.8 - 9.29.2 - 1515 - 3030 - 52
4.0 - 5.8
lbs Mercuryper trillion BTU
Estimated Hg emissions, by coal originEstimated Hg emissions, by coal origin
19% of power plants in 1999 19% of power plants in 1999
for units with cold ESP/FGD emission controls for units with cold ESP/FGD emission controls
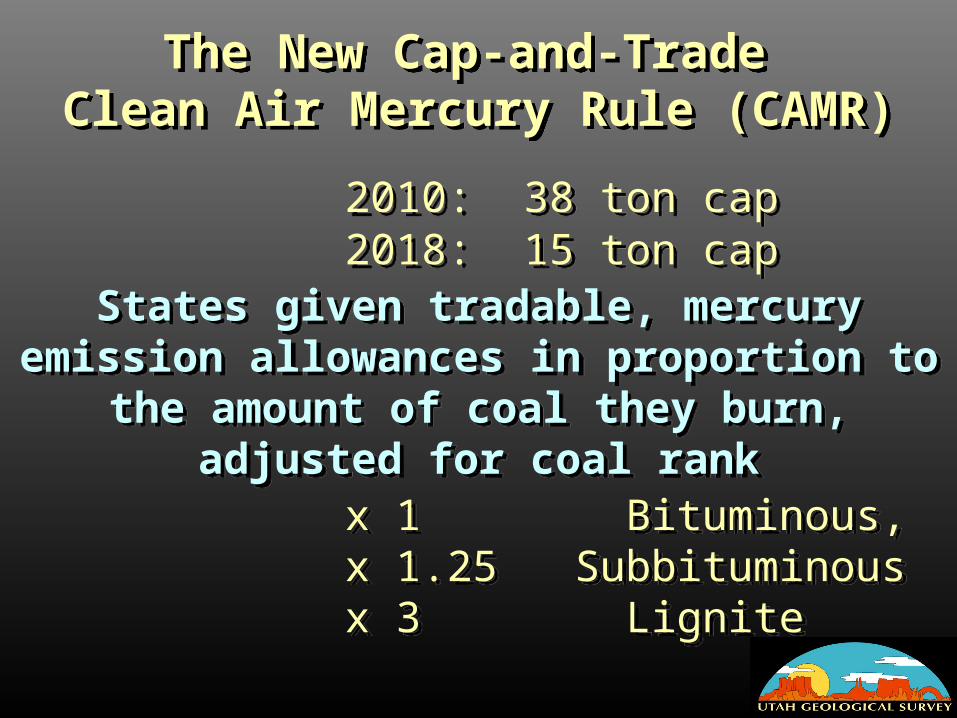
2010: 38 ton cap 2018: 15 ton cap
States given tradable, mercury emission allowances in proportion to the amount of
coal they burn, adjusted for coal rankx 1 Bituminous, x 1.25 Subbituminousx 3 Lignite
2010: 38 ton cap 2018: 15 ton cap
States given tradable, mercury emission allowances in proportion to the amount of
coal they burn, adjusted for coal rankx 1 Bituminous, x 1.25 Subbituminousx 3 Lignite
The New Cap-and-Trade Clean Air Mercury Rule (CAMR)
The New Cap-and-Trade Clean Air Mercury Rule (CAMR)

% M
ercu
ry C
ap
ture
% M
ercu
ry C
ap
ture
Cenozoic-Mesozoic Coal
Mercury capture varies withGeologic Age - Not Coal RankMercury capture varies with
Geologic Age - Not Coal RankAll U.S. Coal
Modified from: State of Utah comment to EPA Docket: OAR-2002-0056-5411Modified from: State of Utah comment to EPA Docket: OAR-2002-0056-5411
0
20
40
60
80
100
Paleozoic
Cenozoic-Mesozoic
HotESP
ColdESP
HotESPFGD
ColdESPFGD
SDAFF
HotESP
ColdESP
HotESPFGD
ColdESPFGD
SDAFF
0
20
40
60
80
100
LigniteSubbituminousBituminous
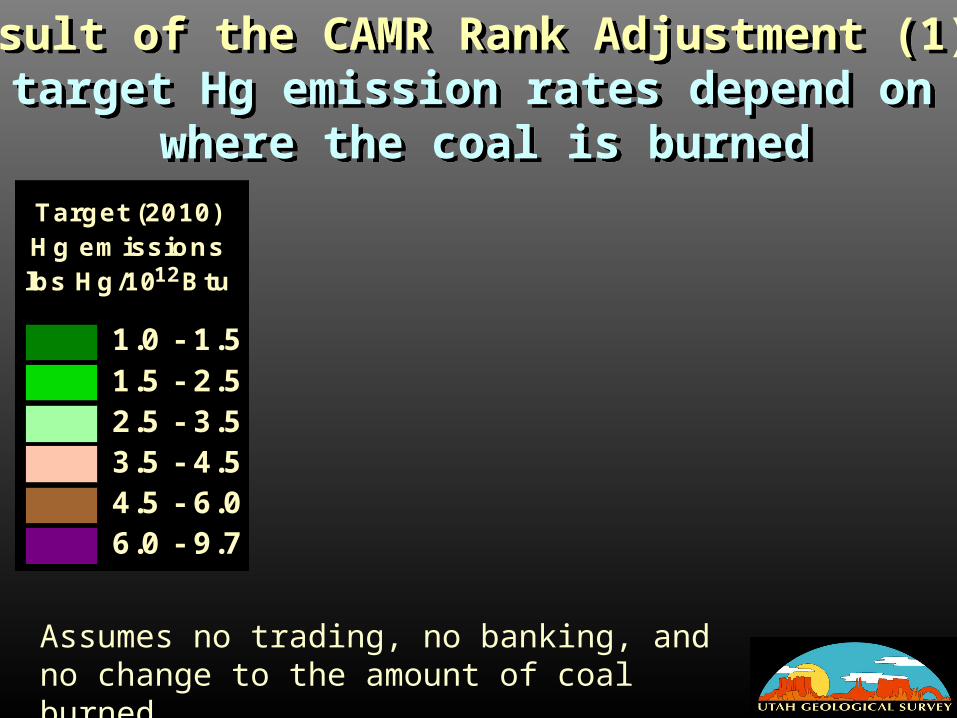
Result of the CAMR Rank Adjustment (1): target Hg emission rates depend on
where the coal is burned
Result of the CAMR Rank Adjustment (1): target Hg emission rates depend on
where the coal is burned
Target (2010)Hg emissionslbs Hg/10 Btu
1.5 - 2.52.5 - 3.53.5 - 4.54.5 - 6.06.0 - 9.7
1.0 - 1.5
12
Assumes no trading, no banking, and no change to the amount of coal burned
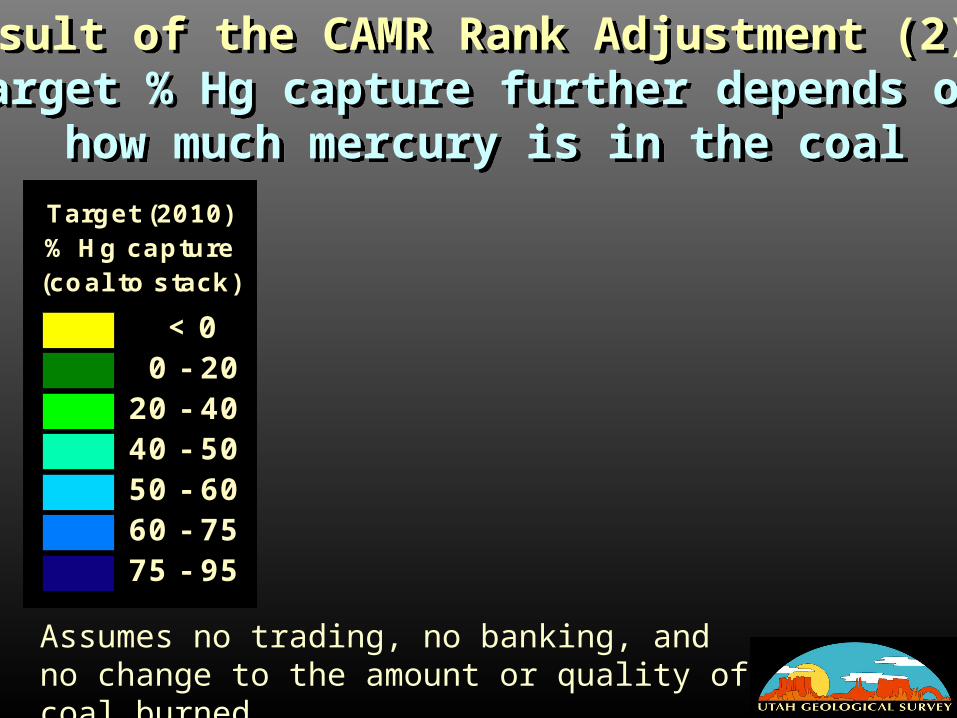
Result of the CAMR Rank Adjustment (2): target % Hg capture further depends on
how much mercury is in the coal
Result of the CAMR Rank Adjustment (2): target % Hg capture further depends on
how much mercury is in the coal
Assumes no trading, no banking, and no change to the amount or quality of coal burned
Target (2010)% Hg capture(coal to stack)
< 0 0 - 2020 - 4040 - 5050 - 6060 - 7575 - 95