Embed Size (px)
Citation preview

Marc Naughton
Executive Vice President and Chief Financial Officer
June 2, 2015
Jefferies Healthcare Conference

© Cerner Corporation. All rights reserved. All Cerner trademarks and logos are owned or licensed by Cerner Corporation and/or its affiliates. All other brand or product names are trademarks or registered marks of their respective owners.
2
Safe Harbor Statement
This presentation may contain forward-looking statements, including without limitation, those regarding projections of future revenues or earnings, operating margins, operating expenses, product development, new markets or prospects for Cerner’s solutions and plans and expectations related to the acquisition of Siemens Health Services. These forward-looking statements are based on the current beliefs, expectations and assumptions of Cerner's management with respect to future events and are subject to a number of significant risks and uncertainties. Cerner’s performance, and actual results, financial condition or business could differ materially from those expressed in such forward-looking statements. Factors that could cause or contribute to such differences include, but are not limited to:
(a) the possibility of product-related liabilities; (b) potential claims for system errors and warranties; (c) the possibility of interruption at our data centers or client support facilities; (d) our proprietary technology may be subject to claims for infringement or misappropriation of intellectual property rights of others, or may be infringed or misappropriated by others; (e) material adverse resolution of legal proceedings; (f) risks associated with our non-U.S. operations; (g) risks associated with our ability to effectively hedge exposure to fluctuations in foreign currency exchange rates; (h) the potential for tax legislation initiatives that could adversely affect our tax position and/or challenges to our tax positions in the United States and non-U.S. countries; (i) risks associated with our recruitment and retention of key personnel; (j) risks related to our dependence on third party suppliers; (k) risks inherent with business acquisitions and combinations and the integration thereof, such as difficulties and operational and financial risks associated with integrating Cerner and the Siemens Health Services business acquired from Siemens AG and failure to realize the synergies and other benefits expected from the transaction; (l) the potential for losses resulting from asset impairment charges; (m) risks associated with volatility and disruption resulting from global economic conditions; (n) managing growth in the new markets in which we offer solutions, health care devices and services; (o) incurring significant additional expenses relating to the integration of the Siemens Health Services business into Cerner; (p) compliance with restrictive covenants in our debt agreements, which may restrict our flexibility to operate our business; (q) changing political, economic, regulatory and judicial influences; (r) government regulation; (s) significant competition and market changes; (t) variations in our quarterly operating results; (u) potential inconsistencies in our sales forecasts compared to actual sales; (v) volatility in the trading price of our common stock and the timing and volume of market activity; and (w) our directors’ authority to issue preferred stock and the anti-takeover provisions in our corporate governance documents.
Additional discussion of these and other risks, uncertainties and factors affecting Cerner's business is contained in Cerner's filings with the Securities and Exchange Commission. The reader should not place undue reliance on forward-looking statements, since the statements speak only as of the date that they are made. Cerner undertakes no obligation to update forward-looking statements to reflect changed assumptions, the occurrence of unanticipated events or changes in future operating results, financial condition or business over time. A reconciliation of non-GAAP financial measures discussed in this presentation can be found in the Appendix to this presentationand Cerner’s most recent earnings release that was furnished to the SEC and posted on the investor section of www.cerner.com.
© Cerner Corporation. All rights reserved. All Cerner trademarks and logos are owned or licensed by Cerner Corporation and/or its affiliates. All other brand or product names are trademarks or registered marks of their respective owners.
3
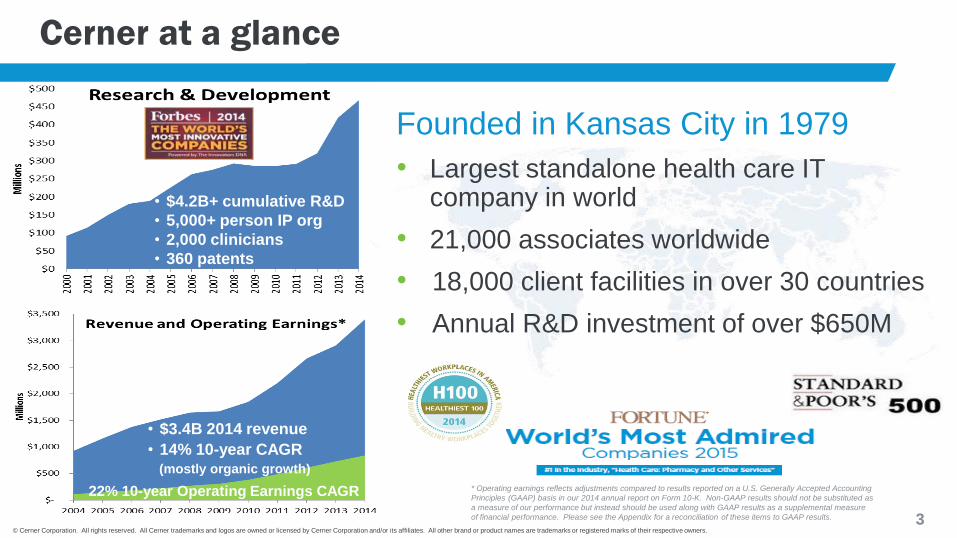
Cerner at a glance
Founded in Kansas City in 1979
• Largest standalone health care IT company in world
• 21,000 associates worldwide
• 18,000 client facilities in over 30 countries
• Annual R&D investment of over $650M
• $4.2B+ cumulative R&D
• 5,000+ person IP org
• 2,000 clinicians
• 360 patents
• $3.4B 2014 revenue
• 14% 10-year CAGR (mostly organic growth)
22% 10-year Operating Earnings CAGR * Operating earnings reflects adjustments compared to results reported on a U.S. Generally Accepted Accounting
Principles (GAAP) basis in our 2014 annual report on Form 10-K. Non-GAAP results should not be substituted as
a measure of our performance but instead should be used along with GAAP results as a supplemental measure
of financial performance. Please see the Appendix for a reconciliation of these items to GAAP results.

© Cerner Corporation. All rights reserved. All Cerner trademarks and logos are owned or licensed by Cerner Corporation and/or its affiliates. All other brand or product names are trademarks or registered marks of their respective owners.
4
Cerner Health Services (HS)Strategic and Accretive
• Strategic
• Enhances Cerner’s robust standalone organic growth opportunities
• Expands base into which Cerner can sell broad solutions and services
• Complementary geographic footprints
• Significant R&D investment drives innovation
• Accretive
• Estimated adjusted operating earnings* accretion ramps from $80M in 2015 to $175M in 2017
• Expect combined adjusted operating margin* over 25% by 2017
* Operating earnings reflects adjustments compared to results reported on a U.S. Generally Accepted Accounting
Principles (GAAP) basis in our 2014 annual report on Form 10-K. Non-GAAP results should not be substituted as
a measure of our performance but instead should be used along with GAAP results as a supplemental measure of
financial performance. Please see the Appendix for a reconciliation of these items to GAAP results.

© Cerner Corporation. All rights reserved. All Cerner trademarks and logos are owned or licensed by Cerner Corporation and/or its affiliates. All other brand or product names are trademarks or registered marks of their respective owners.
5
Marketplace Observations
• U.S. Health System being digitized• Interoperability progress• Fee for Service fading• “Cadillac” Tax / Defined Contribution
Decade of Key Milestones
• HealtheIntent platform gaining traction
• Interoperability leadership
Measures and Mandates leading to Population health, Interoperability
• Expect 50%+ to evaluate switching EMR
• Gap after top 2 suppliers wideningEMR opportunity still
large
• Providers seeking scale across continuum
• Cerner clients leadingConsolidation
• Integrated clinical / revenue cycle favored
• Significant Cerner opportunityRevenue cycle
© Cerner Corporation. All rights reserved. All Cerner trademarks and logos are owned or licensed by Cerner Corporation and/or its affiliates. All other brand or product names are trademarks or registered marks of their respective owners.
6
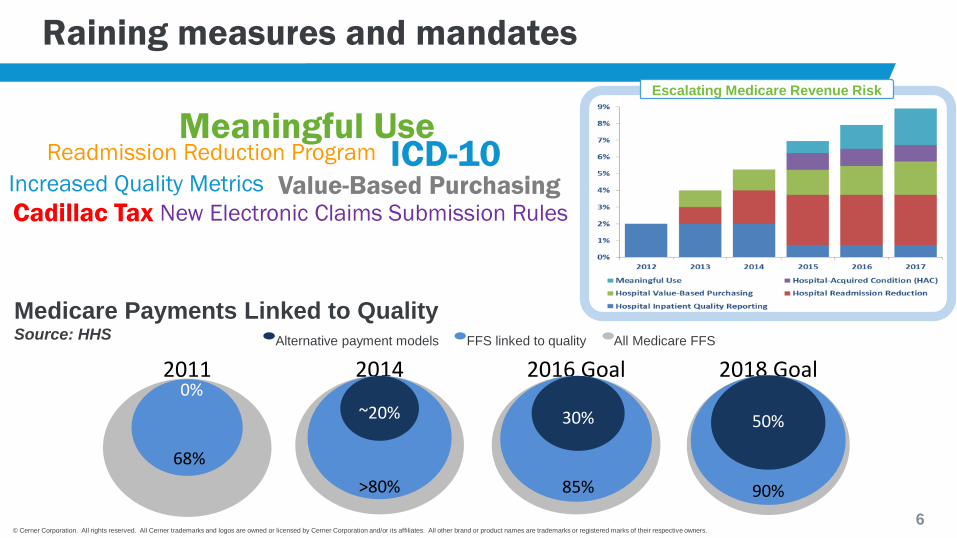
Raining measures and mandates
2016 Goal
30%
85%
2018 Goal
50%
90%
2014
~20%
>80%
20110%
68%
Escalating Medicare Revenue Risk
Medicare Payments Linked to QualitySource: HHS Alternative payment models FFS linked to quality All Medicare FFS
Meaningful UseICD-10
Value-Based Purchasing
Readmission Reduction Program
New Electronic Claims Submission Rules
Increased Quality Metrics
Cadillac Tax

© Cerner Corporation. All rights reserved. All Cerner trademarks and logos are owned or licensed by Cerner Corporation and/or its affiliates. All other brand or product names are trademarks or registered marks of their respective owners.
7
Population health
• HealtheIntent Cloud Platform
• Connect the continuum
• Empower members, care teams & organizations
• Facilitate knowledge-driven care & continuous learning
• Cerner Differentiators
• Real-time, actionable in workflow, programmable
• Comprehensive approach
• Most competitors have narrow focus and rely on latent data
Support move
from reactive
care to
proactive
health.

© Cerner Corporation. All rights reserved. All Cerner trademarks and logos are owned or licensed by Cerner Corporation and/or its affiliates. All other brand or product names are trademarks or registered marks of their respective owners.
8
Cerner is leading the way towards Interoperability
• Key leadership role in creating Direct – the
nation’s standard for secure email
• Over 150,000 lines of open-source code donated
by Cerner
• Co-founded CommonWell, to solve the problem of universal, vendor-independent access to the complete patient record
• Members represent 70% of acute share
• First major EHR supplier to demo SMART on FHIR apps (HIMSS 2014)
• Founding member of the Argonaut Project to accelerate development and adoption of FHIR
• Substitutable Medical Applications & Reusable Technologies
• Fast Health Interoperability Resources

© Cerner Corporation. All rights reserved. All Cerner trademarks and logos are owned or licensed by Cerner Corporation and/or its affiliates. All other brand or product names are trademarks or registered marks of their respective owners.
9
Significant Opportunities 2015 and Beyond
• Pipeline continues to grow
even after nearly $14B of
bookings from 2011-2014
• All categories experiencing
sustained upward trend
• Notable increase in new footprint
opportunities expected to be
decided in 2015
• Mix of opportunities aligns well with
Cerner’s strengths

© Cerner Corporation. All rights reserved. All Cerner trademarks and logos are owned or licensed by Cerner Corporation and/or its affiliates. All other brand or product names are trademarks or registered marks of their respective owners.
10
MEDITECH
Total acquisitions*
Same EMR vendor
Potential wins
Potential losses**
Potential net wins
Acquired
Hospitals
*Total acquisitions – total acquisitions by clients
**Potential losses – total acquisitions by competitors clients
Source: HIMSS Analytics 2013-2014
Cerner clients accounted for 50% of buying activity17 of top 30 health systems have a Cerner EHR footprint
Potential HIT Impact of Hospital M&A 2013-2014 Leading Supplier Activity
170
5443
169 10
154
4533
-16
-34
-56
138
11
-23
-60
-30
0
30
60
90
120
150
180

© Cerner Corporation. All rights reserved. All Cerner trademarks and logos are owned or licensed by Cerner Corporation and/or its affiliates. All other brand or product names are trademarks or registered marks of their respective owners.
11
Revenue cycle
Strong growth and operational progress RevWorks• Revenue up 39% to $205M in 2014
• Strength across all Revenue Cycle solutions and services
• Over 1,400 live sites; 200 hospitals; 1,200 clinics
• Large clients beginning to switch to Cerner revenue cycle
• HS adds strong revenue cycle experience
• Partner with client to manage revenue cycle operations
• Take over revenue cycle operation or assist in specific area with Extended Business Office
• Focus on controlling cost to collect
• Preparing for future reimbursement models
• Expect ramp in full RevWorks post ICD-10

© Cerner Corporation. All rights reserved. All Cerner trademarks and logos are owned or licensed by Cerner Corporation and/or its affiliates. All other brand or product names are trademarks or registered marks of their respective owners.
12
Working with clients in
30+ countries
Proven Experience Around the World
$0
$50
$100
$150
$200
$250
$300
$350
$400
'04 '05 '06 '07 '08 '09 '10 '11 '12 '13 '14
Mil
lio
ns
Global Revenue
Leader in Automation
Most Global Stage 6 & 7 clients
Complementary Health Services Footprint

Financial Highlights
© Cerner Corporation. All rights reserved. All Cerner trademarks and logos are owned or licensed by Cerner Corporation and/or its affiliates. All other brand or product names are trademarks or registered marks of their respective owners.
14
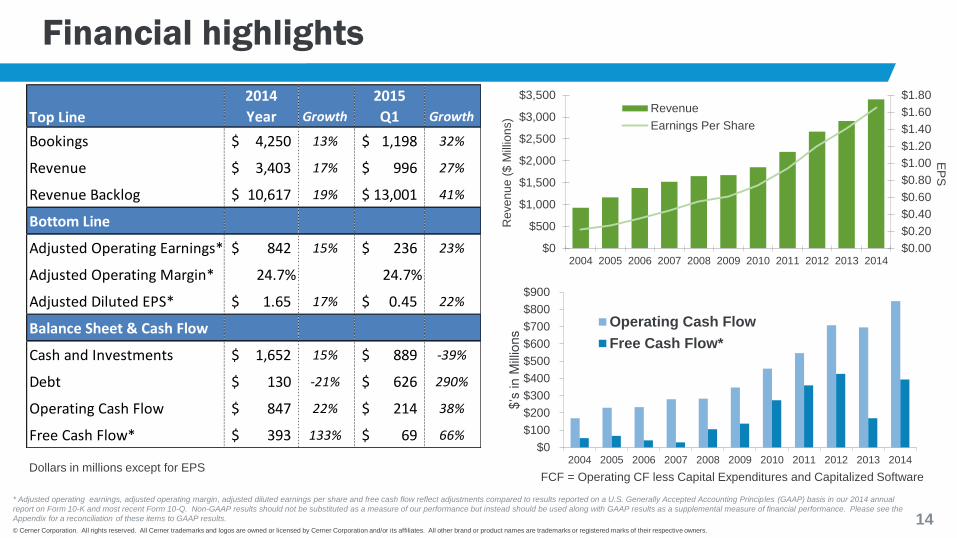
Financial highlights
$0.00
$0.20
$0.40
$0.60
$0.80
$1.00
$1.20
$1.40
$1.60
$1.80
$0
$500
$1,000
$1,500
$2,000
$2,500
$3,000
$3,500
2004 2005 2006 2007 2008 2009 2010 2011 2012 2013 2014
EP
S
Reve
nu
e (
$ M
illio
ns)
Revenue
Earnings Per Share
$0
$100
$200
$300
$400
$500
$600
$700
$800
$900
2004 2005 2006 2007 2008 2009 2010 2011 2012 2013 2014
$’s
in M
illio
ns
Operating Cash Flow
Free Cash Flow*
* Adjusted operating earnings, adjusted operating margin, adjusted diluted earnings per share and free cash flow reflect adjustments compared to results reported on a U.S. Generally Accepted Accounting Principles (GAAP) basis in our 2014 annual
report on Form 10-K and most recent Form 10-Q. Non-GAAP results should not be substituted as a measure of our performance but instead should be used along with GAAP results as a supplemental measure of financial performance. Please see the
Appendix for a reconciliation of these items to GAAP results.
FCF = Operating CF less Capital Expenditures and Capitalized SoftwareDollars in millions except for EPS
Top Line
2014
Year Growth
2015
Q1 Growth
Bookings 4,250$ 13% 1,198$ 32%
Revenue 3,403$ 17% 996$ 27%
Revenue Backlog 10,617$ 19% 13,001$ 41%
Bottom Line
Adjusted Operating Earnings* 842$ 15% 236$ 23%
Adjusted Operating Margin* 24.7% 24.7%
Adjusted Diluted EPS* 1.65$ 17% 0.45$ 22%
Balance Sheet & Cash Flow
Cash and Investments 1,652$ 15% 889$ -39%
Debt 130$ -21% 626$ 290%
Operating Cash Flow 847$ 22% 214$ 38%
Free Cash Flow* 393$ 133% 69$ 66%

© Cerner Corporation. All rights reserved. All Cerner trademarks and logos are owned or licensed by Cerner Corporation and/or its affiliates. All other brand or product names are trademarks or registered marks of their respective owners.
15
Investing in our Future
* Represents Gross R&D (before capitalization and amortization)
• $4.2 billion of cumulative R&D investments since 1979
• Expect to invest approximately same amount in next 6 years
• R&D continues to be focused on population health, physician experience, open platforms, revenue cycle and mobility
• With scale from additional Health Services R&D, we expect to maintain industry-leading R&D investment while also getting financial leverage
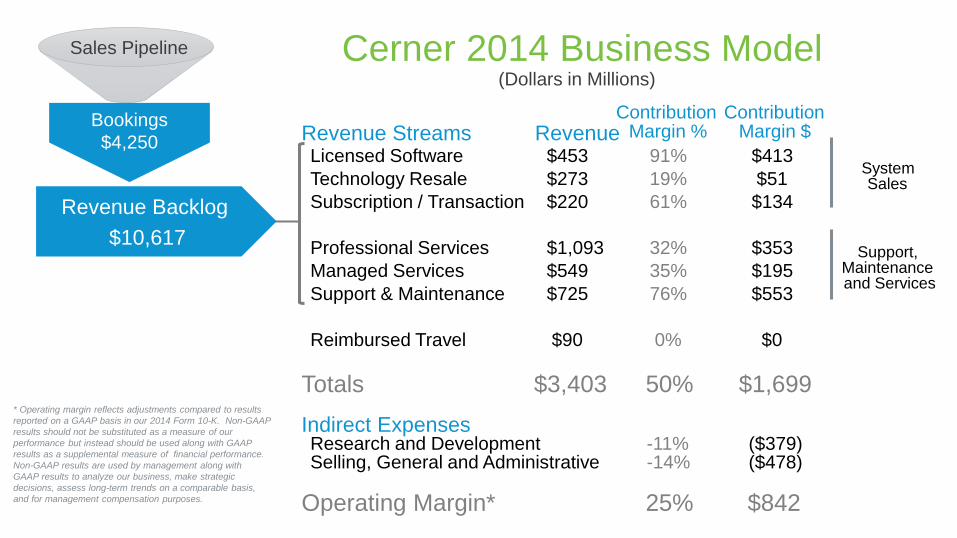
Sales Pipeline
Bookings
$4,250
Cerner 2014 Business Model
Revenue Backlog
$10,617
(Dollars in Millions)
* Operating margin reflects adjustments compared to results
reported on a GAAP basis in our 2014 Form 10-K. Non-GAAP
results should not be substituted as a measure of our
performance but instead should be used along with GAAP
results as a supplemental measure of financial performance.
Non-GAAP results are used by management along with
GAAP results to analyze our business, make strategic
decisions, assess long-term trends on a comparable basis,
and for management compensation purposes.
Revenue Streams RevenueContribution
Margin %Contribution
Margin $
Licensed Software $453 91% $413
Technology Resale $273 19% $51
Subscription / Transaction $220 61% $134
Professional Services $1,093 32% $353
Managed Services $549 35% $195
Support & Maintenance $725 76% $553
Reimbursed Travel $90 0% $0
Totals $3,403 50% $1,699
Indirect ExpensesResearch and Development -11% ($379)Selling, General and Administrative -14% ($478)
Operating Margin* 25% $842
System Sales
Support, Maintenance and Services

© Cerner Corporation. All rights reserved. All Cerner trademarks and logos are owned or licensed by Cerner Corporation and/or its affiliates. All other brand or product names are trademarks or registered marks of their respective owners.
17
Revenue and Margin Visibility
* Operating margin reflects adjustments compared to results reported on a GAAP basis in our 2014 Form 10-K. Non-GAAP results should not be substituted as a measure of our performance but instead should be
used along with GAAP results as a supplemental measure of financial performance. Non-GAAP results are used by management along with GAAP results to analyze our business, make strategic decisions, assess
long-term trends on a comparable basis, and for management compensation purposes.
Visibility remains strong• 78% of revenue and 73% of
margin recurring or visible
• Expect revenue and margin
visibility to increase with
Health Services
Trend is positive
• Operating margin % has
doubled in last 10 years
• Margin visibility has
increased from 50% to 73%
Revenue and Margin Visibility Revenue
Contribution
Margin
Recurring
Managed Services, Support & Maintenance,
Subscriptions
45% 52%
Visible (Professional Services) 33% 21%
Total Recurring/Visible 78% 73%
Non-Recurring (Software, Tech Resale) 22% 27%

© Cerner Corporation. All rights reserved. All Cerner trademarks and logos are owned or licensed by Cerner Corporation and/or its affiliates. All other brand or product names are trademarks or registered marks of their respective owners.
18
A Decade of Strong Growth
2020 estimates do not
represent formal
financial guidance.
Expect double-digit
growth after 2015• Continued strong
organic growth
• Health Services
cross-sell
opportunities across
all key areas
• Estimated 14%
organic CAGR for
decade
• Equals highest
scenario from
prior 2020
estimates

© Cerner Corporation. All rights reserved. All Cerner trademarks and logos are owned or licensed by Cerner Corporation and/or its affiliates. All other brand or product names are trademarks or registered marks of their respective owners.
19
Guidance as of May 7, 2015
Metric Q215 2015
Revenue $1.175B - $1.225B $4.65B - $4.8B
Adjusted diluted earnings per share* $0.51 - $0.52 $2.07 - $2.15
New business bookings $1.2B - $1.3B
Share-based compensation expense $0.03 - $0.04 $0.14 - $0.16
Reg FD Disclaimer – This slide reflects guidance provided in the most recent earnings press release and does not imply a
reiteration or update of guidance.
*Adjusted Diluted Earnings Per Share reflects adjustments compared to results reported on a U.S. Generally Accepted Accounting Principles (GAAP) basis in our 2014 annual report on Form 10-K and most recent
Form 10-Q. Non-GAAP results should not be substituted as a measure of our performance but instead should be used along with GAAP results as a supplemental measure of financial performance. Please see the
Appendix for a reconciliation of these items to GAAP results.
**Includes projected results from acquisition of Siemens Health Services, excluding acquisition-related adjustments.

Health care is too importantto stay the same.TM

© Cerner Corporation. All rights reserved. All Cerner trademarks and logos are owned or licensed by Cerner Corporation and/or its affiliates. All other brand or product names are trademarks or registered marks of their respective owners.
21
Appendix - non-GAAP financial measures
The presentation of Adjusted Operating Earnings, Adjusted Net Earnings, Adjusted Diluted Earnings Per Share, and Free Cash Flow (together, the Non-GAAP Financial Measures), are not meant to
be considered in isolation, as a substitute for, or superior to, U.S. Generally Accepted Accounting Principles (GAAP) results and investors should be aware that non-GAAP financial measures have
inherent limitations and should be read only in conjunction with the Company’s consolidated financial statements prepared in accordance with GAAP. The Non-GAAP Financial Measures may also be
different from similar non-GAAP financial measures used by other companies and may not be comparable to similarly titled captions of other companies due to potential inconsistencies in the method
of calculations. The Company believes that the Non-GAAP Financial Measures are important to enable investors to better understand and evaluate its ongoing operating results and allows for greater
transparency in the review of its overall financial, operational and economic performance. The Company provides earnings with and without share-based compensation expense and acquisition-related
adjustments because earnings excluding these items are used by management along with GAAP results to analyze its business, make strategic decisions, assess long-term trends on a comparable
basis, and for management compensation purposes. The Company provides cash flow with and without capital purchases and software development cost because operating cash flows excluding
these expenditures takes into account the capital expenditures necessary to operate our business.
Please see below and the Company’s earnings releases and other information posted on the investor section of Cerner.com for a reconciliation of 2014 Non-GAAP Financial Measures to GAAP
results. Cerner’s future period guidance in this presentation includes adjustments for items not indicative of our core operations, which may include without limitation share-based compensation
expense and acquisition-related expenses, such as integration expense, and may be affected by changes in ongoing assumptions and judgments relating to the company's acquired businesses, and
may also be affected by nonrecurring, unusual or unanticipated charges, expenses or gains, all of which are excluded in the calculation of non-GAAP Adjusted Operating Earnings and Adjusted
Diluted Earnings Per Share. The exact amount of these charges or credits are not currently determinable, but may be significant. It is therefore not practicable to reconcile this non-GAAP guidance to
the most comparable GAAP measure.
($ in millions except Earnings Per Share)Operating
Earnings
Operating
Margin %
GAAP Operating Earnings 763$ 22.4%
Share-based compensation expense 63
Adjustments related to acquisition of Siemens Health Services 16
Adjusted Operating Earnings 842$ 24.7%
Net
Earnings
Diluted
Earnings
Per Share
GAAP Net Earnings 525$ 1.50$
Share-based compensation expense, net of tax 41 0.12
Adjustments related to acquisition of Siemens Health Services, net of tax 10 0.03
Adjusted Net Earnings (non-GAAP) 576$ 1.65$
GAAP Operating Cash Flow 847$
Capital purchases (277)
Capitalized software development costs (178)
Free Cash Flow (Non-GAAP) 393$
Reconciliation of 2014 Non-GAAP Results to GAAP Results*
*More detail on these adjustments and management's use of Non-GAAP results is in our 2014 annual
report on Form 10-K and our current reports on Form 8-K.