Embed Size (px)
Citation preview

Jefferies 2014 Global Industrials Conference
August 13, 2014
Forward Looking Statements
2
This presentation contains forward-looking statements within the meaning of the Private Securities Litigation Reform Act of 1995, including statements regarding Engility’s future prospects, projected financial results, estimated integration costs and acquisition related amortization expenses, and business plans. Words such as “may,” “will,” “should,” “likely,” “anticipates,” “expects,” “intends,” “plans,” “projects,” “believes,” “estimates” and similar expressions are also used to identify these forward-looking statements. These statements are based on the current beliefs and expectations of Engility’s management and are subject to significant risks and uncertainties. Actual results may differ from those set forth in the forward-looking statements. Factors that could cause Engility’s actual results to differ materially from those described in the forward-looking statements can be found under the heading “Risk Factors” included in our Annual Report on Form 10-K for the year ended December 31, 2013, and more recent periodic reports, which have been filed with the Securities and Exchange Commission (SEC) and are available on the investor relations section of Engility’s website (http://www.engilitycorp.com) and on the SEC’s website (www.sec.gov). Forward-looking statements are made only as of the date hereof, and we undertake no obligation to update or revise the forward-looking statements, whether as a result of new information, future events or otherwise, except as required by law. In addition, historical information should not be considered as an indicator of future performance.
Company Overview
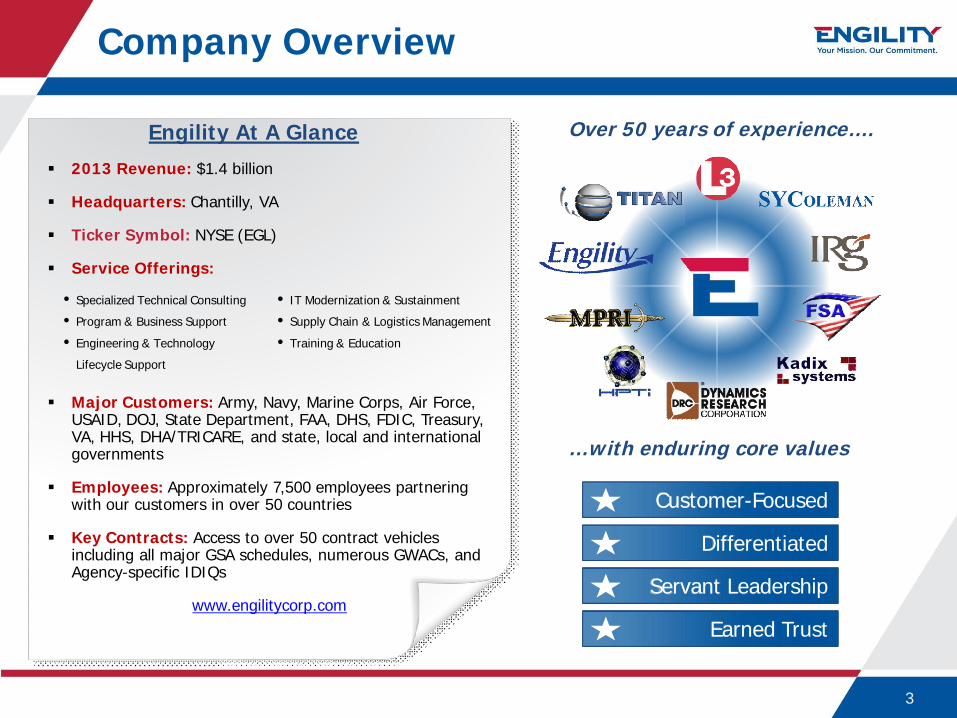
Engility At A Glance
2013 Revenue: $1.4 billion
Headquarters: Chantilly, VA
Ticker Symbol: NYSE (EGL)
Service Offerings:
Major Customers: Army, Navy, Marine Corps, Air Force, USAID, DOJ, State Department, FAA, DHS, FDIC, Treasury, VA, HHS, DHA/TRICARE, and state, local and international governments
Employees: Approximately 7,500 employees partnering with our customers in over 50 countries
Key Contracts: Access to over 50 contract vehicles including all major GSA schedules, numerous GWACs, and Agency-specific IDIQs
www.engilitycorp.com
3
Over 50 years of experience….
…with enduring core values
Customer-FocusedCustomer-Focused
DifferentiatedDifferentiated
Servant LeadershipServant Leadership
Earned TrustEarned Trust
• Specialized Technical Consulting
• Program & Business Support
• Engineering & Technology
Lifecycle Support
• IT Modernization & Sustainment
• Supply Chain & Logistics Management
• Training & Education
Leveraging 50 Years of Success
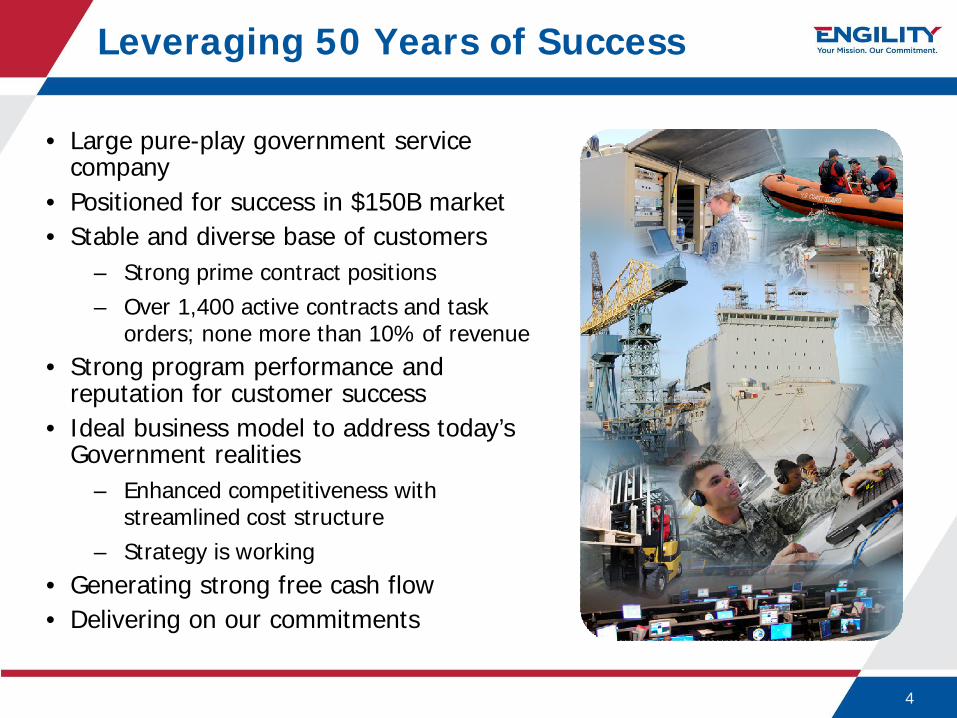
• Large pure-play government service company
• Positioned for success in $150B market• Stable and diverse base of customers
– Strong prime contract positions– Over 1,400 active contracts and task
orders; none more than 10% of revenue• Strong program performance and
reputation for customer success• Ideal business model to address today’s
Government realities– Enhanced competitiveness with
streamlined cost structure– Strategy is working
• Generating strong free cash flow• Delivering on our commitments
4
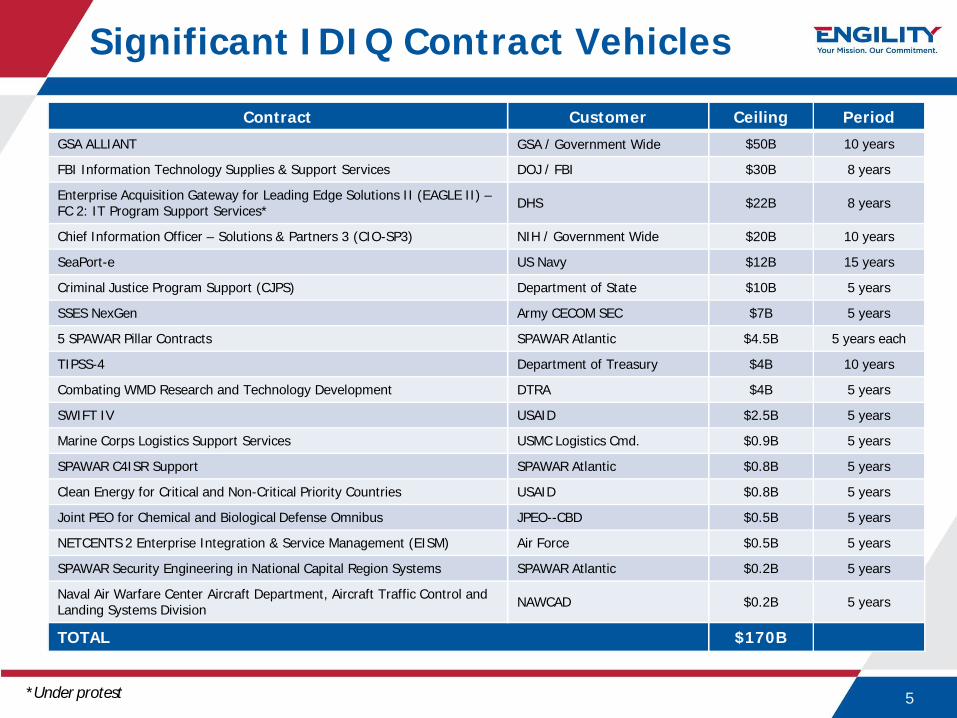
Contract Customer Ceiling Period
GSA ALLIANT GSA / Government Wide $50B 10 years
FBI Information Technology Supplies & Support Services DOJ / FBI $30B 8 years
Enterprise Acquisition Gateway for Leading Edge Solutions II (EAGLE II) –FC 2: IT Program Support Services* DHS $22B 8 years
Chief Information Officer – Solutions & Partners 3 (CIO-SP3) NIH / Government Wide $20B 10 years
SeaPort-e US Navy $12B 15 years
Criminal Justice Program Support (CJPS) Department of State $10B 5 years
SSES NexGen Army CECOM SEC $7B 5 years
5 SPAWAR Pillar Contracts SPAWAR Atlantic $4.5B 5 years each
TIPSS-4 Department of Treasury $4B 10 years
Combating WMD Research and Technology Development DTRA $4B 5 years
SWIFT IV USAID $2.5B 5 years
Marine Corps Logistics Support Services USMC Logistics Cmd. $0.9B 5 years
SPAWAR C4ISR Support SPAWAR Atlantic $0.8B 5 years
Clean Energy for Critical and Non-Critical Priority Countries USAID $0.8B 5 years
Joint PEO for Chemical and Biological Defense Omnibus JPEO--CBD $0.5B 5 years
NETCENTS 2 Enterprise Integration & Service Management (EISM) Air Force $0.5B 5 years
SPAWAR Security Engineering in National Capital Region Systems SPAWAR Atlantic $0.2B 5 years
Naval Air Warfare Center Aircraft Department, Aircraft Traffic Control and Landing Systems Division NAWCAD $0.2B 5 years
TOTAL $170B
Significant IDIQ Contract Vehicles
5*Under protest
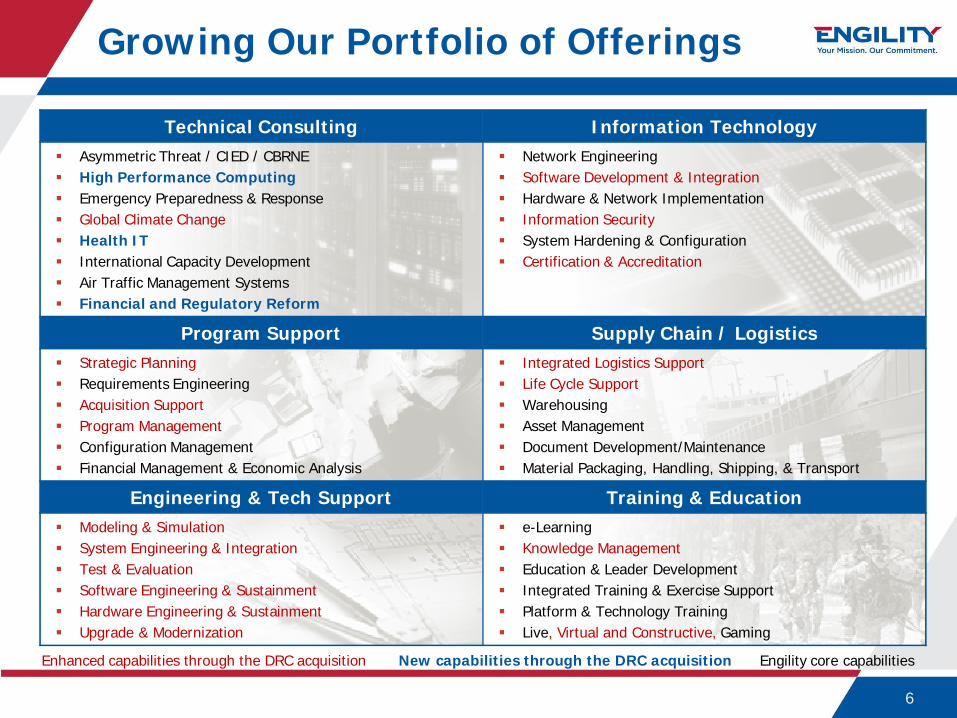
Technical Consulting Information TechnologyAsymmetric Threat / CIED / CBRNEHigh Performance ComputingEmergency Preparedness & ResponseGlobal Climate ChangeHealth ITInternational Capacity DevelopmentAir Traffic Management SystemsFinancial and Regulatory Reform
Network EngineeringSoftware Development & IntegrationHardware & Network ImplementationInformation SecuritySystem Hardening & ConfigurationCertification & Accreditation
Program Support Supply Chain / LogisticsStrategic PlanningRequirements EngineeringAcquisition SupportProgram ManagementConfiguration ManagementFinancial Management & Economic Analysis
Integrated Logistics SupportLife Cycle SupportWarehousingAsset ManagementDocument Development/MaintenanceMaterial Packaging, Handling, Shipping, & Transport
Engineering & Tech Support Training & EducationModeling & SimulationSystem Engineering & IntegrationTest & EvaluationSoftware Engineering & SustainmentHardware Engineering & SustainmentUpgrade & Modernization
e-LearningKnowledge ManagementEducation & Leader DevelopmentIntegrated Training & Exercise SupportPlatform & Technology TrainingLive, Virtual and Constructive, Gaming
Growing Our Portfolio of Offerings
6
New capabilities through the DRC acquisitionEnhanced capabilities through the DRC acquisition Engility core capabilities
Services Market Realities
• The Federal services market is contracting, but addressable market is still significant
• Austerity measures will continue – pendulum has swung to L.P.T.A. (Lowest Price Technically Acceptable) model but past performance critical to success
• With fewer new platforms and systems in procurement, DoD will continue to extend the life, reset, and modernize existing platforms and technologies
• Contracting emphasis changing from user-centric to procurement-centric
• Long-term success in today’s consolidating federal services market will depend on a mix of organic growth and strategic acquisitions to derive the benefits of scale and a broader customer and contract base
7
High quality, experienced low-cost providers increasingly attractiveEngility believes it is well positioned to compete and take market share amidst market contraction and the “new normal,” with an efficient business model, increased scale, deep domain expertise,
and a large addressable market that continues to drive new business opportunities
8
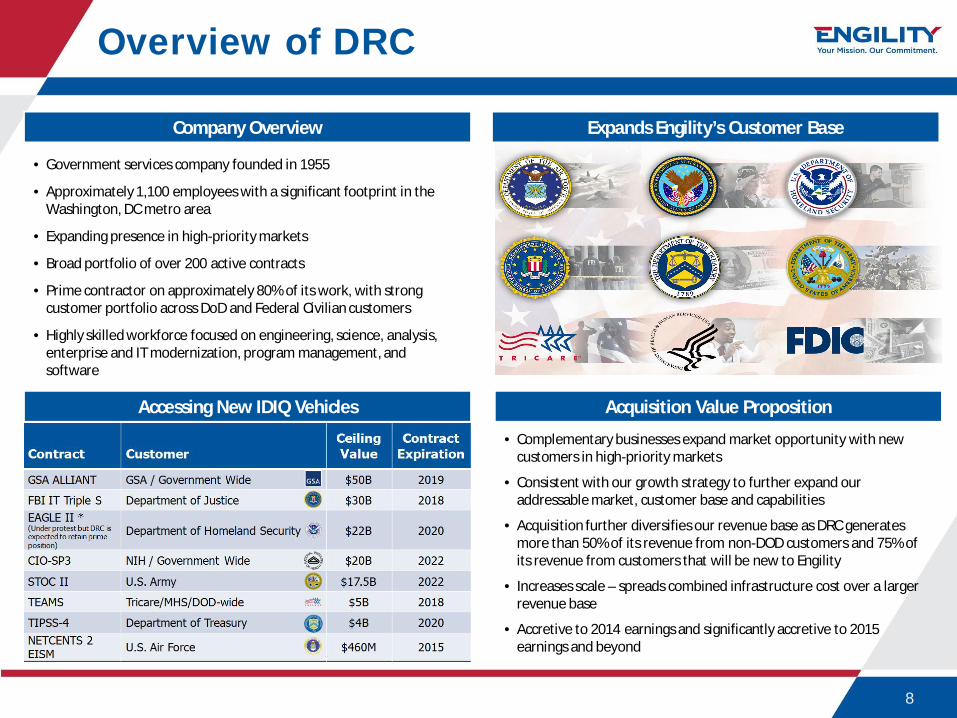
Overview of DRC
Expands Engility’s Customer Base
Acquisition Value PropositionAccessing New IDIQ Vehicles
• Complementary businesses expand market opportunity with new customers in high-priority markets
• Consistent with our growth strategy to further expand our addressable market, customer base and capabilities
• Acquisition further diversifies our revenue base as DRC generates more than 50% of its revenue from non-DOD customers and 75% of its revenue from customers that will be new to Engility
• Increases scale – spreads combined infrastructure cost over a larger revenue base
• Accretive to 2014 earnings and significantly accretive to 2015 earnings and beyond
Company Overview
• Government services company founded in 1955
• Approximately 1,100 employees with a significant footprint in the Washington, DC metro area
• Expanding presence in high-priority markets
• Broad portfolio of over 200 active contracts
• Prime contractor on approximately 80% of its work, with strong customer portfolio across DoD and Federal Civilian customers
• Highly skilled workforce focused on engineering, science, analysis, enterprise and IT modernization, program management, and software
Engility Financial Overview
Second Quarter 2014 Highlights
10
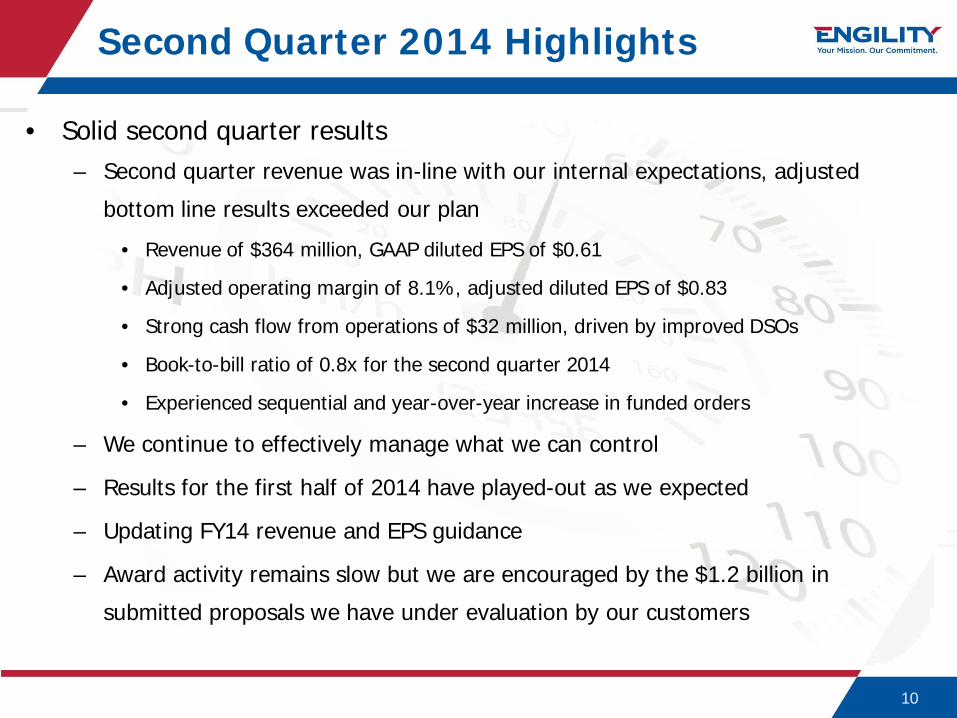
• Solid second quarter results– Second quarter revenue was in-line with our internal expectations, adjusted
bottom line results exceeded our plan
• Revenue of $364 million, GAAP diluted EPS of $0.61
• Adjusted operating margin of 8.1%, adjusted diluted EPS of $0.83
• Strong cash flow from operations of $32 million, driven by improved DSOs
• Book-to-bill ratio of 0.8x for the second quarter 2014
• Experienced sequential and year-over-year increase in funded orders
– We continue to effectively manage what we can control
– Results for the first half of 2014 have played-out as we expected
– Updating FY14 revenue and EPS guidance
– Award activity remains slow but we are encouraged by the $1.2 billion in
submitted proposals we have under evaluation by our customers
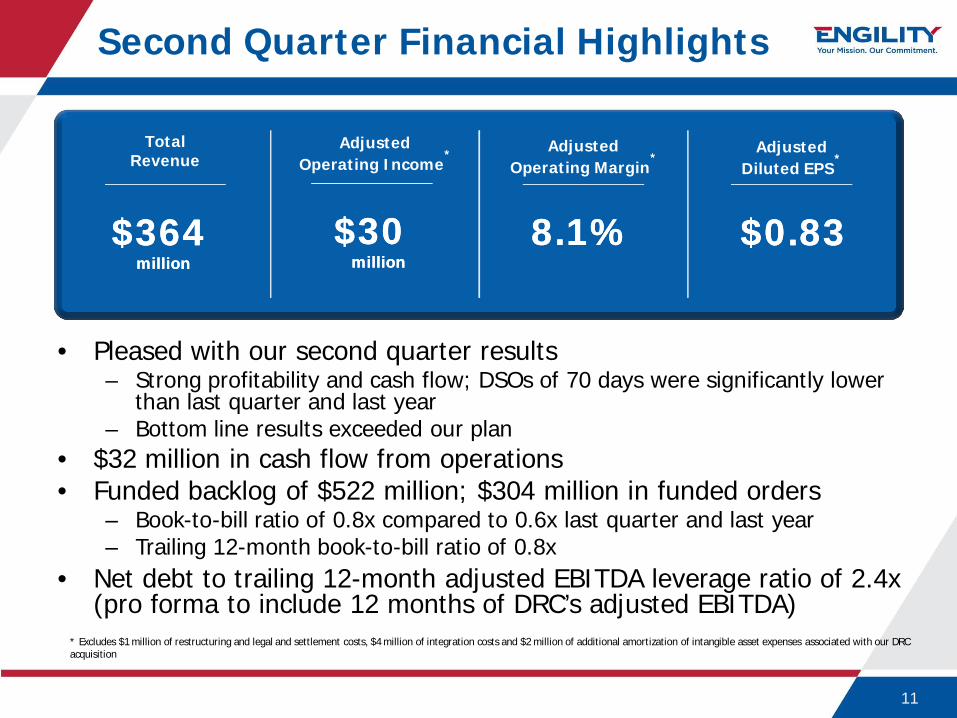
Adjusted Operating Income
** Adjusted Operating Margin
**Adjusted
Diluted EPS**
Total Revenue
Second Quarter Financial Highlights
• Pleased with our second quarter results– Strong profitability and cash flow; DSOs of 70 days were significantly lower
than last quarter and last year– Bottom line results exceeded our plan
• $32 million in cash flow from operations• Funded backlog of $522 million; $304 million in funded orders
– Book-to-bill ratio of 0.8x compared to 0.6x last quarter and last year– Trailing 12-month book-to-bill ratio of 0.8x
• Net debt to trailing 12-month adjusted EBITDA leverage ratio of 2.4x (pro forma to include 12 months of DRC’s adjusted EBITDA)
11
$30$30millionmillion
8.1%8.1% $0.83$0.83$364 $364 millionmillion
* Excludes $1 million of restructuring and legal and settlement costs, $4 million of integration costs and $2 million of additional amortization of intangible asset expenses associated with our DRC acquisition
Strong Free Cash Flow
12
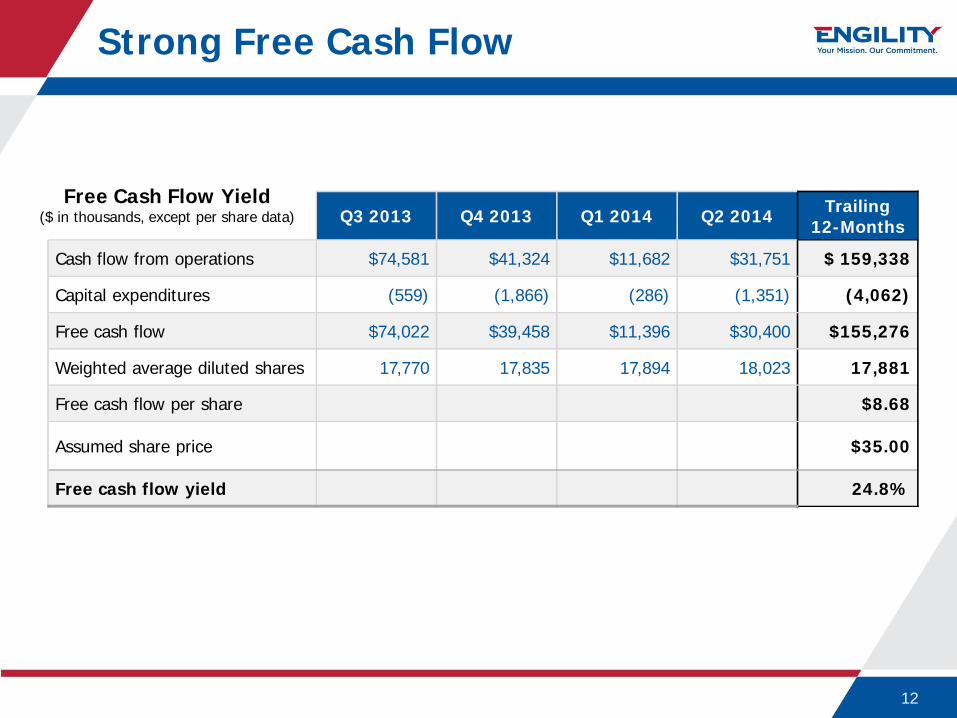
Q3 2013 Q4 2013 Q1 2014 Q2 2014 Trailing12-Months
Cash flow from operations $74,581 $41,324 $11,682 $31,751 $ 159,338
Capital expenditures (559) (1,866) (286) (1,351) (4,062)
Free cash flow $74,022 $39,458 $11,396 $30,400 $155,276
Weighted average diluted shares 17,770 17,835 17,894 18,023 17,881
Free cash flow per share $8.68
Assumed share price $35.00
Free cash flow yield 24.8%
Free Cash Flow Yield($ in thousands, except per share data)
FY14 Guidance
13
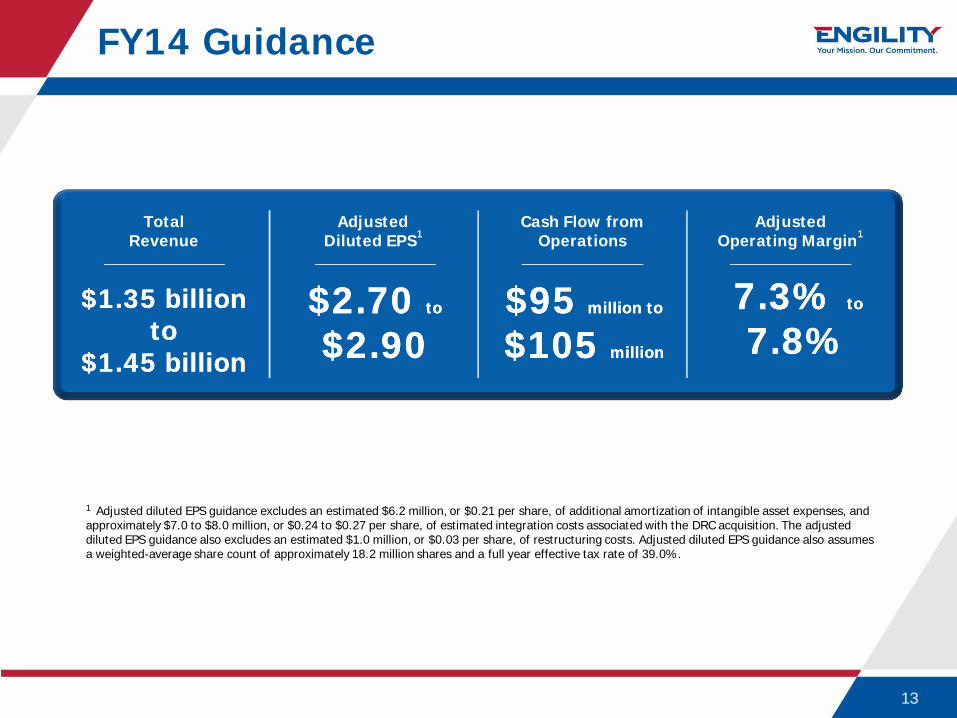
Adjusted Diluted EPS11
Cash Flow from Operations
Adjusted Operating Margin11
Total Revenue
$2.70 $2.70 to to
$2.90$2.90$1.35 billion $1.35 billion
toto$1.45 billion$1.45 billion
$95 $95 million tomillion to
$105 $105 millionmillion
1 Adjusted diluted EPS guidance excludes an estimated $6.2 million, or $0.21 per share, of additional amortization of intangible asset expenses, and approximately $7.0 to $8.0 million, or $0.24 to $0.27 per share, of estimated integration costs associated with the DRC acquisition. The adjusted diluted EPS guidance also excludes an estimated $1.0 million, or $0.03 per share, of restructuring costs. Adjusted diluted EPS guidance also assumes a weighted-average share count of approximately 18.2 million shares and a full year effective tax rate of 39.0%.
7.3%7.3% toto
7.8%7.8%
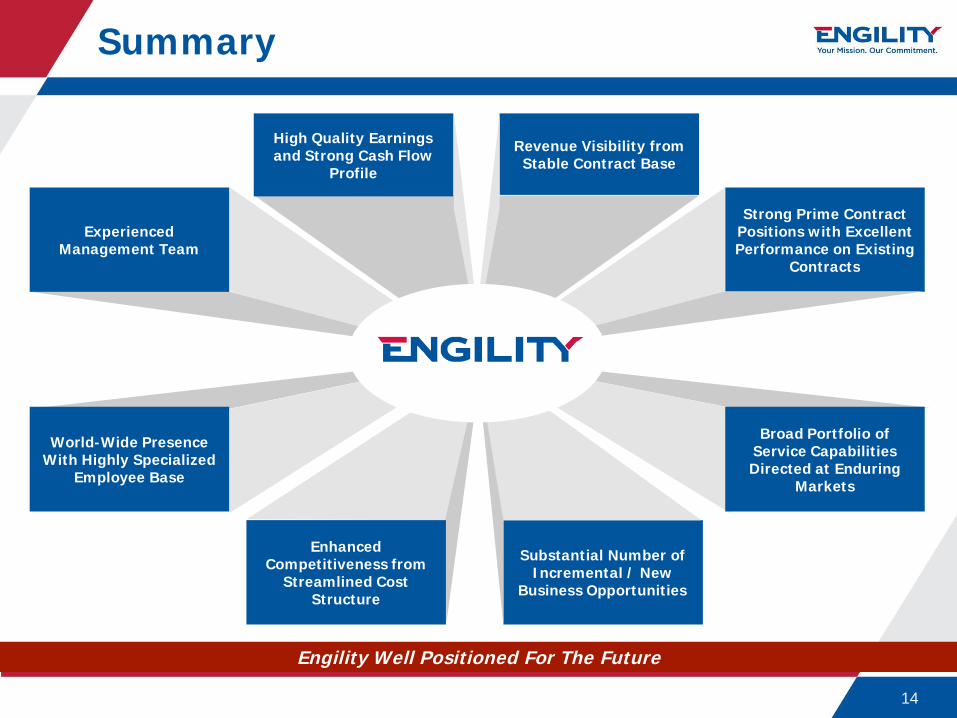
Summary
14
Engility Well Positioned For The Future
Strong Prime Contract Positions with Excellent Performance on Existing
Contracts
Substantial Number of Incremental / New
Business Opportunities
Experienced Management Team
World-Wide Presence With Highly Specialized
Employee Base
Revenue Visibility from Stable Contract Base
High Quality Earnings and Strong Cash Flow
Profile
Enhanced Competitiveness from
Streamlined Cost Structure
Broad Portfolio of Service Capabilities Directed at Enduring
Markets

15
AppendixAppendix
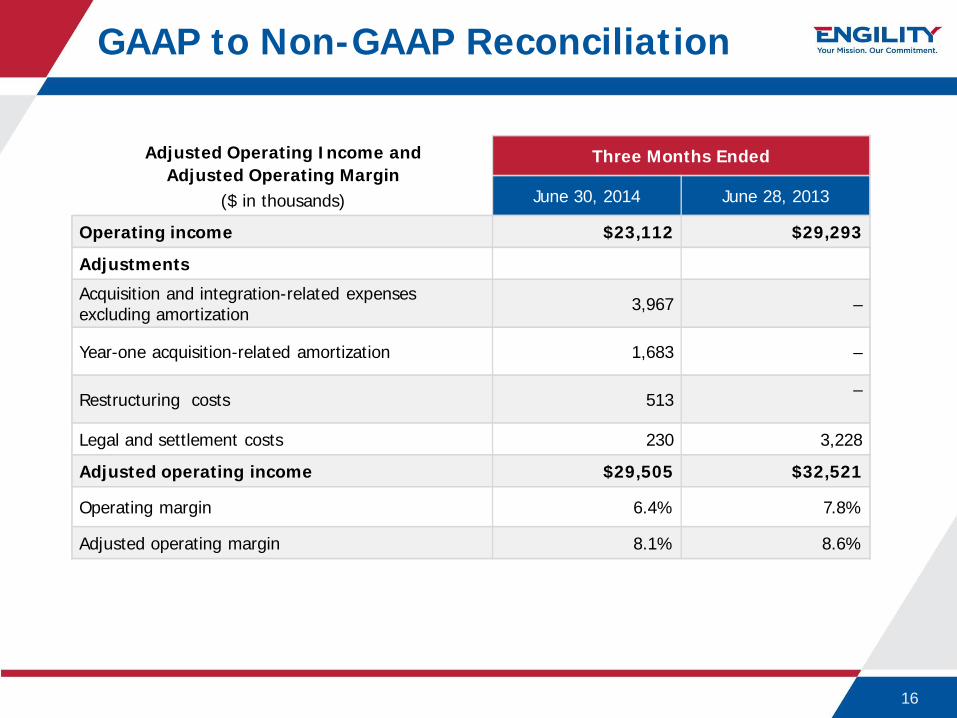
GAAP to Non-GAAP Reconciliation
16
Three Months Ended
June 30, 2014 June 28, 2013
Operating income $23,112 $29,293
Adjustments
Acquisition and integration-related expensesexcluding amortization 3,967 –
Year-one acquisition-related amortization 1,683 –
Restructuring costs 513 –
Legal and settlement costs 230 3,228
Adjusted operating income $29,505 $32,521
Operating margin 6.4% 7.8%
Adjusted operating margin 8.1% 8.6%
Adjusted Operating Income and Adjusted Operating Margin
($ in thousands)
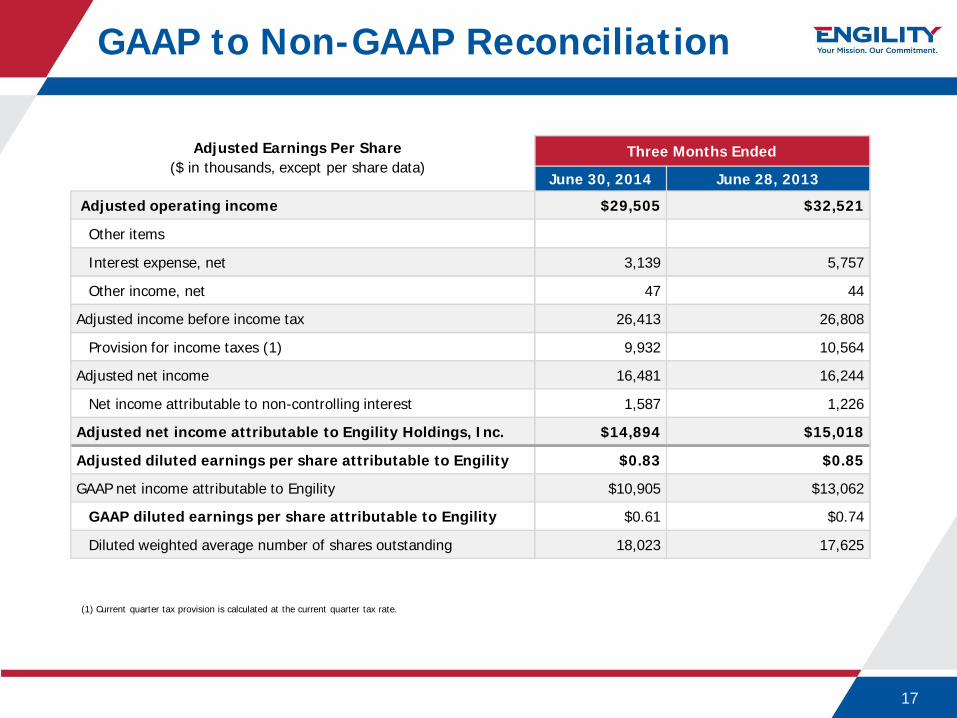
GAAP to Non-GAAP Reconciliation
17
Three Months Ended
June 30, 2014 June 28, 2013
Adjusted operating income $29,505 $32,521
Other items
Interest expense, net 3,139 5,757
Other income, net 47 44
Adjusted income before income tax 26,413 26,808
Provision for income taxes (1) 9,932 10,564
Adjusted net income 16,481 16,244
Net income attributable to non-controlling interest 1,587 1,226
Adjusted net income attributable to Engility Holdings, Inc. $14,894 $15,018
Adjusted diluted earnings per share attributable to Engility $0.83 $0.85
GAAP net income attributable to Engility $10,905 $13,062
GAAP diluted earnings per share attributable to Engility $0.61 $0.74
Diluted weighted average number of shares outstanding 18,023 17,625
Adjusted Earnings Per Share($ in thousands, except per share data)
(1) Current quarter tax provision is calculated at the current quarter tax rate.
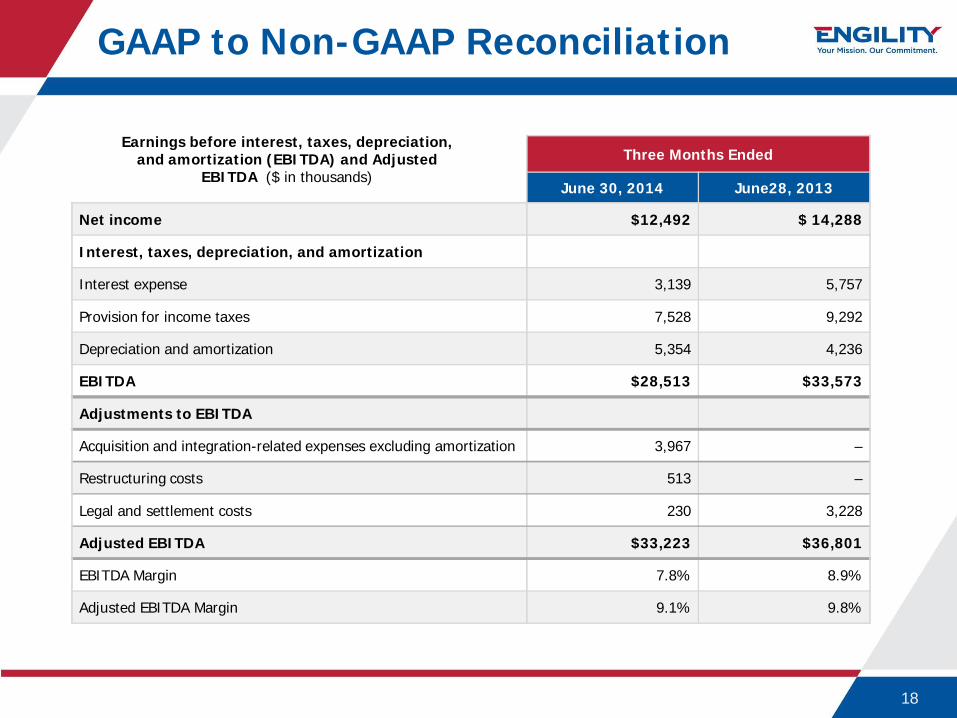
GAAP to Non-GAAP Reconciliation
18
Three Months Ended
June 30, 2014 June28, 2013
Net income $12,492 $ 14,288
Interest, taxes, depreciation, and amortization
Interest expense 3,139 5,757
Provision for income taxes 7,528 9,292
Depreciation and amortization 5,354 4,236
EBITDA $28,513 $33,573
Adjustments to EBITDA
Acquisition and integration-related expenses excluding amortization 3,967 –
Restructuring costs 513 –
Legal and settlement costs 230 3,228
Adjusted EBITDA $33,223 $36,801
EBITDA Margin 7.8% 8.9%
Adjusted EBITDA Margin 9.1% 9.8%
Earnings before interest, taxes, depreciation, and amortization (EBITDA) and Adjusted
EBITDA ($ in thousands)

Jefferies 2014 Global Industrials Conference
19
August 13, 2014