Embed Size (px)
Citation preview

Jeff Hemenway and Stan Boltz
USDA Natural Resources Conservation Service

No-till
Conventional

Assessing the effects that management and/orinvasive species have on the ecologicalprocesses is an effective way to evaluate soilhealth on rangelands.
Rangeland ecological processes can be groupedinto three categories, or attributes: Hydrologic function Soil and site stability Biotic integrity

More will be discussed later about the relationship between soil health and the three major attributes considered during a Range Health assessment.
Before we continue, let’s look at some of the specific impacts that invasive species can have on rangelands and soil health.
Consider states and thresholds on rangeland ecological sites:

1.0 Reference State
1.1 HCG (1.1 a)
1.2 Western Wheatgrassl Western Wh eatgrass/
Needlegrass Blue Grarna/ GPF (1.2a) Needlegrass
E,NF HCG, (T1 a) HCSG
(T1 b) 2.0 Native/Invaded Grass State
HCSG, 3.0 Degraded State HCSLG
2.1 (12a) Western Wheatgrassl 3.1
N eedlegrass Blue Grarna/--Buffalograss SodLTPG
HCG 1 l PG (R3)
HCG, 1(2.1 a) (2.2a) FSD LTPG
2.2 (3.1 a) (3.2a)
Western Wheatgrassl Blue Grarna/ - 3.2
Kentucky Bluegrass Threeawn/Forbs
NU, NF, HCSG PF,PM,LTPG HCSLG (T3)(12b)
4.0 Invaded State
4.1 Srnooth Brorne/
Kentucky Bluegrass/ Crested Wheatgrass
HCG PG (4.1 a) (4.2a)
4.2 HCSLG Kentucky (4.2b) Bluegrass
(R4)
4.3 Annual/Pioneer,
Non-Native Perennial
E,S,C (T5)
C- Cropped, abandoned; E -Encroachment; GPF - Grazing, Precipitation and/or fire; HCG Heavy Continuo us Grazing; HCSG Heavy Continuous Seasonal Grazing; HCSL G - H eavy
ng;Continuo us Season Long Grazi LTPG - Long Term Prescribed Grazing; PF- Prescribed Fire; PG - Prescribed Grazing; PM- Pest Management; S- Seeding; NU- Non Use; NF- No Fire; FSD - Frequent Severe D ef o liatio n
Any Plant Community

Proposed threshold between the Native/Invaded State and the Invaded State occurs when native grasses decline to < 40% of the plant community and invasives (e.g. Kentucky bluegrass) increase to >30% of the plant community
60A
Jones
i-~25-~========~
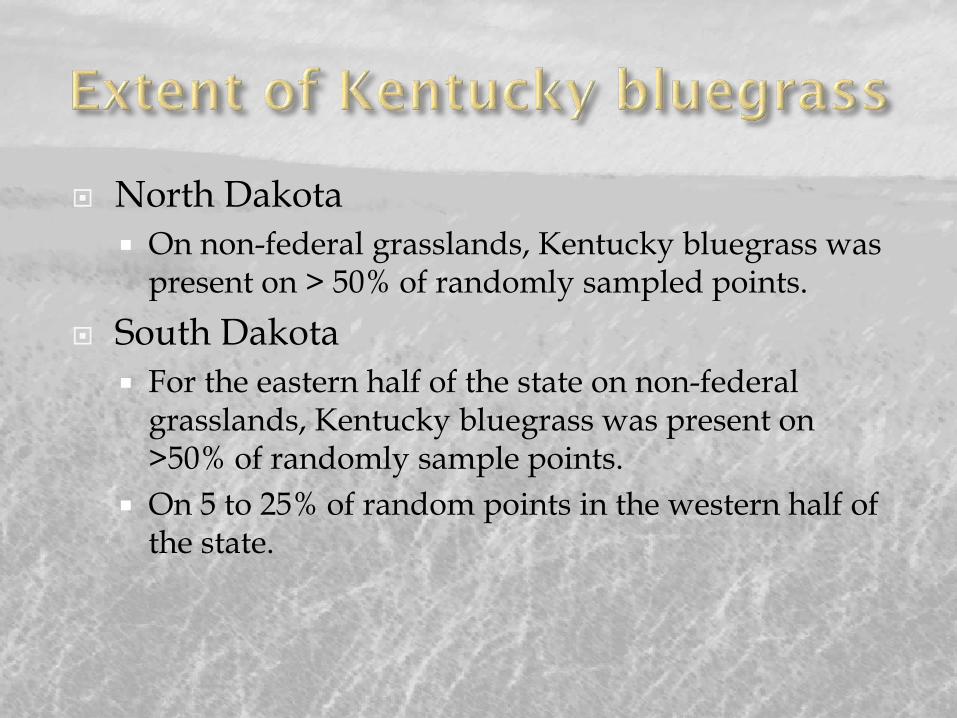
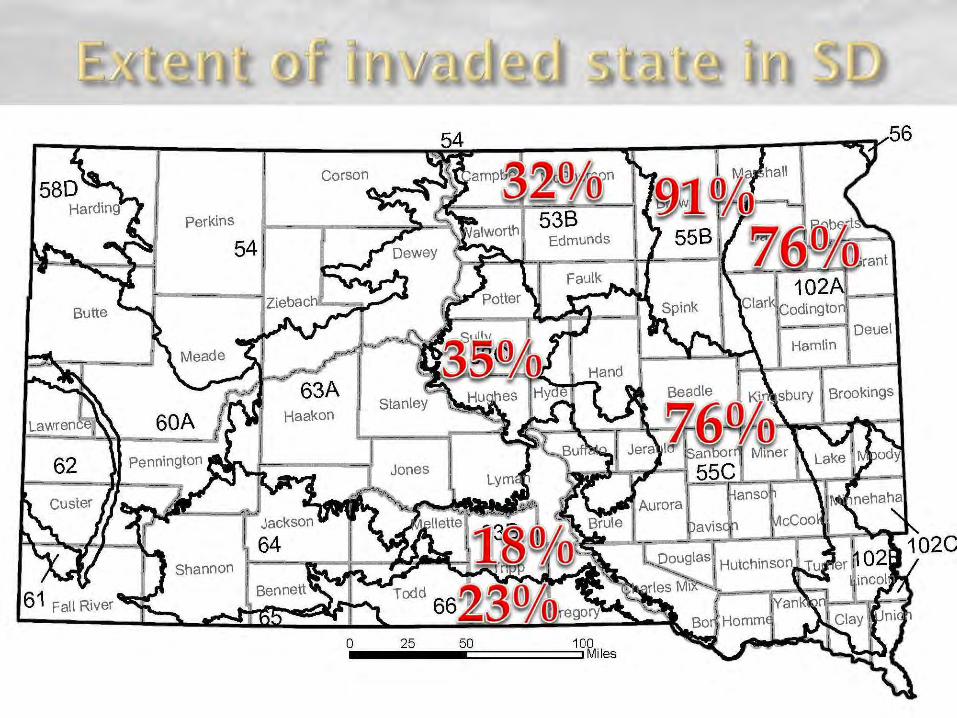
North Dakota On non-federal grasslands, Kentucky bluegrass was
present on > 50% of randomly sampled points. South Dakota For the eastern half of the state on non-federal
grasslands, Kentucky bluegrass was present on >50% of randomly sample points.
On 5 to 25% of random points in the western half of the state.

I II III (Native) (75% Kbg; (75% Sb;
25% Sb) 25% Kbg)
Precipitation 25” 25” 25”
Interception .13 .10 .15 Surface Runoff 5.00 11.25 7.50 Infiltration 19.25 13.00 17.00
* Kbg – Kentucky bluegrass; Sb – smooth bromegrass
LOAMY SITE MLRA 106 Nebraska and Kansas Loess-Drift Hills
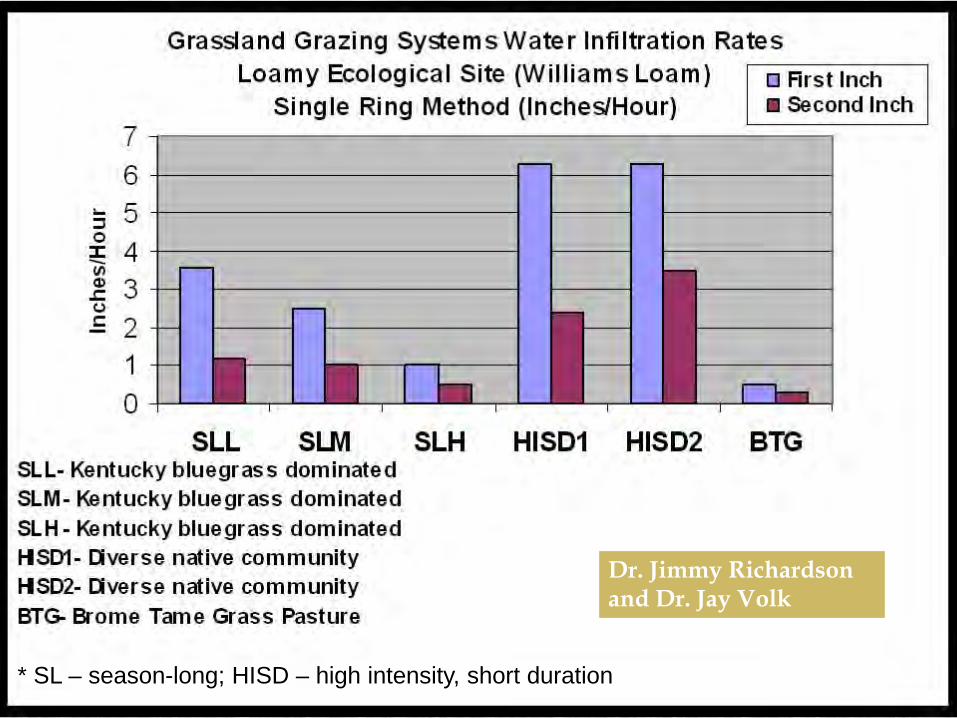
Dr. Jimmy Richardson and Dr. Jay Volk
* SL – season-long; HISD – high intensity, short duration

Based on WEPP Studies and other research in the Great Basin, infiltration and production of sediment/runoff is impacted by the similarity index of the site. Blackburn, W.H., and C.M. Skau. 1974. Infiltration rates and sediment production of selected plant communities in Nevada. Journal of Range Mangement, Vol. 27(6), p. 476-480.

Soil Modification by Invasive Plants: Effects on Native and Invasive Species of Mixed-Grass Prairies, 2008, Nicholas Jordan, Diane Larson, and Sheri Huerd Loss of soil microflora and microfauna, specifically
the native mycorrhizal fungi Impact to native species – alters soil to make it
uninhabitable for native grass species
Study was initiated to look at Effect of management/invasive species on soils
Further define causes of transitions between states What are the dynamic soil properties Color/organic matter Soil aggregate stability Bulk density/porosity Microflora and microfauna Carbon:Nitrogen ratio Infiltration

Barnes – Loamy ecological site

Heavy, continuous season- Moderate, rotationally long grazing grazed
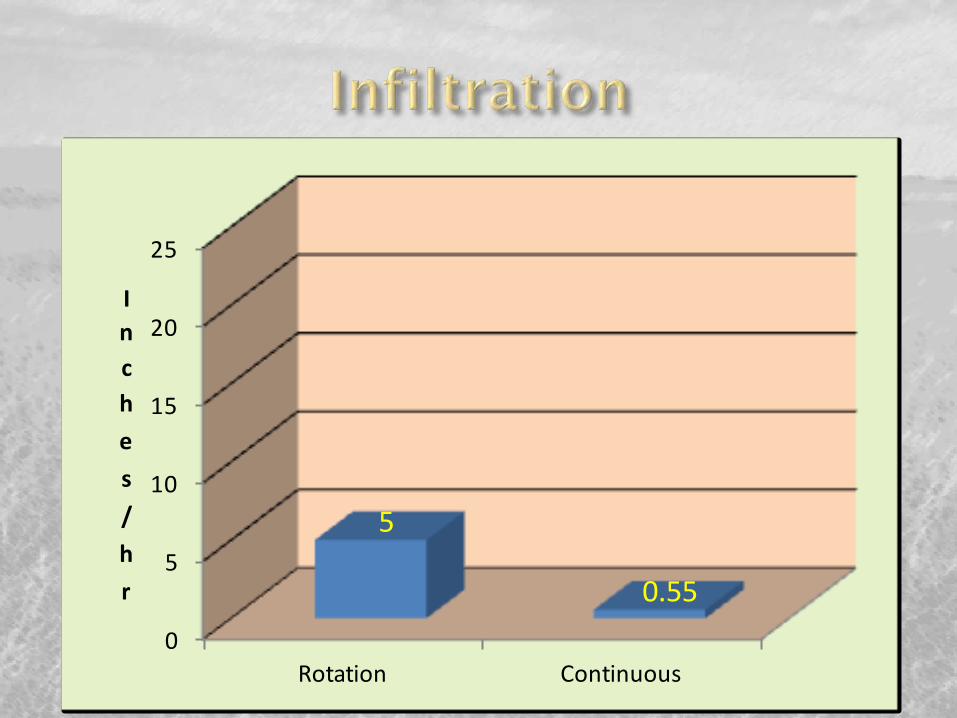
0
5
10
15
20
25
Rotation Continuous
5
0.55
I n c h
e
s
/
h
r

0
0.2
0.4
0.6
0.8
1
1.2
1.4
Bulk Density (g/cm3)
Native
Invaded
0-3" 3-6"
Horizon

D
•
6.0 5.5 5.0 4.5 4.0 3.5 Sta bility 3.0 Ra ting Native 2.5 2.0 Invaded 1.5 1.0 0.5 0.0
Surface 0-3" 3-8" 8-12"
Horizon
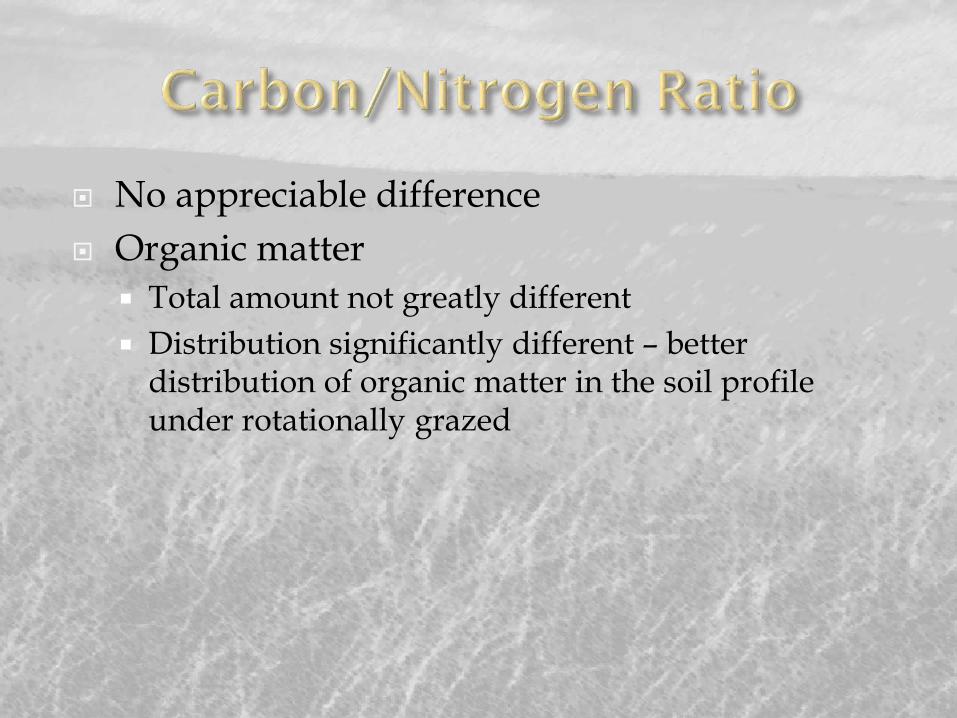
No appreciable difference Organic matter Total amount not greatly different Distribution significantly different – better
distribution of organic matter in the soil profile under rotationally grazed

An indicator of arbuscular mycorrhizal fungi activity.
Native grass site had 20% more glomalin in the soil profile compared to the invaded grass site. Is this enough of a difference to be considered a
trigger for the effect on infiltration? Would the change in glomalin be sensitive enough to
use as an early warning sign?

U.S. DEPARTMENT OF AGRICULTURE NATURAL RES OUR CES CONSERVATI ON SERVICE
Dynamic Soil Properties Study Sites
I - -I (
~
-~
l i
1. I
I I
Legend
* 50 25 0 50 Miles
Field Support Office Source : USDA-NRCS
[-~-] DSP Study Sites South Dakota State Office GIS B ranch ~ - County Boundary IL Proje eli on: Mercator Date : February 2013
Project Location: E:\StanBottz\SDmap.mxd

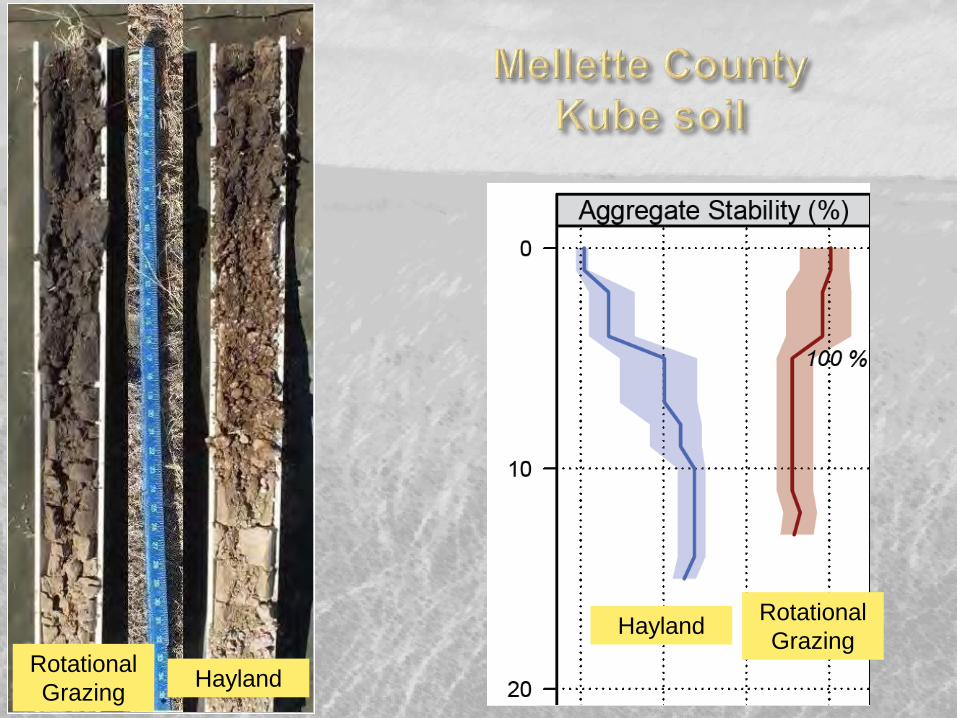
Mellette County
Rotational Grazing Hayland
Kube soil
Infiltration Rate
0
5
10
15
20
25
Range Hayland
27
0.59
I n c h
e
s
/
h
r
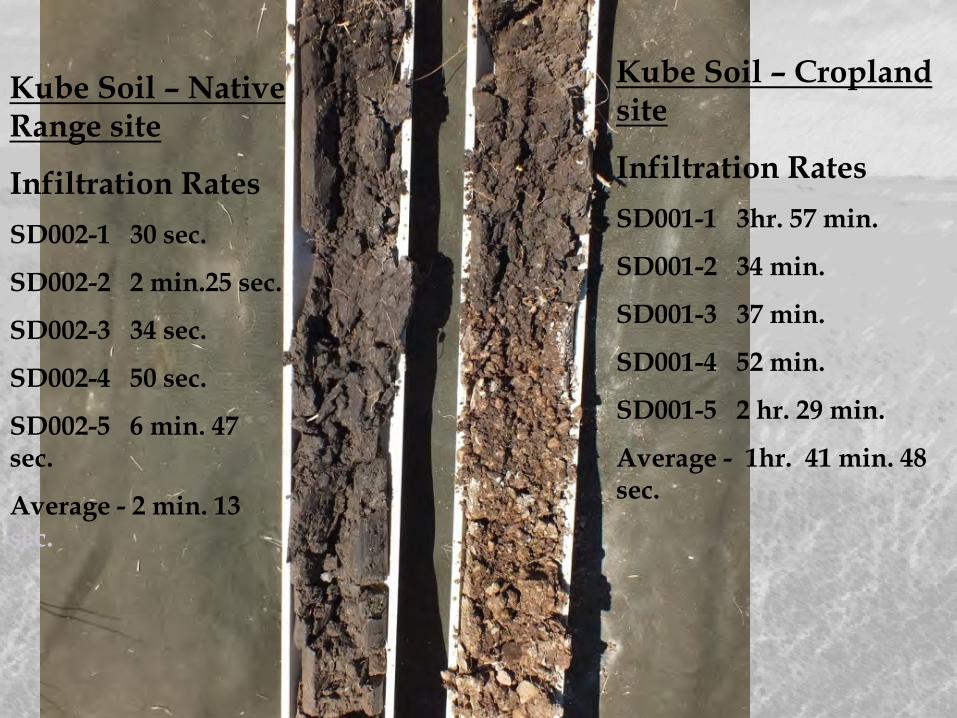
Kube Soil – Native Range site
Infiltration Rates
SD002-1 30 sec.
SD002-2 2 min.25 sec.
SD002-3 34 sec.
SD002-4 50 sec.
SD002-5 6 min. 47 sec.
Average - 2 min. 13 sec.
Kube Soil – Cropland site
Infiltration Rates
SD001-1 3hr. 57 min.
SD001-2 34 min.
SD001-3 37 min.
SD001-4 52 min.
SD001-5 2 hr. 29 min.
Average - 1hr. 41 min. 48 sec.
Hayland Rotational Grazing
Hayland Rotational Grazing

Hayland Rotational Grazing
Hayland
Rotational Grazing
10
0
20

Rotational Grazing
Continuous Grazing
Cropland
Hyde County Glenham soil
Infiltration Rate
0
5
10
15
20
25
Rotation Continuous Cropland
12.4
2.1 0.5
I n c h
e
s
/
h
r

Management of cropland and grassland has a potentially large effect on infiltration/runoff.
Invasive species impair hydrologic functions, and are spreading at an increasing rate.
Management actions can be taken to improve soil health – more emphasis needs to be placed on this.
More study is needed on underlying cause of hydrologic impairment due to invasive species and management differences.
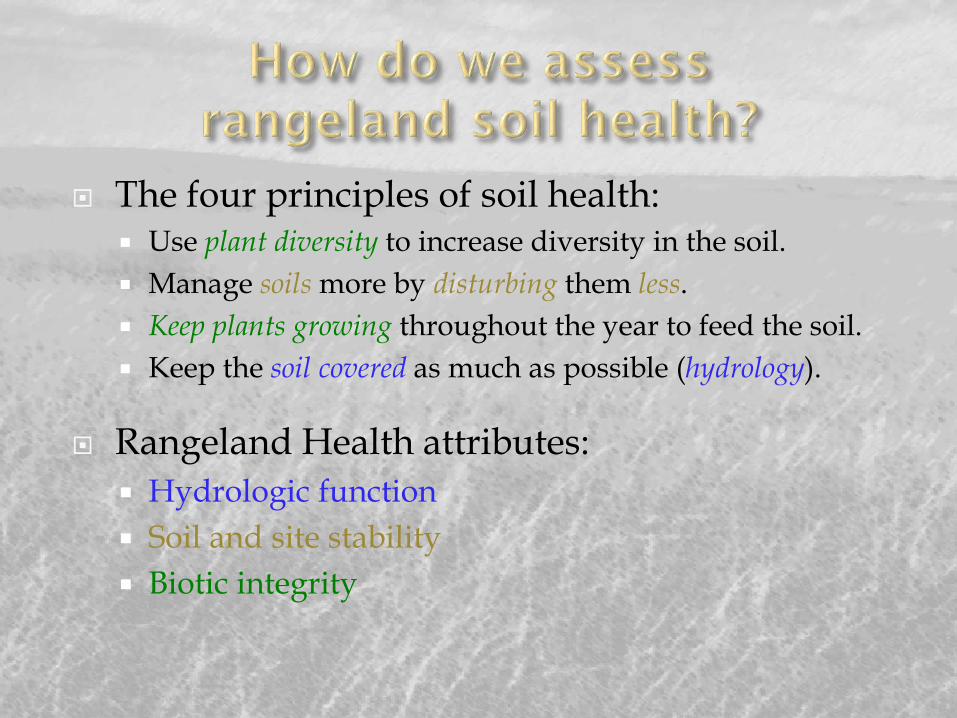
The four principles of soil health: Use plant diversity to increase diversity in the soil. Manage soils more by disturbing them less. Keep plants growing throughout the year to feed the soil. Keep the soil covered as much as possible (hydrology).
Rangeland Health attributes: Hydrologic function Soil and site stability Biotic integrity
Well established, scientifically based. Mostly qualitative (so fairly rapid), but able to
apply quantitative methods as well. Well accepted by the range science discipline and
all natural resource related agencies, and supported by the National Academy of Sciences.
Designed to systematically evaluate processes. Capability of using the assessment as a teaching
tool. Reference based on specific ecological site/soil

The three attributes are difficult to evaluate as a whole, so 17 indicators have been established:
• Rills • Water flow patterns • Pedestals or terracettes • Bare ground • Gullies • Wind scoured, depositional
areas • Litter movement • Soil surface resistance to
erosion • Soil structure & organic matter
• Plant community composition relative to infiltration and runoff
• Compaction layer • Functional/structural groups • Plant mortality and/or
decadence • Litter amount • Annual production • Invasive species • Plant reproductive capability

Use plant diversity to increase diversity in the soil.
Related Rangeland Health indicators: Plant community composition relative to infiltration
and runoff Functional/structural groups Plant mortality and/or decadence Annual production Invasive species Reproductive capability
Manage soils more by disturbing them less. Related Rangeland Health indicators: Soil surface resistance to erosion (soil aggregate
stability) Soil structure and organic matter content Compaction layer Rills Gullies

Keep plants growing throughout the year to feed the soil.
Related Rangeland Health indicators: Plant functional/structural groups Invasive plants Annual production

Keep the soil covered as much as possible. Related Rangeland Health indicators: Bare ground Water flow patterns Litter amount Litter movement

Rills

Water flow patterns

Pedestals or
terracettes

Bare ground Gullies – basically just large rills Headcuts Are they “healing”
Wind scoured, blowouts, depositional areas
Litter movement

Soil surface resistance to erosion Soil aggregate stability Reference sheet:
8. Soils surface (top few mm) resistance to erosion (stability values are averages – most sites will show a range of values): Soil aggregate stability ratings should typically be 5 to 6, normally 6. Surface organic matter adheres to the soil surface. Soil surface fragments will typically retain structure indefinitely when dipped in distilled water.

Soil surface loss or degradation Color/organic matter and structure Reference sheet:
9. Soil surface structure and SOM content (include type of structure and A-horizon color and thickness): A-horizon should be 3 to 9 inches thick with mollic (dark) colors when moist. Structure typically is medium to fine granular at least in the upper A-horizon.

Plant community composition and distribution relative to infiltration and runoff
Reference sheet:
10. Effect of plant community composition (relative proportion of different functional groups) and spatial distribution on infiltration and runoff: Combination of shallow and deep rooted species (mid & tall rhizomatous and tufted perennial cool-season grasses) with fine and coarse roots positively influences infiltration. Estimated elapsed time for one inch to infiltrate is 2 to 4 minutes (using the single-ring method).

Compaction layer Reference sheet:
11. Presence and thickness of compaction layer (usually none; describe soil profile features which may be mistaken for compaction on this site): None – when dry, B horizons can be hard and appear to be compacted, but no platy structure will be present.

Plant functional/structural groups Plant mortality and/or decadence Litter amount Annual production Invasive plants Perennial plant reproductive capability (vigor)

Infiltration using the single ring “infiltrometer”
Observing soil characteristics Structure Color (an indicator of organic matter)
Compaction layers

Rate the three attributes based on the “preponderance of evidence”:
S-M S-M M