Embed Size (px)
Citation preview
Business Address14400 N 87TH STSCOTTSDALE AZ 852604083083000
Mailing Address14400 N 87TH STSCOTTSDALE AZ 85260
SECURITIES AND EXCHANGE COMMISSION
FORM 10-KAnnual report pursuant to section 13 and 15(d)
Filing Date: 2003-03-19 | Period of Report: 2002-12-31SEC Accession No. 0000950153-03-000515
(HTML Version on secdatabase.com)
FILERJDA SOFTWARE GROUP INCCIK:1006892| IRS No.: 860787377 | State of Incorp.:DE | Fiscal Year End: 1231Type: 10-K | Act: 34 | File No.: 000-27876 | Film No.: 03609155SIC: 7371 Computer programming services
Copyright © 2012 www.secdatabase.com. All Rights Reserved.Please Consider the Environment Before Printing This Document

Copyright © 2012 www.secdatabase.com. All Rights Reserved.Please Consider the Environment Before Printing This Document

Table of Contents
SECURITIES AND EXCHANGE COMMISSION
Washington, D.C. 20549
Form 10-K
þ ANNUAL REPORT PURSUANT TO SECTION 13 OR 15(d) OF THE SECURITIES EXCHANGE ACT OF1934
For the fiscal year ended December 31, 2002
or
oo TRANSITION REPORT PURSUANT TO SECTION 13 OR 15(d) OF THE SECURITIES EXCHANGE ACTOF 1934
For the transition period from to
Commission File Number 0-27876
JDA Software Group, Inc.(Exact name of registrant as specified in its charter)
Delaware 86-0787377(State or other jurisdiction of
incorporation or organization)(I.R.S. Employer
Identification No.)14400 North 87th Street
Scottsdale, Arizona 85260(Address of principal executive offices, including zip code)
Registrant��s telephone number, including area code:
(480) 308-3000
Securities registered pursuant to Section 12(b) of the Act:
NONE
Securities registered pursuant to Section 12(g) of the Act:
Common Stock, $0.01 par value
Copyright © 2012 www.secdatabase.com. All Rights Reserved.Please Consider the Environment Before Printing This Document

Indicate by check mark whether the registrant (1) has filed all reports required to be filed by Section 13 or 15(d) of the SecuritiesExchange Act of 1934 during the preceding 12 months (or for such shorter period that the registrant was required to file such reports), and(2) has been subject to such filing requirements for the past 90 days. Yes þ No o
Indicate by check mark if disclosure of delinquent filers pursuant to Item 405 of Regulation S-K is not contained herein, and will not becontained, to the best of registrant�s knowledge, in definitive proxy or information statements incorporated by reference in Part III of thisForm 10-K or any amendment to this Form 10-K. o
Indicate by check mark whether the registrant is an accelerated filer (as defined in Exchange Act Rule 12b-2). Yes þ No o
The approximate aggregate market value of the registrant�s common stock held by non-affiliates of the registrant (based on the closingsales price of such stock as reported by the NASDAQ Stock Market) on March 14, 2003 was $272,329,244. Excludes shares of common stockheld by directors, officers and each person who holds 5% or more of the registrant�s common stock. Number of shares of common stock,$0.01 par value per share, outstanding as of March 14, 2003 was 28,575,483.
DOCUMENTS INCORPORATED BY REFERENCE
Documents Form 10-K Reference
Portions of the Proxy Statement for the registrant�s 2003Annual Meeting of Stockholders are incorporated byreference into Part III of this Form 10-K
Items 10, 11, 12 and 13 of Part III
Copyright © 2012 www.secdatabase.com. All Rights Reserved.Please Consider the Environment Before Printing This Document

TABLE OF CONTENTS
PART IItem 1. BusinessItem 2. PropertiesItem 3. Legal ProceedingsItem 4. Submission of Matters to a Vote of Security Holders
PART IIItem 5. Market for Registrant�s Common Equity and Related Stockholder MattersItem 6. Selected Financial DataItem 7. Management�s Discussion and Analysis of Financial Condition and Results of Operations
FACTORS THAT MAY AFFECT OUR FUTURE RESULTS OR THE MARKET PRICE OF OURSTOCK
Item 7A. Quantitative and Qualitative Disclosures About Market RisksItem 8. Financial Statements and Supplementary DataItem 9. Changes In and Disagreements With Accountants on Accounting and Financial Disclosure
PART IIIItem 10. Directors and Executive Officers of the RegistrantItem 11. Executive CompensationItem 12. Security Ownership of Certain Beneficial Owners and Management and Related StockholderMattersItem 13. Certain Relationships and Related TransactionsItem 14. Controls and Procedures
PART IVItem 15. Exhibits, Financial Statement Schedules, and Reports on Form 8-K
INDEPENDENT AUDITORS� REPORTJDA SOFTWARE GROUP, INC. AND SUBSIDIARIESCONSOLIDATED BALANCE SHEETSJDA SOFTWARE GROUP, INC. AND SUBSIDIARIESCONSOLIDATED STATEMENTS OF INCOMEJDA SOFTWARE GROUP, INC. AND SUBSIDIARIESCONSOLIDATED STATEMENTS OF STOCKHOLDERS� EQUITYJDA SOFTWARE GROUP, INC. AND SUBSIDIARIESCONSOLIDATED STATEMENTS OF CASH FLOWSJDA SOFTWARE GROUP, INC. AND SUBSIDIARIESCONSOLIDATED STATEMENTS OF CASH FLOWSNOTES TO CONSOLIDATED FINANCIAL STATEMENTSSIGNATURESEXHIBIT INDEXEX-10.6EX-23.1EX-99.1EX-99.2
Copyright © 2012 www.secdatabase.com. All Rights Reserved.Please Consider the Environment Before Printing This Document
Table of Contents
This Annual Report on Form 10-K contains forward-looking statements reflecting management�s current forecast of certain aspects ofour future. It is based on current information that we have assessed but which by its nature is dynamic and subject to rapid and even abruptchanges. Forward looking statements include statements regarding future operating results, liquidity, capital expenditures, productdevelopment and enhancements, numbers of personnel, strategic relationships with third parties, and strategy. The forward-lookingstatements are generally accompanied by words such as �plan,� �estimate,� �expect,� �intend,� �believe,� �should,� �would,� �could,��anticipate� or other words that convey uncertainty of future events or outcomes. Our actual results could differ materially from those statedor implied by our forward-looking statements due to risks and uncertainties associated with our business. These risks are describedthroughout this Annual Report on Form 10-K, which you should read carefully. We would particularly refer you to the section under theheading �Certain Risks� for an extended discussion of the risks confronting our business. The forward-looking statements in this AnnualReport on Form 10-K should be considered in the context of these risk factors.
PART I
Item 1. Business
Overview
We are a leading provider of sophisticated software solutions designed specifically to address the demand and supply chain management,business process, decision support, e-commerce, inventory optimization, and collaborative planning and forecasting requirements of the retailindustry and its suppliers. Our solutions enable our customers to collect, manage, organize and analyze information throughout their retailenterprise, and to collaborate with suppliers and customers over the Internet at multiple levels within their organization. Our customers includemore than 4,800 of the world�s leading retail, manufacturing, and wholesale organizations. We believe we have the largest retail customerinstalled base among our direct competitors, with more than 1,200 retail customers in over 60 countries. Our customers include many of theworld�s leading retail, manufacturing and wholesale organizations including AEON Company Ltd., Anheuser-Busch Companies, Carrefour,Colgate-Palmolive, Dollar General Corporation, Energizer Holdings, Inc., The Estee Lauder Companies, Inc., Friskies PetCare UK Ltd.,H. E. Butt Grocery Company The Limited, Michaels Stores, Office Depot International, Sodimac, Tesco and Wal-Mart. Our softwaresolutions business is enhanced and supported by our retail and supplier specific professional services.
We market our JDA Portfolio software solutions to over 3,300 retailers worldwide with annual sales of $100 million or more. Over 1,200of these potential retail customers own at least one of our products. Our acquisitions of the Arthur Retail Business Unit (�Arthur�), IntactixInternational, Inc. (�Intactix�) and E3 Corporation (�E3�), has enabled us to expand our client base to include nearly 3,600 suppliers to theretail industry and added software applications that enable business-to-business collaborative planning, forecasting and replenishment(�CPFR�) between retailers and their suppliers. These acquisitions, together with the investments we�ve made over the past few years toincrease the scalability of our products, have enabled us to pursue emerging growth opportunities in the retail supply chain and further expandour target markets to include larger multi-national retail organizations with annual sales in excess of $5 billion, and over 27,000 suppliers tothe retail industry worldwide with annual sales of $100 million or more.
Market Background
Retail organizations and their suppliers are facing intensifying competition, fluctuating demand, evolving retail channels and increasingglobalization. Sales are pressured, margins are compressed through intensified competition and almost all companies are trying to achieveimproved results with fewer people. As a result, these businesses seek technology solutions to better manage their increasingly complexbusinesses, improve their operating efficiencies and financial performance, and strengthen their relationships with customers and suppliers.
2
Copyright © 2012 www.secdatabase.com. All Rights Reserved.Please Consider the Environment Before Printing This Document

Copyright © 2012 www.secdatabase.com. All Rights Reserved.Please Consider the Environment Before Printing This Document

Table of Contents
The current market environment places conflicting pressures on the retail demand and supply chain. On one hand, companies strive toreduce information technology expenditures. On the other hand, the need to become increasingly effective in a tough market is driving theneed for newer, smarter technology. As one of a very small number of software companies in our industry to have consistently maintainedprofitable operations, we are uniquely positioned to confront market skepticism and the uncertainly about the long-term prospects oftechnology companies. Our strategy of offering point solutions focused on rapid return on investment remains highly attractive in this market.
JDA Solutions
We are the leading provider of comprehensive, integrated software solutions specifically designed for the retail industry. We havedeveloped and marketed our Retail Enterprise Systems and In-Store Systems to retailers for over 18 years, and our installed base of over 1,200retail customers is comprised of many of the world�s leading retail organizations. In addition, our Collaborative Solutions have been installedin nearly 3,600 suppliers to the retail industry, enabling them to collaborate with their retailer customers to improve their supply chainmanagement and business processes. We offer a wide range of retail specific professional services to help clients rapidly achieve the benefitsof our solutions, including project management, system planning, design and implementation, custom configurations, training and supportservices.
We have organized our business segments around the distinct requirements of retail enterprises, retail stores, and suppliers to the retailindustry:
Retail Enterprise Systems. The modern retail enterprise is required to rapidly collect, organize, distribute and analyze informationthroughout its organization. Retail Enterprise Systems include corporate level planning and merchandise management systems (��PortfolioMerchandise Management Systems��) that enable retailers to optimize their inventory control, product mix, pricing and promotionalstrategies, automate demand forecasting and replenishment, and enhance the productivity and accuracy of warehouse processes. In addition,Retail Enterprise Systems include a comprehensive set of tools for analyzing business results and trends, tracking customer shopping patterns,space management, trade allowance and promotional program management, and for monitoring strategic plans and tactical decisions(��Strategic Merchandise Management Solutions��).
In-Store Systems. Store-level personnel require systems that enhance and facilitate the retailer�s direct interaction with the customer, andintegrate the store-level operations into the overall business processes of the organization. In-Store Systems include point-of-sale, e-commerceand back office applications that enable retailers to capture, analyze and transmit certain sales, store inventory and other operationalinformation to corporate level merchandise management systems using hand-held, radio frequency devices, point-of-sale workstations or viathe Internet.
Collaborative Solutions. Retailers and their suppliers increasingly seek to collaboratively organize and synchronize their businessprocesses and decisions. Collaborative Solutions provide applications that enable business-to-business collaborative CPFR between retailersand their suppliers. Collaborative Solutions, which currently include portions of our Retail Enterprise Systems applications that can be used bysuppliers as well as collaborative specific solutions, enable retailers and their suppliers to optimize the sharing of plans, information andsupply chain decisions between trading partners in such areas as inventory replenishment, marketing/ promotions, sales planning/executionand category management.
Our software products and services are designed to provide the following benefits:
A Broad Set of Solutions for the Retail Demand Chain. We believe the JDA Portfolio is the broadest set of retail industry softwaresolutions available to retailers and their suppliers. Our products link point-of-sale level information with the centralized merchandising,planning and financial functions that ultimately affect decisions with suppliers and vendors. Our solutions are built specifically to address theunique scalability requirements of the retail industry and function seamlessly with each other, enabling greater speed and data integrity. Ourproducts can be configured to meet the specialized and evolving needs of our clients.
3
Copyright © 2012 www.secdatabase.com. All Rights Reserved.Please Consider the Environment Before Printing This Document

Copyright © 2012 www.secdatabase.com. All Rights Reserved.Please Consider the Environment Before Printing This Document

Table of Contents
Enhanced Decision Making and Responsiveness to Consumer Demands. The JDA Portfolio solutions help retailers better understand andfulfill consumer demands while improving operational efficiency. Our products enable vast amounts of consumer, sales and inventory data tobe rapidly collected, organized, distributed and analyzed. Retailers and their suppliers can explore �what if� merchandising plans, track andanalyze performance, business results and trends, monitor strategic plans, and quickly adjust to changes in consumer purchasing patterns. TheJDA Portfolio solutions also allow our customers to reduce their inventory exposure while offering the consumer a more compelling mix ofproducts at strategically planned prices.
Improved Inventory Management. The JDA Portfolio solutions enable our customers to continuously monitor and reduce inventory levels,achieve higher gross margins, improve their inventory turnover rates and more effectively manage their order and distribution processes. Weprovide retailers with tools for vendor analysis, stock status monitoring, sales capture and analysis, merchandise allocation and replenishment,purchase order management and distribution center management. Our Collaborative Solutions enable suppliers to collaborate with retailers toplan product allocation and delivery, shelf and floor space management, and reduce inventory exposure. We believe that due to the acquisitionof E3 in 2001, we are the leading provider of inventory replenishment solutions to retailers and their suppliers.
Collaborative Solutions. As consumer markets become more competitive, retail customers realize they must do more than simply achieveincreased efficiencies in their own organizations. A retailer�s competitive advantage is now being defined by the efficiencies of their entiresupply chain. As retailers and their suppliers cooperate to improve all aspects of the supply chain, a new breed of collaborative technologysolutions is emerging. We have established a leading position in this new but rapidly growing market for software solutions. OurCollaborative Solutions allow retailers and their suppliers to plan and fulfill consumer demand through a complete suite of CPFR solutionsthat also enable trading partners to collaborate in marketing, assortment and space planning decisions. As of December 31, 2002, we have 136trading partners worldwide using our CPFR solutions.
Product Direction. The JDA Portfolio product strategy offers a suite of applications that can be deployed independently in order toprovide a quick return on investment. At the same time, when a customer installs two or more of our applications, we provide a guaranteedintegration between these products. We are currently pursuing the next phase of our product strategy: the adoption of a common applicationdevelopment framework across all of our products based on the Microsoft .Net platform. We will begin to deliver the results of thistechnology transition in 2003 with a full transition expected within the next two to three years. We believe this product direction and resultanttechnology transition will offer our customers unique benefits, including reduced cost of ownership, improved process integration between ourapplications, and a common user interface across multiple JDA applications to improve the ease of use.
Our Strategy
Despite a slow growth year in 2002, we believe in the strength of the long-term growth prospects for our business. We intend to leverageour leading presence in the retail market to pursue new market opportunities with new, complementary products we acquire or developinternally, and by pursuing our CPFR initiatives.
Our strategy has the following key elements:
Leverage Our Leading Position in the Retail Industry. Many of our products are designed to meet the specific needs of the retail industry,and we believe our in-depth understanding of the industry�s unique requirements differentiates us from competitors and provides a significantadvantage in securing new customers in our existing and emerging markets. Our customers include more than 4,800 of the world�s leadingretail, manufacturing and wholesale organizations, and including more than 1,200 retailer customers in over 60 countries. We estimate that ourtarget retail market includes over 3,300 retailers worldwide with annual sales of $100 million or more. Our acquisitions of Arthur, Intactix,and E3 has enabled us to expand our client base to include nearly 3,600 suppliers to the retail industry and added software applications thatenable business-to-business CPFR between retailers and their suppliers. These acquisitions, together with the investments we�ve made overthe past few years to increase the scalability of our products, have enabled us to pursue emerging growth opportunities in the retail supplychain, and to further expand our target markets to
4
Copyright © 2012 www.secdatabase.com. All Rights Reserved.Please Consider the Environment Before Printing This Document

Copyright © 2012 www.secdatabase.com. All Rights Reserved.Please Consider the Environment Before Printing This Document

Table of Contents
include larger multi-national retail organizations with annual sales in excess of $5 billion, and over 27,000 suppliers to the retail industryworldwide with annual sales of $100 million or more.
We believe our strength in this specialized market provides a disincentive to new competitors from other sectors and allows JDA toprovide leadership through aggressive investment in product development and acquisitions. Despite our strong market presence, most of ourcustomers still only own one of our products and this represents an on-going opportunity to the Company. As we acquire products and addthem to the JDA Portfolio, we believe our customers benefit from purchasing multiple JDA products that provide a �one-stop shop� for retailtechnology. During 2002, our strategies of leveraging our customer base and acquisitions provided positive results, as 66% of our softwarelicense revenues came from existing customers buying additional products, over 75% of which were complementary products that we haveacquired over the past four years.
Pursue New Collaborative Market Opportunities. Suppliers to the retail industry are increasingly adopting retail practices in the pursuit ofimproved penetration of their products in the categories in which they participate. They seek to gain a detailed understanding of consumerbuying habits across large chains of stores. Retailers seek improved efficiencies through reduced inventory costs, improved categorymanagement and enhanced sales planning and execution. We believe our Collaborative Solutions are leading the industry due to our historicalfocus on retail systems. The required techniques to understand the requirements of retail organizations and consumer buying habits areinherent in our solutions.
Collaborative Solutions provide applications that enable business-to-business collaborative CPFR between retailers and their suppliers.Collaborative Solutions, which currently include portions of our Retail Enterprise Systems applications that can be used by suppliers as wellas collaborative specific solutions, enable retailers and their suppliers to optimize the sharing of plans, information and supply chain decisionsbetween trading partners in such areas as inventory replenishment, marketing/promotions, sales planning/execution and category management.As of December 31, 2002, we have 136 trading partners worldwide that are live and fully operational on our Marketplace Replenishmentsolution that provides web-based portal access to the Advanced Warehouse Replenishment by E3 and Advanced Store Replenishment by E3applications and enables the creation of a single, shared demand forecast that retailers and their suppliers can use to lower distribution andfreight costs, increase annual sales, improve forecast accuracy, lower inventory requirements, and increase human productivity. As part of ourstrategy, we will expand our Collaborative Solutions to include other modular functionality from our Retail Enterprise Systems that has beenadapted to collaborative environments, and through the acquisition of additional collaborative applications.
We believe there are significant collaborative opportunities worldwide with the over 3,300 retailers and 27,000 suppliers to the retailindustry that we have identified as our target markets.
Invest in Innovative Product Development. A key element of our strategy during 2003 and beyond is to develop innovative technology.We are developing a series of enhancements to the JDA Portfolio products, based upon the Microsoft .Net technology platform (�.NetPlatform�), that we believe will position us uniquely in the retail and collaborative solutions markets. Our goals are to ensure our solutionsoffer: (i) increased ease of use, (ii) increased integration of business processes, (iii) reduced cost of ownership, (iv) faster implementation, and(v) faster return on investment.
We believe our next generation technology will further differentiate our product and service offerings from those of our competitors. Ourgoal is to eliminate lower value services associated with the implementation of our products, and as a result, we may experience a reduction inthe revenue associated with certain of our consulting services offerings. We believe that this reduced revenue will be more than offset byincreased software and maintenance revenues, and increased revenue from strategic consulting and education services. The first step in theexecution of this strategy began in June 2002 with the delivery of JDA Portfolio 2003 � the first ever fully synchronized, integrated release ofall of our products.
The risks of our commitment to the .Net Platform include, but are not limited to, the following:
�The possibility that prospective customers will refrain from purchasing the current versions of products to be re-written because they arewaiting for the .Net Platform versions;
Copyright © 2012 www.secdatabase.com. All Rights Reserved.Please Consider the Environment Before Printing This Document

5
Copyright © 2012 www.secdatabase.com. All Rights Reserved.Please Consider the Environment Before Printing This Document

Table of Contents
� The possibility that our .Net Platform beta customers will not become favorable reference sites;
� Adequate scalability of the .Net Platform for our largest customers;
� The ability of our development staff to learn how to efficiently and effectively develop products using the .Net Platform;
� Our ability to transition our installed base onto the .Net Platform when it is available;
�Microsoft�s ability to achieve market acceptance of the .Net platform; and
�Microsoft�s continued commitment to enhancing and marketing the .Net platform.
We are attempting to mitigate some of the foregoing risks with the following strategies:
� Provide customers who remain on maintenance with .Net Platform version of products as part of maintenance;
� Use of large beta customers to test and to demonstrate scalability;
� Use of the inherent component-based architecture that will enable us to manage changes to the code more efficiently;
�Focus business process programmers on only certain components, which will isolate them from the overall complexity of thetechnology; and
�Use of a development methodology whereby we conduct a series of performance benchmarks throughout the development effort so thatperformance enhancements are made continuously throughout the project.
Despite efforts to mitigate the risks of the .Net Platform project, there can be no assurances that our efforts to re-write many of our currentproducts and to develop new products using the .Net Platform will be successful. If the .Net Platform project is not successful, it likely willhave a material adverse effect on our business, operating results and financial condition.
Implement our Customer Value Program. In fourth quarter 2002 we announced a worldwide initiative, the Customer Value Program(�CVP�). CVP is designed to refocus the organization on delivering value to our existing customer base, increasing revenues, and improvingthe quality, satisfaction and efficiency of our customers� experience with JDA. Initially, CVP will primarily impact our sales, services andeducation organizations. CVP has resulted in the following fundamental changes to our organizational structure:
�Consolidation of our operations into three geographic regions: The Americas (United States, Canada, and Latin America); Europe(Europe, Middle East and Africa); and Asia/ Pacific.
�Implementation of a Customer Engagement Model that provides a single point of contact for our customers for all aspects of ourbusiness (software sales, services and support). This role is designed to foster long-term strategic partnerships with our customer base.
�Combination of our sales and services personnel into a single Customer Solutions Group. This new organization is intended to ensure asmooth transition from the sales cycle to implementation and allow for broader product coverage.
�Elimination of certain management positions, and the introduction of a professional career structure for all associates within theCustomer Solutions Group.
�Increased focus and investment in associate education in order to develop a higher degree of expertise in our associates, and to enhancethe long-term value to our customers.
Copyright © 2012 www.secdatabase.com. All Rights Reserved.Please Consider the Environment Before Printing This Document

We intend for the implementation of CVP to create fundamental change in our organization, operations and relationships with ourcustomers that may be disruptive in the near term. We believe CVP will significantly strengthen our competitive position and ultimatelyimprove our operating results. However, in the
6
Copyright © 2012 www.secdatabase.com. All Rights Reserved.Please Consider the Environment Before Printing This Document

Table of Contents
near term, the costs and risks associated with the widespread change contemplated in CVP could adversely affect our operating results.
Product Development and the JDA Portfolio Framework
Our products incorporate much of the latest technology, and are designed to address broad, enterprise-wide retailing, e-commerce, andcollaborative functionality. At the same time, we endeavor to design products that are easily tailored to the specific workflows and businessprocesses of our individual customers, and are readily adapted to changing conditions.
During 2002 we introduced a significant change to our product and technology strategy with the adoption of the ..Net Platform as theplatform standard for most of the applications in the JDA Portfolio. We expect to gradually transition to .Net Platform beginning in 2003 witha full transition expected within two to three years. We will design the transition to minimize the impact upon our customers� currentinvestment in information technology (�IT�) infrastructure. The JDA Portfolio Framework is designed around a three-tier architecture:
(3-tier Flow Chart)
The Client Tier utilizes .Net framework and provides a common look and feel for all JDA Portfolio applications. This will enhance thepower of our integrated solution offering by enabling end users to move easily between multiple JDA Portfolio applications through acommon interface that utilizes a consistent set of instructions and options. The Client Tier can be connected to the Business Function Tierthrough the Internet using a virtual private network or through any corporate wide area network that supports the TCP/IP protocol.
The Business Function Tier also utilizes .Net and is where the JDA Portfolio application functionality resides. We are developingcapabilities in the Business Function Tier that are required to allow a JDA Portfolio user to move seamlessly from one of our applications toanother without interrupting their workflow.
The Database Server Tier is the least changed component of our JDA Portfolio Framework strategy. We will continue to support the IBMiSeries platform, Unix/ Oracle and Microsoft Windows/ SQL Server platforms for the Database Server Tier. This continuity will allow all ofour customers to rapidly deploy the benefits of our new JDA Portfolio Framework enabled solutions, as they become available, withouthaving to make significant changes to their hardware infrastructure.
As of December 31, 2002, we had 351 employees on our product development staff representing product design, development and qualityassurance. Our product development expenditures in 2002, 2001, and 2000 were $41.8 million, $34.4 million, and $28.8 million, whichrepresented 19%, 16%, and 16% of total revenues, respectively. We also invested over $95 million in acquisitions of complementary productsduring the three years ended December 31, 2002. In order to take advantage of certain efficiencies that the migration to the .Net Platformoffers, we decided to consolidate the majority of our development operations in Scottsdale, Arizona. The relocation of these developmentactivities began in fourth quarter 2002 and is expected to be complete in mid-2003.
Products
The JDA Portfolio is a comprehensive suite of sophisticated software solutions designed specifically to address the demand and supplychain management, business process, decision support, e-commerce and multi-channel retailing, inventory optimization, and collaborativeplanning and forecasting requirements of the retail industry and their suppliers. During 2002, we implemented a new naming convention forthe products in the JDA Portfolio designed to position the applications as a series of functional solutions in an enterprise framework. Keybrand names have been maintained from the acquisitions of Arthur, Intactix and E3, and
7
Copyright © 2012 www.secdatabase.com. All Rights Reserved.Please Consider the Environment Before Printing This Document

Table of Contents
from certain of our internally developed applications. The new names of our products are indicated below followed by the old names inparentheses � [Old Name].
We offer software solutions for each of our business segments as follows:
Retail Enterprise Systems
�
Retail Enterprise Systems include corporate level planning and merchandise management systems (�Portfolio Merchandise ManagementSystems�) that enable retailers to optimize their inventory control, product mix, pricing and promotional strategies, automate demandforecasting and replenishment, and enhance the productivity and accuracy of warehouse processes. In addition, Retail EnterpriseSystems include a comprehensive set of tools for analyzing business results and trends, tracking customer shopping patterns, spacemanagement, trade allowance and promotional program management, monitoring strategic plans and tactical decisions (�StrategicMerchandise Management Solutions�).
Portfolio Merchandise Management Systems �� [formerly Host Merchandising Systems]:
�
Portfolio Merchandise Management (��PMM��) � [formerly ODBMS]is an open/ client server merchandise management system thatis designed to operate with Oracle relational database management systems running on the most popular UNIX platforms and WindowsNT/ 2000/ XP. PMM, which consists of functional modules that can be selected and configured to fit multiple processing requirements,provides retailers with applications for core inventory control, cost and price management, purchase order management, promotionalplanning, automated replenishment, expert pricing, vendor submissions, rebate management and a business process level online helpsystem. PMM supports the information requirements of international and multi-format retail organizations including multipleconcurrent languages and currencies, user-specific terminology, and user-defined data structures. During 2002, we developedfunctionality for PMM specific to the inventory management requirements of the grocery industry for perishable products and preparedfoods. We also announced a strategic alliance with Manhattan Associates in 2002 under which we have and will work with mutual andprospective customers to develop, maintain, and support a standard tool set to ensure ease of integration between Manhattan Associates�PkMS® extended supply chain execution solution and PMM. We believe the PkMS® application is a leading warehouse managementsystem and, as a result, we feel this strategic alliance will enable us to more effectively pursue larger customers that require an advancedwarehouse management system. Portfolio 2003.5, which was released in February 2003, includes a standard integration between PMMand PkMS®.
�
Portfolio Merchandise Management System-I (��MMS��) � [formerly MMS] is a merchandising management system designed forthe IBM iSeries environment that we believe is one of the most installed merchandise management systems in the world. MMS consistsof functional modules, similar to those offered for PMM, which can be selected by a retailer and configured to fit their uniquerequirements. MMS version 4R6 features enhanced functionality for apparel clients and international retailers, and a new JAVA-basedgraphical user interface (�GUI�) that incorporates technology licensed from third parties.
�
MMS Multi-Channel Order Processing (��MMS Multi-Channel��) � [formerly MMS.com] is an integrated e-commerce softwareapplication that works in tandem with MMS and provides retailers with an Internet-based sales and delivery system. MMS Multi-Channel integrates all back-end processing and allows retailers to automate their product catalogs, manage inventory and prices, verifycredit, fulfill and ship orders, track customer information and process returns.
8
Copyright © 2012 www.secdatabase.com. All Rights Reserved.Please Consider the Environment Before Printing This Document

Table of Contents
Strategic Merchandise Management Solutions � [formerly Analytic Applications]:
Customer Relationship Management
�
Affinity is a customer relationship management solution that currently consists of two modular, open/ client server applications, enablesretailers to support and proactively manage customer information from multiple channels and targeted e-mail and mail campaigns. Thefirst module, Base Customer Data, was commercially released in 2001 and enables retailers to manage basic customer data includingname and address, as well as multiple customer attributes such as sizes and demographics. Customer Loyalty, which was commerciallyreleased in 2002, enables retailers to define and maintain a marketing strategy that rewards repeat or volume customers with incentives.
Portfolio Planning and Forecasting
�
Portfolio Advanced Planning Solutions by Arthur (��Portfolio Planning) � [formerly Arthur Enterprise Suite] is a set ofintegrated decision support applications based on technology acquired from Comshare, Incorporated in June 1998. Portfolio Planningis a three-tier application that is currently available for end user/ client applications on Windows 95/98 or NT/2000, for applicationservers on NT/2000, and for database servers on NT/2000, AIX, HP UX, and Sun Solaris. Portfolio Planning is comprised of five corecomponents: Merchandise Planning by Arthur [formerly Arthur Planning], an application for strategic and channel merchandiseplanning; Advanced Allocation by Arthur [formerly Arthur Allocation], an application for product and store allocation decision making;Assortment Planning by Arthur [formerly Arthur Assortment Planning], a product assortment planning application for seasonalmerchandise (typically own brand); Arthur Knowledge Base (�AKB�) � [formerly Arthur Information Manager], a database that allowsfor central organization of data and applications; and Performance Analysis by Arthur [formerly Arthur Performance Analysis], a webbased analytical tool designed to support the analysis of planning and actual performance information using the AKB operating on Unix/Oracle.
�
Portfolio Space Management Solutions by Intactix (��Portfolio Space Management��) � [formerly Intactix Space ManagementSolutions] is a set of space management applications acquired from Intactix International, Inc. in April 2000. Portfolio SpaceManagement, which enables retailers to collaborate with their suppliers to ensure optimal product mix and shelf positioning, iscomprised of four core components: Space Planning by Intactix [formerly pro/ space Plus], a next generation planogramming solutionused by both retailers and their suppliers, that allows users to build, analyze, and distribute graphical diagrams for space management,store layout planning and shelf assortment analysis; Floor Planning by Intactix [formerly pro/floor], a floor planning tool that enablesretailers and their suppliers to merge store design efforts with category and space planning; Efficient Item Assortment by Intactix(�EIA�) [formerly pro/ sortment EIA], a tool providing product assortment planning for branded merchandise; and Intactix KnowledgeBase [formerly pro/fusion], an enterprise level database supporting the Space Planning and Floor Planning applications, as well as allproduct and fixture information for an entire store system.
Portfolio Allocation and Replenishment
�
Portfolio Advanced Replenishment Solutions by E3 (��Portfolio Replenishment��) � [formerly E3] is an inventory optimization suiteacquired from E3 Corporation in September 2001 that utilizes sophisticated algorithms to enable warehouses, distribution centers, andretailers to more effectively forecast and replenish inventory, and manage the movement of goods from supplier to store. PortfolioReplenishment includes Advanced Warehouse Replenishment by E3 [formerly E3Trim], a warehouse and distribution centerforecasting and replenishment solution and Advanced Store Replenishment by E3 [formerly E3Slim], a store level forecasting andreplenishment solution.
Portfolio Allocation and Replenishment solutions also include the Advanced Allocation by Arthur application for product and storeallocation decision-making.
9
Copyright © 2012 www.secdatabase.com. All Rights Reserved.Please Consider the Environment Before Printing This Document

Table of Contents
Portfolio Advanced Optimization
�
Intellect � [formerly Intellect Data Mining] is a series of advanced analytic modules that are designed to optimize specific businessproblems through the use of data mining, analytical and clustering techniques. The current series of Intellect modules include: DemandPlanning by Intellect, which enables retailers to create accurate pre-season demand forecasts for planning purposes and the ability tocreate in-season forecasts that utilize the current season trend, sales to date and a planned inventory position; Seasonal Profiling byIntellect, which allows retailers to optimize their creation and management of seasonal replenishment profiles using clusteringtechniques; Channel Clustering by Intellect, which enables retailers to group stores together for planning and assortment planningpurposes, or allocation and replenishment modeling, using detailed sales level data to indicate customer preference patterns bydepartment, category, product, price points and brands; and Size Scaling by Intellect, which is targeted primarily to fashion retailers andwill determine a best-fit size template for ordering, allocation and replenishment by style, class or department. We are also integratingthe Consumer Outlook data mining application for consumer behavior patterns and the Pin Point! seasonal profile assignmentapplications acquired from E3 into the Seasonal Profiling by Intellect module. We anticipate the development of an Event LiftForecasting by Intellect module that will use sophisticated Intellect data mining engines to provide forecasts of promotional salesuplifts.
Portfolio Business Intelligence
�
Performance Analysis by IDEAS (��IDEAS��) � [formerly Retail IDEAS] is a data warehouse system developed jointly with SilvonSoftware, Inc. that provides a comprehensive set of tools for analyzing business results, monitoring strategic plans and enabling tacticaldecisions. IDEAS is currently available on the IBM iSeries, Windows NT/ 2000/ XP and Microsoft SQL Server, and Unix/ Oracleplatforms. IDEAS is designed as a packaged offering that enables retailers to monitor vendor performance, promotional effectivenessand distribution center productivity, and to analyze financial measurements related to sales and inventory, margins and profitability,merchandise categories, open and suggested orders, and promotional and pricing events.
Portfolio Business Intelligence also includes Performance Analysis by Arthur, a web based analytical tool designed to support theanalysis of planning and actual performance information using AKB operating on Unix/ Oracle.
Portfolio Revenue Management
In 2002, we commenced planning for a new suite of applications that will address the critical business functions around promotionalmanagement, vendor incentive funding, and price optimization. Known as Portfolio Revenue Management, these new products willsupersede certain price management functionality in the PMM application and merge the functionality contained in the followingapplications:
�
Vendor Incentive Management (��VIM��) � [formerly ProMax] is a software application acquired from Zapotec Software, Inc. inFebruary 2001. VIM enables retailers, suppliers and distributors to manage their trade allowance and promotional programs byautomating the contract fulfillment, claim generation and accounts receivable process.
�
Marketing Expense Management (��MEM��) � [formerly AdPlan] is a solution that enables retailers, wholesalers and manufacturersto automate advertising and promotional practices to maximize efficiencies and bottom line benefits. With MEM, users can easilymanage multiple budgets, accruals and actual expenses on a single solution. MEM also automates the entire media procurementprocess, including issuing purchase orders and insertion orders, as well as tracking invoices and revisions, to increase accuracy andassociate productivity.
10
Copyright © 2012 www.secdatabase.com. All Rights Reserved.Please Consider the Environment Before Printing This Document

Table of Contents
In-Store Systems
In-Store Systems include point-of-sale, e-commerce and back office applications that enable retailers to capture, analyze and transmitcertain sales, store inventory and other operational information to corporate level merchandise management systems using hand-held, radiofrequency devices, point-of-sale workstations or via the Internet.
Portfolio Store Systems:
�
Win/ DSS is a Windows based in-store system that provides register operations in store, as well as back office processes such as salesorders, receiving, store inventory, and returns, and real-time hand-held radio frequency-based data collection and processing. Win/ DSSis also integrated with our Store Portal and Affinity offerings to provide enterprise-wide inventory and customer management.
�
Portfolio Point of Sales (��PPOS��) is a Java-based in-store system based on intellectual property we acquired from J � Commerce Inc.in April 2002. As designed, PPOS will provide register operations in-store which, when combined with Store Portal, offers acomplementary product strategy with Win/ DSS for larger customers with annual sales of $5 billion and/or a large number of stores/orregisters per store. We expect the first general release of PPOS in 2003.
�
Store Portal is a web-based interface that provides retailers with real-time access to enterprise information on their merchandisemanagement systems, via the Internet. Store Portal enables retailers to immediately initiate associated store level processes such asshipment inquiries, transfer requests, store orders, purchase orders and return to vendor rather than waiting for a nightly polling process,and to provide for greater visibility into enterprise merchandising information at the store level.
�
Prism is an automated data collection and processing system that enables store-level personnel to execute procedures from anywhere inthe store using a hand-held radio frequency device. With Prism, store-level personnel can handle item ticketing while receivingmerchandise, handle point of sale functions and print receipts. We have also developed PDA Portal, a browser-based application withfunctionality similar to Prism, that operates on a personal digital assistant (PDA) device.
Collaborative Solutions
Collaborative Solutions provide applications that enable business-to-business collaborative CPFR between retailers and their suppliers.Collaborative Solutions, which currently include portions of our Portfolio Planning, Portfolio Space Management, PortfolioReplenishment, and Intellect applications that can be used by suppliers as well as collaborative specific solutions, enable retailers and theirsuppliers to optimize the sharing of plans, information and supply chain decisions between trading partners in such areas as inventoryreplenishment, marketing/ promotions, sales planning/ execution and category management. As of December 31, 2002, we have 136 tradingpartners worldwide that are live and fully operational on our Marketplace Replenishment solution that provides web-based portal access tothe Advanced Warehouse Replenishment by E3 and Advanced Store Replenishment by E3 applications and enables the creation of a single,shared demand forecast that retailers and their suppliers can use to lower distribution and freight costs, increase annual sales, improve forecastaccuracy, lower inventory requirements, and increase human productivity. As part of our strategy we will expand our Collaborative Solutionsto include other modular functionality from our Retail Enterprise Systems that has been adapted to collaborative environments, and throughthe acquisition of additional collaborative applications. We currently offer the following collaborative specific solutions:
Portfolio Collaborative Solutions
�Marketplace Replenishment � [formerly E3Marketplace.com] a web based solution designed to deliver collaborative planning,forecasting and replenishment between retailers and their suppliers.
�Electronic Dynamic Agreement (��EDA��) is a web-based solution designed to support extended vendor management of thereplenishment process by transferring control of the buying decision to the vendor.
Copyright © 2012 www.secdatabase.com. All Rights Reserved.Please Consider the Environment Before Printing This Document

11
Copyright © 2012 www.secdatabase.com. All Rights Reserved.Please Consider the Environment Before Printing This Document

Table of Contents
Portfolio Client Support
We offer Portfolio Client Support services that include product maintenance, on-line support, and access to our Solution Centers viatelephone, web interfaces, and email. Our standard maintenance services agreement entitles clients to receive unspecified new product releases(exclusive of those which introduce significant new functionality), access to our Solution Centers, and comprehensive error diagnosis andcorrection. Clients have the option of choosing service programs that extend hours of coverage, incorporate support for custom configurations,or provide special attention through periods of high activity or upgrade processing. We also offer enhanced support services that provideclients with difficult to find technical skills, such as database administration or with an outsource alternative to help desk and otherinformation technology services. The vast majority of our clients have typically participated in one or more of our Portfolio Client Supportprograms.
Portfolio Client Services
�
Consulting. Our consulting services group consists of business consultants, systems analysts and technical personnel with extensiveretail industry experience. The consulting services group assists our customers in all phases of systems implementation, includingsystems planning and design, customer-specific configuration of application modules, and on-site implementation or conversion fromexisting systems. We also offer a variety of post-implementation services designed to maximize our customers� return on softwareinvestment, which include enhanced utilization reviews, business process optimization and executive �how to� sessions. The �how to�sessions empower executives to access key management reports online instead of referring to spreadsheets. Consulting services arebilled on both an hourly basis and under fixed price contracts. In addition, we augment our services on large-scale implementations andextensive business process re-engineering projects with third-party alliances, consulting firms and systems integrators. Our consultingengagements have typically taken between three months and one year for Retail Enterprise Systems, between four and eight months forIn-Store Systems, and 30 to 90 days for Collaborative Solutions. We believe the implementation time frames for our software productshave shortened as a result of the increased expertise, training, and efficiency of our consulting services group, and as a result of morethan $152 million in internal product development expenditures over the past five years that have improved the stability, scalability,integration, ease of installation and overall quality of our products.
�
Training. We offer a comprehensive education and training program for our clients, associates and business partners. We initiated JDAUniversity (�JDAU�) in 1997 as a formal education program that combines lectures, demonstrations and hands-on exercise sessions.During 2002, we combined JDAU with the Inventory Management Institute acquired from E3 to form the Business ManagementInstitute (��BMI��). BMI features a curriculum for each of our software solutions, prepaid training packages, and a full-time staffconsisting of professional instructors and course developers. The BMI curriculum ranges from basic overviews, implementation andtechnical/ developer classes to business process education. Courses are offered primarily at our in-house classroom facilities inScottsdale, Atlanta, Dallas, Chicago, London and Singapore, and customized on-site classes are available. More than 5,800 individualsattended BMI during 2002. During 2003 we will extend the BMI offerings to include the introduction of web-based education.
Customers
Our customers include more than 4,600 of the world�s leading retail, manufacturing, and wholesale organizations. We believe we havethe largest retail customer installed base among our direct competitors, with over 1,200 retail customers in over 60 countries that own at leastone of our products. JDA serves a diverse client base from specialty powerhouse chains with 5,000 plus retail stores and multi format foodchains, to global consumer packaged goods manufacturers and hard goods distributors. Our software is capable of supporting our clients�multi-channel operations, which may include brick-and-mortar stores, Internet, e-commerce, catalog and wholesale distribution. We marketour software solutions to approximately 3,350 retailers worldwide with annual sales of $100 million or more. Our acquisitions of Arthur,Intactix, and E3
12
Copyright © 2012 www.secdatabase.com. All Rights Reserved.Please Consider the Environment Before Printing This Document

Table of Contents
expanded our client base to include more than 3,400 suppliers to the retail industry and added software applications that enable business-to-business CPFR between retailers and their suppliers. These acquisitions, together with the investments we�ve made over the past five years toincrease the scalability of our products, have enabled us to pursue emerging growth opportunities in the retail supply chain and further expandour target markets to include larger multi-national retail organizations with annual sales in excess of $5 billion, and over 27,000 suppliers tothe retail industry.
Sales and Marketing
We market our products and services almost exclusively through our direct sales force. Our Americas direct sales force is based inScottsdale, Arizona with 14 regional sales and support offices across the United States, Canada and Latin America. We also have internationalsales representatives located in 17 sales and support offices in major cities throughout Europe, Asia, Australia, and Japan.
Sales to new customers have historically required between three and nine months from generation of the sales lead to the execution of asoftware license agreement. Sales cycles may be longer for larger dollar projects, large, multi-national retail organizations and retailers incertain geographic regions. In addition, our strategy of offering a comprehensive portfolio of integrated software applications, that can beinstalled independently or as a complete solution, has created increased back-selling opportunities to existing customers. These sales typicallyrequire shorter sales cycles and are less competitive. During 2002, we initiated tele-sales functions in the Americas, Europe and Asia/ Pacificdesigned to provide rapid access to additional licenses of our products. As of December 31, 2002, our sales and marketing organizationconsisted of 81 employees in the Americas, 51 in Europe and 11 in Asia/ Pacific. These totals include 46, 33 and 9 direct sales representatives,respectively.
Competition
The markets for our software products are highly competitive. However, we believe the number of significant competitors in many of ourapplication markets has diminished over the past five years. We believe the principal competitive factors in our markets are feature andfunctionality, product reputation and reference accounts, retail and supply chain industry expertise, total solution cost and quality of customersupport. We believe that pricing pressure has increased in response to the economic downturn, which could cause us to offer more significantdiscounts, or in some cases to lose potential business to competitors willing to offer what we believe to be overly aggressive discounts. Weencounter competitive products from a different set of vendors in each of our primary product categories.
Our Retail Enterprise Systems compete primarily with Retek, Inc., and with internally developed systems and other third-party developerssuch as Essentus, Inc., GERS, Inc., Marketmax, Inc., Micro Strategies Incorporated, Evant, Inc. (formerly Nonstop Solutions), NSB RetailSystems PLC, SAP AG, and SVI Holdings, Inc. In addition, new competitors may enter our markets and offer merchandise managementsystems that target the retail industry.
The competition for our In-Store Systems is more fragmented than the competition for our Retail Enterprise Systems. We competeprimarily with small point-of-sale focused companies such as CRS Business Computers, Datavantage, Inc., 360 Commerce, TomaxTechnologies and Triversity, Inc. We also compete with other broad solution set providers such as NSB Retail Systems PLC and Retek, Inc.
Our current Collaborative Solutions compete primarily with products from Marketmax, Inc., Evant Inc. (formerly Nonstop Solutions),AC Nielsen Corporation, i2 Technologies, Manugistics Group, Inc., Information Resources, Inc., and Synchra Systems.
In the market for consulting services, we have pursued a strategy of forming informal working relationships with leading retail systemsintegrators such as Cap Gemini Ernst & Young, Kurt Salmon Associates and IBM Consulting Services (formerly PriceWaterhouseCoopers).These integrators, as well as independent consulting firms such as Accenture, IBM Global Services, AIG Netplex, CFT Consulting, LakewestConsulting, SPL and ID Applications, also represent competition to our consulting services group.
13
Copyright © 2012 www.secdatabase.com. All Rights Reserved.Please Consider the Environment Before Printing This Document

Table of Contents
Moreover, because many of these consulting firms are involved in advising our prospective customers in the software selection process, theymay successfully encourage a prospective customer to select software from a software company with whom they have a relationship.Examples of such relationships between consulting firms and software companies include the relationships between Retek, Inc. andAccenture, and between Retek, Inc. and IBM Global Services.
As we continue to develop or acquire e-commerce products and expand our business in the Collaborative Solutions area, we expect toface potential competition from business-to-business e-commerce application providers, including Ariba, Commerce One, Commercialware,i2 Technologies, Manugistics Group, Inc., Microsoft, Inc., Retek, Inc., SAP AG, Synchra Systems, Ecometry Corporation, and others. A fewof our existing competitors, as well as a number of potential new competitors, have significantly greater financial, technical, marketing andother resources than we do, which could provide them with a significant competitive advantage over us. We cannot guarantee that we will beable to compete successfully against our current or future competitors, or that competition will not have a material adverse effect on ourbusiness, operating results and financial condition.
Proprietary Rights
Our success and competitive position is dependent in part upon our ability to develop and maintain the proprietary aspect of ourtechnology. The reverse engineering, unauthorized copying, or other misappropriation of our technology could enable third parties to benefitfrom our technology without paying for it.
We rely on a combination of trademark, trade secret, copyright law and contractual restrictions to protect the proprietary aspects of ourtechnology. We seek to protect the source code to our software, documentation and other written materials under trade secret and copyrightlaws. To date, we have not protected our technology with patents. Effective copyright and trade secret protection may be unavailable orlimited in certain foreign countries. We license our software products under signed license agreements that impose restrictions on thelicensee�s ability to utilize the software and do not permit the re-sale, sublicense or other transfer of the source code. Finally, we seek to avoiddisclosure of our intellectual property by requiring employees and independent consultants to execute confidentiality agreements with us andby restricting access to our source code.
We license and integrate technology from third parties in certain of our software products. For example, we license the Uniface client/server application development technology from Compuware, Inc. for use in PMM, certain applications from Silvon Software, Inc. for use inIDEAS, IBM�s Net.commerce merchant server software for use in MMS Multi-Channel, and the Syncsort application for use in AKB. Thesethird party licenses generally require us to pay royalties and fulfill confidentiality obligations. If we are unable to continue to license any ofthis third party software, or if the third party licensors do not adequately maintain or update their products, we would face delays in thereleases of our software until equivalent technology can be identified, licensed or developed, and integrated into our software products. Thesedelays, if they occur, could harm our business, operating results and financial condition. It is also possible that intellectual property acquiredfrom third parties through acquisitions, mergers, licenses or otherwise may not have been adequately protected.
There has been a substantial amount of litigation in the software and Internet industries regarding intellectual property rights. It is possiblethat in the future third parties may claim that our current or potential future software solutions or we infringe on their intellectual property. Weexpect that software product developers and providers of e-commerce products will increasingly be subject to infringement claims as thenumber of products and competitors in our industry segment grows, the functionality of products in different industry segments overlap andthe number of software patents increases. In addition, we may find it necessary to initiate claims or litigation against third parties forinfringement of our proprietary rights or to protect our trade secrets. Furthermore, since we now resell hardware we may become subject toclaims from third parties that the hardware, or the combination of hardware and software, infringe their intellectual property. Although wemay disclaim certain intellectual property representations to our customers, these disclaimers are limited
14
Copyright © 2012 www.secdatabase.com. All Rights Reserved.Please Consider the Environment Before Printing This Document

Table of Contents
and may not be sufficient to fully protect us against such claims. We may be more vulnerable to patent claims since we do not have anypatents that we can assert defensively against a patent infringement claim. Any claims, with or without merit, could be time consuming, resultin costly litigation, cause product shipment delays or require us to enter into royalty or license agreements. Royalty or licensing agreements, ifrequired, may not be available on terms acceptable to us or at all, which could have a material adverse effect on our business, operating resultsand financial condition.
Employees
As of December 31, 2002, we had 1,235 employees: 897 based in the Americas, 236 based in Europe, and 102 based in Asia/ Pacific. Ofthe total, 143 were engaged in sales and marketing, 468 were in consulting services, 132 were engaged in client support services, 351 were inproduct development, and 141 were in administrative functions. We believe that our relations with our employees are good. We have neverhad a work stoppage and none of our employees are subject to a collective bargaining agreement.
Our future operating results depend significantly upon the continued service of our key technical and senior management personnel, andour continuing ability to attract and retain highly qualified technical and managerial personnel. Competition for such personnel is intense, andthere can be no assurance that we will retain our key managerial or technical personnel or that we can attract, assimilate and retain suchpersonnel in the future. We have at times experienced difficulty recruiting qualified personnel, and there can be no assurance that we will notexperience such difficulties in the future. If we are unable to hire and retain qualified personnel in the future, or if we are unable to assimilatethe employees from any acquired businesses, such inability could have a material adverse effect on our business, operating results andfinancial condition.
Available Information
Our annual reports on Form 10-K, quarterly reports on Form 10-Q, current reports on Form 8-K, and amendments to those filed orfurnished pursuant to Sections 13(a) or 15(d) of the Securities Exchange Act of 1934, as amended, are available free of charge from ourwebsite at www.jda.com, as soon as reasonably practicable after we electronically file such material with, or furnish it to, the Securities andExchange Commission.
Item 2. Properties
Our corporate offices are located in Scottsdale, Arizona, where we lease approximately 121,000 square feet of a 136,000 square footfacility and have expansion rights and a first right of offer on the remaining space. We also use this facility for certain of our sales, marketing,consulting, customer support, training, and product development functions. Our corporate office lease commenced in April 1999 and extendsthrough March 31, 2009. The initial monthly rate of approximately $135,000 will remain in effect for five years. In addition, we lease officespace in the Americas for 14 regional sales and support offices across the United States, Canada and Latin America, and for 17 internationalsales and support offices located in major cities throughout Europe, Asia, Australia, and Japan. We expect to close two of these offices in 2003due to the consolidation of our development activities in Scottsdale, Arizona. These leases are primarily noncancellable operating leases andexpire at various dates through the year 2012. Certain of our office leases contain renewal options. We expect that in the normal course ofbusiness some or all of these leases will be renewed or that suitable additional or alternative space will be available on commerciallyreasonable terms as needed. We also own approximately 20,000 square feet of office space in the United Kingdom. We believe our existingfacilities are adequate for our current needs.
Item 3. Legal Proceedings
Copyright © 2012 www.secdatabase.com. All Rights Reserved.Please Consider the Environment Before Printing This Document

We are involved in legal proceedings and claims arising in the ordinary course of business. Although there can be no assurance,management does not believe that the disposition of these matters will have a material adverse effect on our business, financial position,results of operations or cash flows.
15
Copyright © 2012 www.secdatabase.com. All Rights Reserved.Please Consider the Environment Before Printing This Document

Table of Contents
Item 4. Submission of Matters to a Vote of Security Holders
No matters were submitted to a vote of security holders during fourth quarter 2002.
PART II
Item 5. Market for Registrant��s Common Equity and Related Stockholder Matters
Our common stock trades on the NASDAQ Stock Market (�NASDAQ�) under the symbol �JDAS.� The following table sets forth, forthe periods indicated, the high and low sales prices per share of our common stock for the two most recent fiscal years as reported onNASDAQ.
Year Ended 2002 High Low
1st Quarter $ 32.82 $ 20.132nd Quarter 35.89 20.903rd Quarter 28.40 6.374th Quarter 12.22 5.10
Year Ended 2001 High Low
1st Quarter $ 14.63 $ 7.192nd Quarter 18.24 9.633rd Quarter 22.94 10.254th Quarter 23.95 10.26
On March 14, 2003, the closing sale price for our common stock was $10.03 per share. On this date, there were approximately 270holders of record of our common stock. This figure does not reflect what we believe are more than 4,000 beneficial stockholders whose sharesare held in nominee names by brokers and other institutions. We have never declared or paid any cash dividend on our common stock. Sincewe presently intend to retain future earnings to finance the growth and development of our business, we do not anticipate paying cashdividends on our common stock in the foreseeable future.
The market price of our common stock has experienced large fluctuations and may continue to be volatile in the future. Factors such asfuture announcements concerning us or our competitors, quarterly variations in operating results, announcements of technological innovations,the introduction of new products or changes in product pricing policies by us or our competitors, proprietary rights or other litigation, changesin our growth prospects, changes in earnings estimates by analysts or other factors could cause the market price of our common stock tofluctuate substantially. Further, the stock market has from time to time experienced extreme price and volume fluctuations that have affectedthe market price for many high technology companies and which, on occasion, have been unrelated to the operating performance of thosecompanies. These fluctuations, as well as the general economic, market and political conditions both domestically and internationally,including recessions, military conflicts including the threat of war with Iraq, or terrorists activities such as the September 11 attack, maymaterially and adversely affect the market price of our common stock.
Copyright © 2012 www.secdatabase.com. All Rights Reserved.Please Consider the Environment Before Printing This Document

Item 6. Selected Financial Data
The following selected financial data should be read in conjunction with our consolidated financial statements and related notes and with�Management�s Discussion and Analysis of Financial Condition and Results of Operations� included elsewhere herein. The selectedconsolidated financial data presented below under the captions �Consolidated Statement of Income Data� and �Consolidated Balance SheetData� for, and as of the end of, each of the years in the five-year period ended December 31, 2002, are derived from the consolidated financialstatements of JDA Software Group, Inc. The consolidated financial statements as of December 31, 2002 and 2001, and for each of the years inthe three-year period ended December 31, 2002, and the independent auditors� report thereon, are included elsewhere herein.
16
Copyright © 2012 www.secdatabase.com. All Rights Reserved.Please Consider the Environment Before Printing This Document

Table of Contents
Consolidated Statement of Income Data:
Year Ended December 31,
2002 2001 2000 1999 1998
(In thousands except per share data)
REVENUES:Software licenses $ 66,625 $ 71,220 $ 62,640 $ 36,798 $ 43,342Maintenance services 57,570 40,568 30,380 18,924 12,029
Product revenues 124,195 111,788 93,020 55,722 55,371Consulting services 87,608 95,124 78,709 86,941 83,092Reimbursed expenses 7,652 6,904 6,970 3,736 1,848
Service revenues 95,260 102,028 85,679 90,677 84,940Total revenues 219,455 213,816 178,699 146,399 140,311
COST OF REVENUES:Cost of software licenses 2,035 2,376 2,947 1,955 2,011Amortization of acquired software
technology 4,247 2,971 1,834 779 233Cost of maintenance services 14,292 11,159 7,655 6,245 3,452
Cost of product revenues 20,574 16,506 12,436 8,979 5,696Cost of consulting services 63,837 69,953 64,965 64,362 61,685Reimbursed expenses 7,652 6,904 6,970 3,736 1,848
Cost of service revenues 71,489 76,857 71,935 68,098 63,533Total cost of revenues 92,063 93,363 84,371 77,077 69,229
GROSS PROFIT 127,392 120,453 94,328 69,322 71,082OPERATING EXPENSES:Product development 41,819 34,406 28,840 25,000 22,171Sales and marketing 39,941 37,998 28,770 24,639 21,282General and administrative 26,978 27,099 20,761 17,195 16,215Amortization of intangibles 2,849 5,526 4,708 3,630 2,105Purchased in-process research and
development 800 2,361 200 � 17,000Restructuring, asset disposition and other
merger related charges 6,287 985 828 2,111 �
Relocation costs to consolidatedevelopment and support activities 452 � � � �
Total operating expense 119,126 108,375 84,107 72,575 78,773
OPERATING INCOME (LOSS) 8,266 12,078 10,221 (3,253 ) (7,691 )Other income, net 1,700 2,671 4,246 3,814 3,276
Copyright © 2012 www.secdatabase.com. All Rights Reserved.Please Consider the Environment Before Printing This Document

INCOME (LOSS) BEFORE INCOMETAXES 9,966 14,749 14,467 561 (4,415 )Income tax provision (benefit) 1,036 5,101 5,599 224 (1,947 )
NET INCOME (LOSS) $ 8,930 $ 9,648 $ 8,868 $ 337 $ (2,468 )
BASIC EARNINGS (LOSS) PERSHARE $ .32 $ .38 $ .36 $ .01 $ (.11 )
DILUTED EARNINGS (LOSS) PERSHARE $ .31 $ .37 $ .35 $ .01 $ (.11 )
SHARES USED TO COMPUTE:Basic earnings (loss) per share 28,047 25,316 24,315 23,758 22,194Diluted earnings (loss) per share 29,074 25,757 25,431 23,758 22,194
17
Copyright © 2012 www.secdatabase.com. All Rights Reserved.Please Consider the Environment Before Printing This Document

Table of Contents
Consolidated Balance Sheet Data:
December 31,
2002 2001 2000 1999 1998
(In thousands)
Cash and cash equivalents $ 71,065 $ 51,865 $ 60,794 $ 58,283 $ 42,376Marketable securities(1) 30,790 12,140 15,800 35,245 43,013Working capital 120,956 93,094 112,752 108,486 98,322Total assets 315,054 288,642 218,472 197,045 199,561Long-term liabilities(2) 4,980 10,810 � � �
Stockholders� equity(3) 256,766 224,450 186,265 174,863 171,497
(1) The 1999 and 1998 totals include $4,822,000 and $6,697,000 respectively, of non-current marketable securities.
(2) Deferred tax liability.
(3) We have never declared or paid any dividend on our common stock.
Item 7. Management��s Discussion and Analysis of Financial Condition and Results of Operations
Overview
We are a leading provider of sophisticated software solutions designed specifically to address the demand and supply chain management,business process, decision support, e-commerce, inventory optimization, and collaborative planning and forecasting requirements of the retailindustry and its suppliers. Our solutions enable our customers to collect, manage, organize and analyze information throughout their retailenterprise, and to collaborate with suppliers and customers over the Internet at multiple levels within their organization. We also offermaintenance services to our software customers, and enhance and support our software business by offering retail specific services that aredesigned to enable our clients to rapidly achieve the benefits of our solutions. These services include project management, system planning,system design and implementation, custom configurations, and training services. Demand for our implementation services is driven by, andoften trails, sales of our software products. Consulting services revenues are generally more predictable but generate lower gross margins thansoftware license revenues.
Significant Trends and Developments in Our Business
Economic Conditions. We believe the retail industry remains cautious with their level of investment in information technology during thecurrent difficult economic cycle, perhaps due to poor macroeconomic conditions, and uncertainty related to the threat of future terrorist attacksand of a US war with Iraq. In addition, subsequent to the September 11 attack and the ensuing deterioration in economic conditions, webelieve retailers changed their buying behavior and this resulted in a fundamental shift in the mix of demand for the various types of productswe sell away from high dollar projects toward lower cost point solutions. We remain concerned about weak and uncertain economicconditions, and the disappointing results of retailers in certain of our geographic regions. The retail industry will be adversely impacted ifnegative economic conditions or fear of a war with Iraq or additional terrorists� attacks persist for an extended period of time. Weak anduncertain economic conditions have in the past, and may in the future, negatively impact our revenues, elongate our selling cycles, and delay,suspend or reduce the demand for our products. As a result, it is difficult in the current economic environment to predict exactly when specificsoftware licenses will close within a six to nine month time frame. In addition, we believe that pricing pressure has increased in response tothe economic downturn, which could cause us to offer more significant discounts, or in some cases to lose potential business to competitorswilling to offer what we believe to be overly aggressive discounts. Further, weak and uncertain economic conditions could cause a
Copyright © 2012 www.secdatabase.com. All Rights Reserved.Please Consider the Environment Before Printing This Document

deterioration of our customers� creditworthiness in the future and impair our customers� ability to pay for our products or services or cause anincrease in bankruptcy filings in our customer base. Any of these factors could adversely impact our business, quarterly or annual operatingresults and financial condition.
Impact of the E3 Corporation Acquisition. In September 2001 we completed the acquisition of E3 Corporation (�E3�) for a total cost of$60.1 million, which includes $20 million in cash and the exchange of 1,600,080 shares of our unregistered common stock for all of theoutstanding stock of E3 held by the former shareholders of E3, as well as
18
Copyright © 2012 www.secdatabase.com. All Rights Reserved.Please Consider the Environment Before Printing This Document

Table of Contents
$5.4 million in fees and direct costs associated with the acquisition and $10.5 million in restructuring costs to exit certain activities of E3. TheE3 product suite included inventory optimization systems such as E3Trim, a warehouse and distribution center forecasting and replenishmentsolution, and E3Slim, a store level forecasting and replenishment solution; advanced analytic solutions such as Consumer Outlook!, a datamining application for consumer behavior patterns, and Pin Point!, an application that refines seasonal profile assignments; and certaincollaborative planning, forecasting and replenishment (�CPFR�) solutions, which today include 136 trading partners worldwide that are liveand operational on applications that enable manufacturers, distributors and retailers to work from a single, shared demand forecast. We believethat due to the acquisition of E3 in 2001, we are now the leading provider of inventory replenishment solutions to retailers and their suppliers.Importantly, nearly 80% of E3�s client base is non-retail and we have accelerated our CPFR initiatives by gaining an immediate presence inthe wholesale and distribution industries that we had already targeted for growth. Total revenues in our Collaborative Solutions businesssegment increased 75% in 2002 compared to 2001, primarily because of the new products that E3 had developed for this evolving market.Excluding the impact of owning E3 for eight more months in 2002 than in 2001, product revenues, consulting services revenues, and totalrevenues decreased 8%, 15% and 11%, respectively in 2002 compared to 2001.
New Products and Expanded Markets. We invested $46 million in 2002, and approximately $292 million in the last five years from 1998to 2002 in new product development and the acquisition of complimentary products while remaining profitable and cash flow positive fromoperations. We released enhanced versions of our core software products during the past two years and introduced new value-added web-based applications such as Store Portal, Affinity and Marketing Expense Management. In addition, the acquisitions of Intactix, Zapotec,NeoVista Decision Series and E3 expanded our product offerings and provided us with collaborative applications that address new verticalmarket opportunities with the manufacturers and wholesalers who supply our traditional retail customers. The Collaborative Solutionsbusiness segment, which includes sales of software license and services to customers outside the retail market, provided 20% of our totalrevenues in 2002 compared to 11% in 2001. We have experienced increased sales activity in the last two years from larger retail customerswith annual sales in excess of $5 billion that we expect will continue to contribute to our revenue in future periods. We believe our strategy ofexpanding our product portfolio and increasing the scalability of our products has been the key element in attracting larger retail customers,and we believe that it has resulted in a steady pattern of new customers licensing multiple products, as well as enhanced back-sellingopportunities in our install base.
In April 2002 we acquired certain intellectual property of J � Commerce Inc. (�J � Commerce�), a privately held Canadian corporation,for a total cost of $4.2 million, which includes the purchase price of $4.0 million plus $185,000 in direct costs of the acquisition. J �Commerce developed point-of-sale software solutions based on Java� technology. We are developing a Portfolio Point of Sales applicationthat combines the J � Commerce point-of-sale software technology with our Internet-based Store Portal application to provide acomplimentary product strategy with Win/ DSS for larger retail customers that have annual sales in excess of $5 billion and/or a large numberof stores and/or registers per store. The acquisition, which is not material to our financial position or operating results, was accounted for as apurchase and accordingly, the operating results of J � Commerce have been included in our consolidated financial statements from the date ofacquisition. In connection with the J � Commerce acquisition, we expensed $800,000 of purchased in-process research and development insecond quarter 2002, and recorded approximately $1.3 million of goodwill in our In-Store Systems reporting unit, and $2.1 million ofdeveloped software technology.
We Lowered Our Consulting Services Revenue Outlook. Consulting services revenue, including the reclassification of reimbursedexpenses, decreased 7% in 2002 compared to 2001. Excluding the impact of owning E3 for eight more months in 2002 than in 2001,consulting services revenues including the reclassification of reimbursed expenses, decreased 15%, in 2002 compared to 2001 primarily due toa decrease in demand for the implementation of Portfolio Merchandise Management Systems and other large projects. Consulting servicesrevenue typically lags the sale of software licenses by as much as one year. In addition, we believe the average implementation times for oursoftware products have declined due to increased training and expertise in our consulting organization, and as a direct result of the investmentswe have made over the past few years to increase the functionality, stability, scalability, integration and ease of implementation of theproducts in the JDA Portfolio. Furthermore, in 2002 more of the demand for our products was associated with our Strategic MerchandiseManagement Solutions that require lower levels of services to implement. As a result of these changes in our business and product revenuemix, our consulting services revenue has declined sequentially in each of the last four quarters and we expect consulting services revenue andmargins to continue to decline until the demand for
Copyright © 2012 www.secdatabase.com. All Rights Reserved.Please Consider the Environment Before Printing This Document

19
Copyright © 2012 www.secdatabase.com. All Rights Reserved.Please Consider the Environment Before Printing This Document

Table of Contents
Portfolio Merchandise Management Systems and the related implementation services returns, or until economic conditions improve.
Consulting services margins in 2002 were 25%, which is flat compared to 2001. Lower utilization in 2002 was offset by lower incentivecompensation payments and higher average billing rates compared to 2001. The lower utilization rates in 2002 resulted from deterioratingeconomic conditions that have decreased the overall demand for our services, the decrease in demand for Portfolio MerchandiseManagement Systems and other high dollar projects, as well as improved integration and reduced implementation timeframes for products inthe JDA Portfolio. During second quarter 2002 we reduced our consulting services headcount by approximately 10% in order to stem thedecline in our utilization rates, consulting margins and overall profitability with the lower consulting services revenue outlook for 2002.During fourth quarter 2002, we further reduced our consulting services headcount by another 10% in connection with our reorganization andrestructuring of the Company (See �We Recorded Restructuring Charges to Reorganize our Company and to Re-align Our Cost Structure�).
Strong Financial Position and Operating Cash Flow. We continue to maintain a strong financial position with $101.9 million in cash,cash equivalents and marketable securities, and no debt. In addition, during 2002 we generated $41.5 million in positive cash flow fromoperations.
We Recorded Restructuring Charges to Reorganize our Company and to Re-Align Our Cost Structure. We consistently monitor theimpact of the economic environment on the outlook for demand for our products and services, and make adjustments to our workforce asnecessary to maintain overall profitability. In second quarter 2002, we recorded a $1.3 million restructuring charge for a workforce reductionof 53 full-time employees, primarily in the consulting services function in the Americas and Europe. All employees potentially impacted bythis restructuring were notified of the plan of termination and the related benefits on or before June 30, 2002.
In fourth quarter 2002, we recorded another restructuring charge of $5.0 million for termination and office closure costs associated withthe reorganization of the Company to implement the CVP initiative. The implementation of CVP will allow us to reallocate our resources inresponse to a fundamental shift in the way we develop product and bring it to market, as well as to changes in the demand for the varioustypes of products we sell, the length of implementation efforts required and associated skill requirements. In addition, the related workforcereduction will enable us to better align our cost structure during the current economic downturn, which has adversely impacted our revenues,elongated our selling cycles, and delayed, suspended or reduced the demand for certain of our products. The reorganization will result in theconsolidation of nearly all product development activities at our corporate headquarters, a workforce reduction of approximately 230 full-timeemployees (�FTE�) and certain office closures. The workforce reduction includes certain employees involved in product development (73FTE) and client support services (28 FTE) who choose not to relocate, and reductions in consulting services personnel (66 FTE), sales andmarketing personnel (37 FTE), and administrative functions (26 FTE). We currently expect to hire replacements for approximately 34 FTE inproduct development and client support services to replace those individuals who choose not to relocate to our corporate headquarters. Weexpect to reduce our annual fixed operating costs by approximately $10 million to $12 million through this reorganization and restructuringeffort. All employees potentially impacted by this reorganization initiative were notified of the plan of termination and the related benefits onor before December 31, 2002. Office closure costs pertain to certain US, Latin America, and European offices that were either under-performing or became redundant with the relocation initiatives.
We also incurred $452,000 in costs through December 31, 2002, in connection with CVP, to relocate certain product development andclient support services employees based in offices around the United States and the United Kingdom to our corporate headquarters, and weexpect to incur an additional $1.7 million to $1.8 million in relocation costs during 2003 to complete this consolidation. The relocation costswill be reported in income from continuing operations as they are incurred.
Critical Accounting Policies
We have identified the policies below as critical to our business operations and the understanding of our results of operations. The impactand any associated risks related to these policies on our business operations is discussed throughout Management�s Discussion and Analysisof Financial Condition and Results of Operations where such policies affect our reported and expected financial results. The preparation ofthis Annual Report on Form 10-K requires us to make estimates and assumptions that affect the reported amount of assets and liabilities,disclosure of contingent assets
Copyright © 2012 www.secdatabase.com. All Rights Reserved.Please Consider the Environment Before Printing This Document

20
Copyright © 2012 www.secdatabase.com. All Rights Reserved.Please Consider the Environment Before Printing This Document

Table of Contents
and liabilities at the date of our financial statements, and the reported amounts of revenue and expenses during the reporting period. There canbe no assurance that actual results will not differ from those estimates.
�
Revenue recognition. Our revenue recognition policy is significant because our revenue is a key component of our results of operations.In addition, our revenue recognition determines the timing of certain expenses such as commissions and royalties. We follow specificand detailed guidelines in measuring revenue; however, certain judgments affect the application of our revenue policy.
We license software under non-cancelable agreements and provide related services, including consulting, training and customer support.We recognize revenue in accordance with Statement of Position 97-2 (�SOP 97-2�), Software Revenue Recognition, as amended andinterpreted by Statement of Position 98-9, Modification of SOP 97-2, Software Revenue Recognition, with respect to certaintransactions, as well as Technical Practice Aids issued from time to time by the American Institute of Certified Public Accountants. Weadopted Staff Accounting Bulletin No. 101 (�SAB 101�), Revenue Recognition in Financial Statements, during first quarter 2000. SAB101 provides further interpretive guidance for public companies on the recognition, presentation, and disclosure of revenue in financialstatements. The adoption of SAB 101 did not have a material impact on our licensing or revenue recognition practices.
Software license revenue is recognized when a license agreement has been signed, the software product has been delivered, there are nouncertainties surrounding product acceptance, the fees are fixed and determinable, and collection is considered probable. If a softwarelicense contains an undelivered element, the vendor-specific objective evidence (�VSOE�) of fair value of the undelivered element isdeferred and the revenue recognized once the element is delivered. The undelivered elements are primarily training, consulting andmaintenance services. VSOE of fair value for training and consulting services is based upon standard hourly rates charged when thoseservices are sold separately. VSOE of fair value for maintenance is the price the customer will be required to pay when it is soldseparately (that is, the renewal rate). In addition, if a software license contains customer acceptance criteria or a cancellation right, thesoftware revenue is recognized upon the earlier of customer acceptance or the expiration of the acceptance period or cancellation right.Payments for our software licenses are typically due in installments within twelve months from the date of delivery. Althoughinfrequent, where software license agreements call for payment terms of twelve months or more from the date of delivery, revenue isrecognized as payments become due and all other conditions for revenue recognition have been satisfied.
Consulting and training services are separately priced, are generally available from a number of suppliers, and are not essential to thefunctionality of our software products. Consulting services, which include project management, system planning, design andimplementation, customer configurations, and training are billed on both an hourly basis and under fixed price contracts. Consultingservices revenue billed on an hourly basis is recognized as the work is performed. Training revenues are recognized when the training isprovided and is included in consulting revenues in the Company�s consolidated statements of income. Under fixed price contracts,consulting services revenue is recognized using the percentage of completion method of accounting by relating hours incurred to date tototal estimated hours at completion.
We have from time to time provided software and consulting services under fixed price contracts that require the achievement of certainmilestones and payment terms in these contracts are generally tied to customer acceptance of the milestones. The revenue under sucharrangements is recognized as the milestones are achieved or upon customer acceptance. We believe that milestones are a propermeasure of progress under these contracts, as the milestones approximate the percentage of completion method of accounting.
Customer support services include post contract support and the rights to unspecified upgrades and enhancements. Maintenancerevenues from ongoing customer support services are billed on a monthly basis and recorded as revenue in the applicable month, or onan annual basis with the revenue being deferred and recognized ratably over the maintenance period.
If an arrangement includes multiple elements, the fees are allocated to the various elements based upon VSOE of fair value, as describedabove.
�Accounts Receivable. Consistent with industry practice and to be competitive in the retail software marketplace, we typically provideinstallment payment terms on most software license sales. Software licenses are generally due
Copyright © 2012 www.secdatabase.com. All Rights Reserved.Please Consider the Environment Before Printing This Document

21
Copyright © 2012 www.secdatabase.com. All Rights Reserved.Please Consider the Environment Before Printing This Document

Table of Contents
in installments within twelve months from the date of delivery. All significant customers are reviewed for creditworthiness before theCompany licenses its software and we do not sell our software or recognize any license revenue unless we believe that collection isprobable in accordance with the requirements of paragraph 8 in SOP 97-2. We have a history of collecting software payments when theycome due without providing refunds or concessions. Consulting services are billed bi-weekly and maintenance services are billedannually or monthly. If a customer becomes significantly delinquent or its credit deteriorates, we put the accounts on hold and do notrecognize any further services revenue (and in most cases we withdraw support and/or our implementation staff) until the situation hasbeen resolved.
We do not have significant billing or collection problems. Although infrequent and unpredictable, from time to time certain of ourcustomers have filed bankruptcy and we have been required to refund the pre-petition amounts collected and settle for less than the facevalue of its remaining receivable pursuant to a bankruptcy court order. In these situations, as soon as it becomes probable that the netrealizable value of the receivable is impaired, we provide reserves on the receivable. In addition, we monitor economic conditions in thevarious geographic regions in which it operates to determine if general reserves or adjustments to its credit policy in a region areappropriate for deteriorating conditions that may impact the net realizable value of our receivables.
�
Intangible Assets. Our business combinations typically result in goodwill and other intangible assets, which affects the amount of futureperiod amortization expense and possible impairment expense that we will incur. The determination of the value of such intangibleassets and annual assessments for impairment requires management to make estimates of future revenues, customer retention rates andother assumptions that affect our consolidated financial statements.
�
Income Taxes. Our income tax policy records the estimated future tax effects of temporary differences between the tax basis of assetsand liabilities and amounts reported in the consolidated balance sheets, as well as operating loss and tax credit carry-forwards. Wefollow specific and detailed guidelines regarding the recoverability of any tax assets recorded on the balance sheet and provide anynecessary allowances as required.
�
Stock-Based Compensation. We do not record compensation expense for options granted to our employees as all options granted underour stock option plans have an exercise price equal to the market value of the underlying common stock on the date of grant. Aspermitted under Statement of Financial Accounting Standards No. 123, Accounting for Stock-Based Compensation (�SFAS No. 123�),we have elected to continue to apply the provisions of Accounting Principles Board Opinion No. 25, Accounting for Stock Issued toEmployees, and provide pro forma disclosure on an annual basis of net income (loss) and net income (loss) per common share foremployee stock option grants made as if the fair-value method defined in SFAS No. 123 had been applied.
Recent Accounting Pronouncements
We adopted Statement of Financial Accounting Standards No. 141, Business Combinations (�SFAS No. 141�) effective January 1, 2002.In addition to requiring that the purchase method of accounting be used for all business combinations initiated after June 30, 2001, SFASNo. 141 also provides guidance on the types of acquired intangible assets that are to be recognized and reported separately from goodwill. Wereclassified the unamortized balance of our assembled workforce asset of approximately $905,000 to goodwill on January 1, 2002 pursuant tocertain transitional provisions of SFAS No. 141 that apply to the business combinations we completed and accounted for under the purchasemethod prior to July 1, 2001.
We also adopted Statement of Financial Accounting Standards No. 142, Goodwill and Other Intangible Assets (�SFAS No. 142�)effective January 1, 2002. SFAS No. 142 addresses how intangible assets should be accounted for after they have been initially recognized inthe financial statements. SFAS No. 142 also requires that goodwill and certain other intangible assets with indefinite useful lives no longer beamortized, but instead be tested for impairment at least annually. Upon adoption, we ceased amortization of goodwill and certain otherintangible assets we recorded in business combinations prior to June 30, 2001. The application of the non-amortization provisions of SFASNo. 142 reduced amortization expense by approximately $3.8 million in 2002, increasing net income by approximately $2.5 million.
Copyright © 2012 www.secdatabase.com. All Rights Reserved.Please Consider the Environment Before Printing This Document

During the year ended December 31, 2002 we recorded $1.3 million in goodwill in connection with our acquisition of certain intellectualproperty of J � Commerce Inc. We also recorded an additional $3.3 million in goodwill during 2002 as a
22
Copyright © 2012 www.secdatabase.com. All Rights Reserved.Please Consider the Environment Before Printing This Document

Table of Contents
result of certain final adjustments made to the estimated fair values of assets acquired and liabilities assumed in the acquisition of E3 inSeptember 2001 and a reduction in the amount of deferred tax asset recorded on this transaction to reflect our revised estimate of theanticipated future tax benefits from acquisition costs incurred and research and development credits. No goodwill was impaired or written-offduring the year ended December 31, 2002. As of December 31, 2002, goodwill has been allocated to our reporting units as follows:$42.1 million to Retail Enterprise Systems, $1.3 million to In-Store Systems, and $16.4 million to Collaborative Solutions.
SFAS No. 142 required that we test goodwill for impairment as of January 1, 2002 and any resulting impairment charge be reflected as acumulative effect of a change in accounting principle. We completed the initial test for goodwill impairment during the three-month periodended March 31, 2002 and completed our annual test for goodwill impairment during fourth quarter 2002. We found no indication ofimpairment of the goodwill allocated to the individual reporting units. Accordingly, absent future indications of impairment, the next annualimpairment test will be performed in fourth quarter 2003.
We reassessed the useful lives of intangible assets other than goodwill during the three-month period ended March 31, 2002 and duringfourth quarter 2002. Except for trademarks, no adjustments have been made to the useful lives of our intangible assets. Substantially all of ourcapitalized trademarks were acquired in connection with the acquisition of E3. We do not believe the expected useful life of the E3 trademarksis directly tied to another asset or group of assets; however, we did acquire software technology and customer lists in connection with the E3acquisition. Although the underlying software technology and customer install-base may change and evolve over time, we intend toindefinitely develop next generation products under the E3 trademark. Beginning January 1, 2002, we assigned indefinite useful lives to ourE3 trademarks, and ceased amortization, as we believe there are no legal, regulatory, contractual, competitive, economic, or other factors thatwould limit the useful life of our trademarks and we expect the trademarks to contribute to our cash flows indefinitely. In accordance withSFAS No. 142, we completed an initial impairment test on trademarks during the three-month period ended March 31, 2002 and our annualtest for impairment during fourth quarter 2002. We found no indication of impairment during the year ended December 31, 2002.Accordingly, absent future indications of impairment, the next annual impairment test will be performed in fourth quarter 2003.
In fourth quarter 2002, we reviewed the customer attrition rates for each significant acquired customer group to ensure that the rate ofattrition is not increasing and that revisions to our estimates of life expectancy for our customer lists are not required.
We adopted Statement of Financial Accounting Standards No. 144, Accounting for the Impairment or Disposal of Long-Lived Assets(�SFAS No. 144�) effective January 1, 2002. SFAS No. 144 addresses financial accounting and reporting for the impairment or disposal oflong-lived assets, and supersedes Statement of Financial Accounting Standards No. 121, Accounting of the Impairment of Long-Lived Assetsand for Long-Lived Assets to be Disposed Of. SFAS No. 144 requires that we evaluate long-lived assets based on the net future cash flowexpected to be generated from the asset on an undiscounted basis whenever significant events or changes in circumstances occur that indicatethat the carrying amount of an asset may not be recoverable. The adoption of SFAS No. 144 did not have a significant impact on our operatingresults or financial position.
In June 2002, the Financial Accounting Standards Board issued Statement of Financial Accounting Standards No. 146, Accounting forCosts Associated with Exit or Disposal Activities (�SFAS No. 146�). The provisions of SFAS No. 146 are effective for exit or disposalactivities that are initiated after December 31, 2002. SFAS No. 146 was adopted effective January 1, 2003. SFAS No. 146 addresses financialaccounting and reporting for costs associated with exit or disposal activities and nullifies Emerging Issues Task Force Issue No. 94-3 (�EITFNo. 94-3�), Liability Recognition for Certain Employee Termination Benefits and Other Costs to Exit an Activity (including Certain CostsIncurred in a Restructuring). Under SFAS No. 146, the liability for costs associated with exit or disposal activities is recognized and measuredinitially at fair value only when the liability is incurred, rather than at the date the Company committed to the exit plan. We recordedrestructuring, asset disposition, and other merger related charges in the second and fourth quarters of 2002, and in 2001 and 2000, using theauthoritative guidance in EITF No. 94-3.
In December 2002, the Financial Accounting Standards Board issued Statement of Financial Accounting Standards No. 148, Accountingfor Stock-Based Compensation � Transition and Disclosure (�SFAS No. 148) which is effective for fiscal years ending after December 15,2002. SFAS No. 148 amends SFAS No. 123 to provide alternative methods of transition to SFAS No. 123�s fair value method of accountingfor stock-based employee compensation if a company elects
Copyright © 2012 www.secdatabase.com. All Rights Reserved.Please Consider the Environment Before Printing This Document

23
Copyright © 2012 www.secdatabase.com. All Rights Reserved.Please Consider the Environment Before Printing This Document

Table of Contents
to account for its equity awards under this method. SFAS No. 148 also amends the disclosure provisions of SFAS No. 123 and APB OpinionNo. 28, Interim Financial Reporting, to require disclosure of the effects of an entity�s accounting policy with respect to stock-based employeecompensation on reported net income and earnings per share in both annual and interim financial statements. We will provide the comparativeinterim pro forma disclosures required by SFAS No. 148 beginning in first quarter 2003. We are currently evaluating which method oftransition to fair value accounting we will elect.
We adopted Financial Accounting Standards Board Emerging Issues Task Force Issue No. 01-14 (�EITF No. 01-14�), Income StatementCharacterization of Reimbursements Received for Out-of-Pocket Expenses Incurred effective January 1, 2002. EITF No. 01-14 requires thereclassification of reimbursed expenses in both service revenues and cost of service revenues in our consolidated statements of income. Wepreviously netted reimbursed expenses in the cost of services. The adoption of EITF No. 01-14 did not impact our total gross profit oroperating income, but it did increase service revenues and cost of service revenues, and as a result, slightly reduces our gross profit marginand operating margin percentages. Reimbursed expenses of $7.7 million have been classified in both service revenues and cost of servicerevenues for the year ended December 31, 2002, and we have reclassified reimbursed expenses of $6.9 million and $7.0 million to servicerevenues and cost of service revenues in the consolidated statements of income for the years ended December 31, 2001 and 2000, respectively.
In November 2002, the Financial Accounting Standards Board issued FASB Interpretation No. 45 (�FIN 45�), �Guarantor�s Accountingsand Disclosure Requirements for Guarantees, Including Indirect Guarantees of the Indebtedness of Others,� which clarifies the requirement ofSFAS No. 5, �Accounting for Contingencies,� relating to a guarantor�s accounting for and disclosures of certain guarantee issues. We do notprovide direct or indirect guarantees of the indebtedness of others.
In January 2003, the Financial Accounting Standards Board issued FASB Interpretation No. 46 (�FIN 46�), �Consolidation of VariableInterest Entities.� Variable interest entities are defined as entities with a level of invested equity that is not sufficient to fund future activitiesto permit it to operate on a stand alone basis. We do not participate in variable interest entities.
24
Copyright © 2012 www.secdatabase.com. All Rights Reserved.Please Consider the Environment Before Printing This Document

Table of Contents
Results of Operations
The following table sets forth certain selected financial information expressed as a percentage of total revenues for the periods indicatedand certain gross margin data expressed as a percentage of software licenses, maintenance services, product revenues or consulting services, asappropriate:
Year Ended
December 31,
2002 2001 2000
REVENUES:Software licenses 31 % 33 % 35 %Maintenance services 26 19 17
Product revenues 57 52 52Consulting services 40 45 44Reimbursed expenses 3 3 4
Service revenues 43 48 48Total revenues 100 100 100
COST OF REVENUES:Cost of software licenses 1 1 2Amortization of acquired software technology 2 2 1Cost of maintenance services 7 5 4
Cost of product revenues 10 8 7Cost of consulting services 29 33 36Reimbursed expenses 3 3 4
Cost of service revenues 32 36 40Total cost of revenues 42 44 47
GROSS PROFIT 58 56 53OPERATING EXPENSES:Product development 19 16 16Sales and marketing 18 18 16General and administrative 12 13 12Amortization of intangibles 2 2 3Purchased in-process research and development � 1 �
Restructuring, asset disposition and other merger related charges 3 � �
Relocation costs to consolidate development and support activities � � �
Total operating expenses 54 50 47
OPERATING INCOME 4 6 6Other income, net 1 1 2
INCOME BEFORE INCOME TAXES 5 7 8
Copyright © 2012 www.secdatabase.com. All Rights Reserved.Please Consider the Environment Before Printing This Document

Income tax (benefit) provision 1 2 3
NET INCOME 4 % 5 % 5 %
Gross margin on software licenses 97 % 97 % 95 %Gross margin on maintenance services 75 % 72 % 75 %Gross margin on product revenues 83 % 85 % 87 %Gross margin on service revenues 25 % 25 % 16 %
25
Copyright © 2012 www.secdatabase.com. All Rights Reserved.Please Consider the Environment Before Printing This Document

Table of Contents
Year Ended December 31, 2002 Compared to Year Ended December 31, 2001
Revenues consist of product revenues and services revenue, which represented 57% and 43%, respectively, of total revenues in 2002compared to 52% and 48%, respectively in 2001. Total revenues for 2002 were $219.5 million, an increase of $5.6 million, or 3%, over the$213.8 million reported in 2001. Excluding the impact of owning E3 for eight more months in 2002 than in 2001, product revenues,consulting services revenues, and total revenues decreased 8%, 15% and 11%, respectively in 2002 compared to 2001.
Product Revenues
Software Licenses. Software license revenues for 2002 decreased 6% to $66.6 million from $71.2 million in 2001. Excluding the impactof owning E3 for eight more months in 2002 than in 2001, software license revenues decreased 23% in 2002 compared to 2001. The retailindustry appears to remain cautious with their level of investment in information technology during the current difficult economic cycle,perhaps due to poor macroeconomic conditions, and uncertainty related to the threat of future terrorist attacks and a US war with Iraq. Inaddition, subsequent to the September 11 attack and the ensuing deterioration in economic conditions, we believe retailers changed theirbuying behavior and this resulted in a fundamental shift in the mix of demand for the various types of products we sell away from high dollarprojects toward lower cost point solutions. Software license revenues in the Retail Enterprise Systems business segment, excluding the impactof owning E3 for eight more months in 2002 than in 2001, decreased 28% in 2002 compared to 2001. In-Store Systems software licenserevenues decreased 24% in 2002 compared to 2001. Collaborative Solutions software license revenues, excluding the impact of owning E3 foreight more months in 2002 than in 2001, decreased 2% in 2002 compared to 2001.
Software license revenues in the Americas decreased 20% in 2002 compared to 2001. Excluding the impact of owning E3 for eight moremonths in 2002 than in 2001, software license revenues in the Americas decreased 35% in 2002 compared to 2001. This decrease resultsprimarily from a 44% decrease in software license revenues related to Retail Enterprise Systems and a 57% decrease in In-Store Systemsapplications, offset in part by a 37% increase in software license revenues from our Collaborative Solutions products. Software licenserevenues in Europe increased 42% in 2002 compared to 2001. Excluding the impact of owning E3 for eight more months in 2002 than in2001, software license revenues in Europe increased 14% in 2002 compared to 2001. Software license revenues in Asia/ Pacific decreased 7%in 2002 compared to 2001. Excluding the impact of owning E3 for eight more months in 2002 than in 2001, software license revenues in Asia/Pacific decreased 10% in 2002 compared to 2001.
Maintenance Services. Maintenance services revenue for 2002 increased 42% to $57.6 million from $40.6 million in 2001. Excluding theimpact of owning E3 for eight more months in 2002 than in 2001, maintenance services revenue increased 19% in 2002 compared to 2001 dueto increases in the install base for our other product lines.
Consulting Services
Consulting services revenue, including the reclassification of reimbursed expenses, decreased 7% in 2002 to $95.3 million from$102.0 million in 2001. Excluding the impact of owning E3 for eight more months in 2002 than in 2001, consulting services revenuedecreased 15% in 2002 compared to 2001, primarily due to a decrease in demand for the implementation of Portfolio MerchandiseManagement Systems and other large projects. Consulting services revenue typically lags the sale of software licenses by as much as oneyear. In addition, we believe the average implementation times for our software products have declined due to increased training and expertisein our consulting organization, and as a direct result of the investments we have made over the past few years to increase the functionality,stability, scalability, integration and ease of implementation of the products in the JDA Portfolio. Furthermore, in 2002 more of the demandfor our products was associated with our analytic and optimization products that require lower levels of services to implement. As a result ofthese changes in our business and product revenue mix, our consulting services revenue has declined sequentially in each of the last fourquarters and we expect consulting services revenue and margins to continue to decline until the demand for Portfolio MerchandiseManagement Systems and the related implementation services returns, or until economic conditions improve.
26
Copyright © 2012 www.secdatabase.com. All Rights Reserved.Please Consider the Environment Before Printing This Document

Table of Contents
Business Segment Revenues
Total revenues in our Retail Enterprise Systems business segment decreased 7% to $151.1 million in 2002 from $162.3 million in 2001.Excluding the impact of owning E3 for eight more months in 2002 than in 2001, total revenues in this business segment decreased 17% in2002 compared to 2001, primarily due to a decline in demand for Portfolio Merchandise Management Systems. Sales of PortfolioMerchandise Management Systems tend to be more heavily impacted during slow economic periods, as retailers are often reluctant to makesubstantial investments due to the slower expected return on investment. In addition, these products typically have longer implementation timeframes and our services group often performs the implementation services. As a result, the decline in software sales for these products is alsohaving a negative impact on our consulting services revenue. The Retail Enterprise Systems business segment represented 69% of our totalrevenues in 2002 compared to 76% in 2001.
Total revenues in our In-Store Systems business segment decreased 6% to $25.5 million in 2002 from $27.1 million in 2001, primarilydue to a 9% decrease in Win/ DSS revenues, offset in part by a 64% increase in revenues from the Store Portal application. In-Store Systemssuch as Win/ DSS tend to be heavily impacted during slower economic periods, as the implementation of a new point-of-sale system usuallyrequires a substantial hardware investment. The In-Store Systems business segment represented 12% of total revenues in 2002 compared to13% in 2001.
Total revenues in our Collaborative Solutions business segment increased 75% to $42.9 million in 2002 from $24.5 million 2001.Excluding the impact of owning E3 for eight more months in 2002 than in 2001, total revenues in this business segment increased 24% in2002 compared to 2001 primarily due to an increase in Portfolio Space Management revenues from non-retail customers. The CollaborativeSolutions business segment represented 20% of total revenues in 2002 compared to 11% in 2001.
Geographic Revenues
Total revenues in the Americas (includes the United States, Canada and Latin America) decreased 1% to $142.2 million in 2002 from$143.7 million in 2001. Excluding the impact of owning E3 for eight more months in 2002 than in 2001, total revenues in this regiondecreased 15% in 2002 compared to 2001, due to a 35% decrease in software license revenues and a 13% decrease in consulting servicesrevenues, offset in part by an 18% increase in maintenance services revenue.
Total revenues in Europe increased 26% to $59.6 million in 2002 from $47.3 million in 2001. Excluding the impact of owning E3 foreight more months in 2002 than in 2001, total revenues in this region increased 7% in 2002 compared to 2001 due to a 14% increase insoftware license revenues and a 14% increase in maintenance services revenue, offset in part by a 2% decrease in consulting services revenue.
Total revenues in Asia/ Pacific decreased 14% to $21.4 million in 2002 from $24.8 million in 2001. Excluding the impact of owning E3for eight more months in 2002 compared to 2001, total revenues in this region decreased 15% in 2002 compared to 2001 due to a 10%decrease in software license revenues and a 26% decrease in consulting services revenue primarily due to decreases in revenues from certainlarge projects in Australia and Japan, offset in part by a 47% increase in maintenance services revenue.
Cost of Product Revenues
Cost of Software Licenses. Cost of software licenses was $2.0 million, or 3% of software license revenues in 2002 compared to$2.4 million, or 3% of software license revenues in 2001. The decrease in cost of software licenses dollars results from the lower volume ofsoftware products sold in 2002 that incorporate functionality from third party software providers and require the payment of royalties.
Amortization of Acquired Software Technology. Amortization of acquired software technology was $4.2 million in 2002 compared to$3.0 million in 2002. The increase results primarily from eight more months of amortization in 2002 of software technology acquired with E3in September 2001.
Copyright © 2012 www.secdatabase.com. All Rights Reserved.Please Consider the Environment Before Printing This Document

Cost of Maintenance Services. Cost of maintenance services increased 28% to $14.3 million, or 25% of maintenance services revenue, in2002 from $11.2 million, or 27% of maintenance services revenue, in 2001. The increase results primarily from the acquisition of E3 inSeptember 2001 and the additional headcount in the customer support function to
27
Copyright © 2012 www.secdatabase.com. All Rights Reserved.Please Consider the Environment Before Printing This Document

Table of Contents
support our growing installed client base, offset in part by lower incentive compensation costs. At December 31, 2002, we had 132 employeesin the customer support function.
Cost of Services
Cost of services decreased 7% to $71.5 million in 2002 from $76.9 million in 2001. This decrease results primarily from a 7% decrease inaverage consulting services headcount and lower incentive compensation costs in 2002 compared to 2001, offset in part by higher travel andtraining costs. At December 31, 2002, we had 468 employees in the consulting services function.
Gross Profit
Gross profit for 2002 increased 6% to $127.4 million, or 58% of total revenues, from $120.5 million, or 56% of total revenues in 2001.The increase in gross profit dollars and gross margin percentage results primarily from the 3% increase in total revenues and the higher mix ofproduct revenues as a percentage of total revenues in 2002 compared to 2001. Software licenses and maintenance services revenue havehigher margins than service revenues. Consulting services margins, which include the reclassification of reimbursed expenses in both servicerevenues and cost of service revenues, remained flat at 25% in 2002 compared to 2001 as the impact of the decrease in average consultingservices headcount, lower incentive compensation costs and higher average billing rates in 2002 compared to 2001 were offset by lowerutilization rates. The lower utilization rates in 2002 are a result of deteriorating economic conditions that have decreased the demand for ourservices, particularly from Portfolio Merchandise Management Systems implementations and other large projects, together with improvedintegration and shorter implementation timeframes of the products in the JDA Portfolio. During second quarter 2002 we reduced ourconsulting services headcount by approximately 10% in order to stem the decline in our utilization rates, consulting margins and overallprofitability with the lower consulting services revenue outlook for 2002. During fourth quarter 2002 we reduced our consulting servicesheadcount by another 10% in connection with our reorganization and restructuring of the Company (See �We Recorded RestructuringCharges to Reorganize our Company and to Re-align Our Cost Structure�). However, we do not expect any significant improvements in ourconsulting margins until the second half of 2003, and that is dependent to a large extent, upon the return of demand for our PortfolioMerchandise Management Systems.
Operating Expenses
Operating expenses, excluding amortization of intangibles, purchased in-process research and development, restructuring, assetdisposition, and other merger related charges, and relocation costs increased 9% to $108.7 million, or 50% of total revenues, in 2002 from$99.5 million, or 47% of total revenues in 2001. Overall, our cost structure increased in 2002 compared to 2001 due to an 11% increase inaverage headcount and a $2.6 million increase in employee-related costs, due primarily to the full-time employees added in connection withthe acquisitions of E3 in September 2001, NeoVista in June 2001, and J � Commerce in April 2002; $2.5 million in higher travel costs due toincreasing airfares and more full-time employees; and $2.8 million in higher occupancy costs due to increased space from the E3, NeoVistaand J � Commerce acquisitions.
Product Development. Product development expenses for 2002 increased 22% to $41.8 million from $34.4 million in 2001. Productdevelopment expense as a percentage of product revenues was 34% in 2002 compared to 31% in 2001. The increase in product developmentexpense results primarily from the cost of full-time employees added in connection with the acquisitions of E3 in September 2001, NeoVistain June 2001, and J � Commerce in April 2002, and the addition of full-time employees involved in the ongoing enhancement of the JDAPortfolio and the development of further CPFR applications, offset in part by lower incentive compensation costs. We expect our expendituresin product development in 2003 to remain consistent with the levels of 2002. We also believe development of our software is essentiallycompleted concurrent with the establishment of technological feasibility, and accordingly, no costs have been capitalized. At December 31,2002, we had 351 employees in the product development function.
Sales and Marketing. Sales and marketing expenses for 2002 increased 5% to $39.9 million from $38 million in 2001. Sales andmarketing expense as a percentage of total revenues was 18% in 2002, which is comparable to 2001. The increase in sales and marketingexpenses results from an increase in quota carrying sales representatives, due primarily to
Copyright © 2012 www.secdatabase.com. All Rights Reserved.Please Consider the Environment Before Printing This Document

28
Copyright © 2012 www.secdatabase.com. All Rights Reserved.Please Consider the Environment Before Printing This Document

Table of Contents
the acquisition of E3 in September 2001, and higher marketing and travel costs, offset in part by lower commissions and related benefits. AtDecember 31, 2002, we had 143 employees in the sales and marketing function.
General and Administrative. General and administrative expenses for 2002 were $27 million, which is flat compared to 2001. General andadministrative expense, as a percentage of total revenues, was 12% in 2002 compared to 13% in 2001. General and administrative expensewas flat due to an increase as a result of the acquisition of E3 in September 2001, additional full-time employees and outside contractorsinvolved in the development and maintenance of our internal information systems, and higher legal, accounting, insurance and travel costs dueto prevailing economic conditions, offset by lower incentive compensation costs and a $2.0 million lower bad debt expense.
Amortization of Intangibles. Amortization of intangibles was $2.8 million in 2002 compared to $5.5 million in 2001. The non-amortization provisions of SFAS No. 142 for goodwill and trademarks with indefinite useful lives reduced amortization expense byapproximately $3.8 million in 2002, however, this was offset in part by new amortization related to the acquisitions of NeoVista in June 2001and E3 in September 2001.
Purchased In-process Research and Development. We expensed $800,000 of purchased in-process research and development in 2002 inconnection with the acquisition of J � Commerce in April 2002. We expensed $2.4 million of purchased in-process research and developmentin 2001 in connection with the acquisitions of Zapotec in February 2001 ($161,000) and E3 in September 2001 ($2.2 million).
Restructuring, Asset Disposition and Other Merger Related Charges. We consistently monitor the impact of the economic environmenton the outlook for demand for our products and services, and make adjustments to our workforce as necessary to maintain overall profitability.In second quarter 2002, we recorded a $1.3 million restructuring charge for a workforce reduction of 53 full-time employees, primarily in theconsulting services function in the Americas and Europe. All employees potentially impacted by this restructuring were notified of the plan oftermination and the related benefits on or before June 30, 2002.
In fourth quarter 2002, we recorded another restructuring charge of $5.0 million for termination and office closure costs associated withthe reorganization of the Company to implement the CVP initiative. The implementation of CVP will allow us to reallocate our resources inresponse to a fundamental shift in the way we develop product and bring it to market, as well as to changes in the demand for the varioustypes of products we sell, the length of implementation efforts required and associated skill requirements. In addition, the related workforcereduction will enable us to better align our cost structure during the current economic downturn, which has adversely impacted our revenues,elongated our selling cycles, and delayed, suspended or reduced the demand for certain of our products. The reorganization will result in theconsolidation of nearly all product development activities at our corporate headquarters, a workforce reduction of approximately 230 full-timeemployees (�FTE�) and certain office closures. The workforce reduction includes certain employees involved in product development (73FTE) and client support services (28 FTE) who choose not to relocate, and reductions in consulting services personnel (66 FTE), sales andmarketing personnel (37 FTE), and administrative functions (26 FTE). We currently expect to hire replacements for approximately 34 FTE inproduct development and client support services to replace those individuals who choose not to relocate to our corporate headquarters. Weexpect to reduce our annual fixed operating costs by approximately $10 million to $12 million through this reorganization and restructuringeffort. All employees potentially impacted by this reorganization initiative were notified of the plan of termination and the related benefits onor before December 31, 2002. Office closure costs pertain to certain US, Latin America, and European offices that were either under-performing or became redundant with the relocation initiatives.
We recorded restructuring, asset disposition and other merger related charges of $749,000 in first quarter 2001 and an additional $236,000in fourth quarter 2001 for JDA employees made redundant in the E3 acquisition. These restructuring initiatives involved a workforcereduction of 41 full-time employees in certain implementation service groups, product development activities, sales and marketing, andadministrative functions in the United States, Europe, Canada and Latin America. All workforce reductions associated with these charges weremade on or before March 31, 2001 or December 31, 2001, as appropriate. The first quarter 2001 charges also include other merger relatedcharges of $208,000 for the write-off of certain merger and acquisition costs related to a potential acquisition that was abandoned.
Copyright © 2012 www.secdatabase.com. All Rights Reserved.Please Consider the Environment Before Printing This Document

Relocation Costs to Consolidate Development and Support Activities. We incurred $452,000 in costs through December 31, 2002, inconnection with CVP, to relocate certain product development and client support services employees based in offices around the United Statesand the United Kingdom to our corporate headquarters, and we
29
Copyright © 2012 www.secdatabase.com. All Rights Reserved.Please Consider the Environment Before Printing This Document

Table of Contents
expect to incur an additional $1.7 million to $1.8 million in relocation costs during 2003 to complete this consolidation. The relocation costswill be reported in income from continuing operations as they are incurred.
Operating Income
Operating income decreased 32% to $8.3 million in 2002 from $12.1 million in 2001. The decrease in operating income results fromdecreases in software licenses and service revenues of 6% and 7%, respectively in 2002 compared to 2001, a $5.3 million increase inrestructuring charges, and a $9.2 million, or 9% increase in operating expenses, excluding amortization of intangibles, purchased in-processresearch and development, restructuring charges, asset disposition and other merger related charges, and relocation costs, offset in part by a42% increase in maintenance services revenue, a $1.4 million decrease in amortization of acquired software technology and other intangibles,and a $1.6 million decrease in purchased in-process research and development costs.
Operating income in our Retail Enterprise Systems business segment decreased 15% to $29.8 million in 2002 from $34.9 million in 2001.The decrease results from lower total software and services revenues and increases in product development costs and costs of maintenanceservices in this business segment in 2002 compared to 2001, offset in part by higher maintenance services revenue and decreases in sales andmarketing costs and costs of consulting services due to reduced headcounts and lower incentive compensation.
Operating income in our In-Store Systems business segment decreased 3% to $5.3 million in 2002 from $5.5 million in 2001. Thedecrease results form lower software and services revenues, and increases in product development costs and costs of maintenance services inthis business segment in 2002 compared to 2001, offset in part by higher maintenance services revenue and decreases sales and marketingcosts and costs of services due to reduced headcounts and lower incentive compensation.
Operating income in our Collaborative Solutions business segment increased 37% to $10.5 million in 2002 from $7.6 million in 2001.The increase results primarily from increases in software license sales, maintenance services and consulting services revenues, offset in partby increases in sales and marketing and product development costs to support our new CPFR initiatives.
Provision for Income Taxes
The provision for income taxes was $1,036,000, or 10.4% of income before income taxes in 2002 compared to $5,101,000, or 34.6% in2001. During 2002, we recognized a benefit of $1,919,000 that related primarily to the resolution of an audit by the Inland Revenue of ourUnited Kingdom subsidiaries for the years 1997 through 2000, and a tentative settlement in the United States of an income tax examination bythe Internal Revenue Service of our 1998 and 1999 federal income tax returns. In the tentative settlement, the Internal Revenue Service agreedto allow the Company to take a research and development expense tax credit for most of the qualifying expenses originally reported in theCompany�s corporate income tax returns for those years. Our effective income tax rate takes into account the source of taxable income,domestically by state and internationally by country, and available income tax credits. The provisions for income taxes for 2002 and 2001 donot include the tax benefits realized from employee stock options exercised during these years of $5,770,000, net of a $1,024,000 valuationallowance, and $907,000, respectively. These tax benefits reduce our income tax liabilities and are included as an increase to additional paid-in capital.
During 2002, we established a valuation allowance of $3,481,000 on foreign tax credit carryovers because we have been operating in anexcess credit position. We charged $1,024,000 of this valuation allowance to additional paid-in capital due to the potential loss of foreign taxcredits from the exercise of employee stock options. We feel it is more likely than not that foreign tax credits will not be realized. If, in thefuture, the Company determines that it is able to utilize the foreign tax credits, a portion of the valuation allowance reversal will be recorded toadditional paid-in capital.
Year Ended December 31, 2001 Compared to Year Ended December 31, 2000
Revenues
Copyright © 2012 www.secdatabase.com. All Rights Reserved.Please Consider the Environment Before Printing This Document

Revenues consist of product revenues and consulting services revenue, which represented 52% and 48%, respectively, of total revenues in2001 and 2000. Total revenues for 2001 were $213.8 million, an increase of $35.1 million, or 20%, over the $178.7 million reported in 2000.The 2001 results include $17.8 million in incremental revenues from the acquisition
30
Copyright © 2012 www.secdatabase.com. All Rights Reserved.Please Consider the Environment Before Printing This Document
Table of Contents
of E3 on September 7, 2001, and an $8.3 million impact from owning Intactix for three more months in 2001 compared to 2000. Intactix wasacquired in April 2000. Excluding these factors, product revenues decreased 3% and consulting services revenues and total revenues increased13% and 5%, respectively in 2001 compared to 2000.
Product Revenues
Software Licenses. Software license revenues for 2001 increased 14% to $71.2 million from $62.6 million in 2000. The results for 2001include $10.8 million in incremental software license revenues from the acquisition of E3, and a $4.0 million impact from owning Intactix forthree more months in 2001 compared to 2000. Excluding the impact of these factors, software license revenues decreased 10% in 2001compared to 2000. Weakening economic conditions and the September 11 attack adversely impacted sales during 2001. In addition, webelieve mid-tier retailers may have been reluctant during the economic slowdown to make the substantial investment in new hardware thatusually accompanies the implementation of a new point-of-sale system due to the slower expected return on total investment. StrategicMerchandise Management Solutions such as Portfolio Replenishment, Portfolio Space Management and Intellect appear to have beenless affected by the economic slowdown as they can enable our customers to lower their inventory levels and provide a quicker return oninvestment than products in other categories. Software license revenues represented 33% of total revenues in 2001 compared to 35% in 2000.
Software license revenues in the Americas increased 41% in 2001 compared to 2000. Excluding the favorable impact of incrementalrevenues from the acquisition of E3 and three more months of ownership of the Intactix product line, software license revenues in theAmericas increased 13% in 2001 compared to 2000 due primarily to an increase in sales of the PMM application. We believe this increasereflected an increase in demand for packaged merchandising systems by larger, more complex retailers requiring the functionality andscalability of a UNIX/ Oracle solution, particularly in the grocery and convenience store sector of the retail market. Software license revenuesin Europe increased 15% in 2001 compared to 2001. Excluding the favorable impact of incremental revenues from the acquisition of E3 andthree more months of ownership of the Intactix product line, software license revenues in Europe decreased 24% in 2001 compared to 2000.Software license revenues in Asia/ Pacific decreased 52% in 2001 compared to 2000. Excluding the favorable impact of incremental revenuesfrom the acquisition of E3 and three more months of ownership of the Intactix product line, software license revenues decreased 54% in 2001compared to 2000. We reported record results in the Asia/ Pacific region in 2000 due primarily to sales of Retail Enterprise Systems to largerretail customers with annual sales in excess of $5 billion in Australia and Japan.
Maintenance Services. Maintenance services revenues for 2001 increased 34% to $40.6 million from $30.4 million in 2000. The resultsfor 2001 include the favorable impact of $3.8 million in incremental maintenance services revenues from the acquisition of E3, the$2.8 million impact from owning Intactix for three more months in 2001 compared to 2000, and an increase in maintenance revenues resultingfrom a larger software license install base in all of our product lines. Maintenance services revenues represented 19% of total revenues in 2001compared to 17% in 2000.
Consulting Services
Consulting services revenues, including the reclassification of reimbursed expenses, increased 19% in 2001 to $102.0 million from$85.7 million in 2000. The results for 2001 include the favorable impact of $3.2 million in incremental consulting services revenues from theacquisition of E3, and an increase in consulting services revenues resulting primarily from the increase in new PMM software licenses salesduring 2000 and 2001. Consulting services revenue typically lags the sale of software licenses by as much as one year. Consulting servicesrevenues represented 48% of total revenues in both 2001 and 2000.
Business Segment Revenues
Total revenues in our Retail Enterprise Systems business segment increased 18% to $162.3 million in 2001 from $137.1 million in 2000.The results for 2001 include the favorable impact of $13.8 million in incremental revenues from the acquisition of E3 and the $2.8 millionimpact from owning Intactix for three more months in 2001 compared to 2000. Excluding the favorable impact of these factors, total revenues
Copyright © 2012 www.secdatabase.com. All Rights Reserved.Please Consider the Environment Before Printing This Document

in this segment increased 6% in 2001 compared to 2000. Revenues from our Portfolio Merchandise Management Systems increased 10% in2001 compared to 2000 due to a 39% increase in revenues related to PMM, offset in part by a 12% decrease in revenues related to MMS. Webelieve the
31
Copyright © 2012 www.secdatabase.com. All Rights Reserved.Please Consider the Environment Before Printing This Document

Table of Contents
increase in PMM revenues reflected an increase in demand for packaged merchandising systems by larger, more complex retailers requiringthe functionality and scalability of a UNIX/ Oracle solution, particularly in the grocery and convenience store section of the retail market.MMS software license revenues for 2001 decreased 44% compared to 2000. We believe the market for the MMS application has been moreheavily affected by the slower economic conditions, particularly in our international regions. Revenues from our Strategic MerchandiseManagement Solutions increased 41% in 2001 compared to 2000. Excluding the favorable impact of incremental revenues from theacquisition of E3 and the additional quarter of ownership of the Intactix product line, revenues from Strategic Merchandise ManagementSolutions increased 6% in 2001 compared to 2000. We believe demand for Strategic Merchandise Management Solutions such asPortfolio Replenishment, Portfolio Space Management, and Intellect appeared to be less affected by the economic slowdown as they canenable our customers to lower their inventory levels and provide a quicker return on investment than products in other categories. The RetailEnterprise Systems business segment represented 76% of our total revenues in 2001 compared to 77% in 2000.
Total revenues in our In-Store Systems business segment were flat at $27.0 million in 2001 compared to 2000. Software license revenuesin this business segment decreased 28% in 2001 compared to 2000, offset by increases in maintenance and consulting services revenues of53% and 10%, respectively. Weakening economic conditions adversely impacted sales of In-Store Systems during 2001. We believe mid-tierretailers may have been reluctant during the economic slowdown to make the substantial investment in new hardware that usuallyaccompanies the implementation of a new point of sale system due to the slower expected return on total investment. Maintenance servicesrevenues increased in 2001 compared to 2000 as a result of our increased software license install base. Consulting services revenues increasedin 2001 compared to 2000 due to the increase in new software license sales we experienced during 2000. The In-Store Systems businesssegment represented 13% of total revenues in 2001 compared to 15% in 2000.
Total revenues in our Collaborative Solutions business segment increased 68% to $24.5 million in 2001 from $14.6 million in 2000. Theresults for 2001 include the favorable impact of $4.0 million in incremental revenues from the acquisition of E3 and the $5.5 million impactfrom owning Intactix for three more months in 2001 compared to 2000. Excluding the favorable impact of these factors, total revenues in thisbusiness segment increased 2% in 2001 compared to 2000. We believe the wholesale and manufacturing markets were negatively impacted bythe economic slowdown. The Collaborative Solutions business segment represented 11% of total revenues in 2001 compared to 8% in 2000.
Geographic Revenues
Total revenues in the Americas (includes the United States, Canada and Latin America) increased 28% to $143.7 million in 2001 from$111.9 million in 2000. The results for 2001 include the favorable impact of $11.7 million in incremental revenues from the acquisition of E3and the $5.3 million impact from owning Intactix for three more months in 2001 compared to 2000. Excluding the favorable impact of thesefactors, total revenues in this region increased 13% in 2001 compared to 2000. Software license, maintenance services and consulting servicesrevenues related to Retail Enterprise Systems increased in this region in 2001 compared to 2000.
Total revenues in Europe increased 19% to $47.3 million in 2001 from $39.9 million in 2000. The results for 2001 include the favorableimpact of $6.0 million in incremental revenues from the acquisition of E3 and the $2.7 million impact from owning Intactix for three moremonths in 2001 compared to 2000. Excluding the favorable impact of these factors, total revenues in this region decreased 3% in 2001compared to 2000. Retail Enterprise Systems consulting revenues, and software license sales and maintenance services revenues related toCollaborative Solutions increased in this region in 2001 compared to 2000.
Total revenues in Asia/ Pacific decreased 15% to $24.8 million in 2001 from $29.2 million in 2000. The results for 2001 include thefavorable impact of $165,000 in incremental revenues from the acquisition of E3 and the $299,000 impact from owning Intactix for threemore months in 2001 compared to 2000. Excluding the favorable impact of these factors, total revenues in this region decreased 17% in 2001compared to 2000. Software license revenues decreased in all business segments in 2001 compared to 2000, offset in part by increasedmaintenance and consulting services revenues related to ongoing Retail Enterprise Systems implementations in Australia and Japan. During2001 we experienced significant decreases in total revenues in Australia and Japan compared to 2000. We reported record results in the Asia/Pacific region in 2000 due primarily to sales of Retail Enterprise Systems to larger retail customers with annual sales in excess of $5 billion inAustralia and Japan.
Copyright © 2012 www.secdatabase.com. All Rights Reserved.Please Consider the Environment Before Printing This Document

32
Copyright © 2012 www.secdatabase.com. All Rights Reserved.Please Consider the Environment Before Printing This Document

Table of Contents
Cost of Product Revenues
Cost of Software Licenses. Cost of software licenses was $2.4 million, or 3% of software license revenues in 2001 compared to$2.9 million, or 5% of software license revenues in 2000. The decrease results from fewer software products, as a percentage of total softwaresales, sold in 2001 that incorporate functionality from third party software providers and require the payment of royalties.
Amortization of Acquired Software Technology. Amortization of acquired software technology was $3.0 million in 2001 compared to$1.8 million in 2002. The increase results primarily from an increase in amortization on software technology acquired from E3 in September2001.
Cost of Maintenance Services. Cost of maintenance services increased 46% to $11.2 million, or 28% of maintenance services revenues, in2001 from $7.7 million, or 25% of maintenance services revenues, in 2000. The increase results from the cost of full-time employees added inconnection with the acquisition of E3 in September 2001 and the addition of headcount in the customer support function during 2001 tosupport our growing installed client base.
Cost of Consulting Services
Cost of consulting services, including the reclassification of reimbursed expenses, increased 7% to $76.9 million in 2001 from$72.0 million in 2000. The increase results in part from the cost of full-time employees added in connection with the acquisition of E3 inSeptember 2001. In addition, we added full-time employees to our consulting services group in 2001 compared to 2000 to support theincreased demand for consulting services resulting from increased sales of new software licenses during 2000. Our consulting servicesheadcount increased 6% in 2001 compared to 2000 and as of December 31, 2001 there were 588 individuals involved in this function. We alsoincurred higher costs for outside contractors in the Asia/ Pacific region during 2001, and higher travel and training costs.
Gross Profit
Gross profit for 2001 increased 28% to $120.5 million, or 56% of total revenues, from $94.3 million, or 53% of total revenues, in 2000.This increase results from an $8.6 million, or 14%, increase in software license revenues, a $10.2 million, or 34%, increase in maintenanceservices revenues, and a $16.3 million, or 19%, increase in consulting services, including the reclassification of reimbursed expenses, togetherwith higher consulting margins. Consulting services margins increased to 25% in 2001 compared to 16% in 2000 primarily as a result ofimproved utilization rates due to the realignment of resources within the consulting services organization to reflect changes in product andgeographic demands.
Operating Expenses
Operating expenses, excluding amortization of intangibles, purchased in-process research and development and restructuring, assetdisposition, and other merger related charges, increased 27% to $99.5 million, or 47% of total revenues, in 2001 from $78.4 million, or 44%of total revenues, in 2000.
Product Development. Product development expenses for 2001 increased 19% to $34.4 million from $28.8 million in 2000. Productdevelopment expense as a percentage of total revenues was 16% in both 2001 and 2000. The increase in product development expense resultsprimarily from the cost of full-time employees added in connection with the acquisitions of Zapotec in February 2001, NeoVista in June 2001and E3 in September 2001, and the additional quarter of product development expense related owning Intactix for three more months in 2001compared to 2000. Our product development headcount increased 29% in 2001 compared to 2000, and as of December 31, 2001 there were328 individuals involved in this function. We believe that with the current breadth of our product suite, we can continue to effectively develop
Copyright © 2012 www.secdatabase.com. All Rights Reserved.Please Consider the Environment Before Printing This Document

and market new value-added products with our existing capacity, absent further product acquisitions. We also believe development of oursoftware is essentially completed concurrent with the establishment of technological feasibility, and accordingly, no costs have beencapitalized.
Sales and Marketing. Sales and marketing expenses for 2001 increased 32% to $38.0 million from $28.8 million in 2000. Sales andmarketing expense as a percentage of total revenues was 18% in 2001 compared to 16% in 2000. The increase in sales and marketingexpenses results primarily from a 16% increase in quota carrying sales representatives, higher commissions as a percentage of software licenserevenues, and higher average travel costs due in part to the
33
Copyright © 2012 www.secdatabase.com. All Rights Reserved.Please Consider the Environment Before Printing This Document

Table of Contents
acquisition of E3 in September 2001. Our sales and marketing headcount increased 23% in 2001 compared to 2000, and as of December 31,2001 there were 172 individuals involved in this function, including 93 quota carrying sales personnel compared to 80 at December 31, 2000.
General and Administrative. General and administrative expenses for 2001 increased 31% to $27.1 million from $20.8 million in 2000.General and administrative expense, as a percentage of total revenues, was 13% in 2001 compared to 12% in 2000. The increase in generaland administrative expense results from the acquisition of E3 in September 2001, additional full-time employees and outside contractorsinvolved in the development and maintenance of our internal information systems, and higher legal and bad debt costs. We increased ourprovision for bad debts 51% to $4.9 million in 2001 from $3.2 million in 2000, or 2% of total revenues in both years, due to an increase in thefrequency of bankruptcies in our customer base.
Amortization of Intangibles. Amortization of intangibles for 2001 increased 17% to $5.5 million from $4.7 million in 2000. The resultsfor 2001 include an additional quarter of amortization related to goodwill and other intangibles recorded in connection with the acquisition ofIntactix in April 2000 and new amortization related to the acquisitions of Zapotec in February 2001, NeoVista in June 2001 and E3 inSeptember 2001.
Purchased In-process Research and Development. During 2001, we expensed $161,000 of purchased in-process research anddevelopment in connection with the acquisition of Zapotec in February 2001, and $2.2 million in connection with the acquisition of E3 inSeptember 2001. We expensed $200,000 of purchased in-process research and development during 2000 in connection with the acquisition ofIntactix in April 2000.
Restructuring, Asset Disposition and Other Merger Related Charges. We recorded restructuring, asset disposition and other mergerrelated charges of $749,000 in first quarter 2001 and an additional $236,000 in fourth quarter 2001 for JDA employees made redundant in theE3 acquisition. These restructuring initiatives involved a workforce reduction of 41 full-time employees certain implementation servicegroups, product development activities, sales and marketing, and administrative functions in the Americas and Europe. All workforcereductions associated with these charges were made on or before March 31, 2001 or December 31, 2001, as appropriate. Included in theamounts above are other merger related charges of $208,000 that consist of the write-off of certain merger and acquisition costs related to apotential acquisition that was abandoned.
A restructuring and asset disposition charge of $828,000 was recorded during first quarter 2000. This restructuring initiative involved aworkforce reduction of 65 full-time employees in certain implementation service groups and administrative functions in the Americas andEurope. We believe this reduction helped stabilize service margins, optimized our labor resources in these geographic regions, and freed upfunds for investment in staff that support higher growth product lines, including Portfolio Planning and our e-commerce initiatives. Allworkforce reductions associated with this charge were made on or before March 31, 2000.
Operating Income
Operating income increased 18% to $12.1 million in 2001 from $10.2 million in 2000. Approximately $1.8 million of this increase resultsfrom the acquisition of E3 in September 2001.
Operating income in our Retail Enterprise Systems business segment increased 55% to $34.9 million in 2001 from $22.6 million in 2000.The increase results primarily from incremental increases in software licenses, maintenance and consulting services revenues from theacquisition of E3, additional revenue from owning Intactix for three more months in 2001 compared to 2000, and an increase in revenuesrelated to PMM, offset in part by an increase in sales and marketing expense.
Operating income in our In-Store Systems business segment decreased 38% to $5.5 million in 2001 from $8.8 million in 2000. Thedecrease results primarily from a 28% decrease in software license sales and an increase in product development expense for the Store Portalapplication, offset in part by increased maintenance and consulting services revenues.
Copyright © 2012 www.secdatabase.com. All Rights Reserved.Please Consider the Environment Before Printing This Document

Operating income in our Collaborative Solutions business segment increased 43% to $7.6 million in 2001 from $5.3 million in 2000. TheCollaborative Solutions business segment did not exist prior to second quarter 2000 and the increase in operating income in 2001 compared to2000 results primarily from incremental sales of software licenses,
34
Copyright © 2012 www.secdatabase.com. All Rights Reserved.Please Consider the Environment Before Printing This Document

Table of Contents
maintenance and consulting services from the acquisition of E3 in September 2001 and the impact of owning Intactix for three more months in2001 compared to 2000. The acquisitions of Intactix and E3 provided us with an additional client base of over 3,000 manufacturers andwholesalers and a new market for business-to-business collaborative planning between the retailers and their suppliers.
Provision for Income Taxes
Our effective income tax rate reflects statutory federal, state and foreign tax rates, partially offset by reductions for research anddevelopment expense tax credits. From time to time, we may be subjected to audit by federal, state and/or foreign taxing authorities. During2001 we reached an agreement with the IRS that settled the proposed adjustments from the audit of our 1997 and 1996 Federal Income TaxReturns. In the settlement, the IRS agreed to allow us to take a research and development expense tax credit for substantially all of thequalifying expenses originally reported in our corporate income tax returns for those years. We reduced the 2001 effective income tax ratefrom 37% to 34.6% by including current research and development expense tax credits that would not have been claimed prior to thesettlement.
Liquidity and Capital Resources
We had working capital of $121.0 million at December 31, 2002 compared with $93.1 million at December 31, 2001. Cash andmarketable securities at December 31, 2002 were $101.9 million, an increase of $37.9 million from the $64.0 million reported atDecember 31, 2001. Working capital and our cash and marketable securities balances increased in 2002 primarily as a result of cash providedby operating activities and the cash received from the issuance of common stock under our stock option and employee stock purchase plans.
Operating activities provided cash of $41.5 million and $29.4 million in 2002 and 2001, respectively. The $12.1 million increase in cashprovided from operating activities in 2002 compared to 2001 results primarily from $4.9 million higher tax benefits from the exercise of stockoptions and shares purchased under the employee stock purchase plan, and an $11.3 million decrease in accounts receivable in 2002 comparedto $7.1 million increase in 2001. These improvements were partially offset by a $2.0 million lower provision for doubtful accounts,$1.3 million lower depreciation and amortization, and $7.4 million lower deferred income taxes. Our net receivables were $47.1 million, or79 days sales outstanding (�DSOs�) at December 31, 2002 compared to $60.9 million, or 91 DSOs at December 31, 2001. Collection ofreceivables continues to be an area of focus during these tentative economic times. DSOs may fluctuate significantly on a quarterly basis dueto a number of factors including seasonality, shifts in customer buying patterns, lengthened contractual payment terms in response tocompetitive pressures, the underlying mix of products and services, and the geographic concentration of revenues.
Investing activities utilized cash of $38.9 million and $35.6 million in 2002 and 2001, respectively. Cash utilized by investing activities in2002 results primarily from the net purchase of $18.6 million of marketable securities, the payment of $8.6 million in direct costs related tothe acquisition of E3, a $4.2 million cash payment for the acquisition of J � Commerce, and $8.3 million in capital expenditures. Cash utilizedby investing activities in 2001 includes $24.5 million in cash payments for the acquisitions of Zapotec, NeoVista, and E3, $6.8 million incapital expenditures, the payment of $6.0 million in direct costs related to the acquisition of E3, and the issuance of a $3.5 million promissorynote receivable, offset in part by the net maturity of $3.7 million of marketable securities.
Financing activities provided cash of $15.4 million in 2002 and utilized cash of $1.6 million in 2001. The activity in both periods includesproceeds from the issuance of common stock under our stock option and employee stock purchase plans. In addition, the activity for 2002includes the repurchase of 100,000 shares of our outstanding stock for $1.1 million, primarily under the stock repurchase program authorizedby our Board of Directors in July 2002. The activity for 2001 also includes the repurchase of 76,500 shares of our outstanding stock for$875,000 under the stock repurchase program authorized by our Board of Directors in October 2000, and the payoff of $8.2 million inborrowings under lines of credit, notes payable, and long-term debt assumed in connection with the acquisition of E3.
Changes in the currency exchange rates of our foreign operations had the effect of increasing cash by $1.2 million in 2002 and reducingcash by $1.1 million in 2001. We currently have no derivative instruments and did not engage in any material foreign currency hedgingtransactions in 2002 or 2001.
Copyright © 2012 www.secdatabase.com. All Rights Reserved.Please Consider the Environment Before Printing This Document

35
Copyright © 2012 www.secdatabase.com. All Rights Reserved.Please Consider the Environment Before Printing This Document

Table of Contents
We believe there are opportunities to grow our business through the acquisition of complementary and synergistic companies, productsand technologies. We look for acquisitions that can be readily integrated and accretive to earnings, although we may pursue smaller non-accretive acquisitions that will shorten our time to market with new technologies. We believe the general size of cash acquisitions we wouldcurrently consider to be in the $5 million to $30 million range. Any material acquisition could result in a decrease to our working capitaldepending on the amount, timing and nature of the consideration to be paid. In addition, any material acquisitions of complementary orsynergistic companies, products or technologies could require that we obtain additional equity financing. There can be no assurance that suchadditional financing will be available or that, if available, such financing will be obtained on terms favorable to us and would not result inadditional dilution to our stockholders.
In July 2002, our Board of Directors authorized the repurchase of up to two million shares of our outstanding common stock. Under thisrepurchase program, we may periodically repurchase common shares during a one-year period ending July 22, 2003 on the open market atprevailing market prices. As of December 31, 2002, we have repurchased a total of 100,000 shares of our common stock for $1.1 millionunder this program. Our Board of Directors previously authorized a stock repurchase program in October 2000 for the purchase of up to twomillion shares of our outstanding common stock over a one-year period that ended October 21, 2001. We purchased a total of 239,000 sharesunder this program during 2000 and 2001.
We believe that our cash and cash equivalents, investments in marketable securities, and funds generated from operations will provideadequate liquidity to meet our normal operating requirements for at least the next twelve months.
FACTORS THAT MAY AFFECT OUR FUTURE RESULTS OR
THE MARKET PRICE OF OUR STOCK
We operate in a dynamic and rapidly changing environment that involves numerous risks and uncertainties. The following sectiondescribes some, but not all, of these risks and uncertainties that we believe may adversely affect our business, financial condition or results ofoperations. This section should be read in conjunction with the audited Consolidated Financial Statements and Notes thereto, andManagement�s Discussion and Analysis of Financial Condition and Results of Operations for the years ended December 31, 2002, 2001 and2000 contained elsewhere in this Form 10-K.
Regional And/ Or Global Changes in Economic, Political And Market Conditions Could Cause Decreases in Demand For OurSoftware And Related Services Which Could Negatively Affect Our Revenue And Operating Results And The Market Price of OurStock.
Our revenue and profitability depend on the overall demand for our software and related services. A regional and/or global change in theeconomy and financial markets could result in delay or cancellation of customer purchases. We and most of our competitors recentlyannounced that current economic conditions have negatively impacted financial results. In addition, recent developments associated withterrorist attacks on United States� interests and a potential war with Iraq have resulted in economic, political and other uncertainties, whichcould further adversely affect our revenue growth and operating results. If demand for our software and related services decrease, our revenueswould decrease and our operating results would be adversely affected. Our inability to license software products to new customers may causeour stock price to fall.
Our Quarterly Operating Results May Fluctuate Significantly, Which Could Adversely Affect the Price of Our Stock.
Our quarterly operating results have varied and are expected to continue to vary in the future. If our quarterly operating results fail to meetmanagement�s projections or analysts� expectations, the price of our stock could decline. Many factors may cause these fluctuations,including:
Copyright © 2012 www.secdatabase.com. All Rights Reserved.Please Consider the Environment Before Printing This Document

�Demand for our software products and services, including the size and timing of individual contracts and our ability to recognizerevenue with respect to contracts signed in the quarter, particularly with respect to our significant customers;
� Changes in the length of our sales cycle;
36
Copyright © 2012 www.secdatabase.com. All Rights Reserved.Please Consider the Environment Before Printing This Document

Table of Contents
� Competitive pricing pressures;
�Customer order deferrals resulting from the anticipation of new products, economic uncertainty, disappointing operating results by thecustomer, or otherwise;
�The timing of new software product introductions and enhancements to our software products or those of our competitors, and marketacceptance of our new software products;
� Changes in our operating expenses;
� Changes in the mix of domestic and international revenues, or expansion or contraction of international operations;
� Our ability to complete fixed price consulting contracts within budget;
� Foreign currency exchange rate fluctuations;
�Operational issues resulting from corporate reorganizations (see ��We May Encounter Difficulties Successfully Implementing OurRecent Corporate Reorganization��); and
�Lower-than-anticipated utilization in our consulting services group as a result of reduced levels of software sales, reducedimplementation times for our products, changes in the mix of demand for our software products, or other reasons.
Our Stock Price Has Been And May Remain Volatile.
The trading price of our common stock has in the past and may in the future be subject to wide fluctuations. Examples of factors that webelieve have caused fluctuations in our stock price in the recent past include the following:
�Cancelled or delayed purchasing decisions related to the September 11 terrorist attack and the uncertainty related to potential futureterrorist attacks or the threat of a US war with Iraq;
� The millennium change;
� Conversion to the Euro currency;
� External and internal marketing issues;
� Our announcement of our reduced visibility and increased uncertainty concerning future demand for our products;
� Increased competition;
� Elongated sales cycles;
� A limited number of reference accounts with implementations in the early years of product release;
� Certain design and stability issues in early versions of our products; and
� Lack of desired features and functionality.
Copyright © 2012 www.secdatabase.com. All Rights Reserved.Please Consider the Environment Before Printing This Document

In addition, fluctuations in the price of our common stock may expose us to the risk of securities class action lawsuits. Defending againstsuch lawsuits could result in substantial costs and divert management�s attention and resources. Furthermore, any settlement or adversedetermination of these lawsuits could subject us to significant liabilities.
Our Gross Margins May Vary Significantly or Decline.
Because the gross margins on product revenues (software licenses and maintenance services) are significantly greater than the grossmargins on consulting services revenue, our combined gross margin has fluctuated from quarter to quarter, and it may continue to fluctuatesignificantly based on revenue mix. Subsequent to the September 11 attack, we believe retailers have changed their buying behavior and thatthis has resulted in a fundamental shift in the mix of demand for the various types of products we sell. Demand for our PortfolioMerchandise Management Systems has declined and customers now appear to be more interested in buying Strategic MerchandiseManagement Solutions that require lower levels of services to implement, enable lower inventory levels without reducing sales, and providea quicker return on investment. The decline in software sales of Portfolio Merchandise Management Systems is having a corollary negative
37
Copyright © 2012 www.secdatabase.com. All Rights Reserved.Please Consider the Environment Before Printing This Document

Table of Contents
impact on our service revenues as consulting services revenue typically lags the performance of software revenues by as much as one year. Asa result of this change in revenue mix, we expect that our consulting services revenue will continue to decline sequentially each quarter untilthe demand for Portfolio Merchandise Management Systems and the related implementation services returns, or until underlying economicconditions improve. In addition, our gross margins on consulting services revenue vary significantly with the rates at which we utilize ourconsulting personnel, and as a result, our overall gross margins will be adversely affected when there is not enough work to keep ourconsultants busy.
We May Misjudge When Software Sales Will Be Realized.
Software license revenues in any quarter depend substantially upon contracts signed and the related shipment of software in that quarter.It is therefore difficult for us to accurately predict software license revenues. Because of the timing of our sales, we typically recognize thesubstantial majority of our software license revenues in the last weeks or days of the quarter, and we may derive a significant portion of ourquarterly software license revenues from a small number of relatively large sales. In addition, it is difficult to forecast the timing of largeindividual software license sales with a high degree of certainty due to the extended length of the sales cycle and the generally more complexcontractual terms that may be associated with such licenses that could result in the deferral of some or all of the revenue to future periods.Accordingly, large individual sales have sometimes occurred in quarters subsequent to when we anticipated. We expect these aspects of ourbusiness to continue. If we receive any significant cancellation or deferral of customer orders, or we are unable to conclude licensenegotiations by the end of a fiscal quarter, our operating results may be lower than anticipated. In addition, any weakening or uncertainty inthe economy may make it more difficult for us to predict quarterly results in the future, and could negatively impact our business, operatingresults and financial condition for an indefinite period of time.
We May Not Be Able to Reduce Expense Levels If Our Revenues Decline.
Our expense levels are based on our expectations of future revenues. Since software license sales are typically accompanied by asignificant amount of consulting and maintenance services, the size of our services organization must be managed to meet our anticipatedsoftware license revenues. As a result, we hire and train service personnel and incur research and development costs in advance of anticipatedsoftware license revenues. If software license revenues fall short of our expectations, or if we are unable to fully utilize our service personnel,our operating results are likely to decline because a significant portion of our expenses cannot be quickly reduced to respond to anyunexpected revenue shortfall.
We May Encounter Difficulties Successfully Implementing Our Recent Corporate Reorganization.
In fourth quarter 2002 we substantially reorganized our Company to improve the profitability of our operations and to implement ourCustomer Value Program initiative. As part of this reorganization, we terminated a significant number of personnel both domestically andinternationally, reassigned certain existing personnel and added a number of new personnel. We will likely encounter difficultiesimplementing this extensive and complex reorganization. Potential risks include, but are not limited to: (i) the possibility that we may not beable to successfully persuade enough key E3 and Arthur product development and support personnel to relocate to our corporate headquartersin Scottsdale, Arizona; (ii) the possible disruption in our operations caused by such a large and complex reorganization; (iii) the difficulty ofaccurately forecasting the timing, amount, and the nature of costs that we will incur in implementing the reorganization, particularlyinternational termination costs, which can be significantly higher than domestic termination costs; and (iv) the possibility that we will not beable to successfully recruit appropriately skilled and experienced personnel to fill new positions.
We Are Dependent Upon The Retail Industry.
Historically, we have derived 80% or more of our revenues from the license of software products and the performance of related servicesto retail customers. Although the acquisitions of Arthur, Intactix, Zapotec, NeoVista Decision Series and E3 have expanded our productofferings to provide collaborative applications that address new vertical market opportunities with the manufacturers and wholesalers whosupply our traditional retail customers, our future growth is critically dependent on increased sales to retail customers. The success of our
Copyright © 2012 www.secdatabase.com. All Rights Reserved.Please Consider the Environment Before Printing This Document

customers is directly linked to economic conditions in the retail industry, which in turn are subject to intense competitive pressures and areaffected by overall economic conditions. In addition, we believe that the licensing of certain of our software products involves a large capital
38
Copyright © 2012 www.secdatabase.com. All Rights Reserved.Please Consider the Environment Before Printing This Document

Table of Contents
expenditure, which is often accompanied by large-scale hardware purchases or other capital commitments. As a result, demand for ourproducts and services could decline in the event of instability or potential downturns.
We believe the retail industry remains cautious with their level of investment in information technology during the current difficulteconomic cycle, perhaps due to poor macroeconomic conditions, and uncertainty related to the threat of future terrorist attacks and of a USwar with Iraq. We remain concerned about weak and uncertain economic conditions, consolidations and the disappointing results of retailersin certain of our geographic regions. The retail industry will be negatively impacted if negative economic conditions or fear of additionalterrorists� attacks or the threat of a US war with Iraq persists for an extended period of time. Weak and uncertain economic conditions have inthe past, and may in the future, negatively impact our revenues, elongate our selling cycles, and delay, suspend or reduce the demand for ourproducts. As a result, it is difficult in the current economic environment to predict exactly when specific software licenses will close within asix to nine month time frame. In addition, weak and uncertain economic conditions could impair our customers� ability to pay for ourproducts or services. Any of these factors could adversely impact our business, quarterly or annual operating results and financial condition.
We also believe that the retail industry may be consolidating, and that the industry is currently experiencing increased competition incertain geographical regions that could negatively impact the industry and our customers� ability to pay for our products and services. Suchconsolidation has in the past, and may in the future, negatively impact our revenues, reduce the demand for our products and may negativelyimpact our business, operating results and financial condition.
There May Be An Increase in Customer Bankruptcies Due to Weak Economic Conditions.
We have in the past and may in the future be impacted by customer bankruptcies that occur in periods subsequent to the software licensesale. During weak economic conditions, such as those currently being experienced in many geographic regions around the world, there is anincreased risk that certain of our customers will file bankruptcy. When our customers file bankruptcy, we may be required to forego collectionof pre-petition amounts owed and to repay amounts remitted to us during the 90-day preference period preceding the filing. Accountsreceivable balances related to pre-petition amounts may in certain of these instances be large due to extended payment terms for softwarelicense fees, and significant billings for consulting and implementation services on large projects. The bankruptcy laws, as well as the specificcircumstances of each bankruptcy, may severely limit our ability to collect pre-petition amounts, and may force us to disgorge payments madeduring the 90-day preference period. We also face risk from international customers that file for bankruptcy protection in foreign jurisdictions,in that the application of foreign bankruptcy laws may be less certain or harder to predict. Although we believe that we have sufficientreserves to cover anticipated customer bankruptcies, there can be no assurance that such reserves will be adequate, and if they are notadequate, our business, operating results and financial condition would be adversely affected.
We May Have Difficulty Attracting And Retaining Skilled Personnel.
Our success is heavily dependent upon our ability to attract, hire, train, retain and motivate skilled personnel, including sales andmarketing representatives, qualified software engineers involved in ongoing product development, and consulting personnel who assist in theimplementation of our products and services. The market for such individuals is competitive. For example, it may be particularly difficult toattract and retain product development personnel experienced in the Microsoft .Net platform since the .Net platform is a new and evolvingtechnology. Given the critical roles of our sales, product development and consulting staffs, our inability to recruit successfully or anysignificant loss of key personnel would hurt us. A high level of employee mobility and aggressive recruiting of skilled personnel characterizethe software industry. We cannot guarantee that we will be able to retain our current personnel, attract and retain other highly qualifiedtechnical and managerial personnel in the future, or be able to assimilate the employees from any acquired businesses. We will continue toadjust the size and composition of the workforce in our services organization to match the different product and geographic demand cycles. Ifwe were unable to attract and retain the necessary technical and managerial personnel, or assimilate the employees from any acquiredbusinesses, our business, operating results and financial condition would be adversely affected.
39
Copyright © 2012 www.secdatabase.com. All Rights Reserved.Please Consider the Environment Before Printing This Document

Table of Contents
We Have Only Deployed Certain of Our Software Products On a Limited Basis, And Have Not Yet Deployed Some Software ProductsThat Are Important to Our Future Growth.
Certain of our software products, including MMS Multi-Channel, Store Portal, the UNIX/ Oracle version of the PortfolioReplenishment module Advanced Warehouse Replenishment by E3, and certain modules of Affinity and Intellect,have been commerciallyreleased within the last two years. Other modules of Affinity and Intellect, as well as the UNIX/ Oracle version of the PortfolioReplenishment module Advanced Store Replenishment by E3 and the point-of-sale product that we purchased from J � Commerce, are still inbeta or under development. In addition, we have only recently announced our intentions to develop or acquire a series of business-to-businesse-commerce solutions, including products in furtherance of our pursuit of the market for Collaborative Solutions. The markets for theseproducts are new and evolving, and we believe that retailers and their suppliers may be cautious in adopting web-based and other newtechnologies. Consequently, we cannot predict the growth rate, if any, and size of the markets for our e-commerce products or that thesemarkets will continue to develop. Potential and existing customers may find it difficult, or be unable, to successfully implement our e-commerce products, or may not purchase our products for a variety of reasons, including their inability or unwillingness to deploy sufficientinternal personnel and computing resources for a successful implementation. In addition, we must overcome significant obstacles tosuccessfully market our newer products, including limited experience of our sales and consulting personnel. If the markets for our newerproducts fail to develop, develop more slowly or differently than expected or become saturated with competitors, or if our products are notaccepted in the marketplace or are technically flawed, our business, operating results and financial condition will decline.
We Are Investing Heavily in Re-Writing Many of Our Products For The Microsoft.Net Platform.
We currently plan to migrate PMM and Store Portal, as well as starting to re-write the Portfolio Replenishment modules and PortfolioPlanning using the Microsoft .Net technology platform (�.Net Platform�) during 2003. The first .Net Platform products are not scheduled forcommercial release until the end of 2003. We also plan to develop new products as well as shared code components using the .Net Platform.The risks of our commitment to the .Net Platform include, but are not limited to, the following:
�The possibility that prospective customers will refrain from purchasing the current versions of products to be re-written because they arewaiting for the .Net Platform versions;
�The possibility that our .Net Platform beta customers will not become favorable reference sites; (iii) adequate scalability of the .NetPlatform for our largest customers;
� Adequate scalability of the .Net Platform for our largest customers;
� The ability of our development staff to learn how to efficiently and effectively develop products using the .Net Platform;
� Our ability to transition our installed base onto the .Net Platform when it is available;
�Microsoft�s ability to achieve market acceptance of the .Net platform; and
�Microsoft�s continued commitment to enhancing and marketing the .Net platform.
Despite efforts to mitigate the risks of the .Net Platform project, there can be no assurances that our efforts to re-write many of our currentproducts and to develop new products using the .Net Platform will be successful. If the .Net Platform project is not successful, it likely willhave a material adverse effect on our business, operating results and financial condition.
We May Introduce New Lines of Business Where We Are Less Experienced.
We may introduce new lines of business that are outside our traditional focus on software licenses and related maintenance andimplementation services. Introducing new lines of business involves a number of uncertainties, including a lack of internal resources and
Copyright © 2012 www.secdatabase.com. All Rights Reserved.Please Consider the Environment Before Printing This Document

expertise to operate and grow such new lines of business, immature internal processes and controls, inexperience predicting revenues andexpenses for the new lines of business, and the possibility that such new lines of business will divert management attention and resources fromour traditional business. The inability of management to effectively develop and operate these new lines of business could have a materialadverse effect on our
40
Copyright © 2012 www.secdatabase.com. All Rights Reserved.Please Consider the Environment Before Printing This Document
Table of Contents
business, operating results and financial condition. Moreover, we may not be able gain acceptance of any new lines of business in our markets,penetrate new markets successfully, or obtain the anticipated or desired benefits of such new lines of business.
There Are Many Risks Associated with International Operations.
Our international revenues represented 43% of total revenues in the year ended December 31, 2002 as compared to 44% and 48% in 2001and 2000, respectively. If our international operations grow, we must recruit and hire a number of new consulting, sales and marketing andsupport personnel in the countries in which we have or will establish offices. Our entry into new international markets typically requires theestablishment of new marketing and distribution channels as well as the development and subsequent support of localized versions of oursoftware. International introductions of our products often require a significant investment in advance of anticipated future revenues. Theopening of our new offices typically results in initial recruiting and training expenses and reduced labor efficiencies associated with theintroduction of products to a new market. If we are less successful in a new market than we expect, we may not be able to realize an adequatereturn on our initial investment and our operating results could suffer. We cannot guarantee that the countries in which we operate will have asufficient pool of qualified personnel from which to hire, that we will be successful at hiring, training or retaining such personnel, or that wecan expand or contract our international operations in a timely, cost effective manner.
Our international business operations are subject to risks associated with international activities, including:
� Currency fluctuations;
� Higher operating costs due to local laws or regulations;
� Unexpected changes in employment and other regulatory requirements;
� Tariffs and other trade barriers;
� Costs and risks of localizing products for foreign countries;
� Longer accounts receivable payment cycles in certain countries;
� Potentially negative tax consequences;
� Difficulties in staffing and managing geographically disparate operations;
� Greater difficulty in safeguarding intellectual property, licensing and other trade restrictions;
� Repatriation of earnings;
� The burdens of complying with a wide variety of foreign laws; and
� General economic conditions in international markets.
Consulting services in support of certain international software licenses typically have lower gross margins than those achieveddomestically due to generally lower billing rates and/or higher costs in certain of our international markets. Accordingly, any significantgrowth in our international operations may result in declines in gross margins on consulting services. We expect that an increasing portion ofour international software license, consulting services and maintenance services revenues will be denominated in foreign currencies,subjecting us to fluctuations in foreign currency exchange rates. As we continue to expand our international operations, exposures to gains andlosses on foreign currency transactions may increase. We may choose to limit such exposure by entering into forward foreign currencyexchange contracts or engaging in similar hedging strategies. We cannot guarantee that any currency exchange strategy would be successful in
Copyright © 2012 www.secdatabase.com. All Rights Reserved.Please Consider the Environment Before Printing This Document

avoiding exchange-related losses. In addition, revenues earned in various countries where we do business may be subject to taxation by morethan one jurisdiction, which would reduce our earnings.
We May Face Difficulties In Our Highly Competitive Markets, Particularly if The Current Weak Economic Conditions Persist.
The markets for our software products are highly competitive. However, we believe the number of significant competitors in many of ourapplication markets has diminished over the past five years. We believe the principal
41
Copyright © 2012 www.secdatabase.com. All Rights Reserved.Please Consider the Environment Before Printing This Document

Table of Contents
competitive factors in our markets are feature and functionality, product reputation and reference accounts, retail and supply chain industryexpertise, total solution cost and quality of customer support. We believe that pricing pressure has increased in response to the economicdownturn, which could cause us to offer more significant discounts, or in some cases to lose potential business to competitors willing to offerwhat we believe to be overly aggressive discounts. We encounter competitive products from a different set of vendors in each of our primaryproduct categories.
Our Retail Enterprise Systems compete complete primarily with Retek, Inc., and with internally developed systems and other third-partydevelopers such as Essentus, Inc., GERS, Inc., Marketmax, Inc., Micro Strategies Incorporated, Evant, Inc. (formerly Nonstop Solutions),NSB Retail Systems PLC, SAP AG, and SVI Holdings, Inc. In addition, new competitors may enter our markets and offer merchandisemanagement systems that target the retail industry.
The competition for our In-Store Systems is more fragmented than the competition for our Retail Enterprise Systems. We competeprimarily with small point-of-sale focused companies such as CRS Business Computers, Datavantage, Inc., 360 Commerce, TomaxTechnologies and Triversity, Inc. We also compete with other broad solution set providers such as NSB Retail Systems PLC and Retek, Inc.
Our current Collaborative Solutions compete primarily with products from Marketmax, Inc., Evant Inc. (formerly Nonstop Solutions),AC Nielsen Corporation, i2 Technologies, Manugistics Group, Inc., Information Resources, Inc., and Synchra Systems.
In the market for consulting services, we have pursued a strategy of forming informal working relationships with leading retail systemsintegrators such as Cap Gemini Ernst & Young, Kurt Salmon Associates and IBM Consulting Services (formerly PriceWaterhouseCoopers).These integrators, as well as independent consulting firms such as Accenture, IBM Global Services, AIG Netplex, CFT Consulting, LakewestConsulting, SPL and ID Applications, also represent competition to our consulting services group. Moreover, because many of theseconsulting firms are involved in advising our prospective customers in the software selection process, they may successfully encourage aprospective customer to select software from a software company with whom they have a relationship. Examples of such relationshipsbetween consulting firms and software companies include the relationships between Retek, Inc. and Accenture, and between Retek, Inc. andIBM Global Services.
As we continue to develop or acquire e-commerce products and expand our business in the Collaborative Solutions area, we expect toface potential competition from business-to-business e-commerce application providers, including Ariba, Commerce One, Commercialware,i2 Technologies, Manugistics Group, Inc., Microsoft, Inc., Retek, Inc., SAP AG, Synchra Systems, Ecometry Corporation, and others. A fewof our existing competitors, as well as a number of potential new competitors, have significantly greater financial, technical, marketing andother resources than we do, which could provide them with a significant competitive advantage over us. We cannot guarantee that we will beable to compete successfully against our current or future competitors, or that competition will not have a material adverse effect on ourbusiness, operating results and financial condition.
It May Be Difficult to Identify, Adopt And Develop Product Architecture That is Compatible With Emerging Industry Standards.
The markets for our software products are characterized by rapid technological change, evolving industry standards, changes in customerrequirements and frequent new product introductions and enhancements. If we fail in our product development efforts to accurately addressevolving industry standards or important third-party interfaces or product architectures, sales of our products and services will suffer.
Our software products can be licensed with a variety of popular industry standard platforms, and are authored in various developmentenvironments using different programming languages and underlying databases and architectures. There may be future or existing platformsthat achieve popularity in the marketplace that may not be compatible with our software product design. Developing and maintainingconsistent software product performance across various technology platforms could place a significant strain on our resources and softwareproduct release schedules, which could adversely affect our results of operations.
42
Copyright © 2012 www.secdatabase.com. All Rights Reserved.Please Consider the Environment Before Printing This Document

Table of Contents
We May Have Difficulty Implementing Our Products.
Our software products are complex and perform or directly affect mission-critical functions across many different functional andgeographic areas of the enterprise. Consequently, implementation of our software products can be a lengthy process, and commitment ofresources by our clients is subject to a number of significant risks over which we have little or no control. Although average implementationtimes have recently declined, we believe the implementation of the UNIX/ Oracle versions of our products can be longer and morecomplicated than our other applications as they typically (i) appeal to larger retailers who have multiple divisions requiring multipleimplementation projects, (ii) require the execution of implementation procedures in multiple layers of software, (iii) offer a retailer moredeployment options and other configuration choices, and (iv) may involve third party integrators to change business processes concurrent withthe implementation of the software. Delays in the implementations of any of our software products, whether by our business partners or us,may result in client dissatisfaction, disputes with our customers, or damage to our reputation. Significant problems implementing our softwaretherefore, can cause delays or prevent us from collecting license fees for our software and can damage our ability to get new business.
Our Fixed-Price Service Contracts May Result In Losses.
We offer a combination of software products, consulting and maintenance services to our customers. Typically, we enter into serviceagreements with our customers that provide for consulting services on a �time and expenses� basis. Certain clients have asked for, and wehave from time to time entered into, fixed-price service contracts, which link services payments, and occasionally software payments, toimplementation milestones. We believe fixed-price service contracts may increasingly be offered by our competitors to differentiate theirproduct and service offerings. As a result, we may need to enter into more fixed-price contracts in the future. If we are unable to meet ourcontractual obligations under fixed-price contracts within our estimated cost structure, our operating results could suffer.
Our Success Depends Upon Our Proprietary Technology.
Our success and competitive position is dependent in part upon our ability to develop and maintain the proprietary aspect of ourtechnology. The reverse engineering, unauthorized copying, or other misappropriation of our technology could enable third parties to benefitfrom our technology without paying for it.
We rely on a combination of trademark, trade secret, copyright law and contractual restrictions to protect the proprietary aspects of ourtechnology. We seek to protect the source code to our software, documentation and other written materials under trade secret and copyrightlaws. To date, we have not protected our technology with patents. Effective copyright and trade secret protection may be unavailable orlimited in certain foreign countries. We license our software products under signed license agreements that impose restrictions on thelicensee�s ability to utilize the software and do not permit the re-sale, sublicense or other transfer of the source code. Finally, we seek to avoiddisclosure of our intellectual property by requiring employees and independent consultants to execute confidentiality agreements with us andby restricting access to our source code.
There has been a substantial amount of litigation in the software and Internet industries regarding intellectual property rights. It is possiblethat in the future third parties may claim that our current or potential future software solutions or we infringe on their intellectual property. Weexpect that software product developers and providers of e-commerce products will increasingly be subject to infringement claims as thenumber of products and competitors in our industry segment grows and the functionality of products in different industry segments overlap.Moreover, as software patents become more common, the likelihood increases that a patent holder will bring an infringement action againstus, or against our customers, to whom we have indemnification obligations. In addition, we may find it necessary to initiate claims orlitigation against third parties for infringement of our proprietary rights or to protect our trade secrets. Since we now resell hardware we mayalso become subject to claims from third parties that the hardware, or the combination of hardware and software, infringe their intellectualproperty. Although we may disclaim certain intellectual property representations to our customers, these disclaimers may not be sufficient tofully protect us against such claims. We may be more vulnerable to patent claims since we do not have any patents that we can assertdefensively against a patent infringement claim. Any claims, with or without merit, could be time consuming, result in costly litigation, causeproduct shipment delays or require us to enter into royalty or license agreements. Royalty or licensing agreements, if required, may
Copyright © 2012 www.secdatabase.com. All Rights Reserved.Please Consider the Environment Before Printing This Document

43
Copyright © 2012 www.secdatabase.com. All Rights Reserved.Please Consider the Environment Before Printing This Document

Table of Contents
not be available on terms acceptable to us or at all, which could have a material adverse effect on our business, operating results and financialcondition.
If We Lose Access to Critical Third-Party Software or Technology, Our Costs Could Increase And The Introduction of New ProductsAnd Product Enhancements Could Be Delayed, Potentially Hurting Our Competitive Position.
We license and integrate technology from third parties in certain of our software products. For example, we license the Uniface client/server application development technology from Compuware, Inc. for use in PMM, certain applications from Silvon Software, Inc. for use inIDEAS, IBM�s Net.commerce merchant server software for use in MMS Multi-Channel, and the Syncsort application for use in PortfolioPlanning. These third party licenses generally require us to pay royalties and fulfill confidentiality obligations. If we are unable to continue tolicense any of this third party software, or if the third party licensors do not adequately maintain or update their products, we would facedelays in the releases of our software until equivalent technology can be identified, licensed or developed, and integrated into our softwareproducts. These delays, if they occur, could harm our business, operating results and financial condition. It is also possible that intellectualproperty acquired from third parties through acquisitions, mergers, licenses or otherwise may not have been adequately protected.
We May Face Liability If Our Products Are Defective Or If We Make Errors Implementing Our Products.
Our software products are highly complex and sophisticated. As a result, they may occasionally contain design defects or software errorsthat could be difficult to detect and correct. In addition, implementation of our products may involve customer-specific configuration by thirdparties or us, and may involve integration with systems developed by third parties. In particular, it is common for complex software programs,such as our UNIX/ Oracle and e-commerce software products, to contain undetected errors when first released. They are discovered only afterthe product has been implemented and used over time with different computer systems and in a variety of applications and environments.Despite extensive testing, we have in the past discovered certain defects or errors in our products or custom configurations only after oursoftware products have been used by many clients. In addition, our clients may occasionally experience difficulties integrating our productswith other hardware or software in their environment that are unrelated to defects in our products. Such defects, errors or difficulties maycause future delays in product introductions and shipments, result in increased costs and diversion of development resources, require designmodifications or impair customer satisfaction with our products.
We believe that significant investments in research and development are required to remain competitive, and that speed to market iscritical to our success. Our future performance will depend in large part on our ability to enhance our existing products through internaldevelopment and strategic partnering, internally develop new products which leverage both our existing customers and sales force, andstrategically acquire complementary retail point and collaborative solutions that add functionality for specific business processes to anenterprise-wide system. If clients experience significant problems with implementation of our products or are otherwise dissatisfied with theirfunctionality or performance or if they fail to achieve market acceptance for any reason, our business, operating results and financial conditionwould suffer.
We Are Dependent on Key Personnel.
Our performance depends in large part on the continued performance of our executive officers and other key employees, particularly theperformance and services of James D. Armstrong our Chief Executive Officer and Hamish N. Brewer our President. We do not have in place�key person� life insurance policies on any of our employees. The loss of the services of Mr. Armstrong, Mr. Brewer, or other key executiveofficers or employees without a successor in place could negatively affect our financial performance.
We May Have Difficulty Integrating Acquisitions.
We continually evaluate potential acquisitions of complementary businesses, products and technologies, including those that aresignificant in size and scope. In pursuit of our strategy to acquire complementary products, we completed the acquisition of the assets ofZapotec Software, Inc. in February 2001, and the NeoVista Decision Series from Accrue Software, Inc. in June 2001, and the acquisition of allthe common stock of E3 in September 2001. The E3 acquisition
Copyright © 2012 www.secdatabase.com. All Rights Reserved.Please Consider the Environment Before Printing This Document

44
Copyright © 2012 www.secdatabase.com. All Rights Reserved.Please Consider the Environment Before Printing This Document

Table of Contents
was our largest to date, and involves the integration of E3�s products and operations in 12 countries. In addition we acquired certainintellectual property from J � Commerce on April 12, 2002. The risks we commonly encounter in acquisitions include:
�We may have difficulty assimilating the operations and personnel of the acquired company;
�We may have difficulty effectively integrating the acquired technologies or products with our current products and technologies;
� Our ongoing business may be disrupted by transition and integration issues;
�We may not be able to retain key technical and managerial personnel from the acquired business;
�We may be unable to achieve the financial and strategic goals for the acquired and combined businesses;
�We may have difficulty in maintaining controls, procedures and policies during the transition and integration;
� Our relationships with partner companies or third-party providers of technology or products could be adversely affected;
� Our relationships with employees and customers could be impaired;
�Our due diligence process may fail to identify significant issues with product quality, product architecture, legal contingencies, andproduct development, among other things; and
�We may be required to sustain significant exit charges if products acquired in business combinations are unsuccessful.
It May Become Increasingly Expensive to Obtain And Maintain Liability Insurance at Current Levels.
We contract for insurance to cover a variety of potential risks and liabilities. In the current market, insurance coverage is becoming morerestrictive and expensive, and when certain insurance coverage is offered, the deductible for which we are responsible is larger. In light ofthese circumstances, it may become more difficult to maintain insurance coverage at historical levels, or if such coverage is available, the costto obtain or maintain it may increase substantially. This may result in our being forced to bear the burden of an increased portion of risks forwhich we have traditionally been covered by insurance, which could negatively impact the Company�s results of operations.
Item 7A. Quantitative and Qualitative Disclosures About Market Risks
We are exposed to certain market risks in the ordinary course of our business. These risks result primarily from changes in foreigncurrency exchange rates and interest rates. In addition, our international operations are subject to risks related to differing economicconditions, changes in political climate, differing tax structures, and other regulations and restrictions.
Foreign currency exchange rates. Our international operations expose us to foreign currency exchange rate changes that could impacttranslations of foreign denominated assets and liabilities into U.S. dollars and future earnings and cash flows from transactions denominated indifferent currencies. International revenues represented 43% of our total revenues in 2002, as compared with 44% in 2001. In addition, theidentifiable net assets of our foreign operations totaled 20% of consolidated assets at December 31, 2002 as compared to 24% at December 31,2001. Our exposure to currency exchange rate changes is diversified due to the number of different countries in which we conduct business.We operate outside the United States primarily through wholly owned subsidiaries in Europe, Asia/ Pacific, Canada and Latin America. Wehave determined that the functional currency of each of our foreign subsidiaries is the local currency and as such, foreign currency translationadjustments are recorded as a separate component of stockholders� equity. Changes in the currency exchange rates of our foreign subsidiariesresulted in our reporting unrealized foreign currency exchange gain of $1.9 million in 2002 compared to a loss of $3.4 million in 2001. We
Copyright © 2012 www.secdatabase.com. All Rights Reserved.Please Consider the Environment Before Printing This Document

currently have no derivative instruments and did not engage in any material foreign currency hedging transactions in 2002 or 2001. Foreigncurrency gains and losses will continue to result from fluctuations in the value of the currencies in which we conduct operations as comparedto the U.S. Dollar, and future operating results will be affected to some extent by gains and losses from foreign currency exposure. Weprepared sensitivity analyses of our exposures from foreign net assets as of December 31, 2002, to assess the
45
Copyright © 2012 www.secdatabase.com. All Rights Reserved.Please Consider the Environment Before Printing This Document

Table of Contents
impact of hypothetical changes in foreign currency rates. Based upon the results of these analyses, a 10% adverse change in all foreigncurrency rates from the December 31, 2002 rates would result in a currency translation loss of $1.5 million before tax.
Interest rates. We invest our cash in a variety of financial instruments, including bank time deposits, and variable and fixed rateobligations of the U.S. Government and its agencies, states, municipalities, commercial paper and corporate bonds. These investments aredenominated in U.S. dollars. We classify all of our investments as available-for-sale in accordance with Statement of Financial AccountingStandards No. 115, �Accounting for Certain Investments in Debt and Equity Securities.� Cash balances in foreign currencies overseas areoperating balances and are invested in short-term deposits of the local operating bank. Interest income earned on our investments is reflectedin our financial statements under the caption �Other income, net.� Investments in both fixed rate and floating rate interest earning instrumentscarry a degree of interest rate risk. Fixed rate securities may have their fair market value adversely impacted due to a rise in interest rates,while floating rate securities may produce less income than expected if interest rates fall. Due to these factors, our future investment incomemay fall short of expectations due to changes in interest rates, or we may suffer losses in principal if forced to sell securities that have suffereda decline in market value due to a change in interest rates. We hold our investment securities for purposes other than trading. The fair value ofsecurities held at December 31, 2002 was $30.8 million, which is approximately the same as amortized cost, with interest rates generallyranging between 1% and 3%.
Item 8. Financial Statements and Supplementary Data
The independent auditors� report of Deloitte & Touche LLP together with our consolidated financial statements as of December 31, 2002and 2001, and for each of the three years in the period ended December 31, 2002, are included in this Form 10-K as listed in Item 14(a).
Item 9. Changes In and Disagreements With Accountants on Accounting and Financial Disclosure
None
46
Copyright © 2012 www.secdatabase.com. All Rights Reserved.Please Consider the Environment Before Printing This Document
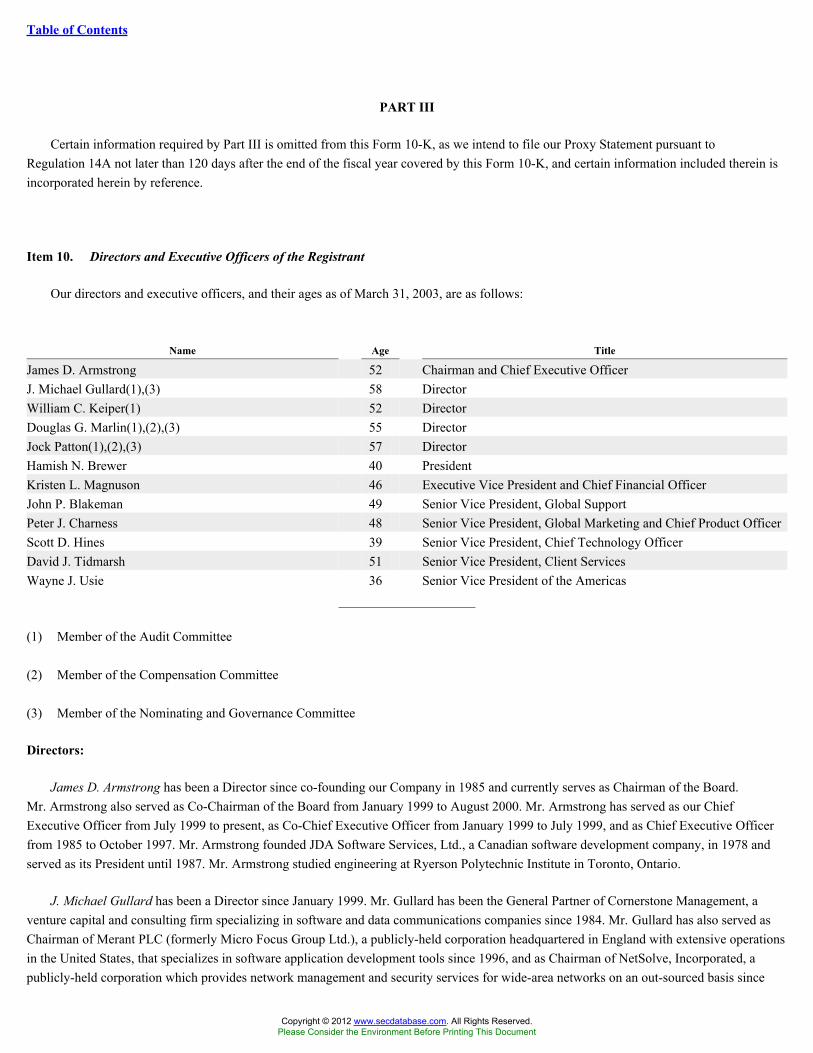
Table of Contents
PART III
Certain information required by Part III is omitted from this Form 10-K, as we intend to file our Proxy Statement pursuant toRegulation 14A not later than 120 days after the end of the fiscal year covered by this Form 10-K, and certain information included therein isincorporated herein by reference.
Item 10. Directors and Executive Officers of the Registrant
Our directors and executive officers, and their ages as of March 31, 2003, are as follows:
Name Age Title
James D. Armstrong 52 Chairman and Chief Executive OfficerJ. Michael Gullard(1),(3) 58 DirectorWilliam C. Keiper(1) 52 DirectorDouglas G. Marlin(1),(2),(3) 55 DirectorJock Patton(1),(2),(3) 57 DirectorHamish N. Brewer 40 PresidentKristen L. Magnuson 46 Executive Vice President and Chief Financial OfficerJohn P. Blakeman 49 Senior Vice President, Global SupportPeter J. Charness 48 Senior Vice President, Global Marketing and Chief Product OfficerScott D. Hines 39 Senior Vice President, Chief Technology OfficerDavid J. Tidmarsh 51 Senior Vice President, Client ServicesWayne J. Usie 36 Senior Vice President of the Americas
(1) Member of the Audit Committee
(2) Member of the Compensation Committee
(3) Member of the Nominating and Governance Committee
Directors:
James D. Armstrong has been a Director since co-founding our Company in 1985 and currently serves as Chairman of the Board.Mr. Armstrong also served as Co-Chairman of the Board from January 1999 to August 2000. Mr. Armstrong has served as our ChiefExecutive Officer from July 1999 to present, as Co-Chief Executive Officer from January 1999 to July 1999, and as Chief Executive Officerfrom 1985 to October 1997. Mr. Armstrong founded JDA Software Services, Ltd., a Canadian software development company, in 1978 andserved as its President until 1987. Mr. Armstrong studied engineering at Ryerson Polytechnic Institute in Toronto, Ontario.
J. Michael Gullard has been a Director since January 1999. Mr. Gullard has been the General Partner of Cornerstone Management, aventure capital and consulting firm specializing in software and data communications companies since 1984. Mr. Gullard has also served asChairman of Merant PLC (formerly Micro Focus Group Ltd.), a publicly-held corporation headquartered in England with extensive operationsin the United States, that specializes in software application development tools since 1996, and as Chairman of NetSolve, Incorporated, apublicly-held corporation which provides network management and security services for wide-area networks on an out-sourced basis since
Copyright © 2012 www.secdatabase.com. All Rights Reserved.Please Consider the Environment Before Printing This Document

1992. Mr. Gullard has previously served as Chief Executive Officer and Chief Financial Officer of Telecommunications Technology, Inc.from 1979 to 1984, and held a variety of financial and operational management positions at Intel Corporation from 1972 to 1979. Mr. Gullardcurrently serves as Chairman of Mainsoft Corp., a private company and has formerly served as a Director of other technology companies.Mr. Gullard attended Stanford University where he received a Bachelor of Arts Degree in Economics and a Masters Degree from the GraduateSchool of Business.
William C. Keiper has been a Director since April 1998. Mr. Keiper has served as Chairman and Chief Executive Officer of ArrangeTechnology LLC, a software development services outsourcing company since 2002 and as Managing Partner of Catalyst Partners LLC, asoftware technology mergers and acquisition advisory firm since 2002. From 1998 to 2002, Mr. Keiper served as President of Martin WolfSecurities LLC, a mergers and acquisitions firm serving middle
47
Copyright © 2012 www.secdatabase.com. All Rights Reserved.Please Consider the Environment Before Printing This Document

Table of Contents
market IT services, consulting and e-commerce companies. From 1997 to 1998, Mr. Keiper served as Managing Director of Software EquityGroup, LLC, a software and Internet technology mergers, acquisitions and strategic consulting firm. Mr. Keiper was an officer and member ofthe Board of Directors of Artisoft, Inc., a publicly-held software company that develops and markets computer telephony and communicationssoftware from 1993 to 1997, serving as Chief Executive Officer from 1993 to 1997, and as Chairman of the Board from 1995 to 1997. From1986 to 1993, Mr. Keiper held variety of executive positions with MicroAge, Inc., a publicly held distributor and integrator of informationtechnology products and services, including President and Chief Operating Officer. Mr. Keiper currently serves on the Board of Directors ofseveral technology companies, including Hypercom Corporation, a NYSE company that provides point-of-sale card payment systems.Mr. Keiper received a Bachelor of Science Degree in Business (finance major) from Eastern Illinois University, a Juris Doctorate Degree inlaw from Arizona State University and a Masters Degree in International Management from the Thunderbird American Graduate School ofInternational Management.
Douglas G. Marlin has been a Director since May 31, 2001. Mr. Marlin served as President and principal owner of Marlin Ventures, Inc.,a Canadian-based consulting firm, from 1997 to 2000. From 1987 to 1996, Mr. Marlin served as President of JDA Software Services, Ltd.,and from 1981 to 1987 as its Vice President. Prior to that, Mr. Marlin served in a variety of technical and development positions with IBMfrom 1973 to 1981. Mr. Marlin currently serves on the Board of Directors of Zed I Solutions, a Canadian technology company that developshardware and software for real time industrial process monitoring, and Aero-Mechanical Services Ltd, a Canadian technology companyproviding Internet-based aircraft monitoring services. Mr. Marlin also serves as a Director for various privately-held companies includingFiretrace USA, LLP, a fire suppression technology company. Mr. Marlin attended the University of Calgary where he received a Bachelor ofScience Degree in Mathematics.
Jock Patton has been a Director since January 26, 1999. Mr. Patton is a private investor and serves as Lead Trustee, Valuation CommitteeChair and Executive Committee member of the over 60 funds comprising the ING and GCG families of mutual funds. Such fund groups haveaggregate assets under management in excess of $30 billion. Mr. Patton previously served as Chief Executive Officer of Rainbow MultimediaGroup, Inc., a producer of digital equipment, from 1999 to 2001. From 1992 to 1997, Mr. Patton served as a Director and President ofStockVal, Inc., an SEC registered investment advisor providing securities analysis software and proprietary data to mutual funds, majormoney managers and brokerage firms worldwide. Prior to 1992, Mr. Patton was a Partner and Director in the law firm of Streich Lang wherehe founded and headed the Corporate/ Securities Practice Group. Mr. Patton currently serves as the Lead Director of Hypercom Corporation, aNYSE company that provides point-of-sale card payment systems, and as a Director of ASARCO, Incorporated, a wholly-owned subsidiary ofGrupo Mexico S.A. de C.V., and one of the world�s leading integrated producers of copper and other metals. Mr. Patton has previously servedon the Board of Directors of various public and private companies, including America West Airlines, Inc. Mr. Patton attended the Universityof California at Berkeley and received an A.B. Degree in Political Science and J.D. Degree in law.
Other Executive Officers:
Hamish N. Brewer has served as our President since March 2001. Mr. Brewer previously served as Senior Vice President, Sales from2000 to March 2001, as Senior Vice President, Enterprise Systems, from 1999 to 2000, as Senior Vice President, International during 1998 to1999, as Director of our European, Middle East and African operations from 1996 to 1998, and as a Marketing Representative from 1994 to1996. Prior to that, Mr. Brewer served as a Retail Marketing Specialist with IBM from 1986 to 1990, and in various operational positions witha privately-held retail sales organization located in England. Mr. Brewer received a Bachelor of Science and a Bachelor of Commerce Degreefrom the University of Birmingham in England.
Kristen L. Magnuson has served as our Executive Vice President and Chief Financial Officer since March 2001. Ms. Magnusonpreviously served as Senior Vice President and Chief Financial Officer from September 1997 to March 2001. Prior to that, Ms. Magnusonserved as Vice President of Finance and Planning for Michaels Stores, Inc., a publicly-held arts and craft retailer from 1990 to 1997, as SeniorVice President and Controller of MeraBank FSB, an $8 billion financial institution, from 1987 to 1990, and various positions including AuditPrincipal in the audit department of Ernst & Young from 1978 to 1987. Ms. Magnuson is a Certified Public Accountant and received aBachelor of Business Administration Degree in Accounting from the University of Washington.
48
Copyright © 2012 www.secdatabase.com. All Rights Reserved.Please Consider the Environment Before Printing This Document

Copyright © 2012 www.secdatabase.com. All Rights Reserved.Please Consider the Environment Before Printing This Document

Table of Contents
John P. Blakeman has served as our Senior Vice President, Global Support since March 2001. Prior to that, Mr. Blakeman served as VicePresident, Global Support for eTimeCapital, a Silicon Valley Internet start-up company, from 2000 to 2001, as Vice President, Baan GlobalSupport Americas of Baan Corporation, a Netherlands-based software company, from 1998 to 2000, as Director, Customer SatisfactionBusiness Operations of Auspex Systems, Inc., a publicly-held hardware and software technology company, from 1997 to 1998, and in variousmanagement positions with Amdahl Corporation, a publicly-held information technology company and wholly-owned subsidiary of FujitsuLimited, from 1982 to 1997. Mr. Blakeman also served for ten years in the U.S. Marine Corps. Mr. Blakeman received a Bachelor ofAdministration degree in Management from Saint Mary�s College, and a Master of Business Administration degree from Santa ClaraUniversity.
Peter J. Charness has served as our Senior Vice President, Global Marketing and Chief Product Officer since March 1999. Mr. Charnesspreviously served as our Vice President of Marketing and Strategy for the JDA Arthur Division from 1998 to 1999. Prior to that, Mr. Charnessserved as Vice President and General Manager of the Retail Division of Comshare, Inc, a publicly-held software company, from 1996 to 1998,as Vice President, Professional Services of Mitech Computer Systems, Inc., a publicly-held software company, from 1995 to 1996, and invarious management positions including Vice President Logistics and Technology of Dylex Ltd., a publicly-held Canadian retail salescompany, from 1984 to 1995. Mr. Charness� education includes a CEGEP Diploma from McGill University in Montreal, Quebec, a Bachelorof Arts Degree from York University in Toronto, Ontario, and a Master of Business Administration Degree from the University of WesternOntario.
Scott D. Hines has served as our Senior Vice President, Chief Technology Officer since February 1999. Mr. Hines has previously servedas our Vice President of In-store Systems from 1997 to 1998, as Director of Store Systems Product Development from 1996 to 1997, and asAssociate Director of Store Systems Product Development from 1993 to 1996. Prior to that, Mr. Hines served as Director of MIS for USHosiery Corporation, a privately-held textile manufacturing company, from 1991 to 1993, and as President of DataWorks, Inc., a privately-held software development company, from 1987 to 1991. Mr. Hines attended Carnegie Mellon University and received a Bachelor of ScienceDegree in Molecular Biology.
David J. Tidmarsh has served as our Senior Vice President, Client Services since January 1999. Prior to that, Mr. Tidmarsh served asVice President of Business Development with HNC Retek, a business unit of HNC Software Inc., a publicly-held software solutions provider,from 1997 to 1998, as Chief Information Officer and Vice President of Logistics with Wilsons The Leather Experts, a retail sales company,from 1993 to 1997, as Chief Operating Officer of Page-Com, a publicly-held direct mail marketer of communication equipment, and as VicePresident of Merchandise Planning, Allocation and Logistics with Pier One Imports, a specialty retail company, from 1987 to 1992.Mr. Tidmarsh attended Marquette University and received a Bachelor of Arts Degree in Philosophy.
Wayne J. Usie has served as our Senior Vice President of the Americas since January 2003. Prior to that, Mr. Usie served as our SeniorVice President, Product Development from January 2001 to December 2002. Prior to that, Mr. Usie served as Vice President � InformationTechnology for Family Dollar Stores, Inc., a publicly-held mass merchant discount retailer from 1997 to 2000, as Vice President � ChiefFinancial Officer and Chief Information Officer of Campo Electronics, Appliances, and Computers, Inc., a publicly-held consumer electronicsretailer, from 1996 to 1997, as President and Chief Executive Officer of International Networking & Computer Consultants, Inc., a privately-held software integration consulting firm, from 1992 to 1996, and in various management positions in the regional accounting firm ofBroussard, Poche, Lewis & Breaux from 1988 to 1992. Mr. Usie attended Louisiana State University and received a Bachelor of ScienceDegree in Business Administration � Accounting.
Information with respect to delinquent filings pursuant to Item 405 of Regulation S-K is incorporated by reference to the Proxy Statementas set forth under the caption �Section 16(a) Beneficial Ownership Reporting Compliance.�
Item 11. Executive Compensation
Copyright © 2012 www.secdatabase.com. All Rights Reserved.Please Consider the Environment Before Printing This Document

The information relating to executive compensation is incorporated by reference to the Proxy Statement under the captions �ExecutiveCompensation,� �Summary Compensation Table,� �Employment and Change of Control Arrangements,� �Compensation of Directors,��Option Grants in Last Fiscal Year,� �Aggregate Option Exercises During Fiscal 2002 and Year End Option Values,� �Ten-Year OptionRepricing,� �Report of The Compensation Committee on Executive Compensation,� and �Stock Performance Graph.�
49
Copyright © 2012 www.secdatabase.com. All Rights Reserved.Please Consider the Environment Before Printing This Document

Table of Contents
Item 12. Security Ownership of Certain Beneficial Owners and Management and Related Stockholder Matters
The information relating to ownership of our equity securities by certain beneficial owners and management is incorporated by referenceto the Proxy Statement as set forth under the captions �Stock Ownership of Certain Beneficial Owners and Management,� and �Employmentand Change in Control Arrangements,� and �Equity Compensation Plan Information.�
Item 13. Certain Relationships and Related Transactions
The information relating to certain relationships and related transactions is incorporated by reference to the Proxy Statement under thecaptions �Certain Transactions� and �Compensation Committee Interlocks and Insider Participation.�
Item 14. Controls and Procedures
Evaluation of Disclosure Controls and Procedures. Under the supervision and with the participation of our management, including ourprincipal executive officer and principal financial and accounting officer, we conducted an evaluation of our disclosure controls andprocedures, as such term is defined under Rule 13a-14(c) promulgated under the Securities Exchange Act of 1934, as amended (the�Exchange Act�), as of a date (the �Evaluation Date�) within 90 days of the filing date of this report. Based on their evaluation, our principalexecutive officer and principal financial and accounting officer have concluded that our disclosure controls and procedures are effective, butalso concluded that there are certain weaknesses in our Information Technology area (�IT�), including access security and change control. Wehave dedicated resources to correcting these issues and are in the process of implementing the necessary corrections. These weaknesses didnot have a material impact on the accuracy of our financial statements.
Changes in Internal Controls. Other than the steps we have taken, or are in the process of taking, to correct certain weaknesses in our ITarea with respect to access security and change control, there have been no significant changes in our internal controls, as such term is definedunder Section 13(b) of the Exchange Act, or to our knowledge, in other factors that could significantly affect these controls subsequent to theEvaluation Date, including corrective actions with regard to significant deficiencies and material weaknesses.
PART IV
Item 15. Exhibits, Financial Statement Schedules, and Reports on Form 8-K
a. The following documents are filed as part of this Report:
1. Financial Statements
Independent Auditors� Report
Consolidated Balance Sheets � December 31, 2002 and 2001Consolidated Statements of Income � Three Years Ended December 31, 2002Consolidated Statements of Stockholders� Equity � Three Years Ended December 31, 2002
Copyright © 2012 www.secdatabase.com. All Rights Reserved.Please Consider the Environment Before Printing This Document

Consolidated Statements of Cash Flows � Three Years Ended December 31, 2002Notes to Consolidated Financial Statements � Three Years Ended December 31, 2002
2. Exhibits �� See Exhibit Index.
b. Reports on Form 8-K:
Not applicable
50
Copyright © 2012 www.secdatabase.com. All Rights Reserved.Please Consider the Environment Before Printing This Document

Table of Contents
INDEPENDENT AUDITORS�� REPORT
Board of Directors and Stockholders
JDA Software Group, Inc.Scottsdale, Arizona
We have audited the accompanying consolidated balance sheets of JDA Software Group, Inc. and subsidiaries as of December 31, 2002and 2001, and the related consolidated statements of income, stockholders� equity, and cash flows for each of the three years in the periodended December 31, 2002. These financial statements are the responsibility of the Company�s management. Our responsibility is to expressan opinion on these financial statements based on our audits.
We conducted our audits in accordance with auditing standards generally accepted in the United States of America. Those standardsrequire that we plan and perform the audit to obtain reasonable assurance about whether the financial statements are free of materialmisstatement. An audit includes examining, on a test basis, evidence supporting the amounts and disclosures in the financial statements. Anaudit also includes assessing the accounting principles used and significant estimates made by management, as well as evaluating the overallfinancial statement presentation. We believe that our audits provide a reasonable basis for our opinion.
In our opinion, such consolidated financial statements present fairly, in all material respects, the financial position of JDA SoftwareGroup, Inc. and subsidiaries as of December 31, 2002 and 2001, and the results of their operations and their cash flows for each of the threeyears in the period ended December 31, 2002 in conformity with accounting principles generally accepted in the United States of America.
As discussed in Note 1 and Note 6 to the consolidated financial statements, the Company changed its method of accounting for goodwilland intangibles with indefinite lives as required by Statement of Financial Accounting Standards No. 142, �Goodwill and Other IntangibleAssets,� which was effective January 1, 2002.
DELOITTE & TOUCHE LLP
Phoenix, Arizona
January 20, 2003
51
Copyright © 2012 www.secdatabase.com. All Rights Reserved.Please Consider the Environment Before Printing This Document

Table of Contents
JDA SOFTWARE GROUP, INC. AND SUBSIDIARIES
CONSOLIDATED BALANCE SHEETS
December 31,
2002 2001
(In thousands, except
share amounts)
ASSETSCurrent Assets:
Cash and cash equivalents $ 71,065 $ 51,865Marketable securities 30,790 12,140Accounts receivable, net 47,077 60,943Income tax receivable 7,479 3,798Deferred tax asset 5,564 6,980Prepaid expenses and other current assets 12,289 10,750
Total current assets 174,264 146,476Property and Equipment, net 21,337 21,950Goodwill 59,801 55,192Other Intangibles, net 56,635 61,670Promissory Note Receivable 3,017 3,354
Total assets $ 315,054 $ 288,642
LIABILITIES AND STOCKHOLDERS�� EQUITYCurrent Liabilities:
Accounts payable $ 3,020 $ 2,857Accrued expenses and other liabilities 26,957 32,963Deferred revenue 23,331 17,562
Total current liabilities 53,308 53,382Deferred Tax Liability 4,980 10,810Commitments and Contingencies (Notes 11 and 12)Stockholders� Equity:
Preferred stock, $.01 par value; authorized 2,000,000shares; none issued or outstanding � �
Common stock, $.01 par value; authorized, 50,000,000shares; issued 28,696,688 and 27,035,935 shares,respectively 287 270
Additional paid-in capital 237,120 214,589Retained earnings 27,353 18,423Accumulated other comprehensive loss (4,199 ) (6,138 )
Copyright © 2012 www.secdatabase.com. All Rights Reserved.Please Consider the Environment Before Printing This Document

260,561 227,144Less treasury stock, at cost, 339,702 and 239,000 shares,
respectively (3,795 ) (2,694 )
Total stockholders� equity 256,766 224,450
Total liabilities and stockholders� equity $ 315,054 $ 288,642
See notes to consolidated financial statements.
52
Copyright © 2012 www.secdatabase.com. All Rights Reserved.Please Consider the Environment Before Printing This Document

Table of Contents
JDA SOFTWARE GROUP, INC. AND SUBSIDIARIES
CONSOLIDATED STATEMENTS OF INCOME
Years Ended December 31,
2002 2001 2000
(In thousands, except per share data)
REVENUES:Software licenses $ 66,625 $ 71,220 $ 62,640Maintenance services 57,570 40,568 30,380
Product revenues 124,195 111,788 93,020Consulting services 87,608 95,124 78,709Reimbursed expenses 7,652 6,904 6,970
Service revenues 95,260 102,028 85,679Total revenues 219,455 213,816 178,699
COST OF REVENUES:Cost of software licenses 2,035 2,376 2,947Amortization of acquired software technology 4,247 2,971 1,834Cost of maintenance services 14,292 11,159 7,655
Cost of product revenues 20,574 16,506 12,436Cost of consulting services 63,837 69,953 64,965Reimbursed expenses 7,652 6,904 6,970
Cost of service revenues 71,489 76,857 71,935Total cost of revenues 92,063 93,363 84,371
GROSS PROFIT 127,392 120,453 94,328OPERATING EXPENSES:Product development 41,819 34,406 28,840Sales and marketing 39,941 37,998 28,770General and administrative 26,978 27,099 20,761Amortization of intangibles 2,849 5,526 4,708Purchased in-process research and development 800 2,361 200Restructuring, asset disposition and other merger related charges 6,287 985 828Relocation costs to consolidate development and support
activities 452 � �
Total operating expenses 119,126 108,375 84,107
OPERATING INCOME 8,266 12,078 10,221Other income, net 1,700 2,671 4,246
Copyright © 2012 www.secdatabase.com. All Rights Reserved.Please Consider the Environment Before Printing This Document

INCOME BEFORE INCOME TAXES 9,966 14,749 14,467Provision for income taxes 1,036 5,101 5,599
NET INCOME $ 8,930 $ 9,648 $ 8,868
BASIC EARNINGS PER SHARE $ .32 $ .38 $ .36
DILUTED EARNINGS PER SHARE $ .31 $ .37 $ .35
SHARES USED TO COMPUTE:Basic earnings per share 28,047 25,316 24,315
Diluted earnings per share 29,074 25,757 25,431
See notes to consolidated financial statements.
53
Copyright © 2012 www.secdatabase.com. All Rights Reserved.Please Consider the Environment Before Printing This Document

Table of Contents
JDA SOFTWARE GROUP, INC. AND SUBSIDIARIES
CONSOLIDATED STATEMENTS OF STOCKHOLDERS�� EQUITY
Accumulated
Common Stock Additional Retained Other
Paid-In Earnings Comprehensive Treasury
Shares Amount Capital (Deficit) Loss Stock Total
(In thousands, except share amounts)
Balance, January 1, 2000 23,992,748 $ 240 $ 176,101 $ (93 ) $ (1,385) $ � $ 174,863Issuance of common
stock:Stock options
exercised 259,048 2 2,426 2,428Employee stock
purchase plan 359,171 4 3,005 3,009Tax benefit � stock
compensation 329 329Purchase of treasury
stock (1,819) (1,819 )Comprehensive income
(loss):Net income 8,868 8,868Unrealized gain on
marketable securitiesavailable-for-sale,net 88 88
Foreign translationadjustment (1,501) (1,501 )
Comprehensiveincome 7,455
Balance, December 31,2000 24,610,967 246 181,861 8,775 (2,798) (1,819) 186,265
Issuance of commonstock:Stock issued in
acquisition 1,600,080 16 24,199 24,215Stock options
exercised 433,286 4 4,226 4,230Employee stock
purchase plan 391,602 4 3,396 3,400Tax benefit � stock
compensation 907 907
Copyright © 2012 www.secdatabase.com. All Rights Reserved.Please Consider the Environment Before Printing This Document

Purchase of treasurystock (875 ) (875 )
Comprehensive income(loss):Net income 9,648 9,648Unrealized gain on
marketable securitiesavailable-for-sale,net 22 22
Foreign translationadjustment (3,362) (3,362 )
Comprehensiveincome 6,308
Balance, December 31,2001 27,035,935 270 214,589 18,423 (6,138) (2,694) 224,450
Issuance of commonstock:Stock options
exercised 1,324,768 13 12,615 12,628Employee stock
purchase plan 335,985 4 4,146 4,150Tax benefit � stock
compensation 5,770 5,770Purchase of treasury
stock (1,101) (1,101 )Comprehensive income
(loss):Net income 8,930 8,930Unrealized gain on
marketable securitiesavailable-for-sale,net 26 26
Foreign translationadjustment 1,913 1,913
Comprehensiveincome 10,869
Balance, December 31,2002 28,696,688 $ 287 $ 237,120 $ 27,353 $ (4,199) $ (3,795) $ 256,766
See notes to consolidated financial statements.
54
Copyright © 2012 www.secdatabase.com. All Rights Reserved.Please Consider the Environment Before Printing This Document

Table of Contents
JDA SOFTWARE GROUP, INC. AND SUBSIDIARIES
CONSOLIDATED STATEMENTS OF CASH FLOWS
Years Ended December 31,
2002 2001 2000
(In thousands)
Operating Activities:Net income $ 8,930 $ 9,648 $ 8,868Adjustments to reconcile net income to net cash provided by
operating activities:Depreciation and amortization 15,448 16,702 14,584Provision for doubtful accounts 2,900 4,884 3,242Tax benefit � stock options and employee stock purchase
plan 5,770 907 329Net loss on disposal of property and equipment 15 130 177Write-off of purchased in-process research and
development 800 2,361 200Deferred income taxes (6,271 ) 1,159 1,051
Changes in assets and liabilities, net of effects fromacquisitions:Accounts receivable 11,334 (7,099 ) (20,112)Income tax receivable (2,537 ) 91 (245 )Prepaid expenses and other current assets (2,211 ) (2,729 ) (930 )Accounts payable 171 (2,640 ) 1,303Accrued expenses and other liabilities 1,207 3,858 1,231Deferred revenue 5,961 2,107 (500 )
Net cash provided by operating activities 41,517 29,379 9,198
Investing Activities:Purchase of marketable securities (46,767) (12,242) (37,332)Sales of marketable securities 9,701 2,500 7,823Maturities of marketable securities 18,443 13,424 49,042Purchase of J � Commerce, Inc. (4,170 ) � �
Purchase of Zapotec Software, Inc. � (1,250 ) �
Purchase of Neo Vista Decision Series � (4,938 ) �
Purchase of E3 Corporation, net of cash acquired � (18,348) �
Payment of direct costs related to the acquisition of E3Corporation (8,583 ) (6,048 ) �
Purchase of Intactix International, Inc., net of cash acquired � � (23,138)Issuance of promissory note receivable � (3,500 ) �
Payments received on promissory note receivable 337 146 �
Purchase of property and equipment (8,262 ) (6,815 ) (7,785 )Proceeds from disposal of property and equipment 448 1,478 1,803
Copyright © 2012 www.secdatabase.com. All Rights Reserved.Please Consider the Environment Before Printing This Document

Net cash used in investing activities (38,853) (35,593) (9,587 )
Financing Activities:Issuance of common stock � stock option plans 12,628 4,230 2,428Issuance of common stock � employee stock purchase plan 4,150 3,400 3,009Purchase of treasury stock (1,101 ) (875 ) (1,819 )Payments on capital leases (320 ) (196 ) (47 )Payments on line of credit, notes payable, and long-term debt
assumed in the E3 Corporation acquisition � (8,166 ) �
Net cash provided by (used in) financing activities 15,357 (1,607 ) 3,571
Effect of exchange rates on cash and cash equivalents 1,179 (1,108 ) (671 )
Net (decrease) increase in cash and cash equivalents 19,200 (8,929 ) 2,511Cash and Cash Equivalents, Beginning of Year 51,865 60,794 58,283
Cash and Cash Equivalents, End of Year $ 71,065 $ 51,865 $ 60,794
See notes to consolidated financial statements.
55
Copyright © 2012 www.secdatabase.com. All Rights Reserved.Please Consider the Environment Before Printing This Document

Table of Contents
JDA SOFTWARE GROUP, INC. AND SUBSIDIARIES
CONSOLIDATED STATEMENTS OF CASH FLOWS
Years Ended December 31,
2002 2001 2000
(In thousands)
Supplemental Disclosures of Cash Flow Information:Cash paid for:
Interest $ 54 $ 48 $ 26
Income taxes $ 4,115 $ 3,501 $ 4,434
Supplemental Disclosures of Noncash Investing Activities:Acquisition of J � Commerce, Inc.:
Software technology $ (2,060)In-process research and development (800 )Goodwill (1,325)
Total acquisition cost of J � Commerce, Inc. (4,185)Accruals for direct costs related to the transaction 15
Total cash expended to acquire J � Commerce, Inc. $ (4,170)
Acquisition of Zapotec Software, Inc.:Fair value of current assets acquired $ (14 )Developed software and other intangibles (1,293 )In-process research and development (161 )Fair value of current liabilities assumed 218
Cash used to purchase Zapotec Software, Inc. $ (1,250 )
Acquisition of Neo Vista Decision Series:Fair value of fixed assets acquired $ (5 )Developed software and other intangibles (2,956 )Goodwill (2,727 )Fair value of current liabilities assumed 750
Cash used to purchase Neo Vista Decision Series $ (4,938 )
Acquisition of E3 Corporation:Fair value of current assets acquired $ (14,036)Fair value of fixed assets acquired (2,402 )Goodwill (35,350)Developed software and other intangibles (38,000)
Copyright © 2012 www.secdatabase.com. All Rights Reserved.Please Consider the Environment Before Printing This Document

In-process research and development (2,200 )Fair value of current liabilities assumed 12,906Deferred revenue 2,205Fair value of long-term debt assumed 1,627Deferred tax liability, net 15,164
Total acquisition cost of E3 Corporation (60,086)Reserves for direct costs related to the transaction 15,871Issuance of common stock 24,215Cash acquired 1,652
Cash used to purchase E3 Corporation $ (18,348)
Acquisition of Intactix International, Inc.:Fair value of current assets acquired $ (8,907 )Fair value of fixed assets acquired (508 )Developed software and other intangibles (23,205)In-process research and development (200 )Fair value of current liabilities assumed 7,859
Total acquisition cost of Intactix International, Inc. (24,961)Cash acquired 1,823
Total cash used to acquire Intactix International, Inc. $ (23,138)
See notes to consolidated financial statements.
56
Copyright © 2012 www.secdatabase.com. All Rights Reserved.Please Consider the Environment Before Printing This Document

Table of Contents
JDA SOFTWARE GROUP, INC. AND SUBSIDIARIES
NOTES TO CONSOLIDATED FINANCIAL STATEMENTSThree Years Ended December 31, 2002
(in thousands, except percentages, shares, per share amounts or as otherwise stated)
1. Summary of Significant Accounting Policies
Nature of Business. We are a leading provider of sophisticated software solutions designed specifically to address the demand and supplychain management, business process, decision support, e-commerce, inventory optimization, and collaborative planning and forecastingrequirements of the retail industry and its suppliers. Our solutions enable our customers to collect, manage, organize and analyze informationthroughout their retail enterprise, and to interact with suppliers and customers over the Internet at multiple levels within their organization.Our customers include more than 4,800 of the world�s leading retail, manufacturing, and wholesale organizations. We have organized ourbusiness segments around the distinct requirements of retail enterprises, retail stores, and suppliers to the retail industry: Retail EnterpriseSystems for inventory control, warehouse and logistics management, merchandise planning and allocation, space management, tradeallowance and promotional program management, advanced inventory demand forecasting and replenishment, customer relationshipmanagement, and decision support; In-Store Systems for point-of-sale, e-commerce and back office applications; and Collaborative Solutionsfor business-to-business collaborative planning, forecasting and replenishment between retailers and their suppliers. We employ over 1,200associates and conduct business from 32 offices in three geographic regions: the Americas (includes the United States, Canada, and LatinAmerica), Europe (includes the Middle East and South Africa), and Asia/ Pacific. Our corporate offices are located in Scottsdale, Arizona.
Principles of Consolidation and Basis of Presentation. The consolidated financial statements include the accounts of JDA SoftwareGroup, Inc. and our subsidiaries, all of which are wholly owned. All significant intercompany balances and transactions have been eliminatedin consolidation. The consolidated financial statements are stated in U.S. dollars and are prepared under accounting principles generallyaccepted in the United States. Certain reclassifications have been made to the prior year financial statements to conform to the 2002presentation.
Use of Estimates. The preparation of financial statements in conformity with accounting principles generally accepted in the United Statesrequires management to make estimates and assumptions that affect the reported amounts of assets and liabilities, disclosure of contingentassets and liabilities at the date of the financial statements and the reported amounts of revenue and expenses during the reporting period.Significant estimates include the allowance for doubtful accounts, which is based upon an evaluation of our customers� ability to pay andgeneral economic conditions; the useful lives of intangible assets, which are based upon valuation reports prepared by independent third partyvaluation specialists; the recoverability or impairment of intangible asset values; deferred revenue; reserves for anticipated professional fees,asset disposition and severance charges incurred in connection with acquisitions; restructuring charges; and our effective income tax rate anddeferred tax assets which are based upon our expectations of future taxable income, allowable deductions, and projected tax credits. Actualresults could differ from these estimates.
Foreign Currency Translation. The financial statements of our international subsidiaries are translated into U.S. dollars using theexchange rate at each balance sheet date for assets and liabilities and at an average exchange rate for the revenues and expenses reported ineach fiscal period. We have determined that the functional currency of each foreign subsidiary is the local currency and as such, foreigncurrency translation adjustments are recorded as a separate component of stockholders� equity. Transaction gains and losses and unrealizedgains and losses on short-term intercompany receivables and payables and foreign denominated receivables are included in results ofoperations as incurred.
Cash and Cash Equivalents and Marketable Securities. Cash and cash equivalents consist of cash held in bank demand deposits andhighly liquid investments with remaining maturities of three months or less at the date of purchase. Marketable securities include instrumentsof the U.S. Government and its agencies, commercial paper and corporate bonds. Management determines the appropriate classification of
Copyright © 2012 www.secdatabase.com. All Rights Reserved.Please Consider the Environment Before Printing This Document

debt and equity securities at the time of purchase and re-evaluates such designation as of each balance sheet date. All marketable securities arerecorded at market value and have been classified as available-for-sale at December 31, 2002 and 2001. Unrealized holding gains and losses,net of the related income tax effect, are excluded from earnings and are reported as a separate component of stockholders� equity
57
Copyright © 2012 www.secdatabase.com. All Rights Reserved.Please Consider the Environment Before Printing This Document

Table of Contents
JDA SOFTWARE GROUP, INC. AND SUBSIDIARIES
NOTES TO CONSOLIDATED FINANCIAL STATEMENTS �� (Continued)
until realized. Dividend and interest income are recognized when earned. Realized gains and losses for securities classified as available-for-sale are determined using the specific identification method.
Accounts Receivable. We typically provide installment payment terms on most software license sales. Software licenses are generally duein installments within twelve months from the date of delivery. All significant customers are reviewed for creditworthiness before theCompany licenses its software and we do not sell our software or recognize any license revenue unless we believe that collection is probablein accordance with the requirements of paragraph 8 in Statement of Position 97-2, Software Revenue Recognition, as amended. We have ahistory of collecting software payments when they come due without providing refunds or concessions. Consulting services are billed bi-weekly and maintenance services are billed annually or monthly. If a customer becomes significantly delinquent or its credit deteriorates, weput the accounts on hold and do not recognize any further services revenue (and in most cases we withdraw support and/or our implementationstaff) until the situation has been resolved
We do not have significant billing or collection problems. Although infrequent and unpredictable, from time to time certain of ourcustomers have filed bankruptcy and we have been required to refund the pre-petition amounts collected and settle for less than the face valueof its remaining receivable pursuant to a bankruptcy court order. In these situations, as soon as it becomes probable that the net realizablevalue of the receivable is impaired, we provide reserves on the receivable. In addition, we monitor economic conditions in the variousgeographic regions in which we operate to determine if general reserves or adjustments to our credit policy in a region are appropriate fordeteriorating conditions that may impact the net realizable value of our receivables.
Derivative Instruments and Hedging Activities. We adopted Statement of Financial Accounting Standard No. 133, Accounting forDerivative Instruments and Hedging Activities (�SFAS No. 133�), effective January 1, 2001. SFAS No. 133 requires companies to valuederivative financial instruments, including those used for hedging foreign currency exposures, at current market value. The adoption of SFASNo. 133 did not have a significant impact on our financial statements. We currently have no significant derivative instruments and have notengaged in any material foreign currency hedging transactions.
Property and Equipment and Long-Lived Assets. Property and equipment are stated at cost less accumulated depreciation andamortization. Property and equipment are depreciated on a straight-line basis over the following estimated useful lives: computers, furniture,and fixtures � two to seven years; buildings � twenty-five years; automobiles � three years; leasehold improvements � the shorter of the leaseterm or the estimated useful life of the asset.
We adopted Statement of Financial Accounting Standards No. 144, Accounting for the Impairment or Disposal of Long-Lived Assets(�SFAS No. 144�) effective January 1, 2002. SFAS No. 144 addresses financial accounting and reporting for the impairment or disposal oflong-lived assets, and supersedes Statement of Financial Accounting Standards No. 121, Accounting of the Impairment of Long-Lived Assetsand for Long-Lived Assets to be Disposed Of. SFAS No. 144 requires that we evaluate long-lived assets based on the net future cash flowexpected to be generated from the asset on an undiscounted basis whenever significant events or changes in circumstances occur that indicatethat the carrying amount of an asset may not be recoverable. The adoption of SFAS No. 144 did not have a significant impact on our operatingresults or financial position.
Goodwill. Goodwill represents the excess of the purchase price over the net assets acquired in our business combinations. BeginningJanuary 1, 2002, with the adoption of Statement of Financial Accounting Standard No. 142, Goodwill and Other Intangible Assets (�SFASNo. 142�) goodwill is no longer amortized, but instead tested for impairment at least annually (see Note 6). Goodwill recorded in businesscombinations prior to June 30, 2001 was amortized on a straight-line basis through December 31, 2001 over useful lives ranging from 10 to15 years.
Copyright © 2012 www.secdatabase.com. All Rights Reserved.Please Consider the Environment Before Printing This Document

Intangible Assets. Intangible assets consist of the values allocated to software technology, customer lists and trademarks in connectionwith various business combinations. Software technology is capitalized if the related software product under development has reachedtechnological feasibility or if there are alternative future uses for the purchased software. Amortization of software technology is reported as acost of product revenues in accordance with Financial Accounting Standards No. 86, Accounting for the Costs of Computer Software to beSold, Leased, or Otherwise Marketed
58
Copyright © 2012 www.secdatabase.com. All Rights Reserved.Please Consider the Environment Before Printing This Document

Table of Contents
JDA SOFTWARE GROUP, INC. AND SUBSIDIARIES
NOTES TO CONSOLIDATED FINANCIAL STATEMENTS �� (Continued)
(�SFAS No. 86�). Software technology is amortized on a product-by-product basis and is determined as the amount for each product that isthe greater of the amount computed using (a) the ratio that current gross revenues for a product bear to the total of current and anticipatedfuture revenue for that product, or (b) the straight-line method over the remaining estimated economic life of the product including the periodbeing reported on. The estimated economic lives of our software technology products range from 7 to 15 years.
Amortization of customer lists is computed on a straight-line basis over estimated useful lives ranging from 10 to 13 years. Theseintangible assets were all acquired in business combinations over the last four years. Our valuation process during the acquisitions, and thethird party appraisals we obtained to support our allocation of the purchase price to these assets, were based upon the projected economic lifeof the customer base, using historical turnover rates and discussions with management. The historical life experiences of the acquiredcompanies that were utilized in the valuations support the economic lives used, as does the Company�s historical experience with similarcustomer accounts for products that have been developed internally. The Company reviews the customer attrition rates for each significantacquired customer group on a regular basis to ensure the rate of attrition is not increasing and that revisions to our estimates of life expectancyare not required.
Substantially all of our capitalized trademarks were acquired in connection with the acquisition of E3 Corporation (see Note 2), and haveindefinite useful lives that extend beyond the foreseeable future. We believe there are no legal, regulatory, contractual, competitive, economic,or other factors that would limit the useful life of our trademarks and we expect the trademarks to contribute to our cash flows indefinitely.Trademarks with indefinite useful lives are not subject to amortization. However, in accordance with paragraph 17 of SFAS No. 142, theCompany tests trademarks for impairment annually or more frequently if events or changes in circumstances indicate that the asset might beimpaired.
Restructuring, Asset Disposition and Other Merger Related Charges. We recorded restructuring, asset disposition and other mergerrelated charges during the second and fourth quarters of 2002, and in 2001 and 2000, using the authoritative guidance in Emerging Issues TaskForce Issue No. 94-3 (�EITF No. 94-3�), Liability Recognition for Certain Employee Termination Benefits and Other Costs to Exit an Activity(including Certain Costs Incurred in a Restructuring). In June 2002, the Financial Accounting Standards Board issued Statement of FinancialAccounting Standards No. 146, Accounting for Costs Associated with Exit or Disposal Activities (�SFAS No. 146�). The provisions of SFASNo. 146 are effective for exit or disposal activities that are initiated after December 31, 2002. SFAS No. 146 was adopted effective January 1,2003. SFAS No. 146 addresses financial accounting and reporting for costs associated with exit or disposal activities and nullifies EITFNo. 94-3. Under SFAS No. 146, the liability for costs associated with exit or disposal activities is recognized and measured initially at fairvalue only when the liability is incurred, rather than at the date the Company committed to the exit plan.
Revenue Recognition. We license software under non-cancelable agreements and provide related services, including consulting, trainingand customer support. We recognize revenue in accordance with Statement of Position 97-2 (�SOP 97-2�), Software Revenue Recognition, asamended and interpreted by Statement of Position 98-9, Modification of SOP 97-2, Software Revenue Recognition, with respect to certaintransactions, as well as Technical Practice Aids issued from time to time by the American Institute of Certified Public Accountants. Weadopted Staff Accounting Bulletin No. 101 (�SAB 101�), Revenue Recognition in Financial Statements, during first quarter 2000. SAB 101provides further interpretive guidance for public companies on the recognition, presentation, and disclosure of revenue in financial statements.The adoption of SAB 101 did not have a material impact on our licensing or revenue recognition practices.
Software license revenue is recognized when a license agreement has been signed, the software product has been delivered, there are nouncertainties surrounding product acceptance, the fees are fixed and determinable, and collection is considered probable. If a software licensecontains an undelivered element, the vendor-specific objective evidence (�VSOE�) of fair value of the undelivered element is deferred and therevenue recognized once the element is delivered. The undelivered elements are primarily training, consulting and maintenance services.VSOE of fair value for training and consulting services is based upon standard hourly rates charged when those services are sold separately.
Copyright © 2012 www.secdatabase.com. All Rights Reserved.Please Consider the Environment Before Printing This Document

VSOE of fair value for maintenance is the price the customer will be required to pay when it is sold separately (that is, the renewal rate). Inaddition, if a software license contains customer acceptance criteria or a cancellation right, the software revenue
59
Copyright © 2012 www.secdatabase.com. All Rights Reserved.Please Consider the Environment Before Printing This Document

Table of Contents
JDA SOFTWARE GROUP, INC. AND SUBSIDIARIES
NOTES TO CONSOLIDATED FINANCIAL STATEMENTS �� (Continued)
is recognized upon the earlier of customer acceptance or the expiration of the acceptance period or cancellation right. Payments for oursoftware licenses are typically due in installments within twelve months from the date of delivery. Although infrequent, where softwarelicense agreements call for payment terms of twelve months or more from the date of delivery, revenue is recognized as payments become dueand all other conditions for revenue recognition have been satisfied.
Consulting and training services are separately priced, are generally available from a number of suppliers, and are not essential to thefunctionality of our software products. Consulting services, which include project management, system planning, design and implementation,customer configurations, and training are billed on both an hourly basis and under fixed price contracts. Consulting services revenue billed onan hourly basis is recognized as the work is performed. Training revenues are recognized when the training is provided and is included inconsulting revenues in the Company�s consolidated statements of income. Under fixed price contracts, consulting services revenue isrecognized using the percentage of completion method of accounting by relating hours incurred to date to total estimated hours at completion.
We have from time to time provided software and consulting services under fixed price contracts that require the achievement of certainmilestones. Payment terms in these contracts are generally tied to customer acceptance of the milestones. The revenue under sucharrangements is recognized as the milestones are achieved or upon customer acceptance. We believe that milestones are a proper measure ofprogress under these contracts, as the milestones approximate the percentage of completion method of accounting.
Customer support services include post contract support and the rights to unspecified upgrades and enhancements. Maintenance revenuesfrom ongoing customer support services are billed on a monthly basis and recorded as revenue in the applicable month, or on an annual basiswith the revenue being deferred and recognized ratably over the maintenance period.
If an arrangement includes multiple elements, the fees are allocated to the various elements based upon VSOE of fair value, as describedabove.
Reimbursable Out-of-Pocket Expenses. We adopted Financial Accounting Standards Board Emerging Issues Task Force Issue No. 01-14(�EITF No. 01-14�), Income Statement Characterization of Reimbursements Received for Out-of-Pocket Expenses Incurred effectiveJanuary 1, 2002. EITF No. 01-14 requires the reclassification of reimbursed expenses in both service revenues and cost of service revenues inour consolidated statements of income. We previously netted reimbursed expenses in the cost of services. The adoption of EITF No. 01-14 didnot impact our total gross profit or operating income, but it did increase service revenues and cost of service revenues, and as a result, slightlyreduces our gross profit margin and operating margin percentages. Reimbursed expenses of $7.7 million have been classified in both servicerevenues and cost of service revenues for the year ended December 31, 2002, and we have reclassified reimbursed expenses of $6.9 millionand $7.0 million to service revenues and cost of service revenues in the consolidated statements of income for the years ended December 31,2001 and 2000, respectively.
Business Combinations. The purchase method of accounting has been followed on all of our business combinations and accordingly, thetotal purchase price of each acquired company was allocated to the acquired assets and liabilities based on their fair values (See Note 2). InJune 2001, FASB issued Statement of Financial Accounting Standards No. 141, Business Combinations (�SFAS No. 141�) that is effective forfiscal years beginning after December 15, 2001. SFAS No. 141 requires that the purchase method of accounting to be used for all businesscombinations initiated after June 30, 2001 and prohibits the use of the pooling-of-interest method. In addition, SFAS No. 141 includesguidance on the initial recognition and measurement of goodwill and other intangible assets arising from business combinations initiated afterJune 30, 2001. The accounting prescribed in SFAS No. 141 was applied in connection with the acquisition of E3 Corporation andJ�Commerce Inc. (See Note 2). SFAS No. 141 also contains certain transitional provisions that apply to business combinations completed andaccounted for under the purchase method before July 1, 2001. Pursuant to these transitional provisions, we reclassified the unamortizedbalance of our assembled workforce asset of approximately $905,000 to goodwill on January 1, 2002.
Copyright © 2012 www.secdatabase.com. All Rights Reserved.Please Consider the Environment Before Printing This Document

60
Copyright © 2012 www.secdatabase.com. All Rights Reserved.Please Consider the Environment Before Printing This Document

Table of Contents
JDA SOFTWARE GROUP, INC. AND SUBSIDIARIES
NOTES TO CONSOLIDATED FINANCIAL STATEMENTS �� (Continued)
In-Process Research and Development. In business combinations accounted for using the purchase method of accounting, the amount ofpurchase price allocated to in-process research and development (�IPR&D�) is expensed at the date of acquisition in accordance with FASBInterpretation No. 4, Applicability of FASB Statement No. 2 to Business Combinations Accounted for by the Purchase Method, anInterpretation of SFAS No. 2 (See Note 2). IPR&D consists of products or technologies in the development stage for which technologicalfeasibility has not been established and which we believe have no alternative use. Amounts allocated to IPR&D are shown as a separate lineitem in the consolidated statements of income.
Product Development. The costs to develop new software products and enhancements to existing software products are expensed asincurred until technological feasibility has been established. We consider technological feasibility to have occurred when all planning,designing, coding and testing have been completed according to design specifications. Once technological feasibility is established, anyadditional costs would be capitalized. We believe our current process for developing software is essentially completed concurrent with theestablishment of technological feasibility, and accordingly, no costs have been capitalized.
Income taxes. Deferred tax assets and liabilities are recorded for the estimated future tax effects of temporary differences between the taxbasis of assets and liabilities and amounts reported in the accompanying consolidated balance sheets. Pursuant to FASB Statement ofFinancial Accounting Standards No. 109, Accounting for Income Taxes, we have reviewed projected future taxable income, other than thereversal of temporary differences, and determined that our current deferred tax asset at December 31, 2002 requires a valuation allowance aswe believe it is more likely than not that the deferred tax asset will not be realized (see Note 15).
Earnings per Share. Basic earnings per share (�EPS�) excludes the dilutive effect of common stock equivalents and is computed bydividing net income or loss by the weighted-average number of shares outstanding during the period. Diluted EPS includes the effect ofcommon stock equivalents, which consist of stock options, and is computed using the weighted-average number of common and commonequivalent shares outstanding during the period. The weighted average shares for fiscal 2002 and 2001 are reflected net of treasury shares (SeeNotes 13 and 16).
Stock-Based Compensation. We do not record compensation expense for options granted to our employees as all options granted underour stock option plans have an exercise price equal to the market value of the underlying common stock on the date of grant. As permittedunder Statement of Financial Accounting Standards No. 123, Accounting for Stock-Based Compensation (�SFAS No. 123�), we have electedto continue to apply the provisions of Accounting Principles Board Opinion No. 25, Accounting for Stock Issued to Employees (�APBNo. 25�) and provide pro forma disclosure on an annual basis of net income (loss) and net income (loss) per common share for employeestock option grants made as if the fair-value method defined in SFAS No. 123 had been applied.
New Accounting Pronouncements. In December 2002, the Financial Accounting Standards Board issued Statement of FinancialAccounting Standards No. 148, Accounting for Stock-Based Compensation � Transition and Disclosure (�SFAS No. 148�) which is effectivefor fiscal years ending after December 15, 2002. SFAS No. 148 amends SFAS No. 123 to provide alternative methods of transition to SFASNo. 123�s fair value method of accounting for stock-based employee compensation if a company elects to account for its equity awards underthis method. SFAS No. 148 also amends the disclosure provisions of SFAS No. 123 and APB Opinion No. 28, Interim Financial Reporting, torequire disclosure of the effects of an entity�s accounting policy with respect to stock-based employee compensation on reported net incomeand earnings per share in both annual and interim financial statements. We will provide the comparative interim pro forma disclosuresrequired by SFAS No. 148 beginning in first quarter 2003. We are currently evaluating which method of transition to fair value accounting wewill elect.
The following table presents pro forma net income and basic and diluted earnings per share as if compensation expense had beenrecognized for stock options granted in the three year period ended December 31, 2002, as determined
Copyright © 2012 www.secdatabase.com. All Rights Reserved.Please Consider the Environment Before Printing This Document

61
Copyright © 2012 www.secdatabase.com. All Rights Reserved.Please Consider the Environment Before Printing This Document
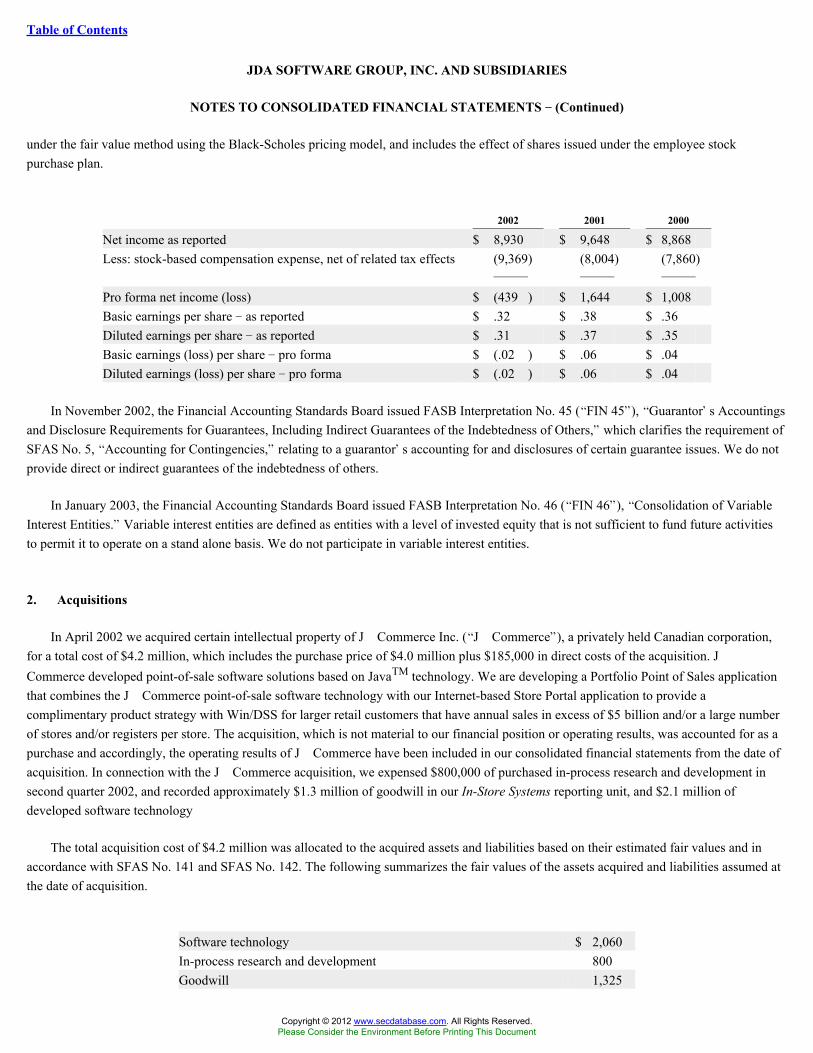
Table of Contents
JDA SOFTWARE GROUP, INC. AND SUBSIDIARIES
NOTES TO CONSOLIDATED FINANCIAL STATEMENTS �� (Continued)
under the fair value method using the Black-Scholes pricing model, and includes the effect of shares issued under the employee stockpurchase plan.
2002 2001 2000
Net income as reported $ 8,930 $ 9,648 $ 8,868Less: stock-based compensation expense, net of related tax effects (9,369) (8,004) (7,860)
Pro forma net income (loss) $ (439 ) $ 1,644 $ 1,008Basic earnings per share � as reported $ .32 $ .38 $ .36Diluted earnings per share � as reported $ .31 $ .37 $ .35Basic earnings (loss) per share � pro forma $ (.02 ) $ .06 $ .04Diluted earnings (loss) per share � pro forma $ (.02 ) $ .06 $ .04
In November 2002, the Financial Accounting Standards Board issued FASB Interpretation No. 45 (�FIN 45�), �Guarantor�s Accountingsand Disclosure Requirements for Guarantees, Including Indirect Guarantees of the Indebtedness of Others,� which clarifies the requirement ofSFAS No. 5, �Accounting for Contingencies,� relating to a guarantor�s accounting for and disclosures of certain guarantee issues. We do notprovide direct or indirect guarantees of the indebtedness of others.
In January 2003, the Financial Accounting Standards Board issued FASB Interpretation No. 46 (�FIN 46�), �Consolidation of VariableInterest Entities.� Variable interest entities are defined as entities with a level of invested equity that is not sufficient to fund future activitiesto permit it to operate on a stand alone basis. We do not participate in variable interest entities.
2. Acquisitions
In April 2002 we acquired certain intellectual property of J � Commerce Inc. (�J � Commerce�), a privately held Canadian corporation,for a total cost of $4.2 million, which includes the purchase price of $4.0 million plus $185,000 in direct costs of the acquisition. J �Commerce developed point-of-sale software solutions based on JavaTM technology. We are developing a Portfolio Point of Sales applicationthat combines the J � Commerce point-of-sale software technology with our Internet-based Store Portal application to provide acomplimentary product strategy with Win/DSS for larger retail customers that have annual sales in excess of $5 billion and/or a large numberof stores and/or registers per store. The acquisition, which is not material to our financial position or operating results, was accounted for as apurchase and accordingly, the operating results of J � Commerce have been included in our consolidated financial statements from the date ofacquisition. In connection with the J � Commerce acquisition, we expensed $800,000 of purchased in-process research and development insecond quarter 2002, and recorded approximately $1.3 million of goodwill in our In-Store Systems reporting unit, and $2.1 million ofdeveloped software technology
The total acquisition cost of $4.2 million was allocated to the acquired assets and liabilities based on their estimated fair values and inaccordance with SFAS No. 141 and SFAS No. 142. The following summarizes the fair values of the assets acquired and liabilities assumed atthe date of acquisition.
Software technology $ 2,060In-process research and development 800Goodwill 1,325
Copyright © 2012 www.secdatabase.com. All Rights Reserved.Please Consider the Environment Before Printing This Document

Total acquisition cost of J � Commerce 4,185Accruals for direct costs related to the acquisition (15 )
Total cash expended to acquire J � Commerce $ 4,170
E3 Corporation. In September 2001 we completed the acquisition of E3 Corporation (�E3�) for a total cost of $60.1 million, whichincludes $20 million in cash and the exchange of 1,600,080 shares of our unregistered common stock
62
Copyright © 2012 www.secdatabase.com. All Rights Reserved.Please Consider the Environment Before Printing This Document

Table of Contents
JDA SOFTWARE GROUP, INC. AND SUBSIDIARIES
NOTES TO CONSOLIDATED FINANCIAL STATEMENTS �� (Continued)
for all of the outstanding stock of E3 held by the former shareholders of E3, as well as $5.4 million in fees and direct costs associated with theacquisition and $10.5 million in restructuring costs to exit certain activities of E3. The measurement date for the acquisition was September 4,2001. That is the date that the significant terms of the transaction were agreed to, including the amount of consideration to be exchanged, andthe number of shares to be issued was known and would not change. In accordance with paragraph 4 of Financial Accounting Standards BoardEmerging Issues Task Force Issue No. 99-12 (�EITF No. 95-12�), Accounting for Formula Arrangements under Issue No. 95-19, the stockconsideration was valued at $17.86833 per share, which represents the average stock price for the three trading days prior to the measurementdate (August 29-31, 2001) and three trading days after the measurement date (September 4-6, 2001). September 1-3, 2001 fell over the LaborDay Holiday weekend and were not trading days. The shares issued to acquire E3 were issued in a private transaction and were not subject toimmediate registration rights. The former E3 shareholders received contractual rights to cause us to register up to 800,040, or 50% of theunregistered shares beginning December 8, 2001, subject to certain limitations. The per share consideration for these restricted shares wasreduced by a 30% valuation adjustment for the trading restrictions attached to the stock. The former E3 shareholders also received the right toinclude their shares in any registration initiated by us. The acquisition was accounted for as a purchase, and accordingly, the operating resultsof E3 have been included in our consolidated financial statements from the date of acquisition.
The E3 product suite included inventory optimization systems such as E3Trim, a warehouse and distribution center forecasting andreplenishment solution, and E3Slim, a store level forecasting and replenishment solution; advanced analytic solutions such as ConsumerOutlook!, a data mining application for consumer behavior patterns, and Pin Point!, an application that refines seasonal profile assignments;and certain collaborative planning, forecasting and replenishment (�CPFR�) solutions, which today include 136 trading partners worldwidethat are live and operational on applications that enable manufacturers, distributors and retailers to work from a single, shared demandforecast. We believe that due to the acquisition of E3 in 2001, we are now the leading provider of inventory replenishment solutions toretailers and their suppliers. Importantly, nearly 80% of E3�s client base is non-retail and we have accelerated our CPFR initiatives by gainingan immediate presence in the wholesale and distribution industries that we had already targeted for growth.
The total acquisition cost of $60.1 million was allocated to the acquired assets and liabilities based on their fair values and in accordancewith SFAS No. 141 and SFAS No. 142. The following summarizes the fair values of the assets acquired and liabilities assumed at the date ofacquisition.
Current assets acquired $ 14,036Fixed assets acquired 2,402Software technology 12,600Customer lists 22,100Trademarks 3,300In-process research and development 2,200Goodwill 35,350
Total assets acquired 91,988Current liabilities assumed or incurred for exit activities and direct
costs of the acquisition (12,906)Deferred revenue (2,205 )Long-term debt assumed (1,627 )Deferred tax liability, net (15,164)
Total liabilities assumed (31,902)
Copyright © 2012 www.secdatabase.com. All Rights Reserved.Please Consider the Environment Before Printing This Document

Net assets acquired $ 60,086
63
Copyright © 2012 www.secdatabase.com. All Rights Reserved.Please Consider the Environment Before Printing This Document

Table of Contents
JDA SOFTWARE GROUP, INC. AND SUBSIDIARIES
NOTES TO CONSOLIDATED FINANCIAL STATEMENTS �� (Continued)
The allocated value for IPR&D of $2.2 million was expensed at the date of acquisition. The trademarks recorded in this transaction haveindefinite useful lives that extend beyond the foreseeable future. The values allocated to goodwill and trademarks will not be amortized but aresubject to annual impairment tests (see Note 6).
In conjunction with the E3 acquisition, we recorded initial acquisition reserves of approximately $14.6 million for restructuring costs toexit the activities of E3 and other direct costs associated with the acquisition. These costs related primarily to facility closures, employeeseverance, investment banker fees, and legal and accounting costs. We subsequently increased the purchase price and the E3 acquisitionreserves by $1.3 million during 2002 based on our revised estimates of the restructuring costs to exit the activities of E3 and the other directcosts of the acquisition. The remaining acquisition reserves, which are included in accrued expenses and other liabilities on the balance sheet,were approximately $1.2 million and $8.5 million at December 31, 2002 and December 31, 2001, respectively.
Cash charges and adjustments recorded against the reserves are as follows:
Balance at Balance at
Initial Cash December 31, Cash Adjustments to December 31,
Description of Charge Reserve Charges 2001 Charges Reserve 2002
Restructuring charges underEITF 95-3:
Facility termination and subleasecosts $ 4,689 $ (305 ) $ 4,384 $ (4,735) $ 1,129 $ 778
Employee severance andtermination benefits 4,351 (997 ) 3,354 (3,118) 184 420
Termination payments todistributors 500 (95 ) 405 (5 ) (400 ) �
E3 user group and trade showcancellation fees 84 (72 ) 12 � (12 ) �
Direct costs under SFAS 141:Legal and accounting costs 2,344 (2,024) 320 (685 ) 407 42Investment banker fees 2,119 (2,119) � � � �
Due diligence fees and expenses 350 (336 ) 14 (40 ) 26 �
Filing fees, appraisal services andtransfer taxes 110 (100 ) 10 � (10 ) �
Total $ 14,547 $ (6,048) $ 8,499 $ (8,583) $ 1,324 $ 1,240
The facility termination and sublease costs are costs of a plan to exit an activity of an acquired company as described in FinancialAccounting Standards Board Emerging Issues Task Force Issue No. 95-3 (�EITF No. 95-3�), Recognition of Liabilities in Connection with aPurchase Business Combination, and include the estimated costs of management�s plan to shut down nine offices of E3 shortly after theacquisition date. These costs have no future economic benefit to the Company and are incremental to the other costs incurred by the Companyor E3. Immediately following the consummation of the E3 acquisition, the Company engaged real estate advisers and began the necessaryactivities to shut down the offices and sublet the locations or negotiate early termination agreements with the various landlords. The mostsignificant E3 facility (the former Corporate Headquarters) was difficult to sublet and in July 2002 we settled with the landlord by paying a$3.4 million lease termination fee. This resulted in a $950,000 adjustment to the facility termination and sublease costs acquisition reserve.
Copyright © 2012 www.secdatabase.com. All Rights Reserved.Please Consider the Environment Before Printing This Document

The remaining amounts in this reserve are being paid out as the leases and related subleases run through their remaining terms, ranging from 7to 10 months.
Employee severance and termination benefits are costs resulting from a plan to involuntarily terminate employees from an acquiredcompany as described in EITF No. 95-3. As of the consummation date of the acquisition, executive management approved a plan toinvoluntarily terminate approximately 31% of the 338 full time employees of E3. In the first three months following the consummation of theE3 acquisition, management completed the assessment of which employees would be involuntarily terminated and communicated thetermination arrangements to the affected employees in accordance with statutory requirements of the local jurisdictions in which theemployees were located. We expect all amounts for these exit costs to be paid out before June 30, 2003.
64
Copyright © 2012 www.secdatabase.com. All Rights Reserved.Please Consider the Environment Before Printing This Document

Table of Contents
JDA SOFTWARE GROUP, INC. AND SUBSIDIARIES
NOTES TO CONSOLIDATED FINANCIAL STATEMENTS �� (Continued)
The following pro forma consolidated results of operations for the years ended December 31, 2001 and 2000 assume the E3 acquisitionoccurred as of January 1st of each year. The pro forma results are not necessarily indicative of the actual results that would have occurred hadthe acquisition been completed as of the beginning of each of the periods presented, nor are they necessarily indicative of future consolidatedresults.
Year Ended December 31,
2001 2000
Total revenues $ 224,782 $ 196,305Net income (loss) $ (2,679 ) $ (5,971 )Basic earnings (loss) per share $ (.11 ) $ (.23 )Diluted earnings (loss) per share $ (.11 ) $ (.23 )
Zapotec Software, Inc. In February 2001 we acquired certain assets of Zapotec Software, Inc. (�Zapotec�) for $1.2 million in cash, andassumed certain trade and other liabilities, and specific acquisition related liabilities for consulting and maintenance obligations underassumed contracts. Zapotec�s primary product, ProMax, was a software solution that enabled retailers, suppliers and distributors to managetheir trade allowance and promotional programs by automating the contract fulfillment, claim generation and accounts receivable process. Inaddition to ProMax, we acquired Zapotec�s Ad Plan application. The Ad Plan technology is serving as the basis for our development of aMarketing Expense Management (�MEM�) application. As designed, MEM will be a vertical Web portal that will integrate advertising andpromotional planning and enable collaborative budgeting, secondary research, media buying, merchandise content and trade allowancetracking within a community of resellers, suppliers, advertising agencies and media companies. The acquisition was accounted for as apurchase, and accordingly, the operating results of Zapotec have been included in our consolidated financial statements from the date ofacquisition. The following summarizes the fair values of the assets acquired and liabilities assumed at the date of acquisition.
Current assets acquired $ 14Software technology 1,143Customer lists 55Assembled workforce 85Trademarks 10In-process research and development 161
Total assets acquired 1,468Current liabilities assumed (218 )
Total liabilities assumed (218 )
Net assets acquired $ 1,250
The allocated value for IPR&D of $161,000 was expensed at the date of acquisition. Amortization on the assembled workforce intangiblerecorded in this transaction ceased on December 31, 2001 and the unamortized balance of $58,000 was reclassified to goodwill in 2002.
The following pro forma consolidated results of operations for the years ended December 31, 2001 and 2000 assume the Zapotecacquisition occurred as of January 1st of each year. The pro forma results are not necessarily indicative of the
Copyright © 2012 www.secdatabase.com. All Rights Reserved.Please Consider the Environment Before Printing This Document

65
Copyright © 2012 www.secdatabase.com. All Rights Reserved.Please Consider the Environment Before Printing This Document

Table of Contents
JDA SOFTWARE GROUP, INC. AND SUBSIDIARIES
NOTES TO CONSOLIDATED FINANCIAL STATEMENTS �� (Continued)
actual results that would have occurred had the acquisition been completed as of the beginning of each year presented, nor are they necessarilyindicative of future consolidated results.
Year Ended December 31,
2001 2000
Total revenues $ 206,923 $ 172,517Net income $ 9,532 $ 6,899Basic earnings per share $ .38 $ .28Diluted earnings per share $ .37 $ .27
NeoVista Decision Series. In June 2001 we acquired certain assets of Accrue Software, Inc. (�Accrue�) for $4.9 million in cash. Theacquired assets include the NeoVista Decision Series (�Decision Series�), a comprehensive, enterprise-level data mining toolset that enablesretailers to design and build applications that identify buying patterns and predictive relationships in their business activity, and which are nowmarketed as modules of Intellect. In addition to Decision Series, we acquired the RDS-Assort and RDS-Profile products, which are nowmarketed as Channel Clustering by Intellect and Seasonal Profiling by Intellect, respectively. The acquisition was accounted for as a purchase,and accordingly, the operating results of the acquired assets have been included in our consolidated financial statements from the date ofacquisition. Pro forma operating results have not been presented, as the effect of the acquisition is not material to our consolidated financialstatements. The following summarizes the fair values of the assets acquired and liabilities assumed at the date of acquisition.
Fixed assets acquired $ 5Software technology 2,500Customer lists 200Assembled workforce 256Goodwill 2,727
Total assets acquired 5,688Current liabilities assumed (750 )
Total liabilities assumed (750 )
Net assets acquired $ 4,938
Amortization on goodwill and the assembled workforce intangible recorded in this transaction ceased on December 31, 2001. Theunamortized balance of $213,000 on the assembled workforce intangible was reclassified to goodwill in 2002.
Intactix International, Inc. In April 2000, we completed the acquisition of Intactix International, Inc. (�Intactix�) for a total cost of$25.0 million including $20.5 million in cash to the former owner, Pricer AB, and $4.5 million in direct costs and restructuring charges relatedto the transaction. Intactix is a leading provider of space management solutions for the retail industry and its suppliers. The acquisition wasaccounted for as a purchase, and accordingly, the operating results of Intactix have been included in our consolidated financial statementsfrom the date of acquisition.
Copyright © 2012 www.secdatabase.com. All Rights Reserved.Please Consider the Environment Before Printing This Document

The purchase price of $25.0 million was allocated to the acquired assets and liabilities based on their fair market values. The acquisitionresulted in an excess of acquired net assets over cost. This excess has been allocated to reduce
66
Copyright © 2012 www.secdatabase.com. All Rights Reserved.Please Consider the Environment Before Printing This Document

Table of Contents
JDA SOFTWARE GROUP, INC. AND SUBSIDIARIES
NOTES TO CONSOLIDATED FINANCIAL STATEMENTS �� (Continued)
proportionately the values assigned to certain intangible assets in determining their fair values. The following summarizes the fair values ofthe assets acquired and liabilities assumed at the date of acquisition.
Current assets acquired $ 8,907Fixed assets acquired 508Software technology 10,418Customer lists 10,793Assembled workforce 1,520Trademarks 474In-process research and development 200
Total assets acquired 32,820Current liabilities incurred for exit activities and direct costs of the
acquisition (7,859 )
Total liabilities assumed (7,859 )
Net assets acquired $ 24,961
The allocated value for IPR&D of $200,000 was expensed at the date of acquisition. Amortization on the assembled workforce intangiblerecorded in this transaction ceased on December 31, 2001 and the unamortized balance of $634,000 was reclassified to goodwill in 2002.
The following pro forma consolidated results of operations for the year ended December 31, 2000 assumes the Intactix acquisitionoccurred as of January 1, 2000. The pro forma results are not necessarily indicative of the actual results that would have occurred had theacquisition been completed as of the beginning of the period presented, nor are they necessarily indicative of future consolidated results.
2000
Total revenues $ 177,966Net income (loss) $ 8,193Basic earnings (loss) per share $ .34Diluted earnings (loss) per share $ .32
67
Copyright © 2012 www.secdatabase.com. All Rights Reserved.Please Consider the Environment Before Printing This Document

Table of Contents
JDA SOFTWARE GROUP, INC. AND SUBSIDIARIES
NOTES TO CONSOLIDATED FINANCIAL STATEMENTS �� (Continued)
3. Marketable Securities
All marketable securities held at December 31, 2002 have contractual maturities of one year or less. Expected maturities could differ fromcontractual maturities as borrowers may have the right to call or prepay obligations with or without call or prepayment penalties. Theamortized cost, gross unrealized gains and losses and fair value of marketable securities at December 31, 2002 and 2001 are as follows:
Gross Gross
Amortized Unrealized Unrealized Market
Cost Gains Losses Value
2002U.S. Government agencies $ 18,881 $ 66 $ � $ 18,947Corporate 11,858 7 22 11,843
Marketable securities $ 30,739 $ 73 $ 22 $ 30,790
2001U.S. Government agencies $ 6,219 $ 19 $ 2 $ 6,236Corporate 5,913 3 12 5,904
Marketable securities $ 12,132 $ 22 $ 14 $ 12,140
4. Accounts Receivable, Net
At December 31, 2002 and 2001 accounts receivable consist of the following:
2002 2001
Trade receivables $ 53,077 $ 65,914Less allowance for doubtful accounts (6,000 ) (4,971 )
Total $ 47,077 $ 60,943
A summary of changes in the allowance for doubtful accounts for the three-year period ended December 31, 2002 is as follows:
2002 2001 2000
Balance at beginning of period $ 4,971 $ 5,954 $ 3,635Provision for doubtful accounts 2,900 4,884 3,242Deductions, net (1,871) (5,867) (923 )
Balance at end of period $ 6,000 $ 4,971 $ 5,954
Copyright © 2012 www.secdatabase.com. All Rights Reserved.Please Consider the Environment Before Printing This Document

68
Copyright © 2012 www.secdatabase.com. All Rights Reserved.Please Consider the Environment Before Printing This Document

Table of Contents
JDA SOFTWARE GROUP, INC. AND SUBSIDIARIES
NOTES TO CONSOLIDATED FINANCIAL STATEMENTS �� (Continued)
5. Property and Equipment, Net
At December 31, 2002 and 2001 property and equipment consist of the following:
2002 2001
Computers, furniture & fixtures $ 52,116 $ 45,550Land and buildings 3,058 2,766Automobiles 248 476Leasehold improvements 6,088 4,756
61,510 53,548Less accumulated depreciation and amortization (40,173) (31,598)
$ 21,337 $ 21,950
6. Goodwill and Other Intangibles, Net
We adopted SFAS No. 141 effective January 1, 2002. In addition to requiring that the purchase method of accounting be used for allbusiness combinations initiated after June 30, 2001, SFAS No. 141 also provides guidance on the types of acquired intangible assets that are tobe recognized and reported separately from goodwill. We reclassified the unamortized balance of our assembled workforce asset ofapproximately $905,000 to goodwill on January 1, 2002 pursuant to certain transitional provisions of SFAS No. 141 that apply to the businesscombinations we completed and accounted for under the purchase method prior to July 1, 2001.
We also adopted SFAS No. 142 effective January 1, 2002. SFAS No. 142 addresses how intangible assets should be accounted for afterthey have been initially recognized in the financial statements. SFAS No. 142 also requires that goodwill and certain other intangible assetswith indefinite useful lives no longer be amortized, but instead be tested for impairment at least annually. Upon adoption, we ceasedamortization of goodwill and certain other intangible assets we recorded in business combinations prior to June 30, 2001.
At December 31, 2002 and 2001 goodwill and other intangible assets consist of the following:
December 31, 2002 December 31, 2001
Gross Carrying Accumulated Gross Carrying Accumulated
Amount Amortization Amount Amortization
Goodwill $ 59,801 � $ 55,192 �
Other intangibles:Amortized intangible assets
Customer Lists 36,348 (5,897 ) 36,348 (3,048)Software technology 31,721 (9,237 ) 30,496 (5,826)
Unamortized intangible assetsTrademarks 3,700 � 3,784 (84 )
Copyright © 2012 www.secdatabase.com. All Rights Reserved.Please Consider the Environment Before Printing This Document

71,769 (15,134) 70,628 (8,958)
$ 131,570 $ (15,134) $ 125,820 $ (8,958)
During the year ended December 31, 2002, we recorded $1.3 million in goodwill in connection with our acquisition of certain intellectualproperty of J � Commerce Inc. We also recorded an additional $3.3 million in goodwill during 2002 as a result of certain adjustments made tothe estimated fair values of assets and liabilities assumed in the acquisition of E3 and a reduction in the amount of deferred tax asset recordedon this transaction to reflect our revised estimate of the anticipated future tax benefits from acquisition costs incurred and research anddevelopment credits. No goodwill was
69
Copyright © 2012 www.secdatabase.com. All Rights Reserved.Please Consider the Environment Before Printing This Document

Table of Contents
JDA SOFTWARE GROUP, INC. AND SUBSIDIARIES
NOTES TO CONSOLIDATED FINANCIAL STATEMENTS �� (Continued)
impaired or written-off during the year ended December 31, 2002. As of December 31, 2002, goodwill has been allocated to our reportingunits as follows: $42.1 million to Retail Enterprise Systems, $1.3 million to In-Store Systems, and $16.4 million to Collaborative Solutions.
SFAS No. 142 required that we test goodwill for impairment as of January 1, 2002 and any resulting impairment charge be reflected as acumulative effect of a change in accounting principle. We completed the initial test for goodwill impairment during the three-month periodended March 31, 2002 and completed our annual test for goodwill impairment during fourth quarter 2002. We found no indication ofimpairment of the goodwill allocated to the individual reporting units. Accordingly, absent future indications of impairment, the next annualimpairment test will be performed in fourth quarter 2003.
We reassessed the useful lives of intangible assets other than goodwill during the three-months period ended March 31, 2002 and duringfourth quarter 2002. Except for trademarks, no adjustments have been made to the useful lives of our intangible assets. Substantially all of ourcapitalized trademarks were acquired in connection with the acquisition of E3. We do not believe the expected useful life of the E3 trademarksis directly tied to another asset or group of assets; however, we did acquire software technology and customer lists in connection with the E3acquisition. Although the underlying software technology and customer install-base may change and evolve over time, we intend toindefinitely develop next generation products under the E3 trademark. Beginning January 1, 2002, we assigned indefinite useful lives to ourE3 trademarks, and ceased amortization, as we believe there are no legal, regulatory, contractual, competitive, economic, or other factors thatwould limit the useful life of our trademarks and we expect the trademarks to contribute to our cash flows indefinitely. In accordance withSFAS No. 142, we completed an initial impairment test on trademarks during the three-month period ended March 31, 2002 and our annualtest for impairment during fourth quarter 2002. We found no indication of impairment during the year ended December 31, 2002.Accordingly, absent future indications of impairment, the next annual impairment test will be performed in fourth quarter 2003.
In fourth quarter 2002, we reviewed the customer attrition rates for each significant acquired customer group to ensure that the rate ofattrition is not increasing and that revisions to our estimates of life expectancy for our customer lists are not required.
Amortization expense for the three years ended December 31, 2002 was $7.1 million, $8.5 million and $6.5 million, respectively, and isshown as separate line items in the consolidated statements of income within cost of revenues and operating expenses. We expect amortizationexpense for the next five years to be as follows:
2003 $ 7,1222004 $ 7,1222005 $ 6,8722006 $ 6,6942007 $ 5,533
70
Copyright © 2012 www.secdatabase.com. All Rights Reserved.Please Consider the Environment Before Printing This Document

Table of Contents
JDA SOFTWARE GROUP, INC. AND SUBSIDIARIES
NOTES TO CONSOLIDATED FINANCIAL STATEMENTS �� (Continued)
The following table reconciles net income and earnings per share as reported for years ended December 31, 2002, 2001 and 2000 to netincome and earnings per share as adjusted to exclude amortization expense, net of taxes, related to goodwill and other intangible assets thatare no longer being amortized.
For the year ended December 31,
2002 2001 2000
Reconciliation of reported net income:Reported net income $ 8,930 $ 9,648 $ 8,868Pro forma amortization adjustments:
Goodwill � 1,970 1,768Assembled workforce � 513 539Trademarks � 31 22
Adjusted net income $ 8,930 $ 12,162 $ 11,197
Basic earnings per share:Reported net income $ .32 $ .38 $ .36Pro forma amortization adjustments:
Goodwill � .08 .08Assembled workforce � .02 .02Trademarks � � �
Adjusted net income $ .32 $ .48 $ .46
Diluted earnings per share:Reported net income $ .31 $ .37 $ .35Pro forma amortization adjustments:
Goodwill � .08 .07Assembled workforce � .02 .02Trademarks � � �
Adjusted net income $ .31 $ .47 $ .44
Shares used to compute:Basic earnings per share 28,047 25,316 24,315Diluted earnings per share 29,074 25,757 25,431
7. Promissory Note Receivable
In May 2001, we entered into a secured promissory note agreement with Silvon Software, Inc. (�Silvon�) under which we agreed to loanSilvon $3.5 million. We license certain applications from Silvon for use in our IDEAS product. The loan is collateralized by a first prioritysecurity interest in all of Silvon�s intellectual property and a subordinated security interest in accounts receivable and all other assets. Thepromissory note bears interest at prime plus 1.5 percentage points, which is payable monthly. The agreement provides for periodic payments
Copyright © 2012 www.secdatabase.com. All Rights Reserved.Please Consider the Environment Before Printing This Document

towards the principle balance through the retention of a portion of the royalties we owe Silvon from sales of the IDEAS product, with anyremaining accrued and unpaid interest and principle due and payable on May 8, 2004.
71
Copyright © 2012 www.secdatabase.com. All Rights Reserved.Please Consider the Environment Before Printing This Document

Table of Contents
JDA SOFTWARE GROUP, INC. AND SUBSIDIARIES
NOTES TO CONSOLIDATED FINANCIAL STATEMENTS �� (Continued)
8. Accrued Expenses and Other Liabilities
At December 31, 2002 and 2001, accrued expenses and other liabilities consist of the following:
2002 2001
Accrued compensation and benefits $ 13,127 $ 16,698Restructuring and asset disposition charges 3,577 184Accrued sales, VAT and property taxes 2,771 2,503Acquisition reserves 1,240 8,743Other accrued expenses 6,242 4,835
Total $ 26,957 $ 32,963
9.Restructuring, Asset Disposition and Other Merger Related Charges and Relocation Costs to Consolidate Development andSupport Activities
In second quarter 2002 we recorded a $1.3 million restructuring charge for a workforce reduction of 53 full-time employees, primarily inthe consulting services function in the Americas and Europe. All workforce reductions associated with this charge were made on or beforeJune 30, 2002. All employees potentially impacted by this restructuring were notified of the plan of termination and the related benefits on orbefore June 30, 2002.
In fourth quarter 2002, we recorded another restructuring charge of $5.0 million for termination and office closure costs associated withthe reorganization of the Company to implement the Customer Value Program initiative (�CVP�). The implementation of CVP will allow usto reallocate our resources in response to a fundamental shift in the way we develop product and bring it to market, as well as to changes in thedemand for the various types of products we sell, the length of implementation efforts required and associated skill requirements. In addition,the related workforce reduction will enable us to better align our cost structure during the current economic downturn, which has adverselyimpacted our revenues, elongated our selling cycles, and delayed, suspended or reduced the demand for certain of our products. Thereorganization will result in the consolidation of nearly all product development activities at our corporate headquarters, a workforce reductionof approximately 230 full-time employees (�FTE�) and certain office closures. The workforce reduction includes certain employees involvedin product development (73 FTE) and client support services (28 FTE) who choose not to relocate, and reductions in consulting servicespersonnel (66 FTE), sales and marketing personnel (37 FTE), and administrative functions (26 FTE). We currently expect to hire replacementsfor approximately 34 FTE in product development and client support services to replace those individuals who choose not to relocate to ourcorporate headquarters. We expect to reduce our annual fixed operating costs by approximately $10 million to $12 million through thisreorganization and restructuring effort. All employees potentially impacted by this reorganization initiative were notified of the plan oftermination and the related benefits on or before December 31, 2002. Office closure costs pertain to certain US, Latin America, and Europeanoffices that were either under-performing or became redundant with the relocation initiatives.
We also incurred $452,000 in costs through December 31, 2002, in connection with CVP, to relocate certain product development andclient support services employees based in offices around the United States and the United Kingdom to our corporate headquarters, and weexpect to incur an additional $1.7 million to $1.8 million in relocation costs during 2003 to complete this consolidation. The relocation costswill be reported in income from continuing operations as they are incurred.
72
Copyright © 2012 www.secdatabase.com. All Rights Reserved.Please Consider the Environment Before Printing This Document

Copyright © 2012 www.secdatabase.com. All Rights Reserved.Please Consider the Environment Before Printing This Document

Table of Contents
JDA SOFTWARE GROUP, INC. AND SUBSIDIARIES
NOTES TO CONSOLIDATED FINANCIAL STATEMENTS �� (Continued)
A summary of the 2002 restructuring and asset disposition charges is as follows:
Initial Cash Loss on disposal Balance at
Description of the charge Reserve Charges of assets December 31, 2002
Severance, benefits and related legal costs $ 5,110 $ (2,541) $ � $ 2,569Office closure costs 1,083 (28 ) (47) 1,008Other Charges 94 (94 ) � �
Total $ 6,287 $ (2,663) $ (47) $ 3,577
The unpaid balance of severance, benefits and related legal costs pertains primarily to termination agreements with foreign employees thatare either being disputed or are required to be paid out over a period of time under local law. We expect these amounts to be paid out in 2003.The remaining amounts in the reserve for office closure costs are being paid out as the leases and related subleases run through their remainingterms ranging from 7 to 10 months.
During 2001, we recorded restructuring, asset disposition and other merger related charges of $749,000 in first quarter 2001 and anadditional $236,000 in fourth quarter 2001. The restructuring initiatives involved a workforce reduction of 41 full-time employees (�FTE�)including certain employees involved in implementation and maintenance services (17 FTE), product development activities (7 FTE), salesand marketing (10 FTE), and administrative functions (7 FTE), related in part to the acquisition of E3. All workforce reductions associatedwith these charges were made on or before March 31, 2001 or December 31, 2001, as appropriate. Office closure costs pertain to certainEuropean offices that became redundant after the E3 acquisition (See Note 2). Other charges consist of the write-off of certain merger andacquisition costs related to a potential acquisition that was abandoned. A summary of the 2001 restructuring, asset disposition and othermerger related charges is as follows:
Initial Cash Non-cash Balance at Cash Balance at
Description of the charge Reserve Charges Charges December 31, 2001 Charges December 31, 2002
Severance, benefits and related legalcosts $ 727 $ (589) $ � $ 138 $ (138) $ �
Office closure costs 50 � (4) 46 (46 ) �
Other Charges 208 (208) � � � �
Total $ 985 $ (797) $ (4) $ 184 $ (184) $ �
During 2000, we recorded an $828,000 restructuring and asset disposition charge. The charge included $770,000 for severance, benefitsand related legal costs associated with a workforce reduction of 65 full-time employees including certain implementation and maintenanceservice employees (43 FTE), administrative functions in the United States, Europe and Canada (15 FTE) and certain product developmentactivities (7 FTE), and a $58,000 write-down of fixed assets.. All workforce reductions associated with this charge were made on or beforeMarch 31, 2000 and the remaining reserve was fully utilized by June 30, 2000.
73
Copyright © 2012 www.secdatabase.com. All Rights Reserved.Please Consider the Environment Before Printing This Document

Table of Contents
JDA SOFTWARE GROUP, INC. AND SUBSIDIARIES
NOTES TO CONSOLIDATED FINANCIAL STATEMENTS �� (Continued)
10. Deferred Revenue
At December 31, 2002 and 2001, deferred revenue consists of deferrals for software license fees, maintenance, consulting and trainingand other services as follows:
2002 2001
Software $ 1,124 $ 1,166Maintenance 19,060 14,844Consulting 2,335 584Training and other 812 968
$ 23,331 $ 17,562
11. Lease Commitments
Our corporate offices are located in Scottsdale, Arizona, where we lease approximately 121,000 square feet of a 136,000 square footfacility and have expansion rights and a first right of offer on the remaining space. We also use this facility for certain of our sales, marketing,consulting, customer support, training, and product development functions. Our corporate office lease commenced in April 1999 and extendsthrough March 31, 2009. The initial monthly rate of approximately $135,000 will remain in effect for five years. In addition, we lease officespace in the Americas for 14 regional sales and support offices across the United States, Canada and Latin America, and for 17 internationalsales and support offices located in major cities throughout Europe, Asia, Australia, and Japan. We expect to close two of these offices in 2003due to the consolidation of our development activities in Scottsdale, Arizona. These leases are primarily noncancellable operating leases andexpire at various dates through the year 2012. Certain of our office leases contain renewal options. We expect that in the normal course ofbusiness some or all of these leases will be renewed or that suitable additional or alternative space will be available on commerciallyreasonable terms as needed. In addition, we lease various computers, telephone systems, automobiles, and office equipment undernoncancellable leases with terms generally ranging from 36 to 60 months. Certain of the equipment leases contain renewal options and weexpect that in the normal course of business some or all of these leases will be renewed or replaced by other leases.
Rental expense under operating leases was $7.7 million in 2002, $6.8 million in 2001, and $5.7 million in 2000. Future minimum leasepayments under noncancellable operating leases (with minimum or remaining lease terms in excess of one year) at December 31, 2002 are asfollows:
2003 $ 6,8162004 5,4512005 4,9232006 3,5662007 3,167Thereafter 5,907
Total future minimum lease payments $ 29,830
Copyright © 2012 www.secdatabase.com. All Rights Reserved.Please Consider the Environment Before Printing This Document

In connection with the acquisition of E3 we provided reserves for direct costs related to certain sublease obligations on redundantfacilities. At of December 31, 2002, these reserves represent $778,000 of the total minimum lease payments shown above.
12. Legal Proceedings
We are involved in legal proceedings and claims arising in the ordinary course of business. Although there can be no assurance,management does not believe that the disposition of these matters will have a material adverse effect on our business, financial position,results of operations or cash flows.
74
Copyright © 2012 www.secdatabase.com. All Rights Reserved.Please Consider the Environment Before Printing This Document

Table of Contents
JDA SOFTWARE GROUP, INC. AND SUBSIDIARIES
NOTES TO CONSOLIDATED FINANCIAL STATEMENTS �� (Continued)
13. Stockholders�� Equity
Preferred Stock Purchase Rights Plan. We adopted a Preferred Stock Purchase Rights Plan (the �Rights Plan�) in October 1998 designedto deter coercive or unfair takeover tactics and to prevent a person or a group from gaining control of our Company without offering a fairprice to all stockholders.
Under the terms of the Rights Plan, a dividend distribution of one Preferred Stock Purchase Right (�Right�) for each outstanding share ofour common stock was made to holders of record on October 20, 1998. These Rights entitle the holder to purchase one one-hundredth of ashare of our Series A Preferred Stock (�Preferred Stock�) at an exercise price of $100. The Rights become exercisable (a) 10 days after apublic announcement that a person or group has acquired shares representing 15% or more of the outstanding shares of common stock, or(b) 10 business days following commencement of a tender or exchange offer for 15% or more of such outstanding shares of common stock.
We can redeem the Rights for $0.001 per Right at any time prior to their becoming exercisable. The Rights expire on October 1, 2008,unless we redeem them earlier or they are exchanged for common stock. Under certain circumstances, if a person or group acquires 15% ormore of our common stock, the Rights permit stockholders other than the acquirer to purchase common stock having a market value of twicethe exercise price of the Rights, in lieu of the Preferred Stock. In addition, in the event of certain business combinations, the Rights permitstockholders to purchase the common stock of an acquirer at a 50% discount. Rights held by the acquirer will become null and void in bothcases.
Treasury Stock Repurchase Program. In July 2002, our Board of Directors authorized the repurchase of up to two million shares of ouroutstanding common stock. Under this repurchase program, we may periodically repurchase common shares on the open market at prevailingmarket prices during a one-year period ending July 22, 2003. As of December 31, 2002, we have repurchased a total of 100,000 shares of ourcommon stock for $1.1 million under this program.
In October 2000, our Board of Directors authorized a repurchase of up to two million shares of our outstanding common stock on theopen market at prevailing market prices during a one-year period ended October 21, 2001. We repurchased a total of 239,000 shares of ourcommon stock for $2.7 million under this program.
Stock Option Plans
Our 1995 Stock Option Plan (the �1995 Option Plan�) was approved by stockholders and provided for the issuance of up to 2,025,000shares of common stock to employees under incentive and nonstatutory stock option grants. Incentive and nonstatutory stock options weregranted under the 1995 Option Plan at prices not less than the fair market value of the common stock at the date of grant. The optionsgenerally became exercisable over periods ranging from 18 to 48 months, commencing at the date of grant, and expire in ten years. The 1995Option Plan was terminated effective April 24, 2001 except for those provisions necessary to the administration of any outstanding options atthe time of termination. No further grants will be made under the 1995 Option Plan. Accordingly, in 2001 we reduced the number of reservedshares under our stock option plans by the 169,883 unissued shares that expired upon termination of the 1995 Option Plan.
Our 1996 Stock Option Plan (the �1996 Option Plan�) was approved by stockholders and provides for the issuance of common stock toemployees, consultants and directors under incentive and nonstatutory stock option grants. The 1996 Option Plan was amended in November2000 to increase the number of shares of common stock reserved for issuance thereunder from 4,500,000 to 7,000,000 and to establish certaingrant restrictions and limitations that prohibit us from (i) granting more than 1,200,000 shares common stock subject to new options in any12-month period (beginning May 25, 2000, the date of our 2000 Annual Meeting of Stockholders), subject to any stock split, re-capitalization,dividend or related events, (ii) re-pricing any options granted under the 1996 Option Plan, and (iii) granting any options under the 1996 Option
Copyright © 2012 www.secdatabase.com. All Rights Reserved.Please Consider the Environment Before Printing This Document

Plan with an exercise price below fair market value of the common stock at the date of grant. The options granted under the 1996 Option Plangenerally vest over a three or four-year period, commencing at the date of grant, and expire in ten years. Certain options granted to executiveofficers during the year ended December 31, 2002 have shorter vesting periods and provide for accelerated vesting upon a change of control inthe Company�s ownership.
75
Copyright © 2012 www.secdatabase.com. All Rights Reserved.Please Consider the Environment Before Printing This Document

Table of Contents
JDA SOFTWARE GROUP, INC. AND SUBSIDIARIES
NOTES TO CONSOLIDATED FINANCIAL STATEMENTS �� (Continued)
Beginning in January 2003, the standard form of option agreement will be modified to provide for a term equal to the vesting period of theoption plus three years. The 1996 Option Plan has no scheduled termination date.
Our 1996 Outside Director Stock Option Plan (the �1996 Directors Plan�) was approved by stockholders and provides for the issuance ofup to 225,000 shares of common stock to eligible participants under nonstatutory stock option grants. Under the 1996 Directors Plan, outsidedirectors receive a one-time grant to purchase 18,750 shares upon appointment to the Board of Directors, and an annual option grant topurchase 6,000 shares for each year of service thereafter. The nonstatutory stock options may be granted at a price not less than the fair marketvalue of the common stock at the date of grant. The options generally vest over a three-year period commencing at the date of grant, andexpire in ten years. The 1996 Directors Plan has no scheduled termination date.
Our 1998 Nonstatutory Stock Option Plan (the �1998 Option Plan�) has not been approved by stockholders. The 1998 Option Planprovides for the issuance of common stock to employees under nonstatutory stock option grants and permits option grants to executiveofficers under certain conditions. The 1998 Option Plan initially provided for the issuance of 187,500 shares and was subsequently amendedin April 2000 to increase the number of shares of common stock reserves for issuance from 187,500 to 412,500, and in October 2001 toincrease the number of shares of common stock reserved for issuance from 412,500 to 762,500. The nonstatutory stock options may begranted at a price not less than the fair market of our common stock on the date of grant. All options granted through 1999 under the 1998Option Plan were fully vested, immediately exercisable, and expire in ten years. Options granted under the 1998 Option Plan during the three-year period ended December 31, 2002 generally vest over a three to four-year period commencing at the date of grant and expire in ten years.Certain options granted to executive officers during the year ended December 31, 2002 have shorter vesting periods and provide foraccelerated vesting upon a change of control in the Company�s ownership. Beginning in January 2003, the standard form of option agreementwill be modified to provide for a term equal to the vesting period of the option plus three years. The 1998 Option Plan has no scheduledtermination date.
The following summarizes the combined stock option activity during the three-year period ended December 31, 2002:
Options Outstanding
Options
Available for Exercise Price
Grant Shares Per Share
Balance, January 1, 2000. 1,140,358 3,645,033 $ 2.33 to $37.25Increase in reserved shares 2,725,000 � �
Granted (1,584,658) 1,584,658 $ 9.44 to $19.50Cancelled 715,891 (715,891 ) $ 6.44 to $26.96Exercised � (265,673 ) $ 2.83 to $19.54
Balance, December 31, 2000 2,996,591 4,248,127 $ 2.33 to $37.25Increase in reserved shares 350,000 � �
Plan shares expired (169,883 ) � �
Granted (1,429,063) 1,429,063 $ 9.31 to $16.89Cancelled 213,879 (213,879 ) $ 7.88 to $17.19Exercised � (474,418 ) $ 2.33 to $14.63
Balance, December 31, 2001 1,961,524 4,988,893 $ 2.33 to $37.25Increase in reserved shares � � �
Copyright © 2012 www.secdatabase.com. All Rights Reserved.Please Consider the Environment Before Printing This Document

Granted (2,116,200) 2,116,200 $ 8.50 to $28.20Cancelled 501,268 (501,268 ) $ 8.56 to $21.01Exercised � (1,324,768) $ 2.83 to $26.96
Balance, December 31, 2002 346,592 5,279,057 $ 2.33 to $37.25
76
Copyright © 2012 www.secdatabase.com. All Rights Reserved.Please Consider the Environment Before Printing This Document

Table of Contents
JDA SOFTWARE GROUP, INC. AND SUBSIDIARIES
NOTES TO CONSOLIDATED FINANCIAL STATEMENTS �� (Continued)
The following summarizes certain weighted average information on options outstanding at December 31, 2002:
Options Outstanding Options Exercisable
Weighted
Average Weighted Weighted
Remaining Average Average
Number Contractual Exercise Number Exercise
Range of Exercise Prices Outstanding Life (years) Price Exercisable Price
$2.33 to $2.83 7,502 2.75 $ 2.83 7,500 $ 2.83$6.44 to $9.69 976,514 6.43 $ 8.62 885,888 $ 8.62$10.00 to $12.75 2,119,871 7.05 $ 11.19 716,186 $ 11.60$13.14 to $19.54 1,046,101 7.84 $ 15.19 500,228 $ 15.29$20.58 to $37.25 1,129,069 8.35 $ 22.14 203,063 $ 25.23
5,279,057 2,312,865
Employee Stock Purchase Plan
Our 1999 Employee Stock Purchase Plan (�1999 Purchase Plan�) was approved by stockholders. The 1999 Purchase Plan provideseligible employees the ability to purchase our common stock semi-annually at 85% of the lesser of (1) the fair market value on the first day ofthe 24-month offering period, or (2) the fair market value on the last day of each semi-annual purchase period. The 1999 Purchase Planprovides for the initial issuance of 750,000 shares with an automatic annual increase, beginning August 1, 2000 through August 1, 2009, equalto the lesser of 750,000 shares or such lesser amount of shares as determined by the Board. The shares reserved for issuance under the 1999Purchase Plan were increased by 750,000 shares in both August 2001 and August 2002. During 2000, 359,171 shares were purchased at pricesranging from $8.02 to $13.12. During 2001, 391,602 shares were purchased at prices ranging from $8.02 to $11.05. During 2002, 335,985shares were purchased at prices ranging from $10.64 to $17.40.
In January 2002 the Securities and Exchange Commission adopted new rules for the disclosure of equity compensation plans. Thepurpose of the new rules is to summarize the potential dilution that could occur from past and future equity grants under all equitycompensation plans. The following provides tabular disclosure of the number of securities to be issued upon the exercise of outstandingoptions, the weighted average exercise price of outstanding options, and the number of securities remaining available for future issuance underequity compensation plans, aggregated into two categories � plans that have been approved by stockholders and plans that have not:
Number of Number of securities
securities to be remaining available
issued upon Weighted-average for future issuance
exercise of exercise price of under equity
Equity Compensation Plans outstanding options outstanding options compensation plans
Approved by stockholders:1995 Option Plan 7,502 $ 2.833 �
1996 Option Plan 4,651,918 $ 13.66 210,8761996 Directors Plan 115,480 $ 20.31 69,417
Copyright © 2012 www.secdatabase.com. All Rights Reserved.Please Consider the Environment Before Printing This Document

1999 Purchase Plan � � 1,163,242
4,774,900 $ 13.80 1,443,535Not approved by stockholders:
1998 Option Plan 504,157 $ 14.12 66,299
5,279,057 $ 13.84 1,509,834
77
Copyright © 2012 www.secdatabase.com. All Rights Reserved.Please Consider the Environment Before Printing This Document

Table of Contents
JDA SOFTWARE GROUP, INC. AND SUBSIDIARIES
NOTES TO CONSOLIDATED FINANCIAL STATEMENTS �� (Continued)
The following table presents pro forma net income and basic and diluted earnings per share as if compensation expense had beenrecognized for stock options granted in the three-year period ended December 31, 2002, as determined under the fair value method using theBlack-Scholes options pricing model, and includes the effect of shares issued under the employee stock purchase plan. Option valuationmodels such as the Black-Scholes model require the input of highly subjective assumptions. Because our employee stock options havecharacteristics significantly different from those of traded options, and because changes in the subjective input assumptions can materiallyaffect the fair value estimate, in management�s opinion, the existing models do not necessarily provide a reliable single measure of the fairvalue of its employee stock options. At December 31, 2002, more than 80% of the outstanding options had exercise prices above the marketvalue. The pro forma effect on net income of Statement No. 123 is not representative of the pro forma effect on net income in future years.The weighted average Black-Scholes value per option granted in 2002, 2001 and 2000 was $9.10, $7.50 and $7.67, respectively.
2002 2001 2000
Net income as reported $ 8,930 $ 9,648 $ 8,868Less: stock-based compensation expense, net of related
tax effects (9,369 ) (8,004 ) (7,860 )
Pro forma net income (loss) $ (439 ) $ 1,644 $ 1,008Basic earnings per share � as reported $ .32 $ .38 $ .36Diluted earnings per share � as reported $ .31 $ .37 $ .35Basic earnings (loss) per share � pro forma $ (.02 ) $ .06 $ .04Diluted earnings (loss) per share � pro forma $ (.02 ) $ .06 $ .04Assumptions:Expected dividend yield 0 % 0 % 0 %Expected stock price volatility 93 % 81 % 86 %Risk-free interest rate 2.25 % 3.85 % 5.30 %Expected life of option 2.96 years 3.13 years 3.18 years
No expense has been recognized for stock-based compensation in the three years ended December 31, 2002 as the underlying stockoptions were granted at current market prices.
During the three years ended December 31, 2002, certain employees exercised options or sold stock acquired under the stock purchaseplan in disqualifying dispositions that resulted in deductions for income tax purposes. Our tax liability for 2002, 2001, and 2000 was reducedby $5,770,000, $907,000, and $329,000, respectively, to give effect to these dispositions with an offsetting credit to additional paid-in capital.
14. Employee Benefit Plans
We have adopted a defined contribution plan under Section 401(k) of the Internal Revenue Code covering all eligible employees (�401(k)Plan�). Eligible participants may contribute up to $11,000 or 20% of their total compensation, whichever is lower. We provide matchingcontributions to the 401(k) Plan in amounts determined by the Board of Directors. Participants will be immediately vested in their personalcontributions and over a five year graded schedule for amounts we contribute. We made matching contributions to the 401(k) Plan of$489,000, $362,000, and $313,000 in 2002, 2001 and 2000, respectively.
15. Income Taxes
Copyright © 2012 www.secdatabase.com. All Rights Reserved.Please Consider the Environment Before Printing This Document

The provision for income taxes includes income taxes currently payable and those deferred due to temporary differences between thefinancial statement and tax bases of assets and liabilities that will result in taxable or deductible
78
Copyright © 2012 www.secdatabase.com. All Rights Reserved.Please Consider the Environment Before Printing This Document

Table of Contents
JDA SOFTWARE GROUP, INC. AND SUBSIDIARIES
NOTES TO CONSOLIDATED FINANCIAL STATEMENTS �� (Continued)
amounts in the future. The components of the provision for income taxes included in the Consolidated Statements of Income are as follows:
2002 2001 2000
Current taxes:Federal and state $ 5,534 $ 2,440 $ 4,123Foreign 1,773 1,502 425
Total current taxes 7,307 3,942 4,548Deferred taxes (6,271) 1,159 1,051
Provision for income taxes $ 1,036 $ 5,101 $ 5,599
The primary reason for the deferred tax benefit in 2002 is the transfer of our research and development credit carryforwards to deferredtaxes.
The provision for income taxes differed from the amounts computed by applying the statutory U.S. federal income tax rate of 35% in2002, 2001 and 2000 to income before income taxes as a result of the following:
2002 2001 2000
Federal statutory rate $ 3,489 $ 5,162 $ 5,063Research and development credit (1,104) (1,025) (507 )Meals, entertainment, goodwill amortization and other non-
deductible expenses 129 923 236State income taxes 194 289 235Foreign rate differential (2,023) 140 492Change in tax rates � � 97Income tax audit resolution (1,919) (365 ) �
Deferred tax valuation allowance 2,456 � �
Other (186 ) (23 ) (17 )
Provision for income taxes $ 1,036 $ 5,101 $ 5,599
79
Copyright © 2012 www.secdatabase.com. All Rights Reserved.Please Consider the Environment Before Printing This Document

Table of Contents
JDA SOFTWARE GROUP, INC. AND SUBSIDIARIES
NOTES TO CONSOLIDATED FINANCIAL STATEMENTS �� (Continued)
The income tax effects of temporary differences that give rise to our deferred income tax assets and liabilities are as follows:
2002 2001
Current Non-Current Current Non-Current
Deferred tax asset:Accruals and reserves $ 3,906 $ � $ 6,253 $ �
Deferred revenue 932 � 697 �
Foreign NOL 744 � � �
Tax credit carryforwards � 7,900 � �
Other � 42 30 �
Deferred tax asset 5,582 7,942 6,980 �
Valuation allowance on deferred tax asset � (3,481) � �
Deferred tax liability:Property and equipment � (982 ) � (895 )Goodwill and other intangibles � (8,428) � (9,874 )Other (18 ) (31 ) � (41 )
Deferred tax liability (18 ) (9,441) � (10,810)Total $ 5,564 $ (4,980) $ 6,980 $ (10,810)
Residual United States income taxes have not been provided on undistributed earnings of our foreign subsidiaries. These earnings areconsidered to be indefinitely reinvested and, accordingly, no provision for United States federal and state income taxes has been providedthereon. Upon distribution of those earnings in the form of dividends or otherwise, the Company would be subject to both United Statesincome taxes (subject to an adjustment for foreign tax credits) and withholding taxes payable to various foreign countries. It is not practicableto estimate the amount of additional tax that might be payable on the foreign earnings. The Company has incurred net operating losses incertain foreign jurisdictions that will be carried forward to future years.
From time to time, we may be subject to audit by federal, state and/or foreign taxing authorities. During 2002, we recognized a benefit of$1,919,000 that related primarily to the resolution of an audit by the Inland Revenue of our United Kingdom subsidiaries for the years 1997through 2000, and a tentative settlement in the United States of an income tax examination by the Internal Revenue Service of our 1998 and1999 federal income tax returns. In the tentative settlement, the Internal Revenue Service agreed to allow the Company to take a research anddevelopment expense tax credit for most of the qualifying expenses originally reported in the Company�s corporate income tax returns forthose years.
At December 31, 2002, we had approximately $4.4 million of federal research and development tax credit carryforwards that expire atvarious dates through 2022. We also had approximately $5.4 million of foreign tax credit carryforwards that expire beginning in 2004. Weestablished a valuation allowance of $3.5 million on the foreign tax credit carryover due to the fact that we have been operating in an excesscredit position. Of this amount, $1.0 million has been charged to additional paid-in capital due to the potential loss of foreign tax creditsattributable to the exercise of employee stock options. We believe it is more likely than not that the foreign tax credits will not be realized. If,in the future, we determine that we are able to utilize the foreign tax credits, a portion of the valuation allowance reversal will be recorded toadditional paid-in capital.
Copyright © 2012 www.secdatabase.com. All Rights Reserved.Please Consider the Environment Before Printing This Document

80
Copyright © 2012 www.secdatabase.com. All Rights Reserved.Please Consider the Environment Before Printing This Document

Table of Contents
JDA SOFTWARE GROUP, INC. AND SUBSIDIARIES
NOTES TO CONSOLIDATED FINANCIAL STATEMENTS �� (Continued)
16. Earnings Per Share
Earnings per share for the three years ended December 31, 2002 is calculated as follows:
2002 2001 2000
Net income $ 8,930 $ 9,648 $ 8,868
Shares � Basic earnings per share 28,047 25,316 24,315Common stock equivalents 1,027 441 1,116
Shares � Diluted earnings per share 29,074 25,757 25,431
Basic earnings per share $ .32 $ .38 $ .36
Diluted earnings per share $ .31 $ .37 $ .35
17. Business Segments, Geographic Data and Major Customers
We are a leading provider of sophisticated software solutions designed specifically to address the demand and supply chain management,business process, decision support, e-commerce, inventory optimization, and collaborative planning and forecasting requirements of the retailindustry and its suppliers. Our solutions enable our customers to collect, manage, organize and analyze information throughout their retailenterprise, and to collaborate with suppliers and customers over the Internet at multiple levels within their organization. We conduct businessin three geographic regions that have separate management teams and reporting infrastructures: the Americas (includes the United States,Canada and Latin America), Europe (includes the Middle East and Africa), and Asia/Pacific. Similar products and services are offered in eachgeographic region and local management is evaluated primarily based on total revenues and operating income. Identifiable assets are alsomanaged by geographical region. The accounting policies of each region are the same as those described in Note 1 of the Notes toConsolidated Financial Statements. The geographic distribution of our revenues and identifiable assets for the three-year period endedDecember 31, 2002 is as follows:
2002 2001 2000
Revenues:
Americas $ 142,247 $ 143,737 $ 111,910Europe 59,577 47,321 39,876Asia/ Pacific 21,424 24,787 29,219
223,248 215,845 181,005Sales and transfers among regions (3,793 ) (2,029 ) (2,306 )
Total revenues $ 219,455 $ 213,816 $ 178,699
Identifiable assets:
Copyright © 2012 www.secdatabase.com. All Rights Reserved.Please Consider the Environment Before Printing This Document

Americas $ 260,502 $ 230,345 $ 187,685Europe 43,446 48,336 21,712Asia/ Pacific 11,106 9,961 9,075
Total identifiable assets $ 315,054 $ 288,642 $ 218,472
No customer accounted for more than 10% of our revenues during the three years ended December 31, 2002.
81
Copyright © 2012 www.secdatabase.com. All Rights Reserved.Please Consider the Environment Before Printing This Document

Table of Contents
JDA SOFTWARE GROUP, INC. AND SUBSIDIARIES
NOTES TO CONSOLIDATED FINANCIAL STATEMENTS �� (Continued)
We have organized our business segments around the distinct requirements of retail enterprises, retail stores, and suppliers to the retailindustry:
�
Retail Enterprise Systems include corporate level planning and merchandise management systems that enable retailers to optimize theirinventory control, product mix, pricing and promotional strategies, automate demand forecasting and replenishment, and enhance theproductivity and accuracy of warehouse processes. In addition, Retail Enterprise Systems include a comprehensive set of tools foranalyzing business results and trends, tracking customer shopping patterns, space management, trade allowance and promotionalprogram management, and for monitoring strategic plans and tactical decisions.
�
In-Store Systems include point-of-sale, e-commerce and back office applications that enable retailers to capture, analyze and transmitcertain sales, store inventory and other operational information to corporate level merchandise management systems using hand-held,radio frequency devices, point of sale workstations or via the Internet.
�
Collaborative Solutions include applications that enable business-to-business CPFR between retailers and their suppliers. CollaborativeSolutions, which currently include portions of our Retail Enterprise Systems applications that can be used by suppliers as well ascollaborative specific solutions, enable retailers and their suppliers to optimize the sharing of plans, information and supply chaindecisions between trading partners in such areas as inventory replenishment, marketing/promotions, sales planning/execution andcategory management.
82
Copyright © 2012 www.secdatabase.com. All Rights Reserved.Please Consider the Environment Before Printing This Document

Table of Contents
JDA SOFTWARE GROUP, INC. AND SUBSIDIARIES
NOTES TO CONSOLIDATED FINANCIAL STATEMENTS �� (Continued)
A summary of the revenues, operating income (loss), and depreciation attributable to each of these business segments for the three yearsended December 31, 2002 is as follows:
2002 2001 2000
Revenues:Retail Enterprise Systems $ 151,113 $ 162,251 $ 137,071In-Store Systems 25,475 27,073 27,016Collaborative Solutions 42,867 24,492 14,612
$ 219,455 $ 213,816 $ 178,699
Operating income (loss)Retail Enterprise Systems $ 29,825 $ 34,929 $ 22,593In-Store Systems 5,337 5,484 8,789Collaborative Solutions 10,470 7,636 5,336Other (see below) (37,366 ) (35,971 ) (26,497 )
$ 8,266 $ 12,078 $ 10,221
DepreciationRetail Enterprise systems $ 5,937 $ 6,401 $ 6,360In-Store systems 1,270 1,385 1,471Collaborative Solutions 1,146 419 210
$ 8,353 $ 8,205 $ 8,041
Other:Amortization of intangible assets $ 2,849 $ 5,526 $ 4,708In-process research and development charge (see Note 2) 800 2,361 200Restructuring, asset disposition and other merger related
charges (see Note 9) 6,287 985 828Relocation costs to consolidated development and
support activities 452 � �
General and administrative expenses 26,978 27,099 20,761
$ 37,366 $ 35,971 $ 26,497
Operating income in the Retail Enterprise Systems, In-Store Systems and Collaborative Solutions business segments includes directexpenses for software licenses, maintenance services, consulting services, sales and marketing expenses, product development expenses, aswell as allocations for occupancy costs and depreciation expense. The �Other� caption includes general and administrative expenses and othercharges that are not directly identified with a particular business segment and which management does not consider in evaluating the operatingincome of the business segment.
Copyright © 2012 www.secdatabase.com. All Rights Reserved.Please Consider the Environment Before Printing This Document

83
Copyright © 2012 www.secdatabase.com. All Rights Reserved.Please Consider the Environment Before Printing This Document

Table of Contents
JDA SOFTWARE GROUP, INC. AND SUBSIDIARIES
NOTES TO CONSOLIDATED FINANCIAL STATEMENTS �� (Continued)
18. Quarterly Data (Unaudited)
The following table presents selected unaudited quarterly operating results for the two-year period ended December 31, 2002. We believethat all necessary adjustments have been included in the amounts shown below to present fairly the related quarterly results.
Consolidated Statement of Income Data:
2002
First Second Third Fourth
Quarter Quarter Quarter Quarter Total
Revenues $ 59,150 $ 57,584 $ 49,412 $ 53,309 $ 219,455Income (loss) from operations 6,462 3,728 833 (2,757 ) 8,266Net income 4,545 2,677 758 950 8,930Basic earnings per share $ .17 $ .10 $ .03 $ .03 $ .32Diluted earnings per share $ .16 $ .09 $ .03 $ .03 $ .31
2001
First Second Third Fourth
Quarter Quarter Quarter Quarter Total
Revenues $ 48,784 $ 50,460 $ 51,773 $ 62,799 $ 213,816Income from operations 2,543 3,973 1,327 4,235 12,078Net income 2,154 3,022 1,174 3,298 9,648Basic earnings per share $ .09 $ .12 $ .05 $ .12 $ .38Diluted earnings per share $ .09 $ .12 $ .05 $ .12 $ .37
Income from operations for 2002 includes restructuring and asset disposition charges of $1.3 million and $5.0 million that were recordedduring the second and fourth quarters of 2002, respectively, and an $800,000 charge for IPR&D in connection with the acquisition ofJ�Commerce in second quarter 2002. Income from operations for 2001 includes restructuring and asset disposition charges of $749,000 and$236,000 that were recorded during the first and fourth quarters of 2001, respectively, and a $2.2 million charge for IPR&D in connectionwith the acquisition of E3 in third quarter 2001.
84
Copyright © 2012 www.secdatabase.com. All Rights Reserved.Please Consider the Environment Before Printing This Document

Table of Contents
SIGNATURES
Pursuant to the requirements of Section 13 or 15(d) of the Securities Exchange Act of 1934, the registrant has duly caused this Report tobe signed on its behalf by the undersigned, thereunto duly authorized.
JDA SOFTWARE GROUP, INC.
By:/s/ JAMES D. ARMSTRONG
James D. ArmstrongChief Executive Officer
(Principal Executive Officer)
Date: March 18, 2003
Pursuant to the requirements of the Securities Exchange Act of 1934, this Report has been signed below on March 28, 2003 by thefollowing persons in the capacities indicated.
Signature Title
/s/ JAMES D. ARMSTRONGJames D. Armstrong
Chairman of the Board and Chief Executive Officer(Principal Executive Officer)
/s/ KRISTEN L. MAGNUSONKristen L. Magnuson
Executive Vice President and Chief Financial Officer(Principal Financial and Accounting Officer)
/s/ J. MICHAEL GULLARDJ. Michael Gullard
Director
/s/ WILLIAM C. KEIPERWilliam C. Keiper
Director
/s/ DOUGLAS G. MARLINDouglas G. Marlin
Director
/s/ JOCK PATTONJock Patton
Director
85
Copyright © 2012 www.secdatabase.com. All Rights Reserved.Please Consider the Environment Before Printing This Document

Table of Contents
FORM 10-K CERTIFICATIONS
I, James D. Armstrong, certify that:
1. I have reviewed this annual report on Form 10-K of JDA Software Group, Inc.;
2. Based on my knowledge, this annual report does not contain any untrue statement of a material fact or omit to state a material factnecessary to make the statements made, in light of the circumstances under which such statements were made, not misleading with respect tothe period covered by this annual report;
3. Based on my knowledge, the financial statements, and other financial information included in this annual report, fairly present in allmaterial respects the financial condition, results of operations and cash flows of the registrant as of, and for, the periods presented in thisannual report;
4. The registrant�s other certifying officers and I are responsible for establishing and maintaining disclosure controls and procedures(as defined in Exchange Act Rules 13a-14 and 15d-14) for the registrant and we have:
a) designed such disclosure controls and procedures to ensure that material information relating to the registrant, including itsconsolidated subsidiaries, is made known to us by others within those entities, particularly during the period in which this annual report isbeing prepared;
b) evaluated the effectiveness of the registrant�s disclosure controls and procedures as of a date within 90 days prior to the filing dateof this annual report (the �Evaluation Date�); and
c) presented in this annual report our conclusions about the effectiveness of the disclosure controls and procedures based on ourevaluation as of the Evaluation Date;
5. The registrant�s other certifying officers and I have disclosed, based on our most recent evaluation, to the registrant�s auditors andthe audit committee of registrant�s board of directors (or persons performing the equivalent function):
a) all significant deficiencies in the design or operation of internal controls which could adversely affect the registrant�s ability torecord, process, summarize and report financial data and have identified for the registrant�s auditors any material weaknesses in internalcontrols; and
b) any fraud, whether or not material, that involves management or other employees who have a significant role in the registrant�sinternal controls; and
6. The registrant�s other certifying officers and I have indicated in this annual report whether or not there were significant changes ininternal controls or in other factors that could significantly affect internal controls subsequent to the date of our most recent evaluation,including any corrective actions with regard to significant deficiencies and material weaknesses.
By: /s/ JAMES D. ARMSTRONG
James D. ArmstrongChairman and Chief Executive Officer
Date: March 18, 2003
86
Copyright © 2012 www.secdatabase.com. All Rights Reserved.Please Consider the Environment Before Printing This Document

Copyright © 2012 www.secdatabase.com. All Rights Reserved.Please Consider the Environment Before Printing This Document

Table of Contents
I, Kristen L. Magnuson, certify that:
1. I have reviewed this annual report on Form 10-K of JDA Software Group, Inc.;
2. Based on my knowledge, this annual report does not contain any untrue statement of a material fact or omit to state a material factnecessary to make the statements made, in light of the circumstances under which such statements were made, not misleading with respect tothe period covered by this annual report;
3. Based on my knowledge, the financial statements, and other financial information included in this annual report, fairly present in allmaterial respects the financial condition, results of operations and cash flows of the registrant as of, and for, the periods presented in thisannual report;
4. The registrant�s other certifying officers and I are responsible for establishing and maintaining disclosure controls and procedures(as defined in Exchange Act Rules 13a-14 and 15d-14) for the registrant and we have:
a) designed such disclosure controls and procedures to ensure that material information relating to the registrant, including itsconsolidated subsidiaries, is made known to us by others within those entities, particularly during the period in which this annual report isbeing prepared;
b) evaluated the effectiveness of the registrant�s disclosure controls and procedures as of a date within 90 days prior to the filing dateof this annual report (the �Evaluation Date�); and
c) presented in this annual report our conclusions about the effectiveness of the disclosure controls and procedures based on ourevaluation as of the Evaluation Date;
5. The registrant�s other certifying officers and I have disclosed, based on our most recent evaluation, to the registrant�s auditors andthe audit committee of registrant�s board of directors (or persons performing the equivalent function):
a) all significant deficiencies in the design or operation of internal controls which could adversely affect the registrant�s ability torecord, process, summarize and report financial data and have identified for the registrant�s auditors any material weaknesses in internalcontrols; and
b) any fraud, whether or not material, that involves management or other employees who have a significant role in the registrant�sinternal controls; and
6. The registrant�s other certifying officers and I have indicated in this annual report whether or not there were significant changes ininternal controls or in other factors that could significantly affect internal controls subsequent to the date of our most recent evaluation,including any corrective actions with regard to significant deficiencies and material weaknesses.
By: /s/ KRISTEN L. MAGNUSON
Kristen L. MagnusonExecutive Vice President and Chief Financial Officer
(Principal Financial and Accounting Officer)
Date: March 18, 2003
87
Copyright © 2012 www.secdatabase.com. All Rights Reserved.Please Consider the Environment Before Printing This Document

Table of Contents
EXHIBIT INDEX
Exhibit # Description of Document
2 .1** � Asset Purchase Agreement dated as of June 4, 1998, by and among JDA Software Group, Inc., JDASoftware, Inc. and Comshare, Incorporated.
2 .2## � Asset Purchase Agreement dated as of February 24, 2000, by and among JDA Software Group, Inc.,Pricer AB, and Intactix International, Inc.
2 .3### � Agreement and Plan of Reorganization dated as of September 7, 2001, by and among JDA SoftwareGroup, Inc., E3 Acquisition Corp., E3 Corporation and certain shareholders of E3 Corporation.
3 .1#### � Third Restated Certificate of Incorporation of the Company together with Certificate of Amendmentdated July 23, 2002.
3 .2*** � First Amended and Restated Bylaws.4 .1* � Specimen Common Stock certificate.4 .2*(1) � Stock Redemption Agreement among the Company, James D. Armstrong and Frederick M. Pakis dated
March 30, 1995.10.1*(1) � Form of Indemnification Agreement.10.2*(1) � 1995 Stock Option Plan, as amended, and form of agreement thereunder.10.3��(1) � 1996 Stock Option Plan, as amended.10.4*(1) � 1996 Outside Directors Stock Option Plan and forms of agreement thereunder.10.5(1)#### � Executive Employment Agreement between James D. Armstrong and JDA Software Group, Inc. dated
July 23, 2002.10.6(1) � Executive Employment Agreement between Hamish N. Brewer and JDA Software Group, Inc. dated
January 22, 2003.10.7(1)#### � Executive Employment Agreement between Kristen L. Magnuson and JDA Software Group, Inc. dated
July 23, 2002.10.8#(1) � 1998 Nonstatutory Stock Option Plan.10.9#(1) � 1998 Employee Stock Purchase Plan.10.10� � 1999 Employee Stock Purchase Plan.10.11*** � Lease Agreement between Opus West Corporation and JDA Software Group, Inc. dated April 30, 1998,
together with First Amendment dated June 30, 1998.10.12** � Software License Agreement dated as of June 4, 1998 by and between Comshare, Incorporated and
JDA Software, Inc.10.14����(2) � Value-Added Reseller License Agreement for Uniface Software between Compuware Corporation and
JDA Software Group, Inc. dated April 1, 2000, together with Product Schedule No. Two datedSeptember 28, 2001.
10.15*(1) � JDA Software, Inc. 401(k) Profit Sharing Plan, adopted as amended effective January 1, 1995.10.17***(1) � Form of Amendment of Stock Option Agreement between JDA Software Group, Inc and Kristen L.
Magnuson, amending certain stock options granted to Ms. Magnuson pursuant to the JDA SoftwareGroup, Inc. 1996 Stock Option Plan on September 11, 1997 and January 27, 1998.
10.18��(1) � Form of Rights Agreement between the Company and ChaseMellon Shareholder Services, as RightsAgent (including as Exhibit A the Form of Certificate of Designation, Preferences and Rights of theTerms of the Series A Preferred Stock, as Exhibit B the From of Right Certificate, and as Exhibit C theSummary of Terms and Rights Agreement).
10.19���(1) � Form of Incentive Stock Option Agreement between JDA Software Group, Inc. and Kristen L.Magnuson to be used in connection with stock option grants to Ms. Magnuson pursuant to the JDASoftware Group, Inc. 1996 Stock Option Plan.
Copyright © 2012 www.secdatabase.com. All Rights Reserved.Please Consider the Environment Before Printing This Document

10.20�(1)(3) � Form of Incentive Stock Option Agreement between JDA Software Group, Inc. and certain SeniorExecutive Officers to be used in connection with stock options granted pursuant to the JDA SoftwareGroup, Inc. 1996 Stock Option Plan.
10.21�(1)(3) � Form of Nonstatutory Stock Option Agreement between JDA Software Group, Inc. and certain SeniorExecutive Officers to be used in connection with stock options granted pursuant to the JDA SoftwareGroup, Inc. 1996 Stock Option Plan.
Copyright © 2012 www.secdatabase.com. All Rights Reserved.Please Consider the Environment Before Printing This Document

Table of Contents
Exhibit # Description of Document
10.22�(1)(4) � Form of Amendment of Stock Option Agreement between JDA Software Group, Inc and certain SeniorExecutive Officers, amending certain stock options granted pursuant to the JDA Software Group, Inc.1995 Stock Option Plan
10.23�(1)(5) � Form of Amendment of Stock Option Agreement between JDA Software Group, Inc and certain SeniorExecutive Officers, amending certain stock options granted pursuant to the JDA Software Group, Inc.1996 Stock Option Plan
10.24�(1)(6) � Form of Incentive Stock Option Agreement between JDA Software Group, Inc. and certain SeniorExecutive Officers to be used in connection with stock options granted pursuant to the JDA SoftwareGroup, Inc. 1996 Stock Option Plan
10.25��� � Secured Loan Agreement between JDA Software Group, Inc. and Silvon Software, Inc. dated May 8,2001, together with Secured Promissory Note and Security Agreement.
23.1 � Consent of Independent Auditors99.1 � Certification of Chief Executive Officer99.2 � Certification of Chief Financial Officer
*Incorporated by reference to the Company�s Registration Statement on Form S-1 (File No. 333-748), declared effective onMarch 14, 1996.
**Incorporated by reference to the Company�s Current Report on Form 8-K dated June 4, 1998, as filed on June 19, 1998.
*** Incorporated by reference to the Company�s Quarterly Report on Form 10-Q for the quarterly period ended June 30, 1998, as filedon August 14, 1998.
� Incorporated by reference to the Company�s Quarterly Report on Form 10-Q for the quarterly period ended June 30, 1999, as filedon August 19, 1999.
�� Incorporated by reference to the Company�s Current Report on Form 8-K dated October 2, 1998, as filed on October 28, 1998.
��� Incorporated by reference to the Company�s Quarterly Report on Form 10-Q for the quarterly period ended September 30, 1998, asfiled on November 13, 1998.
#Incorporated by reference to the Company�s Annual Report on Form 10-K for the year ended December 31, 1998, as filed onMarch 31, 1998.
## Incorporated by reference to the Company�s Current Report on Form 8-K dated February 24, 2000, as filed on March 1, 2000.
### Incorporated by reference to the Company�s Current Report on Form 8-K dated September 7, 2001, as filed on September 21, 2001.
#### Incorporated by reference to the Company�s Quarterly Report on Form 10-Q for the quarterly period ended September 30, 2002, asfiled on November 12, 2002.
�
Incorporated by reference to the Company�s Annual Report on Form 10-K for the year ended December 31, 1999, as filed onMarch 16, 2000.
Copyright © 2012 www.secdatabase.com. All Rights Reserved.Please Consider the Environment Before Printing This Document

�� Incorporated by reference to the Company�s Annual Report on Form 10-K for the year ended December 31, 2000, as filed onApril 2, 2001.
��� Incorporated by reference to the Company�s Quarterly Report on Form 10-Q for the quarterly period ended June 30, 2001, as filedon August 14, 2001.
���� Incorporated by reference to the Company�s Annual Report on Form 10-K for the year ended December 31, 2001, as filed onMarch 29, 2002.
(1) Management contracts or compensatory plans or arrangements covering executive officers or directors of the Company.
(2) Confidential treatment has been granted as to part of this exhibit.
(3) Applies to James D. Armstrong.
Copyright © 2012 www.secdatabase.com. All Rights Reserved.Please Consider the Environment Before Printing This Document

Table of Contents
(4) Applies to Hamish N. Brewer and Gregory L. Morrison.
(5) Applies to Hamish N. Brewer, Peter J. Charness, Scott D. Hines, Gregory L. Morrison and David J. Tidmarsh.
(6) Applies to Senior Executive Officers with the exception of James D. Armstrong and Kristen L. Magnuson.
Copyright © 2012 www.secdatabase.com. All Rights Reserved.Please Consider the Environment Before Printing This Document

Exhibit 10.6
EXECUTIVE EMPLOYMENT AGREEMENT
This Executive Employment Agreement ("AGREEMENT") is made effective as ofJanuary 22, 2003 ("EFFECTIVE DATE"), by and between JDA Software Group, Inc., aDelaware corporation ("COMPANY") and Hamish N. Brewer ("EXECUTIVE") (eitherparty individually, a "PARTY"; collectively, the "PARTIES").
WHEREAS, Company desires to retain the services of Executive as President;
WHEREAS, the Parties desire to enter into this Agreement to set forth theterms and conditions of Executive's employment by Company and to address certainmatters related to Executive's employment with Company;
NOW, THEREFORE, in consideration of the foregoing and the mutualprovisions contained herein, and for other good and valuable consideration, theParties hereto agree as follows:
1. Employment. Company hereby employs Executive, and Executive herebyaccepts such employment, upon the terms and conditions set forth herein.
2. Duties.
2.1 Position. Executive is employed as President and shall havethe duties and responsibilities assigned by Company's Chief Executive Officer("CEO") both upon initial hire and as may be reasonably assigned from time totime. Executive shall perform faithfully and diligently all duties assigned toExecutive. Company reserves the right to modify Executive's position and dutiesat any time in its sole and absolute discretion, provided that the dutiesassigned are consistent with the position of a senior executive officer and thatExecutive continues to report directly to the CEO.
2.2 Standard of Conduct/Full-time. During the term of thisAgreement, Executive will act loyally and in good faith to discharge the dutiesof President, and will abide by all policies and decisions made by Company, aswell as all applicable federal, state and local laws, regulations or ordinances.Executive will act solely on behalf of Company at all times. Executive shalldevote Executive's full business time and efforts to the performance ofExecutive's assigned duties for Company, unless Executive notifies the CEO inadvance of Executive's intent to engage in other paid work and receives theCEO's express written consent to do so.
2.3 Work Location. Executive's principal place of work shall belocated in Scottsdale, Arizona or such other location as the parties may agreeupon from time to time.
3. Term.
Copyright © 2012 www.secdatabase.com. All Rights Reserved.Please Consider the Environment Before Printing This Document

3.1 Initial Term. Unless sooner terminated in accordance with theterms of this Agreement, the employment relationship pursuant to this Agreementshall be for an initial term commencing on the Effective Date set forth aboveand continuing for three (3) years from the Effective Date or, if Executiveaccepts a position of employment with any successor to the business of Company(by merger, consolidation, sale of assets or stock or otherwise) after a Changeof Control (as defined in Section 7.5(b)(iv)) below) that occurs within three(3) years of
the Effective Date, the initial term shall continue for eighteen (18) monthsfrom the date of the Change of Control (each, an "INITIAL TERM").
3.2 Renewal. On completion of the Initial Term specified inSection 3.1 above, this Agreement will automatically renew for subsequentone-year terms unless either party provides ninety (90) days' advance writtennotice to the other that such party does not wish to renew the Agreement for asubsequent one-year term. In the event either party gives notice of nonrenewalpursuant to this Section 3.2, this Agreement will expire at the end of thethen-current term.
4. Compensation.
4.1 Base Salary. As compensation for Executive's performance ofExecutive's duties hereunder, Company shall pay to Executive a salary of$250,000 per year, payable in equal bi-monthly installments and in accordancewith the normal payroll practices of Company, less required deductions for stateand federal withholding tax, social security and all other employment taxes andauthorized payroll deductions.
4.2 Stock Options. Subject to approval by Company's Board ofDirectors (the "BOARD"), Company will from time to time grant to Executive anoption to purchase shares of Company's common stock (the "OPTION"). The Optionwill be subject to the terms and conditions of one of Company's Stock OptionPlans as designated by the Board (the "PLAN"). The Option will also be subjectto the terms and conditions contained in the special form of option agreementpreviously adopted by the Board for the Senior Executives, a form of which isattached hereto as Exhibit A (the "FORM OPTION AGREEMENT") and shall vest over aperiod of three (3) years in accordance with the terms of the Form OptionAgreement and the Plan. The Option shall be subject to certain accelerationprovisions described in the Form Option Agreement and this Agreement.
4.3 Incentive Compensation. In addition, Executive will also beeligible to receive incentive compensation subject to the terms and conditionscontained in the Executive Bonus Plan, which is approved by the Board and issubject to amendment from time to time by the Board in its sole and absolutediscretion. Unless otherwise provided herein, the payment of any Bonus pursuantto this Section 4.3 shall be made in accordance with the normal payrollpractices of Company, less required deductions for state and federal withholdingtax, social security and all other employment taxes and authorized payrolldeductions.
Copyright © 2012 www.secdatabase.com. All Rights Reserved.Please Consider the Environment Before Printing This Document

4.4 Performance and Salary Review. The Board will periodicallyreview Executive's performance on no less than an annual basis. Adjustments tosalary or other compensation, if any, will be made by the Board in its sole andabsolute discretion.
5. Customary Fringe Benefits and Facilities. Executive will be eligiblefor all customary and usual fringe benefits generally available to executives ofCompany subject to the terms and conditions of Company's benefit plan documents.Company reserves the right to change or eliminate the fringe benefits on aprospective basis, at any time, effective upon notice to Executive; provided,however, that during the period of employment under this Agreement, Executive(and his spouse and eligible dependents) shall be entitled to receive allbenefits of employment generally available to other members of Company'smanagement and those benefits for which key executives are or shall becomeeligible, when and as Executive becomes eligible therefore, including, withoutlimitation, group health, life and disability insurance benefits andparticipation in Company's 401(k) plan. Company further agrees to
2
furnish Executive with such assistance and accommodations (i.e., an office inthe size, type and quality as provided to Executive prior to the Effective Date)as shall be suitable to the character of Executive's position with Company andadequate for the performance of Executive's duties hereunder.
6. Business Expenses. Executive will be reimbursed for all reasonable,out-of-pocket business expenses incurred in the performance of Executive'sduties on behalf of Company. To obtain reimbursement, expenses must be submittedpromptly with appropriate supporting documentation in accordance with Company'spolicies.
7. Termination of Executive's Employment.
7.1 Termination for Cause by Company. Company may terminateExecutive's employment immediately at any time for Cause. For purposes of thisAgreement, "CAUSE" is defined as: (a) theft, dishonesty, or intentionalfalsification of any employment or Company records; improper disclosure ofCompany's confidential or proprietary information; (b) Executive's conviction(including any plea of guilty or nolo contendere) for any criminal act thatmaterially impairs his ability to perform his duties for Company; or (c) amaterial breach of this agreement by Executive which is not cured within thirty(30) days of receipt by executive of reasonably detailed written notice fromCompany. In the event Executive's employment is terminated in accordance withthis Section 7.1, Executive shall be entitled to receive only unpaid Base Salarythen in effect, prorated to the date of termination, together with any amountsto which Executive is entitled pursuant to Sections 5 or 6 hereof. Executiveshall be entitled to any benefit or right to which Executive is entitledpursuant to the Plan, however, there shall be no additional vesting underExecutive's Option. All other Company obligations to Executive pursuant to this
Copyright © 2012 www.secdatabase.com. All Rights Reserved.Please Consider the Environment Before Printing This Document

Agreement will become automatically terminated and completely extinguished.Executive will not be entitled to receive the Severance Payments described inSection 7.2, below.
7.2 Termination Without Cause by Company/Severance. Company mayterminate Executive's employment under this Agreement without Cause at any timeon sixty (60) days' advance written notice to Executive. In the event of suchtermination, Executive will receive in one lump sum payment, (i) the unpaid BaseSalary then in effect, prorated to the effective date then in effect; (ii) hisBase Salary for twenty-four (24) months from the termination date plus oneyear's expected Bonus pursuant to Section 4.3 of this Agreement, and assumingsatisfaction of all performance based milestones by both Company and theExecutive; (iii) any amounts to which Executive is entitled pursuant to Section5 or 6 hereof; and (iv) any benefit or right to which Executive is entitledpursuant to the Plan and Option Agreements delivered to Executive in connectionwith the grant of Options to Executive (the "SEVERANCE PAYMENTS"), provided thatExecutive: (a) complies with all surviving provisions of this Agreement,including without limitation those provisions specified in Section 14.8, below;and (b) executes a full general release, releasing all claims, known or unknown,that Executive may have against Company arising out of or any way related toExecutive's employment or termination of employment with Company, insubstantially the form attached hereto as Exhibit B, or in another form that isacceptable to Company in its sole discretion. All other Company obligations toExecutive will be automatically terminated and completely extinguished upontermination of employment.
7.3 Termination for Good Reason by Executive/Severance. Executivemay terminate Executive's employment under this Agreement for Good Reason(defined below) at any time on five (5) days' advance written notice to Company.In the event of such termination,
3
Executive will be entitled to receive the Severance Payments described inSection 7.2, above, provided that Executive complies with the conditions toreceiving the Severance Payments described in Sections 7.2(a) and 7.2(b), above.All other Company obligations to Executive will be automatically terminated andcompletely extinguished upon termination of employment.
For purposes of this Agreement, "GOOD REASON" is defined as the occurrenceof any of the following conditions:
(i) a failure to pay, or any reduction of Executive's BaseSalary as in effect immediately prior to the Change of Control (as defined inSection 7.5(b)(iv)) or Executive's Bonus in effect prior to the Change ofControl (subject to applicable performance requirements with respect to theactual amount of Bonus earned by Executive); or
(ii) any material breach of this Agreement by Company that isnot cured within thirty (30) days after Company's receipt of written notice from
Copyright © 2012 www.secdatabase.com. All Rights Reserved.Please Consider the Environment Before Printing This Document

Executive specifying the material breach of this Agreement.
7.4 Voluntary Resignation by Executive. Executive may voluntarilyresign Executive's position with Company for any reason, at any time after theEffective Date, on five (5) days' advance written notice. In the event ofExecutive's resignation, Executive will be entitled to receive only the BaseSalary for the five-day notice period and no other amount for the remainingmonths of the current term, whether the Initial Term or a subsequent one-yearterm (other than amounts to which Executive is entitled pursuant to Sections 5or 6 hereof). Executive shall be entitled to any benefit or right to whichExecutive is entitled pursuant to the Plan, however, there shall be notadditional vesting under Executive's Option. All other Company obligations toExecutive pursuant to this Agreement will become automatically terminated andcompletely extinguished upon termination of employment. In addition, Executivewill not be entitled to receive any Severance Payments described in Section 7.2,above. The provisions of this Section 7.4 shall not apply to Executive'sresignation for Good Reason.
7.5 Federal Excise Tax Under Section 4999 of the Code.
(a) Additional Payment. In the event that any payment or benefitreceived or to be received by Executive pursuant to this Agreement or otherwisepayable to Executive (collectively, the "PAYMENTS") would be subject to theexcise tax imposed by Section 4999 of the Internal Revenue Code of 1986, asamended (the "CODE"), or any similar or successor provision (the "EXCISE TAX"),Company shall pay to Executive within ninety (90) days of the date Executivebecomes subject to the Excise Tax, an additional amount (the "GROSS-UP PAYMENT")such that the net amount retained by Executive from the Payments and theGross-Up Payment, after deduction of (1) any Excise Tax on the Payments and (2)any federal, state and local income or employment tax and Excise Tax upon thepayment provided for by this Section, shall be equal to the Payments.
(b) Determination of Excise Tax. For purposes of determiningwhether any of the Payments will be subject to the Excise Tax and the amount ofsuch Excise Tax:
(i) Any payments or benefits received or to be received byExecutive in connection with transactions contemplated by a Change of Control(as defined below) event or Executive's termination of employment (whetherpursuant to the terms of this Agreement or any other plan, arrangement oragreement with Company), shall be treated as
4
"parachute payments" within the meaning of Section 280G of the Code or anysimilar or successor provision, and all "excess parachute payments" within themeaning of Section 280G of the Code or any similar or successor provision shallbe treated as subject to the Excise Tax, unless in the opinion of tax counsel("TAX COUNSEL") selected by Company and reasonably acceptable to Executive suchpayments or benefits (in whole or in part) do not constitute parachute payments,
Copyright © 2012 www.secdatabase.com. All Rights Reserved.Please Consider the Environment Before Printing This Document

or such excess parachute payments (in whole or in part) represent reasonablecompensation for services actually rendered within the meaning of Section 280Gof the Code (or any similar or successor provision of the Code) in excess of thebase amount within the meaning of Section 280G of the Code (or any similar orsuccessor provision of the Code), or are otherwise not subject to the ExciseTax.
(ii) The amount of the Payments which shall be treated assubject to the Excise Tax shall be equal to the lesser of (i) the total amountof the Payments or (ii) the amount of the excess parachute payments within themeaning of Section 280G of the Code (after applying paragraph (b)(1) above).
(iii) The value of any non-cash benefits or any deferredpayment or benefit shall be determined by Tax Counsel in accordance with theprinciples of Section 280G of the Code.
(iv) Change of Control. A "CHANGE OF CONTROL" is defined asany one of the following occurrences:
a) Any "person" (as such term is used in Sections13(d) and 14(d) of the Securities Exchange Act of 1934 (the "EXCHANGE ACT")),other than a trustee or other fiduciary holding securities of Company under anemployee benefit plan of Company, becomes the "beneficial owner" (as defined inRule 13d-3 promulgated under the Exchange Act), directly or indirectly, of thesecurities of Company representing 50% or more of (A) the outstanding shares ofcommon stock of Company or (B) the combined voting power of Company'sthen-outstanding securities; or
b) the sale or disposition of all or substantiallyall of Company's assets (or any transaction having similar effect isconsummated); or
c) Company is party to a merger or consolidation thatresults in the holders of voting securities of Company outstanding immediatelyprior thereto failing to continue to represent (either by remaining outstandingor by being converted into voting securities of the surviving entity) at least50% of the combined voting power of the voting securities of Company or suchsurviving entity outstanding immediately after such merger or consolidation; or
d) a liquidation or dissolution of Company.
(c) Determination of Gross-Up Payment. For purposes of determiningthe amount of the Gross-Up Payment, Executive shall be deemed to pay federalincome taxes at the highest marginal rate of federal income taxation in thecalendar year in which the Gross-Up Payment is to be made and state and localincome taxes at the highest marginal rate of taxation in the state and localityof Executive's residence on the date the Gross-Up Payment is to be made, net ofthe maximum reduction in federal income taxes which could be obtained fromdeduction of such state and local taxes.
Copyright © 2012 www.secdatabase.com. All Rights Reserved.Please Consider the Environment Before Printing This Document

5
(d) Adjustments.
(i) In the event that the Excise Tax is subsequentlydetermined to be less than the amount taken into account hereunder, Executiveshall repay to Company at the time that the amount of such reduction in ExciseTax is finally determined the portion of the Gross-Up Payment attributable tosuch reduction (plus the portion of the Gross-Up Payment attributable to theExcise Tax and federal, state and local income and employment taxes imposed onthe Gross-Up Payment being repaid by Executive if such repayment results in areduction in Excise Tax and/or a federal, state or local income or employmenttax deduction) plus interest on the amount of such repayment at the rateprovided in Section 1274(b)(2)(B) of the Code.
(ii) In the event that the Excise Tax is determined toexceed the amount taken into account hereunder (including by reason of anypayment the existence or amount of which cannot be determined at the time of theGross-Up Payment), Company shall make an additional gross-up payment in respectof such excess (plus any interest payable with respect to such excess) at thetime that the amount of such excess is finally determined.
7.6 Termination of Employment Upon Nonrenewal. In the event eitherparty decides not to renew this Agreement for a subsequent one-year term inaccordance with Section 3.2 above, the Agreement will expire, Executive'semployment with Company will terminate and Executive will only be entitled to(i) Executive's Base Salary paid through the last day of the then-current term;(ii) any amounts to which Executive is entitled pursuant to Section 5 or 6hereof; and (iii) any benefit or right to which Executive is entitled pursuantto the Plan and Option Agreements delivered to Executive in connection with thegrant of Options to Executive. All other Company obligations to Executivepursuant to this Agreement will become automatically terminated and completelyextinguished. In addition, Executive will not be entitled to any SeverancePayments described in Section 7.2.
8. No Conflict of Interest. During the term of Executive's employmentwith Company, Executive must not engage in any work, paid or unpaid, thatcreates an actual or potential conflict of interest with Company. If the Boardreasonably believes such a conflict exists during the term of this Agreement,the Board may ask Executive to choose to discontinue the other work or resignemployment with Company.
9. Post-Termination Non-Competition.
9.1 Consideration For Promise To Refrain From Competing. Executiveagrees that Executive's services are special and unique, that Company'sdisclosure of confidential, proprietary information and specialized training andknowledge to Executive, and that Executive's level of compensation and benefitsare partly in consideration of and conditioned upon Executive not competing withCompany. Executive acknowledges that such consideration is adequate for
Copyright © 2012 www.secdatabase.com. All Rights Reserved.Please Consider the Environment Before Printing This Document

Executive's promises contained within this Section 9.
9.2 Promise To Refrain From Competing. Executive understandsCompany's need for Executive's promise not to compete with Company is based onthe following: (a) Company has expended, and will continue to expend,substantial time, money and effort in developing its proprietary information;(b) Executive will in the course of Executive's employment develop, bepersonally entrusted with and exposed to Company's proprietary information; (c)both during and after the term of Executive's employment, Company will beengaged in the highly competitive retail demand chain software industry; (d)Company provides
6
products and services nationally and internationally; and (e) Company willsuffer great loss and irreparable harm if Executive were to enter intocompetition with Company. Therefore, in exchange for the consideration describedin Section 9.1 above, Executive agrees that for the period of nine (9) monthsfollowing the date Executive ceases to render services to Company (the "COVENANTPERIOD"), Executive will not either directly or indirectly, whether as an owner,director, officer, manager, consultant, agent or employee: (i) work for acompetitor of Company, which is defined to include those entities or persons inthe business of developing, marketing, selling and supporting software designedfor businesses in the retail and consumer packaged goods markets or in thebusiness of helping companies synchronize their inventory decisions withadvanced supply chain, inventory management and data mining solutions, in anycountry in which Company does business (the "RESTRICTED BUSINESS"); or (ii) makeor hold during the Covenant Period any investment in any Restricted Business,whether such investment be by way of loan, purchase of stock or otherwise,provided that there shall be excluded from the foregoing the ownership of notmore than 1% of the listed or traded stock of any publicly held corporation. Forpurposes of this Section 9, the term "COMPANY" shall mean and include Company,any subsidiary or affiliate of Company, any successor to the business of Company(by merger, consolidation, sale of assets or stock or otherwise) and any othercorporation or entity of which Executive may serve as a director, officer oremployee at the request of Company or any successor of Company.
9.3 Reasonableness of Restrictions. Executive represents andagrees that the restrictions on competition, as to time, geographic area, andscope of activity, required by this Section 9 are reasonable, do not impose agreater restraint than is necessary to protect the goodwill and businessinterests of Company, and are not unduly burdensome to Executive. Executiveexpressly acknowledges that Company competes on an international basis and thatthe geographical scope of these limitations is reasonable and necessary for theprotection of Company's trade secrets and other confidential and proprietaryinformation. Executive further agrees that these restrictions allow Executive anadequate number and variety of employment alternatives, based on Executive'svaried skills and abilities. Executive represents that Executive is willing andable to compete in other employment not prohibited by this Agreement.
Copyright © 2012 www.secdatabase.com. All Rights Reserved.Please Consider the Environment Before Printing This Document

9.4 Reformation if Necessary. In the event a court of competentjurisdiction determines that the geographic area, duration, or scope of activityof any restriction under this Section 9 and its subsections is unenforceable,the restrictions under this section and its subsections shall not be terminatedbut shall be reformed and modified to the extent required to render them validand enforceable. Executive further agrees that the court may reform thisAgreement to extend the Covenant Period by an amount of time equal to any periodin which Executive is in breach of this covenant.
10. Confidentiality and Proprietary Rights. Executive agrees to read,sign and abide by Company's Employee Innovations and Proprietary RightsAssignment Agreement, which was previously executed by Executive andincorporated herein by reference.
11. Nonsolicitation.
11.1 Nonsolicitation of Customers or Prospects. Executiveacknowledges that information about Company's customers is confidential andconstitutes trade secrets. Accordingly, Executive agrees that during the term ofthis Agreement and for a period of nine (9) months after the termination of thisAgreement, Executive will not, either directly or indirectly, separately or inassociation with others, interfere with, impair, disrupt or damage Company'srelationship with any of its customers or customer prospects by soliciting or
7
encouraging others to solicit any of them for the purpose of diverting or takingaway business from Company.
11.2 Nonsolicitation of Company's Employees. Executive agrees thatduring the term of this Agreement and for a period of nine (9) months after thetermination of this Agreement, Executive will not, either directly orindirectly, separately or in association with others, interfere with, impair,disrupt or damage Company's business by soliciting, encouraging, hiring orattempting to hire any of Company's employees or causing others to solicit orencourage any of Company's employees to discontinue their employment withCompany.
12. Injunctive Relief. Executive acknowledges that Executive's breach ofthe covenants contained in Sections 9-11 (collectively "COVENANTS") would causeirreparable injury to Company and agrees that in the event of any such breach,Company shall be entitled to seek temporary, preliminary and permanentinjunctive relief without the necessity of proving actual damages or posting anybond or other security.
13. Agreement to Arbitrate. To the fullest extent permitted by law,Executive and Company agree to arbitrate any controversy, claim or disputebetween them arising out of or in any way related to this Agreement, theemployment relationship between Company and Executive and any disputes upontermination of employment, including but not limited to breach of contract,
Copyright © 2012 www.secdatabase.com. All Rights Reserved.Please Consider the Environment Before Printing This Document

tort, discrimination, harassment, wrongful termination, demotion, discipline,failure to accommodate, family and medical leave, compensation or benefitsclaims, constitutional claims; and any claims for violation of any local, stateor federal law, statute, regulation or ordinance or common law. Claims forbreach of Company's Employee Innovations and Proprietary Rights Agreement,workers' compensation, unemployment insurance benefits and Company's right toobtain injunctive relief pursuant to Section 12 above are excluded. For thepurpose of this agreement to arbitrate, references to "Company" include allparent, subsidiary or related entities and their employees, supervisors,officers, directors, agents, pension or benefit plans, pension or benefit plansponsors, fiduciaries, administrators, affiliates and all successors and assignsof any of them, and this Agreement shall apply to them to the extent Executive'sclaims arise out of or relate to their actions on behalf of Company.
13.1 Initiation of Arbitration. Either party may exercise the rightto arbitrate by providing the other party with written notice of any and allclaims forming the basis of such right in sufficient detail to inform the otherparty of the substance of such claims. In no event shall the request forarbitration be made after the date when institution of legal or equitableproceedings based on such claims would be barred by the applicable statute oflimitations.
13.2 Arbitration Procedure. The arbitration will be conducted inMaricopa county, Arizona, by a single neutral arbitrator and in accordance withthe then current rules for resolution of employment disputes of the AmericanArbitration Association ("AAA"). The parties are entitled to representation byan attorney or other representative of their choosing. The arbitrator shall havethe power to enter any award that could be entered by a judge of the trial courtof the State of Arizona, and only such power, and shall follow the law. Theparties agree to abide by and perform any award rendered by the arbitrator.Judgment on the award may be entered in any court having jurisdiction thereof.
13.3 Costs of Arbitration. Each party shall bear one half the costof the arbitration filing and hearing fees, and the cost of the arbitrator.
8
14. General Provisions.
14.1 Successors and Assigns. The rights and obligations of Companyunder this Agreement shall inure to the benefit of and shall be binding upon thesuccessors and assigns of Company. Executive shall not be entitled to assign anyof Executive's rights or obligations under this Agreement.
14.2 Waiver. Either party's failure to enforce any provision ofthis Agreement shall not in any way be construed as a waiver of any suchprovision, or prevent that party thereafter from enforcing each and every otherprovision of this Agreement.
14.3 Attorneys' Fees. Each side will bear its own attorneys' fees
Copyright © 2012 www.secdatabase.com. All Rights Reserved.Please Consider the Environment Before Printing This Document

in any dispute unless a statutory section at issue, if any, authorizes the awardof attorneys' fees to the prevailing party.
14.4 Severability. In the event any provision of this Agreement isfound to be unenforceable by an arbitrator or court of competent jurisdiction,such provision shall be deemed modified to the extent necessary to allowenforceability of the provision as so limited, it being intended that theparties shall receive the benefit contemplated herein to the fullest extentpermitted by law. If a deemed modification is not satisfactory in the judgmentof such arbitrator or court, the unenforceable provision shall be deemeddeleted, and the validity and enforceability of the remaining provisions shallnot be affected thereby.
14.5 Interpretation; Construction. The headings set forth in thisAgreement are for convenience only and shall not be used in interpreting thisAgreement. This Agreement has been drafted by legal counsel representingCompany, but Executive has participated in the negotiation of its terms.Furthermore, Executive acknowledges that Executive has had an opportunity toreview and revise the Agreement and have it reviewed by legal counsel, ifdesired, and, therefore, the normal rule of construction to the effect that anyambiguities are to be resolved against the drafting party shall not be employedin the interpretation of this Agreement.
14.6 Governing Law. This Agreement will be governed by andconstrued in accordance with the laws of the United States and the State ofArizona. Each party consents to the jurisdiction and venue of the state orfederal courts in Maricopa county, Arizona, if applicable, in any action, suit,or proceeding arising out of or relating to this Agreement.
14.7 Notices. Any notice required or permitted by this Agreementshall be in writing and shall be delivered as follows with notice deemed givenas indicated: (a) by personal delivery when delivered personally; (b) byovernight courier upon written verification of receipt; (c) by telecopy orfacsimile transmission upon acknowledgment of receipt of electronictransmission; or (d) by certified or registered mail, return receipt requested,upon verification of receipt. Notice shall be sent to the addresses set forthbelow, or such other address as either party may specify in writing.
14.8 Survival. Sections 8 ("No Conflict of Interest"), 9("Post-Termination Non-Competition"), 10 ("Confidentiality and ProprietaryRights"), 11 ("Nonsolicitation"), 12 ("Injunctive Relief"), 13 ("Agreement toArbitrate"), 14 ("General Provisions") and 15 ("Entire Agreement") of thisAgreement shall survive Executive's employment by Company.
9
15. Entire Agreement. This Agreement, including Company EmployeeInnovations and Proprietary Rights Assignment Agreement incorporated herein byreference and the Form Option Agreement, constitutes the entire agreementbetween the parties relating to this subject matter and supersedes all prior or
Copyright © 2012 www.secdatabase.com. All Rights Reserved.Please Consider the Environment Before Printing This Document

simultaneous representations, discussions, negotiations, and agreements, whetherwritten or oral. This Agreement may be amended or modified only with the writtenconsent of Executive and the Board of Company. No oral waiver, amendment ormodification will be effective under any circumstances whatsoever.
[THE REMAINDER OF THIS PAGE IS INTENTIONALLY LEFT BLANK.]
THE PARTIES TO THIS AGREEMENT HAVE READ THE FOREGOING AGREEMENT AND FULLYUNDERSTAND EACH AND EVERY PROVISION CONTAINED HEREIN. WHEREFORE, THE PARTIESHAVE EXECUTED THIS AGREEMENT ON THE DATES SHOWN BELOW.
EXECUTIVE
Dated: _________________________ ____________________________________HAMISH N. BREWER
10839 E. Gold Dust Ave,Scottsdale, AZ 85259 USA
COMPANY
DATED: _________________________ By: ____________________________________JAMES D. ARMSTRONG, CEO
[SIGNATURE PAGE TO BREWER EMPLOYMENT AGREEMENT]
EXHIBIT A
Form of Option Agreement
See attached.
EXHIBIT B
Form of Mutual Release
See attached.
Copyright © 2012 www.secdatabase.com. All Rights Reserved.Please Consider the Environment Before Printing This Document

Copyright © 2012 www.secdatabase.com. All Rights Reserved.Please Consider the Environment Before Printing This Document

Exhibit 23.1
CONSENT OF INDEPENDENT AUDITORS
We consent to the incorporation by reference in Registration Statement No. 333-51043 on Form S-3 and Registration Statement Nos.333-05951, 333-45729, 333-60231, 333-60233, 333-30154, 333-59644, 333-72228, 333-86902, and 333-101920 of JDA Software Group, Inc.on Form S-8, of our report dated January 20, 2003, appearing in this Annual Report on Form 10-K of JDA Software Group, Inc. for the yearended December 31, 2002.
DELOITTE & TOUCHE LLPPhoenix, Arizona
March 18, 2003
Copyright © 2012 www.secdatabase.com. All Rights Reserved.Please Consider the Environment Before Printing This Document

Copyright © 2012 www.secdatabase.com. All Rights Reserved.Please Consider the Environment Before Printing This Document

EXHIBIT 99.1
CERTIFICATION OF CHIEF EXECUTIVE OFFICER
I, James D. Armstrong, Chief Executive Officer of JDA Software Group, Inc. (the �Registrant�), do hereby certify in accordance with 18U.S.C. 1350, as adopted pursuant to Section 906 of the Sarbanes-Oxley Act of 2002, that, based on my knowledge:
(1) the Annual Report on Form 10-K of the Registrant, to which this certification is attached as an exhibit (the �Report�), fully complieswith the requirements of section 13(a) of the Securities Exchange Act of 1934 (15 U.S.C. 78m); and
(2) the information contained in the Report fairly presents, in all material respects, the financial condition and results of operations of theRegistrant.
Dated: March 18, 2003 /s/ James D. ArmstrongJames D. ArmstrongChief Executive Officer
Copyright © 2012 www.secdatabase.com. All Rights Reserved.Please Consider the Environment Before Printing This Document

Copyright © 2012 www.secdatabase.com. All Rights Reserved.Please Consider the Environment Before Printing This Document

EXHIBIT 99.2
CERTIFICATION OF CHIEF FINANCIAL OFFICER
I, Kristen L. Magnuson, Executive Vice President and Chief Financial Officer of JDA Software Group, Inc. (the �Registrant�), do herebycertify in accordance with 18 U.S.C. 1350, as adopted pursuant to Section 906 of the Sarbanes-Oxley Act of 2002, that, based on myknowledge:
(1) the Annual Report on Form 10-K of the Registrant, to which this certification is attached as an exhibit (the �Report�), fully complieswith the requirements of Section 13(a) of the Securities Exchange Act of 1934 (15 U.S.C. 78m); and
(2) the information contained in the Report fairly presents, in all material respects, the financial condition and results of operations of theRegistrant.
Dated: March 18, 2003 /s/ Kristen L. MagnusonKristen L. MagnusonExecutive Vice President andChief Financial Officer
Copyright © 2012 www.secdatabase.com. All Rights Reserved.Please Consider the Environment Before Printing This Document