Embed Size (px)
Citation preview

JBoss Enterprise Application Platform 5
Performance Tuning Guide
for use with JBoss Enterprise Application Platform 5.2.x
Edition 5.2.0
Last Updated: 2017-10-13


JBoss Enterprise Application Platform 5 Performance Tuning Guide
for use with JBoss Enterprise Application Platform 5.2.xEdition 5.2.0
Andrig Miller
Edited by
Eva Kopalova
Petr Penicka
Russell Dickenson
Scott Mumford

Legal Notice
Copyright © 2012 Red Hat, Inc.
This document is licensed by Red Hat under the Creative Commons Attribution-ShareAlike 3.0Unported License. If you distribute this document, or a modified version of it, you must provideattribution to Red Hat, Inc. and provide a link to the original. If the document is modified, all RedHat trademarks must be removed.
Red Hat, as the licensor of this document, waives the right to enforce, and agrees not to assert,Section 4d of CC-BY-SA to the fullest extent permitted by applicable law.
Red Hat, Red Hat Enterprise Linux, the Shadowman logo, JBoss, OpenShift, Fedora, the Infinitylogo, and RHCE are trademarks of Red Hat, Inc., registered in the United States and othercountries.
Linux ® is the registered trademark of Linus Torvalds in the United States and other countries.
Java ® is a registered trademark of Oracle and/or its affiliates.
XFS ® is a trademark of Silicon Graphics International Corp. or its subsidiaries in the UnitedStates and/or other countries.
MySQL ® is a registered trademark of MySQL AB in the United States, the European Union andother countries.
Node.js ® is an official trademark of Joyent. Red Hat Software Collections is not formally relatedto or endorsed by the official Joyent Node.js open source or commercial project.
The OpenStack ® Word Mark and OpenStack logo are either registered trademarks/service marksor trademarks/service marks of the OpenStack Foundation, in the United States and othercountries and are used with the OpenStack Foundation's permission. We are not affiliated with,endorsed or sponsored by the OpenStack Foundation, or the OpenStack community.
All other trademarks are the property of their respective owners.
Abstract
This Performance Tuning Guide provides guidance on optimizing the performance of the JBossEnterprise Application Platform 5 and its patch releases.

. . . . . . . . . . . . . . . . . . . . . . . . . . . . . . . . . . . . . . . . . . . . . . . . . . . . . . . . . . . . . . . . . . . . . . . . . . . . . . . . . . . . . . . . . . . . . . . . . . . . . . . . . . . . . . . . . . . . . . . . . . . . . . . . . . . . . . . . . . . . . . . . . . . . . . . . . . . . . . . . . . . . . . . . . . . . . . . . . . . . . . . . . . . . . . . . . . . . . . . . . . . . . . . . . . . . . . . . . . . . . . . . . . . . . . . . . . . . . . . . . . . . . . . . . . . . . . . . . . . . . . . . . . . . . . . . . . . . . . . .
. . . . . . . . . . . . . . . . . . . . . . . . . . . . . . . . . . . . . . . . . . . . . . . . . . . . . . . . . . . . . . . . . . . . . . . . . . . . . . . . . . . . . . . . . . . . . . . . . . . . . . . . . . . . . . . . . . . . . . . . . . . . . . . . . . . . . . . . . . . . . . . . . . . . . . . . . . . . . . . . . . . . . . . . . . . . . . . . . . . . . . . . . . . . . . . . . . . . . . . . . . . . . . . . . . . . . . . . . . . . . . . . . . . . . . . . . . . . . . . . . . . . . . . . . . . . . . . . . . . . . . . . . . . . . . . . . . . . . . . .
. . . . . . . . . . . . . . . . . . . . . . . . . . . . . . . . . . . . . . . . . . . . . . . . . . . . . . . . . . . . . . . . . . . . . . . . . . . . . . . . . . . . . . . . . . . . . . . . . . . . . . . . . . . . . . . . . . . . . . . . . . . . . . . . . . . . . . . . . . . . . . . . . . . . . . . . . . . . . . . . . . . . . . . . . . . . . . . . . . . . . . . . . . . . . . . . . . . . . . . . . . . . . . . . . . . . . . . . . . . . . . . . . . . . . . . . . . . . . . . . . . . . . . . . . . . . . . . . . . . . . . . . . . . . . . . . . . . . . . . .
. . . . . . . . . . . . . . . . . . . . . . . . . . . . . . . . . . . . . . . . . . . . . . . . . . . . . . . . . . . . . . . . . . . . . . . . . . . . . . . . . . . . . . . . . . . . . . . . . . . . . . . . . . . . . . . . . . . . . . . . . . . . . . . . . . . . . . . . . . . . . . . . . . . . . . . . . . . . . . . . . . . . . . . . . . . . . . . . . . . . . . . . . . . . . . . . . . . . . . . . . . . . . . . . . . . . . . . . . . . . . . . . . . . . . . . . . . . . . . . . . . . . . . . . . . . . . . . . . . . . . . . . . . . . . . . . . . . . . . . .
. . . . . . . . . . . . . . . . . . . . . . . . . . . . . . . . . . . . . . . . . . . . . . . . . . . . . . . . . . . . . . . . . . . . . . . . . . . . . . . . . . . . . . . . . . . . . . . . . . . . . . . . . . . . . . . . . . . . . . . . . . . . . . . . . . . . . . . . . . . . . . . . . . . . . . . . . . . . . . . . . . . . . . . . . . . . . . . . . . . . . . . . . . . . . . . . . . . . . . . . . . . . . . . . . . . . . . . . . . . . . . . . . . . . . . . . . . . . . . . . . . . . . . . . . . . . . . . . . . . . . . . . . . . . . . . . . . . . . . . .
. . . . . . . . . . . . . . . . . . . . . . . . . . . . . . . . . . . . . . . . . . . . . . . . . . . . . . . . . . . . . . . . . . . . . . . . . . . . . . . . . . . . . . . . . . . . . . . . . . . . . . . . . . . . . . . . . . . . . . . . . . . . . . . . . . . . . . . . . . . . . . . . . . . . . . . . . . . . . . . . . . . . . . . . . . . . . . . . . . . . . . . . . . . . . . . . . . . . . . . . . . . . . . . . . . . . . . . . . . . . . . . . . . . . . . . . . . . . . . . . . . . . . . . . . . . . . . . . . . . . . . . . . . . . . . . . . . . . . . . .
. . . . . . . . . . . . . . . . . . . . . . . . . . . . . . . . . . . . . . . . . . . . . . . . . . . . . . . . . . . . . . . . . . . . . . . . . . . . . . . . . . . . . . . . . . . . . . . . . . . . . . . . . . . . . . . . . . . . . . . . . . . . . . . . . . . . . . . . . . . . . . . . . . . . . . . . . . . . . . . . . . . . . . . . . . . . . . . . . . . . . . . . . . . . . . . . . . . . . . . . . . . . . . . . . . . . . . . . . . . . . . . . . . . . . . . . . . . . . . . . . . . . . . . . . . . . . . . . . . . . . . . . . . . . . . . . . . . . . . . .
Table of Contents
PREFACE1. FILE NAME CONVENTIONS
CHAPTER 1. INTRODUCTION1.1. PLATFORM COMPONENTS
CHAPTER 2. CONNECTORS2.1. JAVA I/O CONNECTOR
2.1.1. maxKeepAliveRequests2.1.2. maxThreads2.1.3. minSpareThreads2.1.4. Tuning the thread pool
2.2. AJP CONNECTOR
CHAPTER 3. SERVLET CONTAINER3.1. CACHED CONNECTION MANAGER3.2. HTTP SESSION REPLICATION
3.2.1. Full Replication3.2.2. Buddy Replication3.2.3. Monitoring JGroups via JMX
CHAPTER 4. EJB 3 CONTAINER4.1. STATELESS SESSION BEAN
4.1.1. ThreadLocalPool4.1.2. StrictMaxPool4.1.3. Pool Sizing4.1.4. Local EJB3 Calls
4.2. STATEFUL SESSION BEAN4.2.1. Stateful Configuration4.2.2. Full Replication4.2.3. Buddy Replication
4.3. REMOTE EJB CLIENTS4.4. CACHEDCONNECTIONMANAGER4.5. ENTITY BEANS
4.5.1. Second level cache4.5.1.1. Marking entities to be cached
4.5.2. Prepared Statements4.5.3. Batch Inserts
4.5.3.1. Batch Processing; Tests And ResultsConclusions
4.5.4. Batching Database Operations4.6. MESSAGE DRIVEN BEANS
CHAPTER 5. JAVA CONNECTOR ARCHITECTURE5.1. DATA SOURCES5.2. DATA SOURCE CONNECTION POOLING5.3. MINIMUM POOL SIZE5.4. MAXIMUM POOL SIZE5.5. BALANCING POOL SIZE VALUES5.6. JMS INTEGRATION OR PROVIDER
CHAPTER 6. JAVA MESSAGE SERVICE (JMS) PROVIDER6.1. SWITCHING THE DEFAULT MESSAGING PROVIDER TO HORNETQ
33
44
6668999
111112121314
161616161617181819191921222225262631373840
44444444454548
5050
Table of Contents
1

. . . . . . . . . . . . . . . . . . . . . . . . . . . . . . . . . . . . . . . . . . . . . . . . . . . . . . . . . . . . . . . . . . . . . . . . . . . . . . . . . . . . . . . . . . . . . . . . . . . . . . . . . . . . . . . . . . . . . . . . . . . . . . . . . . . . . . . . . . . . . . . . . . . . . . . . . . . . . . . . . . . . . . . . . . . . . . . . . . . . . . . . . . . . . . . . . . . . . . . . . . . . . . . . . . . . . . . . . . . . . . . . . . . . . . . . . . . . . . . . . . . . . . . . . . . . . . . . . . . . . . . . . . . . . . . . . . . . . . . .
. . . . . . . . . . . . . . . . . . . . . . . . . . . . . . . . . . . . . . . . . . . . . . . . . . . . . . . . . . . . . . . . . . . . . . . . . . . . . . . . . . . . . . . . . . . . . . . . . . . . . . . . . . . . . . . . . . . . . . . . . . . . . . . . . . . . . . . . . . . . . . . . . . . . . . . . . . . . . . . . . . . . . . . . . . . . . . . . . . . . . . . . . . . . . . . . . . . . . . . . . . . . . . . . . . . . . . . . . . . . . . . . . . . . . . . . . . . . . . . . . . . . . . . . . . . . . . . . . . . . . . . . . . . . . . . . . . . . . . . .
. . . . . . . . . . . . . . . . . . . . . . . . . . . . . . . . . . . . . . . . . . . . . . . . . . . . . . . . . . . . . . . . . . . . . . . . . . . . . . . . . . . . . . . . . . . . . . . . . . . . . . . . . . . . . . . . . . . . . . . . . . . . . . . . . . . . . . . . . . . . . . . . . . . . . . . . . . . . . . . . . . . . . . . . . . . . . . . . . . . . . . . . . . . . . . . . . . . . . . . . . . . . . . . . . . . . . . . . . . . . . . . . . . . . . . . . . . . . . . . . . . . . . . . . . . . . . . . . . . . . . . . . . . . . . . . . . . . . . . . .
. . . . . . . . . . . . . . . . . . . . . . . . . . . . . . . . . . . . . . . . . . . . . . . . . . . . . . . . . . . . . . . . . . . . . . . . . . . . . . . . . . . . . . . . . . . . . . . . . . . . . . . . . . . . . . . . . . . . . . . . . . . . . . . . . . . . . . . . . . . . . . . . . . . . . . . . . . . . . . . . . . . . . . . . . . . . . . . . . . . . . . . . . . . . . . . . . . . . . . . . . . . . . . . . . . . . . . . . . . . . . . . . . . . . . . . . . . . . . . . . . . . . . . . . . . . . . . . . . . . . . . . . . . . . . . . . . . . . . . . .
. . . . . . . . . . . . . . . . . . . . . . . . . . . . . . . . . . . . . . . . . . . . . . . . . . . . . . . . . . . . . . . . . . . . . . . . . . . . . . . . . . . . . . . . . . . . . . . . . . . . . . . . . . . . . . . . . . . . . . . . . . . . . . . . . . . . . . . . . . . . . . . . . . . . . . . . . . . . . . . . . . . . . . . . . . . . . . . . . . . . . . . . . . . . . . . . . . . . . . . . . . . . . . . . . . . . . . . . . . . . . . . . . . . . . . . . . . . . . . . . . . . . . . . . . . . . . . . . . . . . . . . . . . . . . . . . . . . . . . . .
. . . . . . . . . . . . . . . . . . . . . . . . . . . . . . . . . . . . . . . . . . . . . . . . . . . . . . . . . . . . . . . . . . . . . . . . . . . . . . . . . . . . . . . . . . . . . . . . . . . . . . . . . . . . . . . . . . . . . . . . . . . . . . . . . . . . . . . . . . . . . . . . . . . . . . . . . . . . . . . . . . . . . . . . . . . . . . . . . . . . . . . . . . . . . . . . . . . . . . . . . . . . . . . . . . . . . . . . . . . . . . . . . . . . . . . . . . . . . . . . . . . . . . . . . . . . . . . . . . . . . . . . . . . . . . . . . . . . . . . .
6.2. EXPLOITING HORNETQ'S SUPPORT OF LINUX'S NATIVE ASYNCHRONOUS I/O6.3. HORNETQ'S JOURNAL6.4. HORNETQ AND TRANSACTIONS
CHAPTER 7. LOGGING PROVIDER7.1. CONSOLE LOGGING7.2. APPENDERS7.3. LOCATION OF LOG FILES7.4. WRAPPING LOG STATEMENTS
CHAPTER 8. PRODUCTION CONFIGURATION
CHAPTER 9. JAVA VIRTUAL MACHINE TUNING9.1. 32-BIT VS. 64-BIT JVM9.2. LARGE PAGE MEMORY9.3. GARBAGE COLLECTION AND PERFORMANCE TUNING9.4. OTHER JVM OPTIONS TO CONSIDER
CHAPTER 10. PROFILING10.1. INSTALL10.2. ENABLE OPROFILE10.3. CONTROLLING OPROFILE10.4. DATA CAPTURE
CHAPTER 11. PUTTING IT ALL TOGETHER11.1. TEST CONFIGURATION11.2. TESTING STRATEGY11.3. TEST RESULTS
APPENDIX A. REVISION HISTORY
505152
5353545555
57
5858596263
6565656666
68686868
71
Performance Tuning Guide
2

PREFACE
1. FILE NAME CONVENTIONS
The following naming conventions are used in file paths for readability. Each convention is styled sothat it stands out from the rest of text:
JBOSS_EAP_DIST
The installation root of the JBoss Enterprise Application Platform instance. This folder contains themain folders that comprise the server such as /jboss-as, /seam, and /resteasy.
PROFILE
The name of the server profile you use as part of your testing or production configuration. Theserver profiles reside in JBOSS_EAP_DIST/jboss-as/server.
The conventions above use the Unix path separator character of the forward slash (/), which applies toRed Hat Enterprise Linux and Solaris. If the JBoss Enterprise Application Platform instance is installedon Windows Server, swap the forward slash for the backslash character (\) in all instructions.
PREFACE
3

CHAPTER 1. INTRODUCTIONThe Performance Tuning Guide is a comprehensive reference on the configuration and optimizationJBoss Enterprise Application Platform 5. Performance tuning the platform is unique to eachinstallation because of internal and external factors. The optimization of external factors including:application design, scalability, database performance, network performance and storage performanceare outside the scope of this book. If Red Hat Enterprise Linux is the underlying operating system,refer to the Red Hat Enterprise Linux Performance Tuning Guide and Storage Administration Guide forfurther optimization advice. Otherwise refer to the specific vendor's documentation.
Performance tuning is not a goal in itself but a cyclical process of performance monitoring,configuration changes and review. The objective should be to meet business requirements, with eachchange having a measurable objective. It's recommended to apply one change at a time and monitorthe results so that you can judge what does and does not result in a performance improvement. Not allworkloads are equal, and not all changes will result in a performance improvement. The JBossEnterprise Application Platform's components are the main focus of this book but coverage alsoincludes a chapter on the Java Virtual Machine as it's performance is also critical.
1.1. PLATFORM COMPONENTS
Figure 1.1. JBoss Enterprise Application Platform architecture
Figure 1.1, “JBoss Enterprise Application Platform architecture” illustrates the components of JBossEnterprise Application Platform. Performance tuning of each component is covered in its own chapterbut since each component interacts with one or more other components there is some overlappingmaterial.
For each component various performance-related settings are discussed, including:
Connection pooling
Thread pooling
Object and/or component pooling
I/O configuration
Performance Tuning Guide
4

Logging and JMS provider
Replication options
Caching
CHAPTER 1. INTRODUCTION
5

CHAPTER 2. CONNECTORSTwo main web connectors will be covered in this chapter: the Java I/O connector, using Java I/O toserve HTTP(s) connections directly to the platform and a native connector that uses Apache’s PortableRuntime (APR) native code library. An Apache web server can be used to serve all HTTP(S) requests,using mod_jk or mod_cluster connect to the platform. In this scenario the tuning of the thread poolused for serving requests via the Apache Jserv Protocol (AJP) will be covered.
2.1. JAVA I/O CONNECTOR
The Java I/O Connector is used when clients send HTTP requests directly to the platform, and not to afront end HTTPD server such as an Apache web server. To use this connector the libraries of the nativeconnector must be removed because they're used by default if detected by the platform. Manyconfiguration options are available, including the following performance-related options:
maxKeepAliveRequests
maxThreads
minSpareThreads
All of these parameters are configured in the server.xml file for the JBoss Web embedded servletcontainer: JBOSS_EAP_DIST/jboss-as/server/PROFILE/deploy/jbossweb.sar. Near the topof this file is the Connector section, where these parameters are configured. Note that the minimalconfiguration does not include JBoss Web.
2.1.1. maxKeepAliveRequests
The maxKeepAliveRequests parameter specifies how many pipe-lined requests a user agent cansend over a persistent HTTP connection (which is the default in HTTP 1.1) before it will close theconnection. A persistent connection is one which the client expects to remain open once established,instead of closing and reestablishing the connection with each request. Typically the client (a browser,for example) will send an HTTP header called a “Connection” with a token called "keep-alive" to specifya persistent connection. This was one of the major improvements of the HTTP protocol in version 1.1over 1.0 because it improves scalability of the server considerably, especially as the number of clientsincreases. To close the connection, the client or the server can include the “Connection” attribute in itsheader, with a token called “close”. This signals either side that after the request is completed, theconnection is to be closed. The client, or user agent, can even specify the “close” token on its“Connection” header with its initial request, specifying that it does not want to use a persistentconnection.
The default value for maxKeepAliveRequests is 100, so after an initial request from a client creates apersistent connection, it can send 100 requests over that connection before the server will close theconnection.
Below is an extract from an actual client request which illustrates an HTTP POST with Connection: keep-alive content in the header, followed by an HTTP POST, again with Connection: keep-alive specified. This is the 100th client request so in the response to the HTTP POST is theinstruction Connection: close.
<!-- A HTTP/1.1 Connector on port 8080 --> <Connector protocol="HTTP/1.1" port="8080" address="${jboss.bind.address}" connectionTimeout="20000" redirectPort="8443" />
Performance Tuning Guide
6

POST /Order/NewOrder HTTP/1.1Connection: keep-aliveCookie: $Version=0; JSESSIONID=VzNmllbAmPDMInSJQ152bw__; $Path=/OrderContent-Type: application/x-www-form-urlencodedContent-Length: 262User-Agent: Jakarta Commons-HttpClient/3.1Host: 192.168.1.22:8080
customerid=86570&productid=1570&quantity=6&productid=6570&quantity=19&productid=11570&quantity=29&productid=16570&quantity=39&productid=21570&quantity=49&productid=26570&quantity=59&productid=&quantity=&productid=&quantity=&productid=&quantity=&NewOrder=NewOrderGET /Order/OrderInquiry?customerId=86570 HTTP/1.1Connection: keep-aliveCookie: $Version=0; JSESSIONID=VzNmllbAmPDMInSJQ152bw__; $Path=/OrderUser-Agent: Jakarta Commons-HttpClient/3.1Host: 192.168.1.22:8080
[1181 bytes missing in capture file]HTTP/1.1 200 OKServer: Apache-Coyote/1.1X-Powered-By: Servlet 2.5; JBoss-5.0/JBossWeb-2.1Content-Type: text/html;charset=ISO-8859-1Content-Length: 1024Date: Wed, 26 Jan 2011 17:10:40 GMTConnection: close
To put this in real-life terms, imagine a test run during which 1,800 users process 3.6 milliontransactions (all via HTTP POST and GET requests) with maxKeepAliveRequests set to the defaultvalue of 100. With 1,800 clients, each performing 2,000 requests (3.6 million/ 1,800 = 2,000), thenumber of times connections are closed is 36,000 (3.0 million / 100). Depending on the number ofclients, type of clients (browsers tend to open multiple connections on multiple threads forperformance reasons), and type of content being served to the client, this can be significantly higher.Besides the overhead of tearing down, and creating new connections, there is also the overhead,although small, of tracking how many requests have been made over each persistent connection.
There are three options to consider for maxKeepAliveRequests:
set it to a specific value, higher than the default;
disable persistent connections by setting the value 1;
set persistent connections to unlimited by setting the value -1.
Setting maxKeepAliveRequests to the value 1 in effect disables persistent connections because thissets the limit to 1. The other options of raising the limit to a specific value and unlimited require furtheranalysis of the situation. Setting the value to unlimited is easiest because the platform will usewhatever it calculates to be the optimal value for the current workload. However it's possible to run outof operating system file descriptors, if there are more concurrent clients than there are file descriptorsavailable. Choosing a specific value is a more conservative approach and is less risky than usingunlimited. The best method of finding the most suitable value is to monitor the maximum number ofconnections used and if this is higher than what's available, set it higher then do performance testing.
The importance of tuning the maxKeepAliveRequests value can be revealed in conductingperformance tests. In a repeat of the above test, maxKeepAliveRequests was set to 1 (disabled) andthe tests re-run. After only a little over 58,000 transactions, processing stopped because of I/O errorsat the client. With maxKeepAliveRequests set to unlimited and the same tests run again, a 1.2%
CHAPTER 2. CONNECTORS
7
increase in throughput was gained. Although this may seem a small increase, it can be significant. Forexample, if you take into account the 1.2% increase in the number of transactions that can beprocessed in this test, over a 12 hour period (e.g. one business day), it adds up to over 1.5 million moretransactions that can be processed.
Below is an extract from server.xml in which maxKeepAliveRequests is set to -1 or unlimited.
2.1.2. maxThreads
The maxThreads parameter creates the thread pool that sits directly behind the connector, andactually processes the request. It’s very important to set this for most workloads as the default is quitelow, currently 200 threads. If no threads are available when the request is made, the request is refusedso getting this value right is critical. In the event the maximum number of threads is reached, this willbe noted in the log:
2011-01-27 16:18:08,881 INFO [org.apache.tomcat.util.net.JIoEndpoint] (http-192.168.1.22-8080-Acceptor-0) Maximum number of threads (200) created for connector with address /192.168.1.22 and port 8080
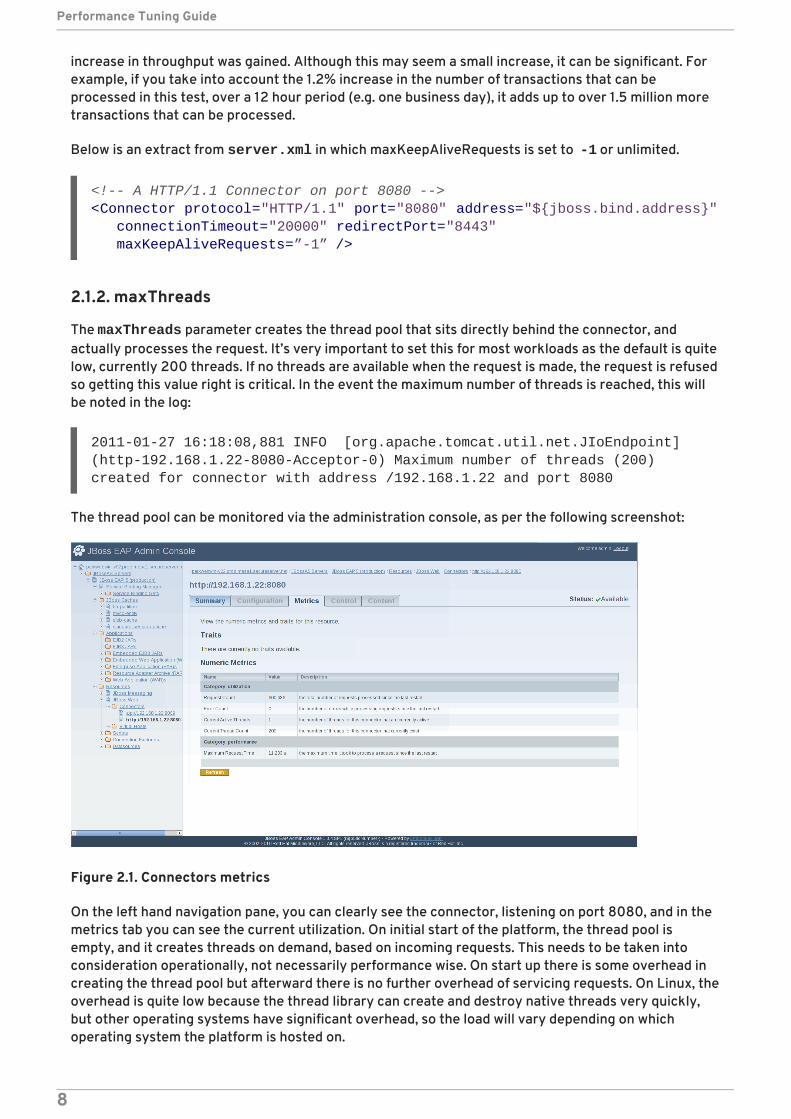
The thread pool can be monitored via the administration console, as per the following screenshot:
Figure 2.1. Connectors metrics
On the left hand navigation pane, you can clearly see the connector, listening on port 8080, and in themetrics tab you can see the current utilization. On initial start of the platform, the thread pool isempty, and it creates threads on demand, based on incoming requests. This needs to be taken intoconsideration operationally, not necessarily performance wise. On start up there is some overhead increating the thread pool but afterward there is no further overhead of servicing requests. On Linux, theoverhead is quite low because the thread library can create and destroy native threads very quickly,but other operating systems have significant overhead, so the load will vary depending on whichoperating system the platform is hosted on.
<!-- A HTTP/1.1 Connector on port 8080 --><Connector protocol="HTTP/1.1" port="8080" address="${jboss.bind.address}" connectionTimeout="20000" redirectPort="8443" maxKeepAliveRequests=”-1” />
Performance Tuning Guide
8
2.1.3. minSpareThreads
The minSpareThreads parameter specifies the minimum number of threads that must be maintainedin the thread pool. If sufficient resources are available set minSpareThreads to the same value asmaxThreads. If maxThreads is set to represent a peak, but that peak does not last very long, setminSpareThreads to a lower value. That way, the platform can reclaim those resources as threads sitidle. There are a couple of ways to look at the interaction between these two parameters. If resourceconsumption is not an issue, set minSpareThreads to what you need to process at peak loads, but allowfor an increase by setting maxThreads between 10% and 25% higher. If resource consumption is aconcern, then set the maxThreads to only what you need for peak, and set the minSpareThreads to avalue that won’t hurt overall throughput after a drop in load occurs. Most applications have largeswings in load over the course of a given day.
NOTE
From a performance testing perspective, its also important to consider this threadcreation overhead. It's best practice to allow an initial warm-up period, on start up of theplatform, before making performance measurements. The measurement period shouldalso be long enough to allow garbage collection to occur for all heap spaces, includingEden, Survivor, and Old generation. If this advice is not followed, results will be skewedby start up activity instead of reflecting sustained throughput and response times.
2.1.4. Tuning the thread pool
To size the thread pool correctly, you need to consider how many concurrent clients you will beserving through this connector. The number could vary greatly depending on what executes behind theHTTP request, and what response times are required. Setting the pool large is a reasonable optionbecause threads are only created on demand. It's best to monitor the pool through the administrationconsole, as the metrics tab shows the number of active threads, and how many it created. If the numberof active threads reaches the maximum defined by the maxThreads parameter, it needs to beincreased and again monitored.
Below is an extract from the server.xml configuration file in which all three parameters are assignedspecific values.
2.2. AJP CONNECTOR
The AJP (Apache JServ Protocol) connector is typically used when a web server, such as Apache webserver, is placed in front of the platform. Since AJP is its own binary protocol, configuration is different,but shares quite a bit of commonality in what can be configured with the Java I/O Endpoint. Thefollowing configuration parameters will be discussed:
maxThreads
minSpareThreads
Two of these parameters - maxThreads and minSpareThreads - are common with the Java I/OConnector. The AJP protocol also has a keep alive parameter but its default behavior is to always keepconnections open, which avoids the overhead of setting up and tearing down connections. A common
<!-- A HTTP/1.1 Connector on port 8080 --><Connector protocol="HTTP/1.1" port="8080" address="${jboss.bind.address}" connectionTimeout="20000" redirectPort="8443" maxThreads="3000" minSpareThreads="2000" maxKeepAliveRequests="-1" />
CHAPTER 2. CONNECTORS
9

configuration is to have the front-end web server in a DMZ, with a firewall allowing only incomingHTTP(S) to the web server, and another firewall between the web server and the platform, allowingonly AJP traffic. Maintaining persistent connections in such a configuration is more efficient than thecost of constantly connecting and disconnecting the various components. Firewall configuration isanother factor to consider because some firewalls close connections when no traffic has passed over aconnection in a certain period.
The same considerations for the AJP connector apply as for the Java I/O connector. The thread pool ismonitored in the same way in the administration console. The values set are also set in the sameconfiguration file: server.xml. Below is an extract from server.xml in which both maxThreads andminSpareThreads have been configured:
<!-- A AJP 1.3 Connector on port 8009 --> redirectPort="8443" maxThreads="3000" minSpareThreads="2000" /> <Connector protocol="AJP/1.3" port="8009" address="${jboss.bind.address}"
Performance Tuning Guide
10

CHAPTER 3. SERVLET CONTAINERThere are two main configuration parameters that have a direct effect on performance and scalability:cached connection manager and HTTP session replication.
3.1. CACHED CONNECTION MANAGER
The Cached Connection Manager is used for debugging data source connections and supporting lazyenlistment of a data source connection in a transaction, tracking whether they are used and releasedproperly by the application. At the cost of some overhead, it can provide tracing of the usage, and makesure that connections from a data source are not leaked by your application. Although that seems likean advantage, in some instances it's considered an anti-pattern and so to be avoided. If you are usingbean managed transactions (BMT), it allows you to do the following (shown in pseudo-code):
Instead of:
The first option is very useful for debugging purposes but should not be used in a productionenvironment. In the default, standard and all configurations, the CachedConnectionManager isconfigured to be in the servlet container in debug mode. It's also configured in the productionconfiguration but with debug mode off. If you do not use BMT, and/or you do not have the anti-pattern,described earlier, it's best to remove the CachedConnectionManager. The configuration is in the file server.xml in the directory JBOSS_EAP_DIST/jboss-as/server/<PROFILE>/deploy/jbossweb.sar. Note that the minimal configuration does notinclude JBoss Web.
Below is an extract from server.xml in which the CachedConnectionManager is enabled.
To disable the CachedConnectionManager, comment the last three lines, as per the following example:
Connection connection = dataSource.getConnection();transaction.begin();<Do some work>transaction.commit();
transaction.begin();Connection connection = datasource.getConnection();<Do some work>transaction.commit();
<!-- Check for unclosed connections and transaction terminated checks in servlets/jsps.Important: The dependency on the CachedConnectionManager in META-INF/jboss-service.xml must be uncommented, too --><Valve className="org.jboss.web.tomcat.service.jca.CachedConnectionValve" cachedConnectionManagerObjectName="jboss.jca:service=CachedConnectionManager" transactionManagerObjectName="jboss:service=TransactionManager" />
<!-- Check for unclosed connections and transaction terminated checks in servlets/jsps.Important: The dependency on the CachedConnectionManager in META-INF/jboss-service.xml must be uncommented, too<Valve className="org.jboss.web.tomcat.service.jca.CachedConnectionValve"
CHAPTER 3. SERVLET CONTAINER
11

Another configuration file also needs to be edited: jboss-beans.xml in the JBOSS_EAP_DIST/jboss-as/server/<PROFILE>/deploy/jbossweb.sar/META-INF directory.Note that the minimal configuration does not include JBoss Web. This file is used by the micro-container for JBoss Web’s integration with it, and it specifies the connections between the dependentcomponents. In this case, the CachedConnectionManager’s valve is dependent on the transactionmanager. So, in order to get rid of the valve properly, we have to remove the dependency informationfrom this configuration file. The pertinent information is at the top of the file, and it looks like thefollowing:
Comment these lines as in the following example:
When editing XML, comments cannot be nested so it's important to get this correct. Refer to thesection on the EJB 3 container for instructions on removing the CachedConnectionManager fromthere.
3.2. HTTP SESSION REPLICATION
For the servlet container, when deployed using clustering and a cluster aware application, HTTPsession replication becomes a key aspect of performance and scalability across the cluster. There aretwo main methods for HTTP session replication: full replication, in which HTTP sessions are replicatedto all nodes in the cluster, and buddy replication, where each node has at least one buddy, with onebeing the default. Each replication method has the ability to do full object replication, and fined grainedreplication, where only changes in the HTTP session are replicated.
3.2.1. Full Replication
Full replication is the default configuration because with most clusters having only a few nodes itprovides maximum benefit with minimum configuration overhead. When there are more than twonodes, the method of replication needs to be considered as each option offers different benefits.
cachedConnectionManagerObjectName="jboss.jca:service=CachedConnectionManager" transactionManagerObjectName="jboss:service=TransactionManager" />-->
<!-- Only needed if the org.jboss.web.tomcat.service.jca.CachedConnectionValve is enabled in the tomcat server.xml file. -→ <depends>jboss.jca:service=CachedConnectionManager</depends><!-- Transaction manager for unfinished transaction checking in the CachedConnectionValve --><depends>jboss:service=TransactionManager</depends>
<!-- Only needed if the org.jboss.web.tomcat.service.jca.CachedConnectionValve is enabled in the tomcat server.xml file. -→ <!--<depends>jboss.jca:service=CachedConnectionManager</depends> -→ <!-- Transaction manager for unfinished transaction checking in the CachedConnectionValve --><!--<depends>jboss:service=TransactionManager</depends>-->
Performance Tuning Guide
12

Although full replication requires the least configuration, as the number of nodes increases theoverhead of maintaining inter-node connections increases. Factors which need to be consideredinclude: how often new sessions are created, how often old sessions are removed, how often the datain the HTTP session changes, and the session's size. Making a decision requires answers to thesequestions and relies on knowledge of each applications' usage pattern of HTTP sessions.
To illustrate this with a practical example, consider a clustered application which uses the HTTP sessionto store a reference to a single stateful session bean. The bean is reused by the client to scroll througha result set derived from a database query. Even when the result set is no longer needed, and replacedwithin the stateful session bean with another result set, the stateful session bean session is notcanceled, but instead a method is called that resets the state. So the HTTP session stays the same forthe duration of the clients' requests, no matter how many are made and how long they are active. Thisusage pattern is very static, and involves a very small amount of data. It will scale very well with fullreplication, as the default network protocol is a reliable multicast over UDP. One packet (evenassuming a 1,500 byte Ethernet frame size) will be sent over the network for all nodes to retrieve whena new HTTP session is created, and when one is removed for each user. In this case it's an efficientoperation even across a fairly large cluster because the memory overhead is very small since the HTTPsession is just holding a single reference. The size of the HTTP session is just one factor to consider.Even if the HTTP session is moderate in size, the amount is memory used calculated as:
As the number of clients and/or cluster nodes increases, the amount of memory in use across all nodesrapidly increases. The amount of memory in use is the same across all cluster nodes because they eachneed to maintain the same information, despite the fact that each client is communicating with onlyone node at a time.
In summary, whether you should use the default configuration of full replication is really up to yourparticular workload. If you have multiple applications deployed at the same time, the complexityincreases, as you might have applications that behave quite differently between each other, where theHTTP session is concerned. If you have a cluster larger than two nodes, and you are doing HTTPsession replication, then consider buddy replication as your starting point.
3.2.2. Buddy Replication
Buddy replication is a configuration in which state replication is limited to two or more cluster nodes,although the default is paired nodes. When failover occurs it's not limited to that node's buddy but canoccur to any node and session information migrated to the new node if necessary. This method ofreplication is very scalable because the overhead in memory usage and network traffic is significantlydecreased. Buddy replication is configured in a file called jboss-cache-manager-jboss-beans.xml, in the directory: JBOSS_EAP_DIST/jboss-as/server/<PROFILE>/deploy/cluster/jboss-cache-manager.sar/META-INF. Note thatthe default, standard and minimal configurations do not have the clustering configuration, nor dothey have clustering code deployed.
HTTP session sizex active sessionsx number of nodes
<!-- Standard cache used for web sessions --><entry><key>standard-session-cache</key><value> <bean name="StandardSessionCacheConfig" class="org.jboss.cache.config.Configuration"> ... <property name="buddyReplicationConfig"> <bean
CHAPTER 3. SERVLET CONTAINER
13

For buddy replication to work as advertised, it is highly recommended that you use sticky sessions. Inother words, once a session is created in a node on the cluster, repeated requests will continue to go tothe same node in the cluster. If you don’t do this, you will defeat the advantages of buddy replication, asrequests going to another node, let’s say in a round robin fashion, will not have the state information,and the state will have to be migrated, similar to a fail-over scenario.
3.2.3. Monitoring JGroups via JMX
When the Enterprise Application Platform clustering services create a JGroups Channel to use forintra-cluster communication, they also register with the JMX server a number of MBeans related tothat channel; one for the channel itself and one for each of its constituent protocols. For usersinterested in monitoring the performance-related behavior of a channel, a number of MBean attributesmay prove useful.
jboss.jgroups:cluster=<cluster_name>,protocol=UDP,type=protocol
Provides statistical information on the sending and receipt of messages over the network, alongwith statistics on the behavior of the two thread pools used to carry incoming messages up thechannel's protocol stack.
Useful attributes directly related to the rate of transmission and receipt include MessagesSent, BytesSent, MessagesReceived and BytesReceived.
Useful attributes related to the behavior of the thread pool used to carry ordinary incomingmessages up the protocol stack include IncomingPoolSize and IncomingQueueSize.Equivalent attributes for the pool of threads used to carry special, unordered "out-of-band"messages up the protocol stack include OOBPoolSize and OOBQueueSize. Note that OOBQueueSize will typically be 0 as the standard JGroups configurations do not use a queue forOOB messages.
jboss.jgroups:cluster=<cluster_name>,protocol=UNICAST,type=protocol
Provides statistical information on the behavior of the protocol responsible for ensuring lossless,ordered delivery of unicast (i.e. point-to-point) messages.
The ratio of NumRetransmissions to MessagesSent can be tracked to see how frequentlymessages are not being received by peers and need to be retransmitted. The NumberOfMessagesInReceiveWindows attribute can be monitored to track how many messagesare queuing up on a recipient node waiting for a message with an earlier sequence number to bereceived. A high number indicates messages are being dropped and need to be retransmitted.
jboss.jgroups:cluster=<cluster_name>,protocol=NAKACK,type=protocol
Provides statistical information on the behavior of the protocol responsible for ensuring lossless,ordered delivery of multicast (i.e. point-to-multipoint) messages.
Use the XmitRequestsReceived attribute to track how often a node is being asked to re-transmita messages it sent; use XmitRequestsSent to track how often a node is needing to requestretransmission of a message.
jboss.jgroups:cluster=<cluster_name>,protocol=FC,type=protocol
class="org.jboss.cache.config.BuddyReplicationConfig"> <!-- Just set to true to turn on buddy replication --> <property name="enabled">true</property>
Performance Tuning Guide
14

Provides statistical information on the behavior of the protocol responsible for ensuring fastmessage senders do not overwhelm slow receivers.
Attributes useful for monitoring whether threads seeking to send messages are having to blockwhile waiting for credits from receivers include Blockings, AverageTimeBlocked and TotalTimeBlocked.
CHAPTER 3. SERVLET CONTAINER
15

CHAPTER 4. EJB 3 CONTAINERThe EJB 3 container is the JBoss Enterprise Application Platform's implementation of the Java EE 5specifications for EJB 3.0. It implements all the standard bean types described by the specification e.g.stateless session beans, stateful session beans, message driven beans, and entity beans. While these allshare the same names as EJB 2.x components, they are now based on a POJO development modelusing annotations, or optionally deployment descriptors. There are various configuration parametersthat will affect the throughput of your application depending on which of these beans you use. Eachbean type will be discussed in this chapter, including configuration parameters that affect overallthroughput and the inter-relationships between them.
4.1. STATELESS SESSION BEAN
With stateless session beans, our implementation uses a pooling strategy to offer a “method ready”instance for use by the application. There are two types of pools that can be configured for use withstateless session beans:
ThreadLocalPool
StrictMaxPool
4.1.1. ThreadLocalPool
The ThreadLocalPool is a pool of instances in a thread local variable and is the default pool type. It'slocal to each execution thread within the platform that executes methods on a stateless session bean.The ThreadLocalPool is derived from an unlimited pool implementation, so there is no limit to thenumber of instances that can be in the pool. The actual number of instances is dependent on otherparameters. For each thread that executes methods on a stateless session bean within yourapplication, the pool size of the ThreadlocalPool is the number of unique stateless sessions. Since thereis a pool on each thread, the actual number of instances is the number of stateless sessions beans inyour deployments multiplied by the number of threads that execute methods on those beans. Thisapproach has a configuration advantage because the size of the pool is changed dynamically withchanges to the application - e.g. the adding or removing of stateless session beans over time.
4.1.2. StrictMaxPool
StrictMaxPool is the other pool implementation, a single pool used across all execution threads, thatcontains instances of stateless session beans. It has a maximum size so if there are no availableinstances in the pool for a thread to execute, the calling thread will block and wait until there is anavailable instance. If a StrictMaxPool is used for stateless session beans and it's not sized correctly, thiscreates a bottleneck. In some circumstances this might be used deliberately to limit the rate oftransactions but it's not recommended.
If there are no available instances in the pool at the time a call is made, the calling thread will beblocked but only for a certain amount of time (which can vary depending on the configuration). If thattime period is exceeded, the error message below will be logged, confirming that the pool is too small.This situation may not be obvious but can result in significant performance degradation. When usingthe StrictMaxPool, correct sizing is critical and this is covered in the next section.
javax.ejb.EJBException: Failed to acquire the pool semaphore, strictTimeout=10000
4.1.3. Pool Sizing
Performance Tuning Guide
16

It's recommended to set the size of the pool equal to the maximum number of concurrent requests.Confirming the maximum can best be done by monitoring statistics using the JMX console. In thisexample the maximum size of the pool is 8,000, which is quite large based on the other data that isshown. The CreateCount metric shows that the platform created 65 beans for the pool, and that 7,959is the current available count. This means at that moment, there are 41 instances of the bean in use.
Figure 4.1. JMX Console - JMX MBean View
NOTE
The statistics presented in the JMX console must be manually refreshed and, because ofits implementation, are not guaranteed to be accurate but should be used as a guideonly.
There is no absolute "best" pool implementation because much depends on the application and itsdeployment. The recommended method of deciding between the two is to test both with yourapplication and infrastructure. For StrictMaxPool it's critical that the pool's usage be monitored toensure that it's large enough, otherwise performance statistics will be skewed.
Stateless session beans are configured in the file ejb3-interceptors-aop.xml, which is located inthe directory: JBOSS_EAP_DIST/jboss-as/server/<PROFILE>/deploy. The relevant sections aretitled “Stateless Bean” and “JACC Stateless Bean”. Stateless Bean is a basic, stateless bean whileJACC Stateless Bean provides for permission classes to satisfy the Java EE authorization model. Notethat the minimal configuration does not include the EJB 3 container.
NOTE
Since for ThreadLocalPool there is no limit to the number of instances that can be in thepool, the maxSize and timeout parameters are irrelevant.
4.1.4. Local EJB3 Calls
When an application uses a remote EJB3 interface the call is serialized and deserialized by defaultbecause this is a requirement of network communication. If the EJB is running in the same JVM as theclient calling it, all communications are local so there's no need for serialization or deserialization. Toavoid the CPU load involved and so improve the application's responsiveness, enable the systemproperty org.jboss.ejb3.IsLocalInterceptor.passByRef to true, for example: add -Dorg.jboss.ejb3.remoting.IsLocalInterceptor.passByRef=true to JAVA_OPTS in theserver's run.conf configuration file.
CHAPTER 4. EJB 3 CONTAINER
17

4.2. STATEFUL SESSION BEAN
As a stateful component, stateful session beans require a different implementation from the container.First, because they maintain state, that state is associated exclusively with one client, so there is onlyone instance per client. Second, because they maintain state and are tied to one client, the containermust prevent any concurrent modification to that state. Third, because they maintain state, that statehas to participate in replication for a clustered environment. Finally, if the instance is not accessed in aperiod of time, and the bean is not canceled, the state may be passivated to disk. All these factors playa role in the throughput that can be achieved when using stateful session beans. It's important tochoose the right state management solution for your application. Stateful session beans can be useful,especially where the number of concurrent users is not too large- i.e. into millions.
To help with understanding the difference that a stateless vs. stateful approach can have, consider areal-life situation where a stateless approach was the imposed standard. In this situation there was anentire set of services in the application that looked-up data for users for use in maintenance tasks, orplacing orders, etc. In almost all cases, these “look-ups” would return more data than the user couldeffectively deal with, and there was logic in the client to page through the list. As it paged through thelist, if it needed to get more data than was on the client at that time, it called the server again. When itdid this it actually passed a row number to the server to say, starting at this row number, return backthe next set of rows. This made the queries very complex, as the queries themselves had to scrollthrough the data and return the correct set. Of course the user could page down through, but also backup again, and this process was repeated many times in certain cases. So, the design was stateless, butthe load it actually exacted on the database was extraordinarily high, and the response time of theservices themselves suffered. Users complained of poor response times as well. To solve this issue theservices were made stateful (with one instance per client), the paging logic was removed from thequeries themselves, and scrolled through the data in memory as the client paged through the rows. Allqueries were limited to a maximum number of rows, because returning more than that meant that thesearch criteria for the look-up should be expanded to narrow down the result set to make it usable forthe end user anyway. The results of the change to a stateful approach were a significant decrease indatabase load and an improvement in response times. This is a good example of how stateful sessionbeans can be used, and used effectively.
4.2.1. Stateful Configuration
There are two aspects of stateful session beans to be considered: the underlying cache that supportsthe life-cycle of the bean and replication of the bean's state.
In the same file that configures HTTP session replication is the configuration for stateful session beanreplication. The configuration file is jboss-cache-manager.sar, in the directory JBOSS_EAP_DIST/jboss-as/server/PROFILE/deploy/cluster/jboss-cache-manager.sar/META-INF. Note that the default, standard and minimal configurations do nothave the clustering configuration, nor the clustering code deployed. In this file is an entry called sfsb-cache, as seen below:
<!-- Standard cache used for EJB3 SFSB caching --><entry><key>sfsb-cache</key><value> <bean name="StandardSFSBCacheConfig" class="org.jboss.cache.config.Configuration"><!-- No transaction manager lookup --><!-- Name of cluster. Needs to be the same for all members --><property name="clusterName">${jboss.partition.name:DefaultPartition}-SFSBCache</property><!-- Use a UDP (multicast) based stack. Need JGroups flow control (FC) because we are using asynchronous replication. -->
Performance Tuning Guide
18

The two most important configuration parameters are the node locking scheme and isolation level,which are analogous to databases. Pessimistic locking assumes that multiple clients should not ownthe lock on the data, in this case the data in the cache, at the same time. The isolation level is similar tothe concept in database management systems. Since the container above this cache already preventsmore than one client modifying the state of a bean, changing the node locking scheme provides noadvantage.
4.2.2. Full Replication
As we discussed in HTTP session replication, full replication is the default, and it will perform just finein two-node clusters. State in stateful session beans tends to be even more complex than state in theHTTP session, so use caution in using full replication for stateful session beans than for the HTTPsession. If buddy replication is used for either HTTP sessions or stateful session beans, and the web tierof the platform (servlet container) is not separated from the rest of the platform, it is good practice touse the same method for both. Even if you can get away with full replication on HTTP sessions, youruse of stateful session beans may drive you towards buddy replication.
4.2.3. Buddy Replication
Again, as we discussed with HTTP session replication, buddy replication is available for stateful sessionbeans as well. The configuration file for buddy replication is jboss-cache-manager-jboss-beans.xml, in the directory JBOSS_EAP_DIST/jboss-as/server/PROFILE/deploy/cluster/jboss-cache-manager.sar/META-INF. Note that the default, standard and minimal configurations do not have the clustering configuration, nor theclustering code deployed. To configure buddy replication for stateful session beans, change thebuddyReplicationConfig's property to true, as in the following extract.
4.3. REMOTE EJB CLIENTS
The configuration options discussed so far apply to both local and remote clients, but there areadditional configuration options that needs to be considered where remote clients are concerned: maxPoolSize and clientMaxPoolSize. Local clients use the local interface of stateless andstateful session beans, so the execution of those methods is done on the incoming connectors' threadpool. Remote clients call the remote interfaces of stateless and stateful session beans, interacting withthe platform's remoting solution. It accepts connections from remote clients, marshals the argumentsand calls the remote interface of the corresponding bean, whether that is a stateless or stateful sessionbean. Note that the minimal configuration does not have the remoting service deployed.
<property name="multiplexerStack">${jboss.default.jgroups.stack:udp}</property><property name="fetchInMemoryState">true</property><property name="nodeLockingScheme">PESSIMISTIC</property><property name="isolationLevel">REPEATABLE_READ</property>
<!-- Standard cache used for EJB3 SFSB caching --><entry><key>sfsb-cache</key> <value> <bean name="StandardSFSBCacheConfig" class="org.jboss.cache.config.Configuration"> ... <property name="buddyReplicationConfig"> <bean class="org.jboss.cache.config.BuddyReplicationConfig"> <!-- Just set to true to turn on buddy replication --> <property name="enabled">true</property>
CHAPTER 4. EJB 3 CONTAINER
19

The configuration file is remoting-jboss-beans.xml, in the directory JBOSS_EAP_DIST/jboss-as/server/<PROFILE>/deploy, an extract of which is below:
The most important parameter here is the maxPoolSize parameter which specifies the number ofworker threads that will be used to execute the remote calls. The comments state that the default is300, which is quite large, but that depends on the number of remote clients, their request rate, and thecorresponding response times. Just like any other connector, the number of clients calling the server,their request rate, and the corresponding response times need to be taken into account to size thepool correctly. One way to determine this is to monitor the statistics on the client to see how manyinvocations occur. For example, if the remote client is a stateless session bean on another server, theJMX console contains invocation statistics that could be examined to determine how many concurrentcalls are coming from that client. If there are many remote servers acting as clients then statisticshave to be obtained from each remote client. To change the pool size, uncomment the line and set thevalue.
Consider the opposite case, where the client is the local server, calling another remote server. There isa matching pool parameter called clientMaxPoolSize, specified in the same configuration file asabove:
In this example the parameter is present but commented so the default value of 50 applies. To changethe value, uncomment the line and change the value to the desired value.
To determine the required value it's necessary to understand how many concurrent calls are beingmade to remote beans. Depending on the method used, there is some monitoring you can do. Forexample, if the remote bean invocations are being made from a local stateless session bean the JMXconsole statistics can be used. Included are the statistics for that stateless session's bean andconcurrentCalls value to see how many concurrent invocations are being made, as in the followingexample:
<!-- Parameters visible only to server --><property name="serverParameters"> <map keyClass="java.lang.String" valueClass="java.lang.String"> <!-- Selected optional parameters: --> <!-- Maximum number of worker threads on the --> <!-- server (socket transport). Defaults to 300. --> <!--entry><key>maxPoolSize</key> <value>500</value></entry--> <!-- Number of seconds after which an idle worker thread will be --> <!-- purged (socket transport). By default purging is not enabled. --> <!--entry><key>idleTimeout</key> <value>60</value></entry--> </map></property>
<!-- Maximum number of connections in client invoker's --> <!-- connection pool (socket transport). Defaults to 50. --> <!--entry><key>clientMaxPoolSize</key> <value>20</value></entry-->
Performance Tuning Guide
20

Figure 4.2. JMX Console - JMX MBean View
The screenshot shows the attribute InvokeStats and it has an attribute value that shows theInvocationStatistics class, and the value concurrentCalls equals 14. This could give you a hint abouthow many client connections need to be available in the pool.
4.4. CACHEDCONNECTIONMANAGER
The servlet container chapter described the cached connection manager, what it does, and how youcan remove it. This section shows how to remove it from the EJB 3 container, and a short note abouthow you can remove it from the old EJB 2.x container as well. Note that the minimalconfigurationdoes not contain the EJB 3 container.
The configuration for the cached connection manager, in the EJB 3 container, is ejb3-interceptors-aop.xml, in the directory: JBOSS_EAP_DIST/jboss-as/server/<PROFILE>/deploy.
To remove the cached connection manager, comment or remove the following two lines from theconfiguration file.
The configuration of the EJB 2.x container is in standardjboss.xml, in the directory: JBOSS_EAP_DIST/jboss-as/server/<PROFILE>/conf. Note that the minimal configuration,does not contain the EJB 2.x container.
To remove the cached connection manager, comment or remove the following line from each containerconfiguration (there are many in the file).
<interceptor factory="org.jboss.ejb3.connectionmanager.CachedConnectionInterceptorFactory" scope="PER_CLASS"/><interceptor-ref name="org.jboss.ejb3.connectionmanager.CachedConnectionInterceptorFactory"/>
<interceptor>org.jboss.resource.connectionmanager.CachedConnectionInterceptor</interceptor>
CHAPTER 4. EJB 3 CONTAINER
21

4.5. ENTITY BEANS
Entity beans are avoided by some because of historical issues with EJB 1 and EJB 2 but with EJB 3their use is rising. In discussing how to get the best possible throughout while using entity beans, thereare four topics to cover:
second-level cache
prepared statements
batch inserts
batching database operations
4.5.1. Second level cache
As Hibernate is the JPA provider, entity beans in EJB 3 sit on top of Hibernate. This is in stark contrastto the old EJB 2.x entities, which had their own complete implementation apart from Hibernate. In fact,Hibernate, and other object relational mapping (ORM) frameworks were the inspiration for JPA andEJB 3 entities. Since Hibernate is the underlying implementation, we have a second level cache that wecan utilize, just as if we were using Hibernate directly instead of entities. Hibernate's second levelcache has gone through some evolution over the years, and has improved with each release. The JBossCache implementation as the second level cache, has some very useful features, and the defaultconfiguration for EJB 3 entities is very good. To enable the use of the second level cache for entities inan EJB3 application, persistence units are defined in the persistence.xml file that is packaged withan application. Here is an extract from persistence.xml:
The configuration parameters relevant to the second level cache are:
<persistence xmlns="http://java.sun.com/xml/ns/persistence" xmlns:xsi="http://www.w3.org/2001/XMLSchema-instance" xsi:schemaLocation="http://java.sun.com/xml/ns/persistence http://java.sun.com/xml/ns/persistence/persistence_1_0.xsd" version="1.0"> <persistence-unit name="services" transaction-type="JTA"> <provider>org.hibernate.ejb.HibernatePersistence</provider> <jta-data-source>java:/MySqlDS</jta-data-source> <properties> <property name="hibernate.cache.region.factory_class" value="org.hibernate.cache.jbc2.JndiMultiplexedJBossCacheRegionFactory"/> <property name="hibernate.cache.region.jbc2.cachefactory" value="java:CacheManager"/> <property name="hibernate.cache.use_second_level_cache" value="true"/> <property name="hibernate.cache.use_query_cache" value="false"/> <property name="hibernate.cache.use_minimal_puts" value="true"/> <property name="hibernate.cache.region.jbc2.cfg.entity" value="mvcc-entity"/> <property name="hibernate.cache.region_prefix" value="services"/> </properties> </persistence-unit></persistence>
Performance Tuning Guide
22

hibernate.cache.region.factory_class specifies the cache factory to be used by theunderlying Hibernate session factory, in this example JndiMultiplexedJBossCacheRegionFactory. Thisfactory implementation creates a single cache for all types of data that can be cached (entities,collections, query results and timestamps). With other options you can create caches that are tailoredto each type of data, in separate cache instances. In this example, there is only one cache instance, andonly entities and collections are cached. The second important parameter above is thehibernate.cache.use_second_level_cache, which is set to true, enabling the cache. The query cache isdisabled with hibernate.cache.use_query_cache set to false.
hibernate.cache.use_minimal_puts, set to true, specifies the behavior of writes to the cache. Itminimizes the writes to the cache at the expense of more reads, the default for a clustered cache.
hibernate.cache.region.jbc2.cfg.entity specifies the underlying JBoss Cacheconfiguration, in this case the multiversion concurrency control (MVCC) entity cache (mvcc-entity).
hibernate.cache.region_prefix is set to the same name as the persistent unit itself. Specifyinga name here is optional, but if you do not specify a name, a long default name is generated. The mvcc-entity configuration is in the file jboss-cache-manager-jboss-beans.xml, in the directory: JBOSS_EAP_DIST/jboss-as/server/<PROFILE>/deploy/cluster/jboss-cache-manager.sar/META-INF. Note that the default, standard and minimal configurations do nothave the JBoss Cache configured or deployed.
Below is an extract from the configuration of the MVCC cache:
<!-- A config appropriate for entity/collection caching that uses MVCC locking --> <entry><key>mvcc-entity</key> <value> <bean name="MVCCEntityCache" class="org.jboss.cache.config.Configuration"><!-- Node locking scheme --><property name="nodeLockingScheme">MVCC</property><!-- READ_COMMITTED is as strong as necessary for most 2nd Level Cache use cases. --><property name="isolationLevel">READ_COMMITTED</property><property name="useLockStriping">false</property><!-- Mode of communication with peer caches. INVALIDATION_SYNC is highly recommended as the mode for use with entity and collection caches. --><property name="cacheMode">INVALIDATION_SYNC</property> <property name="evictionConfig"> <bean class="org.jboss.cache.config.EvictionConfig"> <property name="wakeupInterval">5000</property> <!-- Overall default --> <property name="defaultEvictionRegionConfig"> <bean class="org.jboss.cache.config.EvictionRegionConfig"> <property name="regionName">/</property> <property name="evictionAlgorithmConfig"> <bean class="org.jboss.cache.eviction.LRUAlgorithmConfig"> <!-- Evict LRU node once we have more than this number of nodes --> <property name="maxNodes">500000</property> <!-- And, evict any node that hasn't been accessed in this many seconds --> <property name="timeToLiveSeconds">7200</property>
CHAPTER 4. EJB 3 CONTAINER
23

In the configuration above, the following parameters are of particular interest in tuning the cache:
isolationLevel
cacheMode
maxNodes
timeToLiveSeconds
minTimeToLiveSeconds
isolationLevel is similar to database isolation level for transactions. JBoss Cache is fullytransactional and can participate as a full resource in transactions, so that stale data is not stored inthe cache. Some applications may not be affected by stale data in a cache so configuration can varyaccordingly. The default is READ_COMMITTED, which is the same as in the example data sourceconfiguration for the database connection pool. It's recommended to set this the same as in the datasource to avoid odd behavior in the application. JBoss Cache supports the following isolation levels:
NONE
READ_UNCOMMITTED
READ_COMMITTED
REPEATABLE_READ
SERIALIZABLE
The default is REPEATABLE_READ, which is used in the example configuration.
cacheMode specifies that across the cluster, cached entities will be invalidated on other nodes, so thatanother node does not return a different value. Invalidation is done in a synchronous manner, whichensures that the cache is in a correct state when the invalidation request completes. This is veryimportant for caches when in a cluster, and is the recommended setting. Replication, instead ofinvalidation, is an option, but is much more expensive and limits scalability, possibly preventingcaching from being effective in providing increased throughput. In this example, cacheMode is set toINVALIDATION_SYNC.
The following three parameters - maxNodes, timeToLiveSeconds, and minTimeToLiveSeconds -define the size of the cache and how long things live in the cache.
maxNodes specifies the maximum number of nodes that can be in the cache at any one time. Thedefault for maxNodes is 10,000, which is quite small, and in the example configuration it was set to500,000. Deciding how large to make this value depends on the entities being cached, the access
<!-- Do not evict a node that's been accessed within this many seconds. Set this to a value greater than your max expected transaction length. --> <property name="minTimeToLiveSeconds">300</property> </bean> </property> </bean></property>
Performance Tuning Guide
24

pattern of those entities, and how much memory is available to use. If the cache uses too muchmemory, other platform components could be starved of resources and so performance may bedegraded. If the cache is too small, not enough entities may be stored in the cache to be of benefit.
timeToLiveSeconds specifies how long something remains in the cache before it becomes eligible tobe evicted. The default value is 1,000 seconds or about 17 minutes, which is a quite short duration.Understanding the access and load pattern is important. Some applications have very predictable loadpatterns, where the majority of the load occurs at certain times of day, and lasts a known duration.Tailoring the time that entities stay in the cache towards that pattern helps tune performance.
minTimeToLive sets the minimum amount of time an entity will remain in the cache, the default being120 seconds, or two minutes. This parameter should be set to equal or greater than the maximumtransaction timeout value, otherwise it's possible for a cached entity to be evicted from the cachebefore the transaction completes.
4.5.1.1. Marking entities to be cached
The @Cache annotation is added on an entity bean you want to cache and it takes one argument:CacheConcurrencyStrategy. The @Cache annotation requires the following two imports:
import org.hibernate.annotations.Cache;
import org.hibernate.annotations.CacheConcurrencyStrategy;
The @Cache annotation looks like the following in the entity code: @Cache(usage =CacheConcurrencyStrategy.READ_ONLY) where the CacheConcurrentyStrategy can be:
NONE
NONSTRICT_READ_WRITE
READ_ONLY
TRANSACTIONAL
Of these options, only two strategies are relevant to JBoss Cache as the second level cache provider:READ_ONLY, and TRANSACTIONAL.
READ_ONLY guarantees that the entity will never change while the application is running. This allowsthe use of read only semantics, which is by far the most optimal performing cache concurrencystrategy.
TRANSACTIONAL allows the use of database ACID semantics on entities in the cache. Anything to becached while the application is running should be marked TRANSACTIONAL. Avoid caching entitiesthat are likely to be updated frequently. If an entity is updated too frequently, caching can actuallyincrease overhead and so slow throughput. Each update sends an invalidation request across thecluster, so that the state is correctly maintained as well, so the overhead affects every node, not onlythe node where the update occurs.
Starting with the JBoss Cache 3.x series, which made its debut in EAP 5.0.0, we have a transactionalcache that uses MVCC. Also, the mvcc-entity configuration we looked at earlier is the default forentities with the platform. MVCC is a well-known algorithm that allows updates to be in process, butnot blocking other transactions from reading the data. So writers (updates) do not block readers fromreading a consistent image of the data. This is very important for concurrency, as it's not a pessimisticlock that will block anyone from reading the data. For the window of time that a transaction may beupdating a particular entity, other transactions in flight that are readers of that entity will not block,and get a consistent image of the data for their use, until, of course, the transaction commits. This
CHAPTER 4. EJB 3 CONTAINER
25

provides a level of scalability that was non-existent in any second level cache providers until JBossCache 3.x introduced it (at least for updates). Of course, multiple updates in different transactions tothe same entity will still block. Once again the read/write ratios are extremely important to gettinggood throughput with any entities that are cached and can be updated while the application is running.
4.5.2. Prepared Statements
When using the JPA annotations for queries, the result is prepared statements that will be executedagainst the database. Prepared statements have two phases for execution: preparation of thestatement, and execution of the statement. Statement preparation involves significant CPU load so toimprove throughput prepared statements can be cached. Statements can be cached either via theJDBC driver or configuration of the data source. The method recommended here is to configure thedata source because it works whether or not the JDBC driver provides for caching of preparedstatements. For example, the MySQL JDBC driver's prepared statement caching is done on aconnection by connection basis. In the case of many connections, this implementation takes upconsiderably more memory, also each prepared statement must be cached for each connection in thepool.
To enable caching of prepared statement, add the following two lines to the data source configurationfile, a file with the pattern *-ds.xml (where the * is usually your database, such as oracle, mysql, db2,etc.) in the directory: JBOSS_EAP_DIST/jboss-as/server/PROFILE/deploy. Note that the minimal configuration does not support data sources.
The first line enables the prepared statement cache and sets the size of the cache. This should be largeenough to hold all the prepared statements across any and all deployed applications using thisparticular data source (multiple data sources can be configured). The second line states that if tworequests are executed in the same transaction the prepared statement cache should return the samestatement. This will avoid the use of CPU cycles in preparing the same statements over and over again,increasing throughput and decreasing response times. The actual improvement will vary according tospecific circumstances but is well worth the effort.
4.5.3. Batch Inserts
Batch inserts is the ability to send a set of inserts to a single table, once to the database as a singleinsert statement instead of individual statements. This method improves latency, and data insert times.These improvements occur not only with batch processing, loading large quantities of data, but alsowith OLTP workloads.
The following is an example of regular inserts:
<prepared-statement-cache-size>100</prepared-statement-cache-size> <shared-prepared-statements>true</shared-prepared-statements>
INSERT INTO EJB3.OrderLine (OrderId, LineNumber, ProductId, Quantity, Price, ExtendedPrice) VALUES("67ef590kalk4568901thbn7190akioe1", 1, 25, 10, 1.00, 10.00);INSERT INTO EJB3.OrderLine (OrderId, LineNumber, ProductId, Quantity, Price, ExtendedPrice) VALUES("67ef590kalk4568901thbn7190akioe1", 2, 16, 1, 1.59, 1.59);INSERT INTO EJB3.OrderLine (OrderId, LineNumber, ProductId, Quantity, Price, ExtendedPrice) VALUES("67ef590kalk4568901thbn7190akioe1", 3, 55, 5, 25.00, 125.00);INSERT INTO EJB3.OrderLine (OrderId, LineNumber, ProductId, Quantity, Price, ExtendedPrice) VALUES("67ef590kalk4568901thbn7190akioe1", 4, 109, 1, 29.98, 29.98);
Performance Tuning Guide
26

The following is an example of batch inserts:
Before discussing how to enable this behavior from an EJB 3 application using Hibernate, the exampledata model above needs further explanation. The primary key of the EJB3.OrderLine table is theOrderId, and the LineNumber. Originally, the entity Order and OrderLine had a MySQL auto incrementcolumn as the OrderId, and the primary key of Order, and the first half of the primary key of theOrderLine entity. The SQL syntax for normal inserts is unaffected by this, as Hibernate does not needto know the primary key value ahead of time. In fact, the order in which those SQL statements are sentto the database does not matter. With batch inserts, since we want to send them all over as one set,and eventually as one SQL statement, Hibernate needs to know the primary key ahead of time. This isfor the simple reason that Hibernate pushes each "persist" request from an EJB 3 application into anaction queue, and there may be inserts to various tables interleaved in a single transaction. Hibernatehas to sort the inserts by primary key in order to batch them at all. An auto increment column value isonly known after the insert, so this will fail. Therefore the model has to use a primary key that can beknown prior to being inserted into the database. A generated value can be used as the primary key, butthe generation strategy used must allow it to be retrieved via JDBC before the inserts are flushed tothe database. IDENTITY cannot be used as a primary key generation strategy, but TABLE, SEQUENCEand UUID can be used. It's important to know that when Hibernate performs sorting to get the insertstatements batched together it uses the hash code value of the entity so it's imperative that the hashcode method is properly defined.
NOTE
UUID is a Hibernate-specific key generation technique and is not in the JPA or JPA 2specification so code will not be portable if it is used.
The following code sample illustrates batch processing. It's an extract of the Order performanceapplication, and inserts reference data that is needed for the test runs.
INSERT INTO EJB3.OrderLine (OrderId, LineNumber, ProductId, Quantity, Price, ExtendedPrice) VALUES("67ef590kalk4568901thbn7190akioe1", 1, 25, 10, 1.00, 10.00) , ("67ef590kalk4568901thbn7190akioe1", 2, 16, 1, 1.59, 1.59) , ("67ef590kalk4568901thbn7190akioe1", 3, 55, 5, 25.00, 125.00) , ("67ef590kalk4568901thbn7190akioe1", 4, 109, 1, 29.98, 29.98);
@TransactionTimeout(4800) public void createInventories(int batchSize) throws CreateDataException {if(numberOfInventoryRecords() > 0) { throw new CreateDataException("Inventory already exists!");}int rowsToFlush = 0, totalRows = 0;Random quantity = new Random(System.currentTimeMillis());List<Product> products = productManager.findAllProducts();List<DistributionCenter> distributionCenters = distributionCenterManager.findAllDistributionCenters();InventoryPK inventoryPk = null;Inventory inventory = null;for(Product product: products) { for(DistributionCenter distributionCenter: distributionCenters) { inventoryPk = new InventoryPK(); inventory = new Inventory();inventoryPk.setProductId(product.getProductId());inventoryPk.setDistributionCenterId(distributionCenter.getDistributionCent
CHAPTER 4. EJB 3 CONTAINER
27

The method is annotated with a TransactionTimeout annotation that specifies a longer transactiontimeout value, because the default of 300 seconds is too short in this instance. The method takes asingle parameter called batchSize which allows tuning of the batch insert size. This is good practicebecause it allows different batch insert sizes to be tested to optimize the results. After creating theinventory entity, persist is called on the entity manager. The code that follows is significant indemonstrating the batch processing method.
After calling persist a check is made to confirm that the number of entities or rows persisted is equalto the batchSize parameter. If so, the entity manager's flush method is called. Since this is a singlelarge transaction, the normal Hibernate behavior is to flush everything on the transaction commit, orwhen the JDBC batch size has been reached. To flush a specific number of rows, instead of lettingHibernate decide, an explicit call to flush is made. Note that Hibernate will flush at two intervals: at thecommit of the transaction and when it gets to the JDBC batch size parameter. So there's no need toexplicitly call flush at all, instead set the JDBC batch size parameter and avoid the batch sizeparameter altogether. In this case the batch size parameter was explicitly set to the maximum once,then different batch sizes less than or equal to the JDBC batch size parameter were tested. This couldbe simpler, but the alternative would be to change the Hibernate configuration and redeploy theapplication in between tests. The Hibernate JDBC batch size parameter (hibernate.jdbc.batch_size) isspecified in the properties values of persistence.xml for the persistence unit of the applicationentities.
The parameter hibernate.order_inserts tells Hibernate to order the inserts by the primary key (usingthe entities hash code value actually). If entities use a generated primary key, you need to make surethat fetching generated key values is enabled, but this is enabled in Hibernate by default.
Below is an extract from the configuration file with both these parameters set:
erId());inventory.setPrimaryKey(inventoryPk);inventory.setQuantityOnHand(quantity.nextInt(25000));inventory.setBackorderQuantity(0);inventory.setVersion(1);batchEntityManager.persist(inventory);rowsToFlush++;totalRows++; if(rowsToFlush == batchSize) { batchEntityManager.flush(); rowsToFlush = 0; batchEntityManager.clear(); if(log.isTraceEnabled()) { log.trace("Just flushed " + batchSize + " rows to the database."); log.trace("Total rows flushed is " + totalRows); } } }}return;}
<persistence-unit name="batch-services" transaction-type="JTA"> <provider>org.hibernate.ejb.HibernatePersistence</provider> <jta-data-source>java:/MySqlDS</jta-data-source> <properties> <property name="hibernate.hbm2ddl.auto" value="none"/> <property name="hibernate.default_catalog" value="EJB3"/>
Performance Tuning Guide
28

The following code sample illustrates OLTP. It creates an Order which contains OrderLines (has-arelationship in the object model). The OrderLine entities can be batch inserted, as what is passed intothis method is the Order object with its OrderLine collection.
<property name="hibernate.dialect" value="org.hibernate.dialect.MySQL5InnoDBDialect"/> <property name="hibernate.order_updates" value="true"/> <property name="hibernate.order_inserts" value="true"/> <property name="hibernate.jdbc.batch_versioned_data" value="true"/> <property name="hibernate.jdbc.fetch_size" value="50000"/> <property name="hibernate.jdbc.batch_size" value="50000"/> <property name="hibernate.default_batch_fetch_size" value="50000"/> <property name="hibernate.connection.release_mode" value="auto"/> </properties></persistence-unit>
public Order createOrder(Customer customer , List<OrderLine> orderLines , BigDecimal totalOrderAmount) { String addressLine2 = customer.getAddressLine2(); if (addressLine2 == null) { addressLine2 = ""; } Address shippingAddress = new Address(); shippingAddress.setAddressLine1(customer.getAddressLine1()); shippingAddress.setAddressLine2(addressLine2); shippingAddress.setCity(customer.getCity()); shippingAddress.setState(customer.getState()); shippingAddress.setZipCode(customer.getZipCode()); shippingAddress.setZipCodePlusFour(customer.getZipCodePlusFour()); Order newOrder = new Order(); newOrder.setCustomerId(customer.getCustomerId()); newOrder.setDistributionCenterId(customer.getDistributionCenterId()); newOrder.setShippingAddressLine1(shippingAddress.getAddressLine1()); newOrder.setShippingAddressLine2(shippingAddress.getAddressLine2()); newOrder.setShippingCity(shippingAddress.getCity()); newOrder.setShippingState(shippingAddress.getState()); newOrder.setShippingZipCode(shippingAddress.getZipCode()); newOrder.setShippingZipCodePlusFour(shippingAddress.getZipCodePlusFour()); newOrder.setTotalOrderAmount(totalOrderAmount); newOrder.setOrderDate(new Date()); newOrder.setCustomer(customer); entityManager.persist(newOrder); String orderId = newOrder.getOrderId(); for (OrderLine orderLine: orderLines) { orderLine.getOrderLinePK().setOrderId(orderId); } newOrder.setOrderLines(orderLines); entityManager.persist(newOrder); return newOrder;}
CHAPTER 4. EJB 3 CONTAINER
29

Note there is no call to the entity manager's flush method. Everything is accomplished through thepersistence unit's Hibernate configuration, which is as follows:
The same two configuration parameters for Hibernate are used, where the inserts are ordered, and theJDBC batch size is set. In this case, an order that has up to 500 line items could be batched. BecauseOrderLine entities are persisted and the transaction will commit upon exiting the createOrder method,there is no need to do anything further. Of course, the data model changes to use a generated keystrategy that can be known prior to the inserts being executed is important. Finally, there's adatabase-specific configuration parameter required to make this work just as you want.
With the MySQL JDBC driver a connection property must be set to enable the driver to detect insertsto the same table that can be combined into a single insert statement: rewriteBatchedStatements.Since Hibernate will send the inserts it's batching using the JDBC method executeBatch, the JDBCdriver can rewrite the multiple insert statements into a single insert statement as illustrated at the topof the article. This property must be specified with a value of true, and you can do this through settingthe connection property in the data source XML file for MySQL as such:
<persistence-unit name="services" transaction-type="JTA"> <provider>org.hibernate.ejb.HibernatePersistence</provider> <jta-data-source>java:/MySqlDS</jta-data-source> <properties> <property name="hibernate.hbm2ddl.auto" value="none"/> <property name="hibernate.default_catalog" value="EJB3"/> <property name="hibernate.dialect" value="org.hibernate.dialect.MySQL5InnoDBDialect"/> <property name="hibernate.order_updates" value="true"/> <property name="hibernate.order_inserts" value="true"/> <property name="hibernate.jdbc.batch_versioned_data" value="true"/> <property name="hibernate.jdbc.fetch_size" value="500"/> <property name="hibernate.jdbc.batch_size" value="500"/> <property name="hibernate.default_batch_fetch_size" value="16"/> <property name="hibernate.connection.release_mode" value="auto"/> <property name="hibernate.cache.region.factory_class" value="org.hibernate.cache.jbc2.JndiMultiplexedJBossCacheRegionFactory"/> <property name="hibernate.cache.region.jbc2.cachefactory" value="java:CacheManager"/> <property name="hibernate.cache.use_second_level_cache" value="true"/> <property name="hibernate.cache.use_query_cache" value="false"/> <property name="hibernate.cache.use_minimal_puts" value="true"/> <property name="hibernate.cache.region.jbc2.cfg.entity" value="mvcc-entity"/> <property name="hibernate.cache.region_prefix" value="services"/> </properties></persistence-unit>
<datasources> <local-tx-datasource> <jndi-name>MySqlDS</jndi-name> <connection-url>jdbc:mysql://localhost:3306/EJB3</connection-url>
Performance Tuning Guide
30

WARNING
MYSQL has a default maximum for SQL statement size, and depending on thenumber of columns, column types, and values, you could exceed that limit. Thelimit is 1MB, but can be made larger if necessary by setting max_allowed_packetvariable in my.cnf. It takes as its value the number of megabytes such as 2MB, or16MB, etc. If you are dealing with BLOB, or other large data for the values of thecolumns, keep this limit in mind.
4.5.3.1. Batch Processing; Tests And Results
Below are the parameters and results of a series of performance test conducted to illustrate theeffectiveness of the examples above.
Each set of tests has an in-context result comment and there is a Conclusions overview at the end of thesection.
Example 4.1, “Batch Processing Test”
Example 4.2, “OLTP Baseline Testing”
Example 4.3, “OLTP Hibernate Batch Processing Test”
Example 4.4, “OLTP Hibernate and MySQL Batch Processing Test”
Example 4.5, “Higher Line Items Baseline Test”
Example 4.6, “Higher Line Items Hibernate Batch Processing Test”
<driver-class>com.mysql.jdbc.Driver</driver-class> <user-name>username</user-name> <password>password</password> <exception-sorter-class-name>org.jboss.resource.adapter.jdbc.vendor.MySQLExceptionSorter</exception-sorter-class-name> <min-pool-size>400</min-pool-size> <max-pool-size>450</max-pool-size> <!-- The transaction isolation level must be read committed for optimitic locking to work properly --> <transaction-isolation>TRANSACTION_READ_COMMITTED</transaction-isolation> <connection-property name="rewriteBatchedStatements">true</connection-property> <!-- corresponding type-mapping in the standardjbosscmp-jdbc.xml (optional) --> <metadata> <type-mapping>mySQL</type-mapping> </metadata> </local-tx-datasource></datasources>
CHAPTER 4. EJB 3 CONTAINER
31

Example 4.7, “Higher Line Items Hibernate And MySQL Batch Processing Test”
Example 4.1. Batch Processing Test
Testing performed with the reference data load function of the Order performance application.
Test Parameters
Environment:
Quad-core Intel i7
8 GB of RAM
MySQL database
JBoss Enterprise Application Platform production profile.
Table Contents:
41,106 rows
250,000 products
6.25 million inventory records
2 thousand suppliers
1.25 million supplier inventory records
2 million rows for customers and pricing methods.
Batching enabled in Hibernate.
Batch insert size of 10,000 rows.
MySQL Batching refers to the rewriteBatchedStatements parameter (which is set in mysql-ds.xml).
Table 4.1. Batch Processing Test Results
MySQL Batching Throughput (rows per second)
Result 487.7% increase in throughput.
Off 6,734.01
On 39,575.75
Example 4.2. OLTP Baseline Testing
Three tests were run against the OLTP example. This test does not use any batching features andthus sets the baseline for further tests.
Performance Tuning Guide
32

Test Parameters
Environment:
Quad-core Intel i7
8 GB of RAM
MySQL database
JBoss Enterprise Application Platform production profile.
The composite benchmark is run with randomly created orders with 1 to 9 order line items.The average is around 4.5 to 5 order line items per order. This mimics a real world scenario.
Batch processing off.
rewriteBatchedStatements parameter unset in mysql-ds.xml.
Table 4.2. OLTP Baseline Results
Order Inserts Throughput (orders per second).
Result Single item orders have the highest throughput,with five and nine following respectively.
10,000 order inserts with a single order line item 45.80
10,000 order inserts with five order line items 43.96
10,000 order inserts with nine order line items 43.14
Example 4.3. OLTP Hibernate Batch Processing Test
The second OLTP test was run with Hibernate batching switched on. All other parameters stayedthe same as the previous test.
Test Parameters
Environment:
Quad-core Intel i7
8 GB of RAM
MySQL database
JBoss Enterprise Application Platform production profile.
The composite benchmark is run with randomly created orders with 1 to 9 order line items.The average is around 4.5 to 5 order line items per order. This mimics a real world scenario.
Hibernate batch processing on.
CHAPTER 4. EJB 3 CONTAINER
33

MySQL batching (rewriteBatchedStatements) unset in mysql-ds.xml.
Table 4.3. OLTP Hibernate Batch Processing Results
Order Inserts Throughput (orders per second).
Result Ordering the inserts lowered throughput slightly;differences range from .24 to .36 orders persecond.
10,000 order inserts with a single order line item 45.64
10,000 order inserts with five order line items 43.62
10,000 order inserts with nine order line items 42.78
Example 4.4. OLTP Hibernate and MySQL Batch Processing Test
The third OLTP test enabled both Hibernate and MySQL batching features.
Test Parameters
Environment:
Quad-core Intel i7
8 GB of RAM
MySQL database
JBoss Enterprise Application Platform production profile.
The composite benchmark is run with randomly created orders with 1 to 9 order line items.The average is around 4.5 to 5 order line items per order. This mimics a real world scenario.
Hibernate batch processing on.
MySQL batching (rewriteBatchedStatements) on in mysql-ds.xml.
Table 4.4. OLTP Hibernate and MySQL Batch Processing Results
Performance Tuning Guide
34

Order Inserts Throughput (orders per second).
Result An increase in throughput ranging from .21 to .63orders per second, with nine line item ordersshowing the highest improvement.
Five line item orders show a .66% improvementover the baseline and nine line item orders show a1.46% improvement.
10,000 order inserts with a single order line item 46.11
10,000 order inserts with five order line items 44.25
10,000 order inserts with nine order line items 43.77
Order Inserts Throughput (orders per second).
Example 4.5. Higher Line Items Baseline Test
Some addition testing was performed using higher line item numbers. This test does not use anybatching features and thus sets the baseline for further tests.
Test Parameters
Environment:
Quad-core Intel i7
8 GB of RAM
MySQL database
JBoss Enterprise Application Platform production profile.
The composite benchmark is run with randomly created orders with 1 to 9 order line items.The average is around 4.5 to 5 order line items per order. This mimics a real world scenario.
Hibernate batch processing off.
MySQL batching (rewriteBatchedStatements) unset in mysql-ds.xml.
Table 4.5. Higher Line Items Baseline Results
Order Inserts Throughput (orders per second).
10,000 order inserts with a single order line item 53.34
Result Because 15 and 20 line items orders take muchlonger, the server can process even more singleline item orders.
CHAPTER 4. EJB 3 CONTAINER
35

Result Because 15 and 20 line items orders take muchlonger, the server can process even more singleline item orders.
10,000 order inserts with 15 order line items 31.25
10,000 order inserts with 20 order line items 30.09
Order Inserts Throughput (orders per second).
Example 4.6. Higher Line Items Hibernate Batch Processing Test
In this test, Hibernate's batching feature is enabled. All other parameters (including higher lineitems) remain the same.
Test Parameters
Environment:
Quad-core Intel i7
8 GB of RAM
MySQL database
JBoss Enterprise Application Platform production profile.
The composite benchmark is run with randomly created orders with 1 to 9 order line items.The average is around 4.5 to 5 order line items per order. This mimics a real world scenario.
Hibernate batch processing on.
MySQL batching (rewriteBatchedStatements) unset in mysql-ds.xml.
Table 4.6. Higher Line Items Hibernate Batch Processing Results
Order Inserts Throughput (orders per second).
Result Single line item orders showed a 2.79% increase(an extra 1.49 orders per second).
15 line item orders increased by .06 orders persecond and the twenty line item orders decreasedby .03 orders per second. These results are withinthe expected margin of test variations.
10,000 order inserts with a single order line item 54.83
10,000 order inserts with fifteen order line items 31.31
10,000 order inserts with twenty order line items 30.06
Performance Tuning Guide
36

Example 4.7. Higher Line Items Hibernate And MySQL Batch Processing Test
In this last test, both the Hibernate and MySQL batching features are tested using higher line items.
Test Parameters
Environment:
Quad-core Intel i7
8 GB of RAM
MySQL database
JBoss Enterprise Application Platform production profile.
The composite benchmark is run with randomly created orders with 1 to 9 order line items.The average is around 4.5 to 5 order line items per order. This mimics a real world scenario.
Hibernate batch processing on.
MySQL batching (rewriteBatchedStatements) on in mysql-ds.xml.
Table 4.7. Higher Line Items Hibernate And MySQL Batch Processing Results
Order Inserts Throughput (orders per second).
Result Single line orders showed a 13.97% increase, 15line item orders showed an increase of 19.65% and20 line item orders increased by 18.05%.
10,000 order inserts with a single order line item 60.79
10,000 order inserts with fifteen order line items 37.39
10,000 order inserts with twenty order line items 35.52
ConclusionsFor OLTP workloads, if you have situations where you are regularly going to insert tens of rows thatcould be batch inserted, you should consider batch insertion. Of course, this requires the JDBC driverto have the same capability as the MySQL JDBC driver to convert the multiple inserts into a singleinsert.
The fact that throughput improvement was found in the smaller test is significant, considering thatthere were other queries being executed. The customer must be found for each order to be processed,which requires a three-way join from customer to pricing method to distribution center. Each line itemlooks up its product cost information as well, and then the line items are priced, and a total iscalculated for the entire order.
So, the insert does not dominate the time, which is a significant factor in any decision to use thesesettings for an application. Batch inserts clearly offer an advantage for batch operations but it is notclear if it can also improve OLTP.
CHAPTER 4. EJB 3 CONTAINER
37

It is necessary to understand the typical cases for how many times you have enough rows involved inan insert that can be converted to a batch insert, and how much of the overall processing time theinserts are versus the rest of the processing.
Additionally, batch inserts are much more efficient in database operations, so while you may not getdirect benefit in the response time of transactions, that gained efficiency on the database may allowother processing to be better served.
4.5.4. Batching Database Operations
Hibernate has long had the ability to batch database operations, within the context of each transaction.The concept is to reduce the latency between the application platform and the database server. If eachand every query is sent to the database individually, latency is increased because of the sheer numberof round trips to and from the database. Batching of database operations can be used in any applicationthat uses Hibernate as the persistence mechanism.
There are two Hibernate parameters that control the behavior of batching database operations:
hibernate.jdbc.fetch_size
hibernate.jdbc.batch_size
Both of these options set properties within the JDBC driver. In the first case, hibernate.jdbc.fetch_size sets the statement's fetch size within the JDBC driver, that is thenumber of rows fetched when there is more than a one row result on select statements. In the secondcase, hibernate.jdbc.batch_size determines the number of updates (inserts, updates anddeletes) that are sent to the database at one time for execution. This parameter is necessary to dobatch inserts, but must be coupled with the ordered inserts parameter and the JDBC driver's capabilityto rewrite the inserts into a batch insert statement.
WARNING
Ordering inserts and updates only helps improve performance if the JDBC drivercan rewrite the statements and should not be used unless the JDBC driver has thatcapability.
Determining the correct values to be assigned to each of these parameters requires analysis of eachapplication's behavior when transacting with its database. The following sections examine differencesin performance of the test application with differing values for each parameter.
The first parameter examined is hibernate.jdbc.fetch_size. In the example application, thereare queries that return a single row, queries that return 3 rows, and one query that can return up to500 rows. In the last case, the query itself is actually limited through the API to 500 rows, althoughthere can be many more rows than that that could satisfy the query. The other interesting thing toconsider is the fact that the query that could return 500 rows is executed in a stateful session bean.When the query is executed, only 20 rows of data, of the total matching rows, are returned at one timeto the client. If the client found what they wanted, and does not page further through the result set,only those first 20 rows (or fewer rows, if the query returns less than 20) will ever be used from theresult set. Taking that into account, fetch_size values of 20 and 500 were tested. In tests, 20 gave thebest result, with 500 actually being slightly slower. Twenty was also faster than the default of 1. In thecase of 20 versus 500, 20 provided 1.73% more throughput while in the case of 20 vs. 1, 20 provided
Performance Tuning Guide
38

2.33% more throughput. Aligning the value with the query that can return upwards of 500 rows, andpaginating the results 20 rows at a time was the most effective. Thorough analysis of the queries in theapplication and the frequency with which those queries are executed is necessary to size thiscorrectly.
The application referred to throughout this book consists of two parts: a batch processing piece thatcreates reference data and an OLTP piece that processes business transactions using the referencedata. In regards to these two parameters, they have very distinct needs so the challenge is how to meetthe needs of both. One solution is to have multiple persistence units within a single application, which inturn means the application can have multiple entity managers, each with a different configuration. Thenorm is to have different entities within the different persistence units but while this is the norm, it isnot prohibited to have the same entities in different persistence units. However you cannot use thesame entities in multiple persistence units and their respective entities' managers at the same time.Because the batch processing of the application has to be run first to create the reference data, andthe OLTP part run second (and independently of the batch processing) two persistence units could bedefined with their respective entities managers and the same entities in both. That was highlyconvenient for the example application but in the real world that may not be possible. Instead, you mayhave to divide up batch processing and OLTP processing into different application deployments if theyhave the same entities. To illustrate this, here is the application's persistence.xml:
<persistence xmlns="http://java.sun.com/xml/ns/persistence" xmlns:xsi="http://www.w3.org/2001/XMLSchema-instance" xsi:schemaLocation="http://java.sun.com/xml/ns/persistence http://java.sun.com/xml/ns/persistence/persistence_1_0.xsd" version="1.0"> <persistence-unit name="services" transaction-type="JTA"> <provider>org.hibernate.ejb.HibernatePersistence</provider> <jta-data-source>java:/MySqlDS</jta-data-source> <properties> <property name="hibernate.hbm2ddl.auto" value="none"/> <property name="hibernate.default_catalog" value="EJB3"/> <property name="hibernate.dialect" value="org.hibernate.dialect.MySQL5InnoDBDialect"/> <property name="hibernate.order_inserts" value="true"/> <property name="hibernate.default_batch_fetch_size" value="20"/> <property name="hibernate.jdbc.fetch_size" value="20"/> <property name="hibernate.jdbc.batch_size" value="20"/> <property name="hibernate.cache.region.factory_class" value="org.hibernate.cache.jbc2.JndiMultiplexedJBossCacheRegionFactory"/> <property name="hibernate.cache.region.jbc2.cachefactory" value="java:CacheManager"/> <property name="hibernate.cache.use_second_level_cache" value="true"/> <property name="hibernate.cache.use_query_cache" value="false"/> <property name="hibernate.cache.use_minimal_puts" value="true"/> <property
CHAPTER 4. EJB 3 CONTAINER
39

In this example, two persistence units are created: services and batch-services. The OLTP processing,"services", is configured with relatively small fetch and batch sizes. The batch processing, "batch-services", is configured with large fetch and batch sizes. There is no entity caching in the batchprocessing because its unnecessary, while there is an entity cache defined for the OLTP side of things.This is a very convenient and powerful feature of JPA.
For the second parameter, hibernate.jdbc.batch_size, the Hibernate documentationrecommends a value of between 5 and 30 but this value depends upon the application's needs. TheHibernate documentation's recommendation is suitable for most OLTP-like applications. If youexamine insert and update queries within the application, you can make a determination of how manyrows are inserted and updated across the set. If inserts or updates occur no more than one row at atime, then leaving it unspecified is suitable. If inserts and/or updates affects many rows at a time, in asingle transaction, then setting this is very important. If batch inserts are not required, and the aim isto send all the updates in as few trips to the database as possible, you should size it according to whatis really happening in the application. If the largest transaction you have is inserting and updating 20rows, then set it 20, or perhaps a little larger to accommodate any future changes that might takeplace.
4.6. MESSAGE DRIVEN BEANS
Message driven beans (MDB) are an EJB 3 bean type that is invoked from a message, specifically froma JMS message. There are three areas of concern when tuning for message driven beans. The first isthe number of sessions to be run in parallel. The second is the pool size for the beans themselves. Thispool is similar to the pool for stateless session beans, but is related to the session parameter. The thirdis thread pooling, discussion of which is deferred to the JCA chapter.
The number of sessions is the number of actual message driven beans which will be waiting on the
name="hibernate.cache.region.jbc2.cfg.entity" value="mvcc-entity"/> <property name="hibernate.cache.region_prefix" value="services"/> </properties> </persistence-unit> <persistence-unit name="batch-services" transaction-type="JTA"> <provider>org.hibernate.ejb.HibernatePersistence</provider> <jta-data-source>java:/MySqlDS</jta-data-source> <properties> <property name="hibernate.hbm2ddl.auto" value="none"/> <property name="hibernate.default_catalog" value="EJB3"/> <property name="hibernate.order_inserts" value="true"/> <property name="hibernate.jdbc.fetch_size" value="50000"/> <property name="hibernate.jdbc.batch_size" value="50000"/> <property name="hibernate.dialect" value="org.hibernate.dialect.MySQL5InnoDBDialect"/> <property name="hibernate.cache.use_second_level_cache" value="false"/> </properties> </persistence-unit> </persistence>
Performance Tuning Guide
40

same queue and/or topic. Assume a queue is defined, and ten messages are to be processed from thatqueue at the same time, requiring ten sessions. In the EJB 3 world, this can be achieved through anannotation on the bean implementation itself. In fact, there are two parameters within the annotation:maxSessions and minSessions. The annotation itself is the standard EJB 3 MDB of:@ActivationConfigProperty(propertyName, propertyValue)
So, within the MDB, the minimum and maximum number of sessions can be specified, giving theopportunity to control how many instances will process messages from a given queue at one time.Refer to the following example:
In this example two activation configuration properties are defined, specifying the minimum andmaximum number of sessions. The minimum defines that there should always be that number ofinstances of the MDB in the pool, in the method ready state (ready to receive messages). Themaximum specifies there can be up to that many processing messages, so if there are messageswaiting and all of the instances are busy, the pool can grow from the minimum to the maximum. In thisexample there can be up to fifty instances of the MDB in the pool, processing messages. The “pool”parameter mentioned here is highly interrelated to the minimum and maximum number of sessions.
Just as there are pools for stateless sessions beans, there is also an instance pool for message drivenbeans. In this case though, there is really only one pool type that can be used: StrictMaxPool. Thereason why StrictMaxPool is the only option for message driven beans is simply the nature of the beantype. Having an unbounded number of message driven beans processing messages could presentproblems. Many systems that use messaging process millions upon millions of messages, and it's notscalable to keep increasing the number of instances to process everything in parallel. Also it's reallynot possible because the default for maxSessions parameter is 15.
There's a relationship between the pool and the sessions parameters: maxSessions and minSessions.Assume that the number of maxSessions is set to a number larger than the default of 15, perhaps 50,but the default pool size to hold the instances of the MDB is only 15. Only 15 instances will processmessages at once, not the 50 as might be expected. The reason for only getting 15 is that the defaultpool size (as defined in the configuration file) is 15, like the default maxSessions. So changing themaxSessions does not actually help unless the pool's configuration is changed to match. The pool'sconfiguration is specified in the same file as for stateless sessions beans: ejb3-interceptors-aop.xml, in the directory JBOSS_EAP_DIST/jboss-as/server/PROFILE/deploy. Note that the minimal configuration does not contain the EJB 3 container.
Below is an example of this file:
@MessageDriven(activationConfig = { @ActivationConfigProperty(propertyName="destinationType" , propertyValue="javax.jms.Queue"), @ActivationConfigProperty(propertyName="destination" , propertyValue="queue/replenish") @ActivationConfigProperty(propertyName=”minSessions” , propertyValue=”25”) @ActivationConfigProperty(propertyName=”maxSessions” , propertyValue=”50”)})
<domain name="Message Driven Bean" extends="Intercepted Bean" inheritBindings="true"> <bind pointcut="execution(public * *->*(..))"> <interceptor-ref name="org.jboss.ejb3.security.AuthenticationInterceptorFactory"/> <interceptor-ref name="org.jboss.ejb3.security.RunAsSecurityInterceptorFactory"/>
CHAPTER 4. EJB 3 CONTAINER
41

</bind> <bind pointcut="execution(public * *->*(..))"> <interceptor-ref name="org.jboss.ejb3.tx.CMTTxInterceptorFactory"/> <interceptor-ref name="org.jboss.ejb3.stateless.StatelessInstanceInterceptor"/> <interceptor-ref name="org.jboss.ejb3.tx.BMTTxInterceptorFactory"/> <interceptor-ref name="org.jboss.ejb3.AllowedOperationsInterceptor"/> <interceptor-ref name="org.jboss.ejb3.entity.TransactionScopedEntityManagerInterceptor"/> <!-- interceptor-ref name="org.jboss.ejb3.interceptor.EJB3InterceptorsFactory"/ --> <stack-ref name="EJBInterceptors"/> </bind> <annotation expr="class(*) AND !class(@org.jboss.ejb3.annotation.Pool)"> @org.jboss.ejb3.annotation.Pool (value="StrictMaxPool", maxSize=15, timeout=10000) </annotation> </domain> <domain name="Consumer Bean" extends="Intercepted Bean" inheritBindings="true"> <bind pointcut="execution(public * *->*(..))"> <interceptor-ref name="org.jboss.ejb3.security.RunAsSecurityInterceptorFactory"/> </bind> <bind pointcut="execution(public * *->*(..))"> <interceptor-ref name="org.jboss.ejb3.tx.CMTTxInterceptorFactory"/> <interceptor-ref name="org.jboss.ejb3.stateless.StatelessInstanceInterceptor"/> <interceptor-ref name="org.jboss.ejb3.tx.BMTTxInterceptorFactory"/> <interceptor-ref name="org.jboss.ejb3.AllowedOperationsInterceptor"/> <interceptor-ref name="org.jboss.ejb3.entity.TransactionScopedEntityManagerInterceptor"/> </bind> <bind pointcut="execution(public * *->*(..)) AND (has(* *->@org.jboss.ejb3.annotation.CurrentMessage(..)) OR hasfield(* *->@org.jboss.ejb3.annotation.CurrentMessage))"> <interceptor-ref name="org.jboss.ejb3.mdb.CurrentMessageInjectorInterceptorFactory"/> </bind> <bind pointcut="execution(public * *->*(..))"> <!-- interceptor-ref name="org.jboss.ejb3.interceptor.EJB3InterceptorsFactory"/ --> <stack-ref name="EJBInterceptors"/> </bind> <annotation expr="class(*) AND !class(@org.jboss.ejb3.annotation.Pool)"> @org.jboss.ejb3.annotation.Pool (value="StrictMaxPool",
Performance Tuning Guide
42

In this example are four important settings. First is the definition of the message driven bean. Second isthe StrictMaxPool configuration, with the default value of 15, the same default value for themaxSessions parameter. The next two are the same, except for something called a consumer bean.Consumer beans are a JBoss-specific implementation, not Java EE compliant, that gives all thefunctionality of the message driven bean, but does so without having to implement theMessageListener interface, and is a pure POJO model like stateless and stateful session beans. Itbrings the EJB 3 POJO model to asynchronous processing, without the old EJB 2.x model that wascarried over for message driven beans. Of course, if this option is used, the application will not beportable, so use at your own risk.
The maxSize parameter on the StrictMaxPool needs to be the same as the maxSessions set on thebean itself. If they are not set to the same value, strange behavior occurs. When the queue has moremessages than either the maxSessions or maxSize value, messages up to the maxSessions' value willbe processed, then the number of messages next processed is the difference between maxSessionsand maxSize, with this cycle repeating. To illustrate this, maxSessions is set to 25, the pool size left atthe default of 15. When messages are being processed the number of instances will alternate between15 and 10, which is the difference between the maxSessions and the maxSize parameters. So 15messages will be processed, then 10, then 15, then 10, repeating until the number of messages drops to15 or below. Keeping these two parameters in sync is important to get the desired behavior.
Determining the "right" value for number of sessions is dependent on the rate of incoming messages,processing time it takes to process each message, and the requirement for how long it should take toprocess messages. It may be best for some applications to throttle the message processing rate andallow the queue to grow over time, or at least during peak times, allowing the processing to catch up,and eventually drain the queue when the incoming rate drops. For other applications it may be best tomatch the processing rate to the incoming rate. In either case calculating the right value is based onthe number of incoming messages over a given period of time and how long does it take to processeach message. Unfortunately there's no strict mathematical formula as there will not be perfectlylinear scalability when processing in parallel, and scalability will vary by hardware, OS, persistencemechanism (in the case of persistent messages), JVM version and even the version of EAP, and whichmessaging provider you would use. As mentioned earlier, EAP 5.1.x has two messaging providerswhich, although they provide the same JMS API work with the same MDB implementation, are verydifferent under the covers. One uses a database for persistent messages and the other a file journal,which is by far the biggest difference. That difference is huge in regards to scalability, and can have aprofound effect on the number of MDB instances required. There is no substitute for load testing to getthis parameter right for your environment.
maxSize=15, timeout=10000) </annotation></domain>
CHAPTER 4. EJB 3 CONTAINER
43

CHAPTER 5. JAVA CONNECTOR ARCHITECTUREWithin the platform, Java Connector Architecture (JCA) is used in two main areas: integration withdata sources, such as relational databases, and integration with JMS providers. In EAP 5.1.2 and above,two JMS providers are available: JBoss Messaging technology, and the newer HornetQ technology.External JMS providers can be integrated through their provided JCA resource adapters. This chapterwill cover data sources and their respective parameters, also JMS integration and its relevantparameters.
5.1. DATA SOURCES
Data sources are the means of defining the properties of a relational database. This is done with a *-ds.xml file in the deploy directory of a specific configuration. The platform ships with examples forquite a few relational databases, and there is a complete list of certified relational databases on theJBoss Enterprise Application Platform product pages of the Red Hat website. A data source definitionhas many parameters but the focus here is on two specific parameters: min-pool-size and max-pool-size.
5.2. DATA SOURCE CONNECTION POOLING
When connecting to a data source, JBoss Enterprise Application Platform must allocate resources andde-allocate resources for every connection. This is quite expensive in terms of time and systemresources. Connection pooling reduces the cost of data source connections by creating a number("pool") of data source connections available to be shared by applications. Pooling data sourceconnections is much more efficient than allocating and de-allocating resources on demand. There arethird-party alternatives for data source pooling but the native method is already included and avoidsan extra layer of complexity.
5.3. MINIMUM POOL SIZE
The min-pool-size data source parameter defines the minimum size of the connection pool. Thedefault minimum is zero connections, so if a minimum pool size is not specified, no connections will becreated in the connection pool when the platform starts. As data source transactions occur,connections will be requested but because the pool defaults to zero on start up, none will be available.The connection pool examines the minimum and maximum parameters, creates connections andplaces them in the pool. Users of any affected application will experience a delay while this occurs.During periods of inactivity the connection pool will shrink, possibly to the minimum value, and laterwhen transactions later occur application performance will again suffer.
Performance Tuning Guide
44

Figure 5.1. Data Source Metrics
5.4. MAXIMUM POOL SIZE
The max-pool-size parameter data source parameter defines the maximum size of the connectionpool. It's more important that the min-pool-size parameter because it limits the number of activeconnections to the data source and so the concurrent activity on the data source. If this value is settoo low it's likely that the platform's hardware resources will be underutilized.
NOTE
Setting the max-pool-size too low is a common configuration error.
5.5. BALANCING POOL SIZE VALUES
The aim of adjusting the min-pool-size and max-pool-size pool values is to allow all possibleconcurrent database activity to execute, and so maximize throughput. To do this requires anunderstanding of how much concurrent activity in the server is occurring. As a guide of concurrentactivity, look at the platform's thread pools to see how many threads are active. This is availablethrough the administration console, as in the following screenshot:
CHAPTER 5. JAVA CONNECTOR ARCHITECTURE
45

Figure 5.2. JMX Console Datasource Metrics
In this example there were 81 active threads in the JBoss Web HTTP connector, which is the primarythread pool in the test used for this illustration. That number is to be expected because there were 80users, with no think times between requests, and response times were between 18 and 20 ms onaverage. Having 81 threads active accounts for the continued use of the 80 users, plus the one user forthe administration console itself. Most of the time the actual number of active threads was actuallyonly 80, but when the refresh button is clicked, the administration console consumed a thread duringits collection of the data. In this example, you may presume that the maximum size of the connectionpool should at least be 80 but it may not be as simple as it appears.
Figure 5.3. Admin Console Datasource Metrics
In looking at the data source metrics in the administration console, the “Max Connections In UseCount” is reported as 80. With 80 concurrent users and each transaction performing databasetransactions, a value of 80 seems obvious. In various situations, though, this figure may be misleading.If “Max Connections in Use Count” equals the max-pool-size parameter then this value is meaningless.It's also possible that the thread pools have many more active threads than threads that will eventuallyhit the database. Also there may be multiple thread pools in use within the platform, each with theirown data access characteristics. Finally, it's possible for an EJB 3 application to skew the number ofconnections needed.
Performance Tuning Guide
46

It's a requirement of the EJB 3 specifications that each bean that has an entity manager injected into italso have a unique instance of the entity manager. This has an indirect influence on the databaseconnection pool sizing. Since Hibernate is the JPA provider, a unique instance of an entity managerand a Hibernate session, this requires a database connection for the queries within that entity managerand Hibernate session. In the case of a simple application, where stateless session beans executequeries and never call other stateless session beans, a single database connection is consumed forthat processing. In a more complex application, assume there's a stateless session bean that executesqueries but also calls on other stateless sessions beans. Because that also execute queries, there aremultiple entity managers, potentially consuming multiple database connections and all participating inthe same transaction. In a more complex example again, assume there's a stateless session bean thatputs a message on a JMS queue, then does some further processing that executes queries andasynchronously, a message driven bean de-queues that message and does some processing thatexecutes queries. From these examples it's evident that the more complex the application structure,the harder it will be to determine just how many connections may be used. This is even furthercomplicated by the speed at which connections can be returned to the pool for reuse, and how fastthey can be enlisted in a transaction when reused from the pool. One technique you can use is tocontinue increasing the maximum pool size until the “Max Connections In Use Count” stays below themaximum size parameter of the pool. This may not be possible in a production environment so a testenvironment is recommended.
There's one more check that can be made to determine if the connection pool is too small and so mightbe throttling throughput. During peak loads you can use the JMX console to take a thread dump of therunning platform. If in the output you see the following the connection pool is too small:
Thread: http-192.168.1.22-8080-2 : priority:5, demon:true, threadId:145, threadState:TIMED_WAITING- waiting on <0x2222b715> (a java.util.concurrent.Semaphore$FairSync)sun.misc.Unsafe.park(Native Method)java.util.concurrent.locks.LockSupport.parkNanos(LockSupport.java:226)java.util.concurrent.locks.AbstractQueuedSynchronizer.doAcquireSharedNanos(AbstractQueuedSynchronizer.java:1037)java.util.concurrent.locks.AbstractQueuedSynchronizer.tryAcquireSharedNanos(AbstractQueuedSynchronizer.java:1326)java.util.concurrent.Semaphore.tryAcquire(Semaphore.java:410)org.jboss.resource.connectionmanager.InternalManagedConnectionPool.getConnection(InternalManagedConnectionPool.java:193)org.jboss.resource.connectionmanager.JBossManagedConnectionPool$BasePool.getConnection(JBossManagedConnectionPool.java:747)org.jboss.resource.connectionmanager.BaseConnectionManager2.getManagedConnection(BaseConnectionManager2.java:404)org.jboss.resource.connectionmanager.TxConnectionManager.getManagedConnection(TxConnectionManager.java:424)org.jboss.resource.connectionmanager.BaseConnectionManager2.allocateConnection(BaseConnectionManager2.java:496)org.jboss.resource.connectionmanager.BaseConnectionManager2$ConnectionManagerProxy.allocateConnection(BaseConnectionManager2.java:941)org.jboss.resource.adapter.jdbc.WrapperDataSource.getConnection(WrapperDataSource.java:89)org.hibernate.ejb.connection.InjectedDataSourceConnectionProvider.getConnection(InjectedDataSourceConnectionProvider.java:47)org.hibernate.jdbc.ConnectionManager.openConnection(ConnectionManager.java:446)org.hibernate.jdbc.ConnectionManager.getConnection(ConnectionManager.java:167)
In this example thread dump from the ServerInfo section of the JMX Console's jboss.system category
CHAPTER 5. JAVA CONNECTOR ARCHITECTURE
47
(where you can invoke a listThreadDump operation) you can see that the thread is in aTIMED_WAITING state and waiting on a semaphore. If you look closely at the stack trace you also seethat the InternalManagedConnectionPool is executing its getConnection() method. In the connectionpool, if no connection is available for use it waits on a semaphore, which has the same number oftickets available as the max-pool-size parameter. If a transaction is waiting for a connection to becomeavailable in the pool, it waits until one is returned to the pool. This has an advantage over continuing toincrease the pool size because it's possible to see just how many threads are waiting on a connectionfrom the pool. More accurate information means it takes fewer iterations to get the pool's size right.
In closing discussion on the pool size, a rule of thumb is to set the minimum to the size which allows formaximum throughput and the maximum to 10% to 20% higher than the minimum. Setting themaximum higher than the minimum allows a buffer for situations in which load unexpectedly increases,a situation almost guaranteed to occur in real life.
5.6. JMS INTEGRATION OR PROVIDER
JMS integration in all Java EE servers is provided through JCA since it's a requirement of thespecifications. As mentioned in Message Driven Beans section, there are two JMS providers: theoriginal JBoss Messaging and the newer HornetQ technology. In either case, the focus in tuning each isthe JCA thread pool.
The JCA container has its own thread pool, and this pool needs to be sized appropriately to handle themessaging load. It's highly related to the maxSession parameter that was discussed with messagedriven beans. Besides message driven beans, you can use the JMS API directly within the container,and not be tied to message driven beans at all. The JCA thread pool's configuration is in the file jca-jboss-beans.xml in the directory JBOSS_EAP_DIST/jboss-as/server/PROFILE/deploy. Notethat the minimal configuration does not contain the JCA container.
NOTE
Below is an example of this configuration file.
In tuning the thread pool the focus is on just two parameters: maximumPoolSize andmaximumQueueSize.
<!-- THREAD POOL --> <bean name="WorkManagerThreadPool" class="org.jboss.util.threadpool.BasicThreadPool"><!-- Expose via JMX --><annotation>@org.jboss.aop.microcontainer.aspects.jmx.JMX(name="jboss.jca:service=WorkManagerThreadPool", exposedInterface=org.jboss.util.threadpool.BasicThreadPoolMBean.class)</annotation><!-- The name that appears in thread names --><property name="name">WorkManager</property><!-- The maximum amount of work in the queue --><property name="maximumQueueSize">1024</property><!-- The maximum number of active threads --><property name="maximumPoolSize">100</property><!-- How long to keep threads alive after their last work (default one minute) --><property name="keepAliveTime">60000</property></bean>
Performance Tuning Guide
48

The maximumPoolSize parameter specifies the number of threads in the thread pool for use by theJMS provider. The default size is 100, which may or may not be appropriate. If message driven beansare used in the application, make sure that there are enough threads in the thread pool to handle themaximum number of sessions. If only one message driven bean is used, ensure that the thread pool isat least the size of the number of sessions for that one bean. If there are many different messagedriven beans, the calculations are more complex.
When you have many message-driven beans, each with their own maxSessions, start by adding all ofthe maxSession values together. This assumes that they all will hit those maximums at the same time,and different components are likely to have different usage patterns. If you understand the usagepattern, you may be able to reduce the thread pool accordingly, to just take into account themaximums that overlap each other. In fact, reducing it if you do not need 100 is a good step because itwill save some memory.
If you are not sure of the application's behavior, you can monitor the usage of the thread pool throughthe JMX console. Below is a screen shot from the JMX console that shows the attributes of the threadpool:
Figure 5.4. JMX Console Thread Pool Statistics
On the second line of the table in the screenshot you see the attribute name called QueueSize, a read-only attribute which records any requests for threads from the thread pool that could not be satisfiedbecause all the threads were currently in use. If this value is above zero, then the thread pool is toosmall to service all incoming requests. This value will not update automatically so it's necessary torefresh the page manually to see the value updated while the system is running.
The maximumQueueSize parameter specifies how many requests will wait for a thread to becomeavailable before an exception is thrown and processing is aborted. The default value is 1024, which is asafe value. You may want to fail fast, versus wait for an extended period of time, or have more than1024 requests backed up before failing. Setting this parameter to a lower value means you'll knowearlier of exceptions but at the expense of application uptime. It's recommended to leave it at thedefault value as it provides greater reliability. If a request is waiting in the queue it's because there arenone available in the pool. While sizing the pool, monitor the number of requests waiting in the queueto confirm whether or not the pool is too small.
CHAPTER 5. JAVA CONNECTOR ARCHITECTURE
49

CHAPTER 6. JAVA MESSAGE SERVICE (JMS) PROVIDERAs discussed in the JCA chapter, JBoss Enterprise Application Platform offers two JMS providers: thedefault JBoss Messaging and the new HornetQ. From a performance perspective, HornetQ is farsuperior to JBoss Messaging.
6.1. SWITCHING THE DEFAULT MESSAGING PROVIDER TO HORNETQ
To change the default JMS provider from JBoss Messaging to HornetQ, a script is provided in the EAPdistribution which moves JBoss Messaging out of the deployment folders and deploys HornetQ. Thescript is called switch.sh (switch.bat on Microsoft Windows Server) and can be found in thedirectory JBOSS_EAP_DIST/jboss-as/extras/hornetq. This script requires the open source buildtool Ant be in the path in order to work.
WARNING
There is no "undo" option except to reinstall the binaries, so be sure you want to dothis before proceeding.
6.2. EXPLOITING HORNETQ'S SUPPORT OF LINUX'S NATIVEASYNCHRONOUS I/O
If JBoss Enterprise Application Platform is running on Red Hat Enterprise Linux (RHEL), you can takeadvantage of HornetQ's ability to leverage Linux's native asynchronous I/O for its journal. HornetQ hasmoved from the database approach of JBoss Messaging for persistent messages to a new highperformance journal that exists on the file system. Since this journal lives on the file system, HornetQuses Java's New Input/Output (NIO) routines as the mechanism for reading and writing the journal.There is also a native library, that if detected, will enable HornetQ to leverage Linux's nativeasynchronous I/O capabilities. This has to be done in “native” code, as Java does not directly supportOS asynchronous I/O. Using the operating system's own asynchronous I/O provides the best possibleperformance and scalability. To enable this option two steps are required.
The first step is to ensure that the libaio package is installed on your instance of RHEL. This packageprovides the API for HornetQ's native code that allows it to use asynchronous I/O. With the libaiopackage installed, the next step is to ensure the native code for HornetQ is available. That has to beplaced at the same directory level as your EAP instance. For example, if you have EAP installed in /opt/redhat/jboss-eap-5.1, then the native code must be put in the same directory. This isbecause, being native code, it must be the right version for your RHEL version, and the right librariesfor the JVM. Both the 32-bit and 64-bit JVMs are supported so there are 32-bit and 64-bit versions ofthe libraries. The run.sh script will automatically detect the directory relative to the EAP installationdirectory and resulting JBOSS_HOME that is set within that script (run.bat for Windows won’t havethis, as this is a Linux only feature). If you have everything installed correctly, you should see thismessage in the log after start up.
10:50:05,113 INFO [JournalStorageManager] Using AIO Journal
If you do not have everything installed correctly, you will see a message like the following:
2011-02-18 10:05:11,485 WARNING
Performance Tuning Guide
50

[org.hornetq.core.deployers.impl.FileConfigurationParser] (main) AIO wasn't located on this platform, it will fall back to using pure Java NIO. If your platform is Linux, install LibAIO to enable the AIO journal
NOTE
These installation instructions are only for zip based installations. If you are using theEAP RPM installation method then everything should be placed in the correct locationsby the RPM.
6.3. HORNETQ'S JOURNAL
Aside from enabling native asynchronous I/O (if installed on RHEL), the next configuration parameterto optimize is the journal's location, relative to the file system configuration. The default configurationplaces the journal in ${jboss.server.data.dir}/${hornetq.data.dir}:hornetq/journal,which expands to: JBOSS_EAP_DIST/jboss-as/server/PROFILE/data/hornetq/journal. Notethat the minimal configuration does not contain the JMS provider.
Depending on the underlying storage configuration, this may not be the optimal location. A commonconfiguration is to locate rarely-accessed file (e.g. executables/binaries) on relatively slow, cheaperstorage and often-accessed files (e.g. log files, journaling files) on high-performance, more expensivestorage. If you have very high messaging loads, the journal should be placed on a high-performance filesystem, with a high-performance disk configuration. In general, HornetQ's performance is bound bythe speed of the file system and network so the configuration of these are most likely be governingfactors of performance. To change the location of the journal, the HornetQ configuration file needs tobe modified. The configuration file is called hornetq-configuration.xml, in the directory JBOSS_EAP_DIST/jboss-as/server/PROFILE/deploy/hornetq/.
Below is an extract from the configuration file:
<configuration xmlns="urn:hornetq" xmlns:xsi="http://www.w3.org/2001/XMLSchema-instance" xsi:schemaLocation="urn:hornetq /schema/hornetq-configuration.xsd"><!-- Do not change this name. This is used by the dependency framework on the deployers, to make sure this deployment is done before any other deployment --><name>HornetQ.main.config</name><clustered>true</clustered><log-delegate-factory-class-name>org.hornetq.integration.logging.Log4jLogDelegateFactory</log-delegate-factory-class-name><bindings-directory>${jboss.server.data.dir}/${hornetq.data.dir:hornetq}/bindings</bindings-directory><journal-directory>${jboss.server.data.dir}/${hornetq.data.dir:hornetq}/journal</journal-directory><journal-min-files>10</journal-min-files><large-messages-directory>${jboss.server.data.dir}/${hornetq.data.dir:hornetq}/largemessages</large-messages-directory><paging-
CHAPTER 6. JAVA MESSAGE SERVICE (JMS) PROVIDER
51

From the above extract, the following directories are of interest:
journal-directory
large-messages-directory
paging-directory
The location specified for journal-directory is the most critical with respect to performance butthe others can also have a significant impact.
The journal-directory is where persistent messages are stored.
The large-message directory is used to store messages that are larger than can fit into memory. Ifthe application processes large messages, this is also a performance critical directory.
The paging-directory is similar to the large message directory, except that is an accumulation ofmany messages, that no longer fit into memory or are swapped/paged to disk, which is analogous tooperating system paging to swap. Just like the journal and large message directory, this is also aperformance critical directory, if swapping/paging occurs.
There are two ways to change the locations to be used by these directories. First, you can change the ${jboss.server.data.dir} variable, by passing -Djboss.server.data.dir=<path> wherepath is the new directory location (higher performance file system and disk configuration). This willhave the effect of moving everything that uses that directory to the new location, not just the HornetQdirectories. This approach has an added bonus because there is another performance critical directoryunder that path, which contains the transaction journal. Transactions are logged for crash recoverypurposes within this same path and this can also benefit from being located on higher-performingstorage. The other option is to change the configuration directly, remove the ${jboss.server.data.dir}and replace it with the new location. In either case, moving this to faster storage will improveperformance. Using the command-line option method is easiest because it uses the variable, so there'sno need to change the configuration file.
6.4. HORNETQ AND TRANSACTIONS
With the older JBoss Messaging technology, persistent messages were stored in a database, withseveral choices. The JBoss Messaging tables could be combined with all other tables into one unifieddata source, or separated into its own schema, catalog or database instance (whichever terminology isrelevant to your particular database). If messaging schema is combined with other tables, alltransactions that span both the messaging system and the application's tables would participate in thesame transaction, and commit and rollback as a group. This would be true, even if you defined the datasource to be an XA data source, because the XA protocol specification allows a single phase commitoptimization for just this circumstance. If you kept them separate, then you would have to define yourapplication data source and the messaging data source to both be XA data sources, so you would getthe proper transaction semantics between your messages and your application. Now that HornetQuses its own file system journal there is no way to unify the other persistent parts of the applicationwith the journal from a transaction perspective, as was possible with JBoss Messaging. If there's a needfor messaging and application persistence to participate in the same transaction, the data source mustbe setup as an XA data source.
directory>${jboss.server.data.dir}/${hornetq.data.dir:hornetq}/paging</paging-directory></configuration>
Performance Tuning Guide
52

CHAPTER 7. LOGGING PROVIDERIn discussing logging and its impact on performance, there are four topics to be covered:
console logging
type of appender to use
location of log files
wrapping of log statements
7.1. CONSOLE LOGGING
Console logging is by far the most expensive form of logging in terms of time because console outputis not buffered. All configurations, except for the production configuration, have console loggingenabled because it's very convenient during development. It's especially convenient when using anIDE, such as JBoss Developer Studio, and any other IDE for that matter. With console logging on, allmessages that go to the log show up in the IDE, which is an advantage when doing development work.However it's a distinct disadvantage in a production environment because it's slow and expensive.
The simplest method to avoid console logging is to use the production configuration. If a new, customconfiguration is to be created, base that configuration on the production configuration. To disableconsole logging for an existing configuration, it's necessary to edit the logging configuration file jboss-log4j.xml in the directory JBOSS_EAP_DIST/jboss-as/server/PROFILE/conf. Notethat the production configuration is preconfigured with console logging disabled.
The following is an extract of the relevant sections from the production configuration file:
<?xml version="1.0" encoding="UTF-8"?><!DOCTYPE log4j:configuration SYSTEM "log4j.dtd"><!-- ===================================================================== --><!-- --><!-- Log4j Configuration --><!-- --><!-- ===================================================================== --><!-- ====================== --><!-- More Appender examples --><!-- ====================== --><!-- Buffer events and log them asynchronously --><appender name="ASYNC" class="org.apache.log4j.AsyncAppender"> <errorHandler class="org.jboss.logging.util.OnlyOnceErrorHandler"/> <appender-ref ref="FILE"/> <appender-ref ref="CONSOLE"/> <appender-ref ref="SMTP"/></appender><!-- ======================= --><!-- Setup the Root category --><!-- ======================= --><root> <!--
CHAPTER 7. LOGGING PROVIDER
53

Console logging can be disabled either by deleting the entire Appender section from the configurationfile or deleting the line containing <appender-ref ref="CONSOLE"/>
7.2. APPENDERS
Console logging is a form of appender and there are two other main types of file based appenders, onethat writes synchronously and the other asynchronously. The amount of data logged by an applicationcan vary greatly according to what the application does and how it behaves. If a problem occurs in thebackground, for instance, there may be a sudden increase in logging occurrences, resulting inperformance degradation of the application. The asynchronous appender is recommended over thesynchronous appender because it will generally perform better. The difference in performance varieson the amount of logging that is typical for the application.
The easiest method of using the asynchronous appender is to use the production configuration or basea new configuration on it because it (as noted earlier) has console logging disabled but theasynchronous appender enabled. The configuration file to be modified is jboss-log4.xml in thedirectory JBOSS_EAP_DIST/jboss-as/server/<PROFILE>/conf.
The following is an extract of the two relevant sections from the production configuration file:
Set the root logger priority via a system property. Note this is parsed by log4j, so the full JBoss system property format is not supported; e.g. setting a default via ${jboss.server.log.threshold:WARN} will not work. --> <priority value="${jboss.server.log.threshold}"/> <appender-ref ref="CONSOLE"/> <appender-ref ref="FILE"/></root></log4j:configuration>
<?xml version="1.0" encoding="UTF-8"?><!DOCTYPE log4j:configuration SYSTEM "log4j.dtd"><!-- ===================================================================== --><!-- --><!-- Log4j Configuration --><!-- --><!-- ===================================================================== --><log4j:configuration xmlns:log4j="http://jakarta.apache.org/log4j/" debug="false"><!-- ====================== --><!-- More Appender examples --><!-- ====================== --><!-- Buffer events and log them asynchronously --><appender name="ASYNC" class="org.apache.log4j.AsyncAppender"> <errorHandler class="org.jboss.logging.util.OnlyOnceErrorHandler"/> <appender-ref ref="FILE"/> <!-- <appender-ref ref="CONSOLE"/>
Performance Tuning Guide
54

In the ASYNC appender configuration, the FILE-based appender is active but the CONSOLE and SMTPappenders are explicitly excluded. In the Root category, the Appender reference is ASYNC, enablingthe asynchronous appender.
7.3. LOCATION OF LOG FILES
The storage location of log files should be considered as a potential performance issue. Logging couldperform poorly if on a file system and disk configuration that is poor for I/O throughput, degrading thewhole platform's performance. The likely performance impact is heavily dependent on the rate atwhich messages are logged. Even if the logging rate is normally quite low, there can be an impact ifdebug/trace logging needs to be enabled to troubleshoot an issue. With this form of logging enabledthe logs can grow very fast and impact performance dramatically, also making it more difficult to getthe information needed.
To change the storage location of log files choose one of the following options, with option 1recommended because it's easier to maintain:
1. Specify the preferred value for the variable from the command-line when starting JBossEnterprise Application Platform, such as: -Djboss.server.log.dir=<path_for_log_files>
2. Edit the configuration file, replacing the variable ${jboss.server.log.dir} with the preferred path.
7.4. WRAPPING LOG STATEMENTS
Here the discussion is not about the logging of JBoss Enterprise Application Platform but theapplication's own logging. It's common practice for developers to make liberal use of the code like thefollowing example:
There does not seem to be anything obviously wrong with the code. It states that when debug loggingis turned on, the message should be written to the log. Since an application is only run with debuglogging turned on when debugging is being done, you would not expect any impact on performance. Infact there is a likely impact and it occurs because of the way statements like this are evaluated by theplatform. Before the statement itself is evaluated, a lot of activity occurs in preparation: creation of
<appender-ref ref="SMTP"/> --></appender><!-- ======================= --><!-- Setup the Root category --><!-- ======================= --><root> <!-- Set the root logger priority via a system property. Note this is parsed by log4j, so the full JBoss system property format is not supported; e.g. setting a default via ${jboss.server.log.threshold:WARN} will not work. --> <priority value="${jboss.server.log.threshold}"/> <!-- appender-ref ref="CONSOLE"/ --> <appender-ref ref="ASYNC"/></root></log4j:configuration>
log.debug(“Some text…” + Object);
CHAPTER 7. LOGGING PROVIDER
55

temporary string objects, calling the object's toString() method, creation of an internal LoggingEventobject, formatting data, getting the current date, getting the thread ID of the calling thread and so on.Once all this is complete the statement is finally evaluated and if debug logging is not enabled, thecreated objects are again destroyed and processing continues to the next statement. The creation ofthese objects takes system resources, mainly CPU cycles and memory, with the performance impactmultiplied by the number of debug statements processed.
There's a method which can reduce the performance impact of using debug statements, in whichthey're wrapped in a boolean statement. As the following example shows, whether or not debug loggingis enabled is first evaluated and only then does the processing of the debug statement occur. There is atrade-off between processing of the boolean statement versus that of the debug statement but fewersystem resources are used and so the performance impact is reduced.
It's not necessary to wrap every debug statement, only those which are often encountered. Take theexample of a debug statement placed in a try..catch structure, where the exception is rare. Sincethe debug statement will only rarely be evaluated, the performance difference between wrapping andnot wrapping the statement in a boolean expression is likely to be minimal. As usual, there should be ameasurable gain from the effort put into performance improvements.
if (debugEnabled()) { log.debug(“Some text...” + Object);}
Performance Tuning Guide
56

CHAPTER 8. PRODUCTION CONFIGURATIONIn several chapters of this book it's been mentioned that the suggested optimizations are alreadypresent in the production configuration. Understanding just what this configuration is and how it wascreated can be useful in optimizing the JBoss Enterprise Application Platform. The productionconfiguration was created with the aim of making the platform production-ready quickly and easily. Bydefault, clustering and caching is enabled so that customers immediately have the benefit of thesehigh-availability features. Although it's a good starting point for a real-life configuration, it should betuned to best meet the application's requirements.
The main differences between the production and other configurations are:
Console logging is disabled.
Asynchronous appender for logging is enabled.
Logging verbosity is turned down in many cases.
Additional categories are defined to limit logging.
Default logging level is debug, but is overridden by the limit categories that were added.
This enables support to make things easier for customers to turn on debug levellogging for various components, since the customer can just comment out the limitingcategory, and they will have debug logging for it.
The cached connection manager is set to not be in debug mode.
Clustering is properly configured to work with supported databases.
In the “all” configuration, the configuration is created to support the HSQL database, whichis bundled for convenience with the server, but does not support clustering properly.
This is specifically the UUID generator.
The heap size is set higher than in the community edition.
Typically the heap size for the JVM is set to 512 megabytes in the community edition. Forthe platform it's set to the largest value possible for a 32-bit JVM across all platforms.
The largest 32-bit setting that works across all supported JVM and operating systems is1.3 gigabytes (Windows sets the limit).
All administration is secured by default.
This was recently done in the community releases as well, so its now the same as the rest.
Hot deployment is still turned on by default, but the scan rate is changed from every 5 secondsto once per minute.
It could be disabled altogether but many customers do use it in production and if there alarge number of deployments, scanning every 5 seconds can affect performance badly.
CHAPTER 8. PRODUCTION CONFIGURATION
57

CHAPTER 9. JAVA VIRTUAL MACHINE TUNINGJava Virtual Machine tuning can be a complex task, given the number of configuration options andchanges with each new release. As in similar situations, the best advice is to keep the configuration assimple as possible rather than trying to tweak every available setting. In this chapter several generaloptions which apply to all workloads will be discussed, also the performance impact of a 32-bit versus64-bit Java Virtual Machine.
9.1. 32-BIT VS. 64-BIT JVM
A question commonly raised when discussing performance is which gives better overall performance:32-bit or 64-bit JVM? It would seem that a 64-bit JVM hosted by a 64-bit operating system shouldperform better than a 32-bit JVM on modern, 64-bit capable hardware. To try and provide somequantitative data on the topic, testing was performed with an industry standard workload. All testswere run on the same system, with the same operating system, JVM version and settings with oneexception described below.
Figure 9.1. JVM Throughput - 32-bit versus 64-bit
In the graph above you can see that the two JVMs are quite similar in throughput, with the 64-bit JVMapproximately 3.9% faster than the 32-bit JVM using a 2GB heap size. The 2GB heap size was used asit's the common limit for a 32-bit JVM on many operating systems. Having said that, the 32-bit JVMcannot be that large on Windows 2008, and can be larger on Red Hat Enterprise Linux (around 2.4 to2.6GB depending on version). The 64-bit JVM has improved markedly over the last couple of years,relative to the 32-bit JVM, mainly because of the introduction of compressed ordinary object pointers(OOPs). OOPs implements a compression of the internal memory pointers within the JVM for objects,reducing the size of the heap. Instead of using the native machine word size for pointers, it compressesthem to be competitive with the 32-bit JVM. The following article is recommended reading on the topicof compressed OOPs: http://wikis.sun.com/display/HotSpotInternals/CompressedOops
Performance Tuning Guide
58

The real advantage of the 64-bit JVM is that heap sizes much larger than 2GB can be used. Large pagememory with the 64-bit JVM give further optimizations. The following graph shows the results runningfrom 4GB heap sizes, in two gigabyte increments, up to 20GB heap.
Figure 9.2. JVM Throughput - comparison of incrementally larger heap sizes
The difference in performance between 2GB and 4GB heap memory is a significant 6.11% higherthroughput. For the remainder of the heap sizes increment, the incremental throughput improvementsare smaller and between 18GB and 20GB heap sizes throughput drops slightly. With a 16GB heap thethroughput is 9.64% higher, just a few percentage points higher than 4GB. It may not seem significantbut those few percentage points in throughput equates to almost 23,000 operations per second faster.Since memory is relatively cheap, the increased throughput is more than justified. A larger heap sizecontributes to improved performance but further improvement requires use of a JVM and operatingsystem feature called large page memory.
9.2. LARGE PAGE MEMORY
The default memory page size in most operating systems is 4 kilobytes (kb). For a 32-bit operatingsystem the maximum amount of memory is 4 GB, which equates to 1,048,576((1024*1024*1024*4)/4096) memory pages. A 64-bit operating system can address 18 Exabytes ofmemory in theory which equates to a huge number of memory pages. The overhead of managing such alarge number of memory pages is significant, regardless of the operating system. The largest heap sizeused for tests covered in this book was 20 GB, which equates to 5,242,880 memory pages, a five-foldincrease over 4 GB.
Large memory pages are pages of memory which are significantly larger than 4 kb, usually 2 Mb. Insome instances it's configurable, from 2MB to 256MB. For the systems used in the tests for this book,the page size is 2MB. With 2MB pages, the number of pages for a 20GB heap memory drops from
CHAPTER 9. JAVA VIRTUAL MACHINE TUNING
59

5,242,880 to 10,240! A 99.8% reduction in the number of memory pages means significantly lessmanagement overhead for the underlying operating system.
Large memory pages are locked in memory, and cannot be swapped to disk like regular memory pageswhich has both advantages and disadvantages. The advantage is that if the heap is using large pagememory it can not be paged or swapped to disk so it's always readily available. For Linux thedisadvantage is that for applications to use it they have to attach to it using the correct flag for theshmget() system call, also they need to have the proper security permissions for the memlock() systemcall. For any application that does not have the ability to use large page memory, the server will lookand behave as if the large page memory does not exist, which could be a major problem. Care must betaken when configuring large page memory, depending on what else is running on your server besidesthe JVM.
To enable large page memory, add the following option to the command-line used to start theplatform:
-XX:+UseLargePages
This option applies to OpenJDK, and the Oracle proprietary HotSpot-based JVM but there are similaroptions for IBM's and Oracle's JRockit JVMs. Refer to their documentation for further details. It's alsonecessary to change the following parameters:
kernel.shmmax = n
Where n is equal to the number of bytes of the maximum shared memory segment allowed on thesystem. You should set it at least to the size of the largest heap size you want to use for the JVM, oralternatively you can set it to the total amount of memory in the system.
vm.nr_hugepages = n
Where n is equal to the number of large pages. You will need to look up the large page size in/proc/meminfo.
vm.huge_tlb_shm_group = gid
Where gid is a shared group id for the users you want to have access to the large pages.
The next step is adding the following in /etc/security/limits.conf:
Where <username> is the runtime user of the JVM and n is the number of pages from vm.nr_hugepages* the page size in KB from /proc/meminfo.
Instead of setting n to a specific value, this can be set to unlimited, which reduces maintenance.
Enter the command sysctl -p and these settings will be persistent. To confirm that this had takeneffect, check that in the statistics available via /proc/meminfo, HugePages_Total is greater than 0. IfHugePages_Total is either zero (0) or less than the value you configured, there are one of two thingsthat could be wrong:
the specified number of memory pages was greater than was available;
there were not enough contiguous memory pages available.
<username> soft memlock n <username> hard memlock n
Performance Tuning Guide
60

When large page memory is allocated by the operating system, it must be in contiguous space. Whilethe operating system is running, memory pages get fragmented. If the request failed because of this itmay be necessary to reboot, so that the allocation of memory pages occurs before applications arestarted.
With the release of Red Hat Enterprise Linux 6, a new operating system capability called transparenthuge pages (huge pages are the same as large pages) is available. This feature gives the operatingsystem the ability to combine standard memory pages and make them large pages dynamically andwithout configuration. It enables the option of using large page memory for any application, even if it'snot directly supported. Consider using this option since it reduces the configuration effort at arelatively small performance cost. Consult the Red Hat Enterprise Linux 6 documentation for specificconfiguration instructions.
The graph below shows the performance difference of the standard workload used in the 32-bit vs. 64-bit JVM comparison section.
Figure 9.3. JVM Throughput - 32-bit versus 64-bit
The peak line that was created with the 16GB heap is included to illustrate the difference. All heapsizes, even down to 4GB were substantially faster than the best without large page memory. The peakwas actually the 18GB heap size run, which had 6.58% higher throughput than the 4GB result. Thisresult was also 17.48% more throughput than the 16GB test run without large page memory. In theseresults it's evident that using large page memory is worthwhile, even for rather small heap sizes.
CHAPTER 9. JAVA VIRTUAL MACHINE TUNING
61

Figure 9.4. JVM Throughput - comparison of with and without large pages enabled
This graph compares two runs, with and without large page memory, using the EJB 3 OLTP applicationthat has been referenced throughout this book. The results are similar to what we saw in the Java onlyworkload. When executing this test, using the same 12GB heap size but without large page memory,the result was just under 3,900 transactions per second (3,899.02 to be exact). With large pagememory enabled the result was over 4,100 transactions per second (4.143.25 to be exact). Thisrepresents a 6.26% throughput improvement which is not as large as the Java-only workload but thisis to be expected, as this is a more complex workload, with a fairly large percentage of the time noteven in the JVM itself. It's still significant however, because it equates to 244+ transactions persecond more or 14,000+ extra transactions per minute. In real terms this means more work(processing) can be done in the same amount of time.
9.3. GARBAGE COLLECTION AND PERFORMANCE TUNING
For all the tests referred to in this book the JVM garbage collection option used was: -XX:+UseParallelOldGC. Many people choose the Concurrent Mark and Sweep (CMS) collector,collection is slower on both the Eden space and Old generation. The following graph shows thedifference between using the throughput collector with parallel collection on the Old generation incomparison to using the CMS collector, which works on the Old generation and parallel collection onthe Eden space.
Performance Tuning Guide
62

Figure 9.5. Transactional OLTP Workload
The difference in performance between the Parallel Garbage Collector and the Concurrent Mark andSweep Garbage collector can be explained by their underlying design. If you do not specify the option -XX:+UseParallelOldGC, the throughput collector defaults to parallel collection on the Eden space,and single threaded collection on the Old generation. With a 12GB heap, the Old generation is 8GB insize, which is a lot of memory to garbage collect in a single thread fashion. By specifying that the Oldgeneration should also be collected in parallel, the collection algorithms designed for the highestthroughput is used, hence the name "throughput collector". When the option -XX:+UseParallelOldGC isspecified it also enables the option -XX:+UseParNewGC. In comparison, the CMS collector is notoptimized for throughput but instead for more predictable response times. The focus of this book istuning for throughput, not response time. The choice of garbage collector depends on whether higherthroughput or more predictable response times benefits the application most. For real-time systems,the trade-off is usually lower throughput for more deterministic results in response times.
9.4. OTHER JVM OPTIONS TO CONSIDER
This section covers some additional JVM options:
-XX:+CompressedOops
-XX:+AggressiveOpts
-XX:+DoEscapeAnalysis
-XX:+UseBiasedLocking
-XX:+EliminateLocks
CHAPTER 9. JAVA VIRTUAL MACHINE TUNING
63

WARNING
When considering the JVM options covered in this section, be aware that theirbehavior is subject to change depending on the version, therefore the effect ofeach should be tested before being implemented in a production environment.
Compressed OOPs, covered briefly in Section 9.1, “32-bit vs. 64-bit JVM”, implements a compressionof the internal memory pointers within the JVM for objects and so reduces the heap. From JVMrevision 1.6.0_20 and above compressed OOPs is on by default but if an earlier revision of the JDK isbeing used this option should be used for heap sizes 32GB and lower.
Aggressive optimizations, -XX:+AggressiveOpts, enables additional Hotspot JVM optimizations thatare not enabled by default. The behavior enabled by this option is subject to change with each JVMrelease and so its effects should be tested prior to implementing it in production.
The final options are locking based options, -XX:+DoEscapeAnalysis, -XX:+UseBiasedLocking and -XX:+EliminateLocks. They are designed to work together to eliminate locking overhead. Their effect onperformance is unpredictable for specific workloads and so require testing prior to being implemented.Reduced locking should improve concurrency and, on current multi-core hardware, improvethroughput.
In summary, all these options should be considered on their merits. To accurately judge their impact onperformance they should be tested independently of each other.
Performance Tuning Guide
64

CHAPTER 10. PROFILINGProfiling is monitoring the resource usage of an application with the aim of detecting areas forimprovement. One of the difficulties in profiling is choosing a tool which provides useful data withouthaving too great an impact on performance itself. On Red Hat Enterprise Linux, the OProfile tool isavailable for profiling the JBoss Enterprise Application Platform, requiring less system resources thatother profiling tools.
10.1. INSTALL
Task: Install OProfile
Complete this task to install OProfile and its dependencies.
1. In a terminal, enter the following command:
yum install oprofile oprofile-jit
2. For all enabled yum repositories (/etc/yum.repos.d/*.repo), replace enabled=0 with enabled=1 in each file's debuginfo section. If there is no debug section, add it, using theexample below as a template.
[rhel-debuginfo]name=Red Hat Enterprise Linux $releasever - $basearch - Debugbaseurl=ftp://ftp.redhat.com/pub/redhat/linux/enterprise/$releasever/en/os/$basearch/Debuginfo/enabled=1gpgcheck=1gpgkey=file:///etc/pki/rpm-gpg/RPM-GPG-KEY-redhat-release
3. In a terminal, enter the following command, modifying the JDK version number to match theversion installed:
yum install yum-plugin-auto-update-debug-info java-1.6.0-openjdk-debuginfo
10.2. ENABLE OPROFILE
Add the following to the JVM's start parameters, usually standalone.conf or domain.conf in theplatform's JBOSS_EAP_DIST/bin directory.
# 64-bit JVM-agentpath:/usr/lib64/oprofile/libjvmti_oprofile.so# 32-bit JVM-agentpath:/usr/lib/oprofile/libjvmti_oprofile.so
For example:
# Specify options to pass to the Java VM.#if [ "x$JAVA_OPTS" = "x" ]; then JAVA_OPTS="-Xms10240m -Xmx10240m -XX:+UseLargePages -
CHAPTER 10. PROFILING
65

XX:+UseParallelOldGC" JAVA_OPTS="$JAVA_OPTS -Djava.net.preferIPv4Stack=true -Dorg.jboss.resolver.warning=true" JAVA_OPTS="$JAVA_OPTS -Dsun.rmi.dgc.client.gcInterval=3600000 -Dsun.rmi.dgc.server.gcInterval=3600000" JAVA_OPTS="$JAVA_OPTS -agentpath:/usr/lib64/oprofile/libjvmti_oprofile.so"fi
10.3. CONTROLLING OPROFILE
OProfile runs as a daemon and must be running while profiling data is collected. The command-lineutility opcontrol is used to manage OProfile's state.
opcontrol --start-daemon
Starts the OProfile daemon. This can be done at any time prior to collecting profile data.
opcontrol --start
Starts the collection of profiling data. This command must be given before starting the workload to beprofiled.
opcontrol --stop
Stops the collection of profiling data.
opcontrol --dump
Dumps the profiling data to the default file.
opcontrol --shutdown
Shuts down the OProfile daemon.
10.4. DATA CAPTURE
Before starting any profiling, start the OProfile daemon. Once it is running, each profiling sessiontypically consists of the following steps:
1. Start capturing profiling data
2. Start/run the workload
3. Stop capturing profiling data
4. Dump profiling data
5. Generate the profiling report
The simplest profiling report is produced by the command:
opreport -l --output-file=<filename>
Performance Tuning Guide
66

This command produces a list of processes and their CPU cycles, from highest to lowest. Note thatOProfile monitors the entire system, not just the Java processes. For additional information onOProfile, including additional reporting options, refer to the man page and the home page -http://oprofile.sourceforge.net.
CHAPTER 10. PROFILING
67

CHAPTER 11. PUTTING IT ALL TOGETHERThis book has covered many aspects of JBoss Enterprise Application Platform and opportunities forperformance optimization. In presenting example performance improvements an OLTP application hasbeen used as the test case. Before presenting the results of optimizing the performance of thisapplication, here are details of the underlying infrastructure:
11.1. TEST CONFIGURATION
Server Configuration
CPU: Intel Nehalem-based server with two, four-core Xeon E5520 processors, running at2.27GHz, with hyper-threading enabled, giving 16 virtual cores
Memory: 24GB of RAM
Local storage: two 80GB solid state drives, in a RAID-0 configuration
Operating system: Linux
A RAID 0 configuration was chosen for local storage to avoid I/O contention with the database
Database
Hosted on MySQL 5.5.x with the new asynchronous I/O capabilities and the transaction limit removed.
Load Driver
Laptop with four-core CPU and hyper-threading enabled, dedicated gigabit network connectionbetween the laptop and the server.
11.2. TESTING STRATEGY
The tests conducted with the number of users increased from 1 to 100 users, stepping up by 20 usersat a time, with no think time between requests from the load driver. This allowed quick turnaround timeper test run, and created results that were easier to present. The same loads were run using 1 secondthink times, but it scales to so many users that it makes it difficult to present the data. The results werevery similar anyway, from a throughput improvement perspective. Before each test run the ordertransactions in the workload were deleted and the InnoDB buffer pool was checked for dirty pagesbefore starting the next run. Each test was run five times to ensure reproducibility of the results. Amaximum of 100 users was used because at was at that point which throughput plateaued.
11.3. TEST RESULTS
Performance Tuning Guide
68

Figure 11.1.
The above graph compares the throughput of four configurations (transactions per second). Runningthe same workload, tests were run with the “all” configuration unmodified, expect for deploying theapplication and its data source, as the baseline with no optimizations. As discussed in the book, the“all” configuration is the basis for the production configuration. The next test was the “production”configuration, with nothing modified but the application and data source deployed, just like the “all”configuration. As you can see from the results, the changes made to the production configuration had avery positive effect on throughput. In fact, throughput is 39.13% higher at the peaks and that wasachieved simply by deploying the application into a different configuration. The next result is using the“production” configuration again, but with the heap size set to match the fully optimized test run,which was 12GB. This test was run to demonstrate that making the heap size larger does notnecessarily account for much of a performance gains since the throughput in this test was only 4.14%higher. An increase in heap size must be matched with changes in garbage collection and large pagememory. Without those optimizations a larger heap may help, but not by as much as might beexpected. The fully optimized result is the very best with throughput 77.82% higher.
Figure 11.2.
Optimizations made a significant difference in response times. Not only is the fully optimizedconfiguration the fastest by a wide margin, its slope is also less steep, showing the improved scalabilityof the fully optimized result. At the peak throughput level, the fully optimized result has a response
CHAPTER 11. PUTTING IT ALL TOGETHER
69

time that is 45.45% lower than the baseline. At the 100 user level, the response time is 78.26% lower!
Performance Tuning Guide
70

APPENDIX A. REVISION HISTORY
Revision 5.2.0-100.400 2013-10-31 Rüdiger LandmannRebuild with publican 4.0.0
Revision 5.2.0-100 Wed 23 Jan 2013 Russell DickensonIncorporated changes for JBoss Enterprise Application Platform 5.2.0 GA. For information about documentation changes tothis guide, refer to Release Notes 5.2.0.
Revision 5.1.2-133 Wed 18 Jul 2012 Anthony TownsRebuild for Publican 3.
Revision 5.1.2-100 Thu 8 Dec 2011 Russell DickensonFirst release.
APPENDIX A. REVISION HISTORY
71