Embed Size (px)
Citation preview

Environmental Chemistry for a Sustainable World
Soil Pollution - An Emerging Threat to Agriculture
Jayanta K. Saha · Rajendiran SelladuraiM. Vassanda Coumar · M.L. DotaniyaSamaresh Kundu · Ashok K. Patra

Environmental Chemistry for a Sustainable
World
Volume 10
Series editors
Eric Lichtfouse, INRA, UMR1347 Agroecologie, Dijon, France
Jan Schwarzbauer, RWTH Aachen University, Aachen, Germany
Didier Robert, CNRS, European Laboratory for Catalysis and Surface Sciences,
Saint-Avold, France

Other Publications by the Editors
Books
Scientific Writing for Impact Factor Journals
https://www.novapublishers.com/catalog/product_info.php?products_id=42242
http://fr.slideshare.net/lichtfouse/scientific-writing-for-impact-factor-journals
Environmental Chemistry
http://www.springer.com/978-3-540-22860-8
Organic Contaminants in Riverine and Groundwater Systems
http://www.springer.com/978-3-540-31169-0
Sustainable Agriculture
Volume 1: http://www.springer.com/978-90-481-2665-1
Volume 2: http://www.springer.com/978-94-007-0393-3
Book series
Environmental Chemistry for a Sustainable World
http://www.springer.com/series/11480
Sustainable Agriculture Reviews
http://www.springer.com/series/8380
Journals
Environmental Chemistry Letters
http://www.springer.com/10311
Agronomy for Sustainable Development
http://www.springer.com/13593
Publier La Science
https://listes.inra.fr/sympa/d_read/veillecaps
(in French and English)
More information about this series at http://www.springer.com/series/11480

Jayanta K. Saha • Rajendiran SelladuraiM. Vassanda Coumar • M.L. DotaniyaSamaresh Kundu • Ashok K. Patra
Soil Pollution - An EmergingThreat to Agriculture

Jayanta K. SahaDivision of Environmental Soil ScienceIndian Institute of Soil ScienceBhopal, Madhya PradeshIndia
Rajendiran SelladuraiDivision of Environmental Soil ScienceIndian Institute of Soil ScienceBhopal, Madhya PradeshIndia
M. Vassanda CoumarDivision of Environmental Soil ScienceIndian Institute of Soil ScienceBhopal, Madhya PradeshIndia
M.L. DotaniyaDivision of Environmental Soil ScienceIndian Institute of Soil ScienceBhopal, Madhya PradeshIndia
Samaresh KunduDivision of Environmental Soil ScienceIndian Institute of Soil ScienceBhopal, Madhya PradeshIndia
Ashok K. PatraIndian Institute of Soil ScienceBhopal, Madhya PradeshIndia
ISSN 2213-7114 ISSN 2213-7122 (electronic)Environmental Chemistry for a Sustainable WorldISBN 978-981-10-4273-7 ISBN 978-981-10-4274-4 (eBook)DOI 10.1007/978-981-10-4274-4
Library of Congress Control Number: 2017934645
© Springer Nature Singapore Pte Ltd. 2017This work is subject to copyright. All rights are reserved by the Publisher, whether the whole or part ofthe material is concerned, specifically the rights of translation, reprinting, reuse of illustrations,recitation, broadcasting, reproduction on microfilms or in any other physical way, and transmissionor information storage and retrieval, electronic adaptation, computer software, or by similar ordissimilar methodology now known or hereafter developed.The use of general descriptive names, registered names, trademarks, service marks, etc. in thispublication does not imply, even in the absence of a specific statement, that such names are exemptfrom the relevant protective laws and regulations and therefore free for general use.The publisher, the authors and the editors are safe to assume that the advice and information in thisbook are believed to be true and accurate at the date of publication. Neither the publisher nor theauthors or the editors give a warranty, express or implied, with respect to the material containedherein or for any errors or omissions that may have been made. The publisher remains neutral withregard to jurisdictional claims in published maps and institutional affiliations.
Printed on acid-free paper
This Springer imprint is published by Springer NatureThe registered company is Springer Nature Singapore Pte Ltd.The registered company address is: 152 Beach Road, #21-01/04 Gateway East, Singapore 189721,Singapore

Foreword
Globally agriculture has been recognized as an engine of economic development
and is an integral part of any agenda for addressing global issues of 21st century.
According to numerous studies, pollution in agricultural soils has become a grow-
ing concern in most of the developed and developing nations due to enhanced
industrialization and urbanization. Intake of heavy metal via soil-crop system has
been considered as the predominant pathway of human exposure to environmental
heavy metals and organic pollutants in agricultural areas. The sources of heavy
metals and other pollutants in the environment are mainly derived from anthropo-
genic sources that include mining, smelting, waste disposal, urban effluent, vehicle
exhaust, sewage sludge, and pesticide and fertilizer application. Soils fulfill a wide
variety of environmental services as a foundation for biomass production, a filter
and buffer for water, an archive of natural and human history, and an important
store of carbon, and these ecosystem services have become core issues of modern
ecology. In India, agricultural soils may indeed be managed to enhance the pro-
ductive capacity and to reduce the vulnerability to pollution at farm level but are
often traded off against higher priority for short-term food and water security under
the pressure of increasing production goal. The farm system is a complex social-
ecological system wherein biophysical and socioeconomic concerns interact and
sometimes counteract in complex ways. Finding solution to check soil pollution
v

requires integrated approaches, and it has to be at the national scale where regula-
tions are designed and implemented at the farm level.
I am sure that the book entitled Soil Pollution: An Emerging Threat to Agricul-ture, authored by a group of professional experts from Indian Institute of Soil
Science, will serve as a useful reference material for researchers, developmental
officials, policy makers, and others engaged in soil protection endeavors.
Dated the 8th March, 2017New Delhi (T. MOHAPATRA)
vi Foreword

Foreword
Post-liberalization India has recorded considerable industrial growth accounting for
more than 30% of its GDP. This impressive growth is, however, accompanied by an
increasing threat to its environment from emission, discharge and disposal of
pollutants from industries, higher consumerism, etc. Rapid urbanization in the
country has also posed a serious threat to its environment for unscientific disposal
of huge solid and liquid wastes to its precious water bodies and agricultural land.
Soil is the principal recipient of such wastes generated from industrial and urban
sectors either through direct discharge or through contaminated irrigation water.
Several toxic metals and compounds generating out of the above anthropogenic
activities are contaminating our precious natural resources which have evolved
through millions of years of pedogenic processes and also threatening the very
existence of different forms of life including human beings. Although India is
blessed with vast area of fertile land, plenty of water resources and favourable
climatic conditions for high agricultural growth, the above happenings are affecting
her natural capital at an alarming rate. The degradation of soil resources due to
faulty land management practices has been highlighted for long, but the same for
industrial and urban activities is, by and large, ignored. We cannot take no notice on
this for the fact that (i) though estimated land area affected with pollution is smaller
compared to other types of degradation, it occurs in more fertile land near cities and
towns and also (ii) reclamation of such land is very costly (even with low success)
compared to the degraded land caused by faulty management practices. The
pressure of increasing and sustaining agricultural productivity on every piece of
land in order to feed the ever-increasing population is again forcing us to pay almost
no attention towards this vital area of land degradation. To combat it and develop an
effective action plan for remediation of such area, we need to have first-hand
information on the status of soil pollution in the country.
Although sporadic information generated from some parts of the country indi-
cated the build-up of pollutants in agricultural land, a systemic and comprehensive
report on anthropogenic activities and the status of soil pollution is not available.
vii

I am extremely happy that the Division of Environmental Soil Science at the Indian
Institute of Soil Science has compiled both primary and secondary information on
the topic and brought out a useful publication entitled ‘Soil Pollution: An Emerging
Threat to Agriculture’ and congratulate its authors. I hope researchers and policy
makers working on the subject will be highly benefitted from the contents of the
publication.
Former Vice Chancellor and Professor (Soil Science)Bidhan Chandra Krishi Viswavidyalaya, India (L. N. Mandal)
Kalyani, West Bengal, India
viii Foreword

Preface
Due to the unique geographical location and climatological advantage, India is
bestowed with fertile land capable of producing diversified crops and food for the
second largest population of the world. Soil has been revered by mankind in the
Indian subcontinent since ancient times as evidenced in the Atharva Veda (12-1-12)which solemnly declared the enduring filial allegiance of humans to Mother Earth
‘माता भिमः, पɾोऽह पिथɄयाः’. In tune to that, soil was cared for maintaining its
productivity through soil and water conservation and application of organic
manure. However, due to greed for growing more food, the need for sustainable
use of land has been ignored during the post-Green Revolution period. This, in
conjunction with increased developmental activities (mining, infrastructure, indus-
try, urbanization, etc.), has put considerable pressure on agricultural land causing
its degradation. Since the last decade of the previous century, the need for assess-
ment of soil quality was being felt to address the issue of declining partial factor
productivity of inputs during growing of agricultural crops. Although considerable
effort is being made to address the issues of soil conservation, nutrient mining and
soil organic matter maintenance through research, extension and modification of
the fertilizer policy, the issue of declining soil quality due to entry of harmful
contaminants is by and large ignored in spite of their accelerated generation and
spread in the environment. This is probably because soil is generally viewed mainly
as a medium of plant growth and is considered a domain of agricultural scientists
where enhancing food productivity from a fixed land area remains the major
challenge. However, limited researches conducted by ICAR-Indian Institute of
Soil Science gave enough indication that the area of soil pollution and its remedi-
ation needs to be addressed adequately in order to prevent permanent deterioration
of soil quality in vulnerable areas. However, this cannot be done without sincere
involvement of other stakeholders responsible for generation, monitoring and
control of the contaminants. Also, this requires considerable awareness among
different stakeholders like students, educationalists, environmentalists, industrial-
ists, policy makers and farmers on the importance of soil quality maintenance and
its protection from polluting activities so that right direction can be followed during
ix

the country’s development in generations to come. This issue had been deliberated
considerably in Research Advisory Committee meetings of ICAR-Indian Institute
of Soil Science where the need for a publication on the status of soil pollution in the
country and on adoptable remedial measures for its protection was felt. Several
textbooks have been written in the perspective of imparting basic knowledge to
graduate students focussing on remediation technologies for polluted lands. How-
ever, a comprehensive book dealing on the subject of ‘soil pollution-pollutants,their sources, impact, assessment methodology, status of soil pollution in India and
ways to address it in Indian context’ is meagre. Keeping this in mind, this book has
been written after analysis of vast research and other information generated in this
subject, which will hopefully be suitable both as textbook for students and as a
reference book for researchers in the field related to soil and environmental science,
as well as for experts involved in Environmental Impact Assessment and policy
making.
I, on behalf of all the authors, take this opportunity to express our gratitude to
members of the Research Advisory Committee of ICAR-Indian Institute of Soil
Science for their keen interest in bringing out this publication. I am also grateful to
the scientists and other staff of the Division of Environmental Soil Science for
extending their help during the preparation of the manuscript. It is hoped that the
community of students, researchers, policy makers, planners, farmers, environmen-
talists and EIA experts will find this publication useful.
Bhopal, Madhya Pradesh
India
Jayanta K. Saha
x Preface

Contents
1 Agriculture, Soil and Environment . . . . . . . . . . . . . . . . . . . . . . . . . 1
1.1 Agriculture in Indian Economy . . . . . . . . . . . . . . . . . . . . . . . 1
1.2 Role of Soil in Sustainability of Agriculture in India . . . . . . . . 4
1.3 Threat to Soil and Environment . . . . . . . . . . . . . . . . . . . . . . . 4
1.4 Addressing the Issue of Soil Pollution . . . . . . . . . . . . . . . . . . 7
References . . . . . . . . . . . . . . . . . . . . . . . . . . . . . . . . . . . . . . . . . . . . 9
2 Soil and Its Role in the Ecosystem . . . . . . . . . . . . . . . . . . . . . . . . . 11
2.1 Physical and Chemical Characteristics of Soil . . . . . . . . . . . . 13
2.1.1 Physical Properties of Soils . . . . . . . . . . . . . . . . . . . 13
2.1.2 Soil Chemical Property . . . . . . . . . . . . . . . . . . . . . . 15
2.2 Soil Organic Matter and Its Role in Soil Productivity . . . . . . . 19
2.2.1 Nature and Amount of Soil Organic Matter . . . . . . . 20
2.2.2 Humic Substances . . . . . . . . . . . . . . . . . . . . . . . . . 21
2.3 Organisms in Soil and Their Activities . . . . . . . . . . . . . . . . . . 21
2.3.1 Macroorganisms in Soil . . . . . . . . . . . . . . . . . . . . . 22
2.3.2 Microorganisms in Soil . . . . . . . . . . . . . . . . . . . . . . 23
2.4 Soil Forming Processes . . . . . . . . . . . . . . . . . . . . . . . . . . . . . 24
2.5 Types of Soil and Their Distribution . . . . . . . . . . . . . . . . . . . 25
2.5.1 Soil Order . . . . . . . . . . . . . . . . . . . . . . . . . . . . . . . 25
2.5.2 Major Soil Types of India . . . . . . . . . . . . . . . . . . . . 27
2.5.3 Major Soil Types Under Different
Agro-Ecological Zones (AEZ) of the Country . . . . . 31
2.6 Relationship Between Soil and Vegetation and Concept
of Top Soil . . . . . . . . . . . . . . . . . . . . . . . . . . . . . . . . . . . . . . 33
References . . . . . . . . . . . . . . . . . . . . . . . . . . . . . . . . . . . . . . . . . . . . 35
xi

3 Impacts of Soil Pollution and Their Assessment . . . . . . . . . . . . . . . 37
3.1 Loss of Crop Productivity and Crop Diversity . . . . . . . . . . . . 38
3.1.1 Farmer’s Interaction/Survey . . . . . . . . . . . . . . . . . . 39
3.1.2 Crop Cutting Survey . . . . . . . . . . . . . . . . . . . . . . . . 39
3.1.3 Use of Satellite Imagery . . . . . . . . . . . . . . . . . . . . . 40
3.2 Decline in Nutrient Use Efficiency . . . . . . . . . . . . . . . . . . . . . 41
3.2.1 Measurement in Decline in Nutrient Use
Efficiency (NUE) . . . . . . . . . . . . . . . . . . . . . . . . . . 41
3.3 Quality of Food: Vegetable, Fruit and Grain . . . . . . . . . . . . . . 42
3.3.1 Produce Quality Assessment Method . . . . . . . . . . . . 43
3.4 Contamination of Food with Toxic Compounds Like Heavy
Metals . . . . . . . . . . . . . . . . . . . . . . . . . . . . . . . . . . . . . . . . . 43
3.4.1 Identification of Contamination of Food
with Heavy Metals . . . . . . . . . . . . . . . . . . . . . . . . . 43
3.4.2 Contamination Beyond the Permissible Limits
of Government Quality Control Regulations . . . . . . 44
3.5 Rejection of Export Consignment . . . . . . . . . . . . . . . . . . . . . 45
3.6 Soil Hardness/Compaction . . . . . . . . . . . . . . . . . . . . . . . . . . 46
3.6.1 Measurement of Soil Hardness . . . . . . . . . . . . . . . . 47
3.7 Decrease in Available Soil Moisture Content . . . . . . . . . . . . . 48
3.7.1 Tensiometer . . . . . . . . . . . . . . . . . . . . . . . . . . . . . . 48
3.7.2 Gravimetric Method . . . . . . . . . . . . . . . . . . . . . . . . 49
3.8 Waterlogging due to Poor Infiltration . . . . . . . . . . . . . . . . . . . 49
3.9 Impacts on Soil Fertility Parameters . . . . . . . . . . . . . . . . . . . . 50
3.9.1 Soil pH . . . . . . . . . . . . . . . . . . . . . . . . . . . . . . . . . 50
3.9.2 Electrical Conductivity (EC) . . . . . . . . . . . . . . . . . . 51
3.9.3 Sodium Adsorption Ratio (SAR) . . . . . . . . . . . . . . . 52
3.9.4 Bulk Density (BD) . . . . . . . . . . . . . . . . . . . . . . . . . 52
3.9.5 Available Major and Micro Nutrients . . . . . . . . . . . 53
3.9.6 Soil Organic Matter . . . . . . . . . . . . . . . . . . . . . . . . 53
3.9.7 Available and Total Heavy Metals Contents . . . . . . . 55
3.9.8 Soil Enzyme Activity . . . . . . . . . . . . . . . . . . . . . . . 56
3.9.9 Nitrogen Fixation Capacity . . . . . . . . . . . . . . . . . . . 57
3.9.10 Microbial Diversity Measurement . . . . . . . . . . . . . . 58
3.9.11 Soil Quality Assessment . . . . . . . . . . . . . . . . . . . . . 59
3.10 Computation of Soil Quality Index from the Perspective
of Capacity of Soil to Produce and Sustain Agricultural
Productivity . . . . . . . . . . . . . . . . . . . . . . . . . . . . . . . . . . . . . 60
3.11 Major Instances of Soil Contamination in the World
and Their Impact on Environment . . . . . . . . . . . . . . . . . . . . . 61
3.11.1 The Love Canal Tragedy . . . . . . . . . . . . . . . . . . . . 61
3.11.2 Chernobyl Nuclear Disaster . . . . . . . . . . . . . . . . . . 62
3.11.3 Cadmium Contamination of Soils in China . . . . . . . 63
3.11.4 Thermal Power Plant Disaster . . . . . . . . . . . . . . . . . 63
xii Contents

3.11.5 Seveso Disaster (Chemical Manufacturing Plant) . . . 64
3.11.6 Organic Pollutants Contamination from PCB
Manufacturing Industry at Brescia (Italy) . . . . . . . . . 65
3.11.7 Soil Contamination at Palmerton, Pennsylvania,
USA due to Zinc Smelter . . . . . . . . . . . . . . . . . . . . 66
3.11.8 Soil Contamination at Noyelles-Godault, France
due to Lead Smelter . . . . . . . . . . . . . . . . . . . . . . . . 67
3.11.9 Itai-Itai Disease in Japan due to Cadmium
Pollution . . . . . . . . . . . . . . . . . . . . . . . . . . . . . . . . 68
3.11.10 Red Mud Disaster in Hungary . . . . . . . . . . . . . . . . . 68
References . . . . . . . . . . . . . . . . . . . . . . . . . . . . . . . . . . . . . . . . . . . . 69
4 Major Inorganic Pollutants Affecting Soil and Crop Quality . . . . . 75
4.1 Understanding Soil Contamination and Human Health . . . . . . 76
4.2 Risks Associated with Soil Pollution . . . . . . . . . . . . . . . . . . . 76
4.2.1 Risks Related to One Soil Pollutant . . . . . . . . . . . . . 77
4.2.2 Risks Associated with Multiple Pollutants in Soil . . . 78
4.3 Inorganic Pollutants . . . . . . . . . . . . . . . . . . . . . . . . . . . . . . . 78
4.3.1 Sodium, Salinity and Sodicity . . . . . . . . . . . . . . . . . 78
4.3.2 Heavy Metals and Metalloids . . . . . . . . . . . . . . . . . 82
4.3.3 Heavy Metals Toxicity in Soil Microorganisms . . . . 93
4.3.4 Human Health Effects of Heavy Metals . . . . . . . . . . 94
4.3.5 Transfer of Heavy Metals in the Food Chain
and Their Bioconcentration . . . . . . . . . . . . . . . . . . . 98
References . . . . . . . . . . . . . . . . . . . . . . . . . . . . . . . . . . . . . . . . . . . . 99
5 Organic Pollutants . . . . . . . . . . . . . . . . . . . . . . . . . . . . . . . . . . . . . 105
5.1 Organic Pollutants Entry in Soil, Its Uptake by Plant
and Food Chain Contamination . . . . . . . . . . . . . . . . . . . . . . . 106
5.1.1 Pesticides . . . . . . . . . . . . . . . . . . . . . . . . . . . . . . . . 107
5.1.2 PAHs . . . . . . . . . . . . . . . . . . . . . . . . . . . . . . . . . . . 111
5.1.3 Other Persistent Organic Pollutants (POPs) . . . . . . . 117
5.1.4 Dye Pollutants . . . . . . . . . . . . . . . . . . . . . . . . . . . . 120
5.1.5 Antibiotics Contamination in Soil and Their
Impact . . . . . . . . . . . . . . . . . . . . . . . . . . . . . . . . . . 121
References . . . . . . . . . . . . . . . . . . . . . . . . . . . . . . . . . . . . . . . . . . . . 127
6 Collection and Processing of Polluted Soil for Analysis . . . . . . . . . . 137
6.1 Environmental Risk Assessment . . . . . . . . . . . . . . . . . . . . . . 138
6.2 Sampling Pattern Selection . . . . . . . . . . . . . . . . . . . . . . . . . . 139
6.2.1 Sampling Based on Non-statistical Approach . . . . . . 139
6.2.2 Statistical Approach . . . . . . . . . . . . . . . . . . . . . . . . 140
6.3 Sampling Uncertainty . . . . . . . . . . . . . . . . . . . . . . . . . . . . . . 143
6.3.1 Number of Samples to Be Collected . . . . . . . . . . . . 144
Contents xiii

6.4 Sampling Instruments . . . . . . . . . . . . . . . . . . . . . . . . . . . . . . 145
6.4.1 Sampling Surface Soils with a Trowel/Spade
and Hand Scoop . . . . . . . . . . . . . . . . . . . . . . . . . . . 145
6.4.2 Sampling Surface Soils with a Hand Auger . . . . . . . 146
6.4.3 Sampling Subsurface Soils with a Drill Rig . . . . . . . 146
6.5 Preventing Sample Cross-Contamination . . . . . . . . . . . . . . . . 146
6.6 Soil Sample Collection from Profile . . . . . . . . . . . . . . . . . . . . 147
6.7 Composite Sampling . . . . . . . . . . . . . . . . . . . . . . . . . . . . . . . 147
6.8 Reference Soil Collection for Testing . . . . . . . . . . . . . . . . . . . 148
6.9 Sample Identification/Coding . . . . . . . . . . . . . . . . . . . . . . . . . 149
6.10 Sample Preservation, Containers, Handling, and Storage . . . . . 149
6.11 Preparation of Soil Samples . . . . . . . . . . . . . . . . . . . . . . . . . . 149
6.11.1 Preparation of Soil Samples for Microbial
Testing . . . . . . . . . . . . . . . . . . . . . . . . . . . . . . . . . 149
6.11.2 Preparation of Soil Samples for Toxicity
Testing . . . . . . . . . . . . . . . . . . . . . . . . . . . . . . . . . 150
6.11.3 Preparation of Soil Samples for Plant Available
Nutrient Testing . . . . . . . . . . . . . . . . . . . . . . . . . . . 151
6.12 Sampling Plan Checklist . . . . . . . . . . . . . . . . . . . . . . . . . . . . 152
References . . . . . . . . . . . . . . . . . . . . . . . . . . . . . . . . . . . . . . . . . . . . 153
7 Assessment of Heavy Metals Contamination in Soil . . . . . . . . . . . . 155
7.1 Presence of Heavy Metals in Natural Soil . . . . . . . . . . . . . . . . 156
7.2 Concept of Baseline Concentrations of Metals in Soil . . . . . . . 158
7.2.1 Baseline Concentrations Determined for Different
Countries in the World . . . . . . . . . . . . . . . . . . . . . . 159
7.2.2 Assessment of Heavy Metal Contamination
Around Industrial Congregations . . . . . . . . . . . . . . . 161
7.3 Assessment of Risks to Organisms Due to Heavy Metals
Contamination in Soils . . . . . . . . . . . . . . . . . . . . . . . . . . . . . 168
7.3.1 Soil–Plant Partition Coefficient or Transfer
Factor . . . . . . . . . . . . . . . . . . . . . . . . . . . . . . . . . . 168
7.3.2 Bioaccumulation Factor (BAF) . . . . . . . . . . . . . . . . 169
7.4 Risk Assessment for Contaminated Soil on Human
Health . . . . . . . . . . . . . . . . . . . . . . . . . . . . . . . . . . . . . . . . . 171
7.4.1 Human Health Risk Assessment for Heavy
Metals from Contaminated Food . . . . . . . . . . . . . . . 172
7.5 Regulation in Respect of Heavy Metals Entry into
the Agricultural Land . . . . . . . . . . . . . . . . . . . . . . . . . . . . . . 173
7.5.1 Heavy Metal Loading Limits in Soil . . . . . . . . . . . . 173
7.5.2 USEPA Approach of Calculating Loading Limits
of Heavy Metals . . . . . . . . . . . . . . . . . . . . . . . . . . . 174
7.5.3 Determination of Maximum Safe Concentration
Limits of Heavy Metals Based on Sensitive
Scenario . . . . . . . . . . . . . . . . . . . . . . . . . . . . . . . . 176
xiv Contents

7.6 Soil Testing for Heavy Metal Contaminated Land . . . . . . . . . . 178
7.6.1 Factors Influencing Phytoavailability of Heavy
Metals . . . . . . . . . . . . . . . . . . . . . . . . . . . . . . . . . . 178
7.6.2 Soil Testing for Heavy Metals . . . . . . . . . . . . . . . . . 181
7.6.3 Soil Test Screening Levels of Heavy
Metals for Assessment of Toxicity
in an Agro-ecosystem . . . . . . . . . . . . . . . . . . . . . . . 183
References . . . . . . . . . . . . . . . . . . . . . . . . . . . . . . . . . . . . . . . . . . . . 186
8 Urban Activities in India Leading to Soil Pollution . . . . . . . . . . . . . 193
8.1 Urban Solid Wastes and Their Use in Agriculture . . . . . . . . . . 194
8.1.1 Municipal or Urban Solid Wastes Generation . . . . . . 194
8.1.2 Composition of MSW . . . . . . . . . . . . . . . . . . . . . . . 196
8.1.3 Existing Methods of MSW Management
in India . . . . . . . . . . . . . . . . . . . . . . . . . . . . . . . . . 196
8.1.4 Composting Methods Followed in Indian Cities . . . . 200
8.1.5 Quality of MSW Composts Prepared in India . . . . . . 201
8.1.6 Impact of MSW Compost on Soil and Crop
Quality . . . . . . . . . . . . . . . . . . . . . . . . . . . . . . . . . 204
8.2 Use of Urban Wastewater in Agriculture . . . . . . . . . . . . . . . . 206
8.2.1 Wastewater Generation and Treatment Capacity:
A Meta-analysis . . . . . . . . . . . . . . . . . . . . . . . . . . . 206
8.2.2 Impact of Urban Waste Water on Soil Quality . . . . . 207
8.2.3 Carbonaceous Components in UWW and Its
Impact on Soil Processes . . . . . . . . . . . . . . . . . . . . 208
8.2.4 Nutrient Potential of Sewage Water . . . . . . . . . . . . . 210
8.2.5 Plant Nutrient Recovery from UWW . . . . . . . . . . . . 213
8.2.6 Environmental Concern due to Use of UWW
for Irrigation to Crop . . . . . . . . . . . . . . . . . . . . . . . 214
8.3 Use of Sewage Sludge in Agriculture . . . . . . . . . . . . . . . . . . . 219
8.3.1 Nutrient Potential of Sewage Sludge . . . . . . . . . . . . 220
8.3.2 Heavy Metals in Sewage Sludge . . . . . . . . . . . . . . . 221
8.3.3 Organic Pollutants in Sewage Sludge . . . . . . . . . . . . 222
References . . . . . . . . . . . . . . . . . . . . . . . . . . . . . . . . . . . . . . . . . . . . 224
9 Industrial Activities in India and Their Impact
on Agroecosystem . . . . . . . . . . . . . . . . . . . . . . . . . . . . . . . . . . . . . . 229
9.1 Mining Industries in India . . . . . . . . . . . . . . . . . . . . . . . . . . . 230
9.2 Thermal Power Plants . . . . . . . . . . . . . . . . . . . . . . . . . . . . . . 232
9.3 Chemical Industries . . . . . . . . . . . . . . . . . . . . . . . . . . . . . . . 234
9.4 Chlor-Alkali Industries . . . . . . . . . . . . . . . . . . . . . . . . . . . . . 235
9.5 Tannery Industries . . . . . . . . . . . . . . . . . . . . . . . . . . . . . . . . 237
9.6 Pesticide Industries . . . . . . . . . . . . . . . . . . . . . . . . . . . . . . . . 238
9.7 Phosphatic Fertilizer Industry . . . . . . . . . . . . . . . . . . . . . . . . 239
9.8 Iron and Steel Industry . . . . . . . . . . . . . . . . . . . . . . . . . . . . . 240
Contents xv

9.9 Aluminium Industry . . . . . . . . . . . . . . . . . . . . . . . . . . . . . . . 241
9.10 Copper Refineries and Smelters . . . . . . . . . . . . . . . . . . . . . . . 242
9.11 Zinc and Lead Smelting Industry . . . . . . . . . . . . . . . . . . . . . . 243
9.12 Paper Industry . . . . . . . . . . . . . . . . . . . . . . . . . . . . . . . . . . . 244
9.13 Molasses Based Distillery Industry . . . . . . . . . . . . . . . . . . . . 245
9.14 Leather Industry . . . . . . . . . . . . . . . . . . . . . . . . . . . . . . . . . . 246
9.15 Textile Industry . . . . . . . . . . . . . . . . . . . . . . . . . . . . . . . . . . 246
9.16 Mercury Emission/Discharge in India . . . . . . . . . . . . . . . . . . 247
References . . . . . . . . . . . . . . . . . . . . . . . . . . . . . . . . . . . . . . . . . . . . 248
10 Impact of Different Developmental Projects on Soil Fertility . . . . . 251
10.1 Impact of Mining Activities . . . . . . . . . . . . . . . . . . . . . . . . . . 251
10.1.1 Acid Mine Drainage (AMD) and Its Impact
on Soil . . . . . . . . . . . . . . . . . . . . . . . . . . . . . . . . . . 253
10.1.2 Heavy Metal Contamination and Leaching . . . . . . . . 253
10.1.3 Pollution due to Processing Chemicals . . . . . . . . . . 254
10.1.4 Erosion and Sedimentation . . . . . . . . . . . . . . . . . . . 254
10.2 Impacts due to Smelting Industry . . . . . . . . . . . . . . . . . . . . . . 255
10.3 Impacts due to Textile Industries . . . . . . . . . . . . . . . . . . . . . . 255
10.4 Impacts of Paper and Pulp Industry on Soil Quality . . . . . . . . 258
10.5 Impact of Pesticide Industry on Agroecosystem . . . . . . . . . . . 260
10.6 Impact of Thermal Power Plants . . . . . . . . . . . . . . . . . . . . . . 261
10.7 Impact of Nuclear Power Plants . . . . . . . . . . . . . . . . . . . . . . . 262
10.8 Impact of Hydropower Industry . . . . . . . . . . . . . . . . . . . . . . . 265
10.9 Impact of Distillery Industry . . . . . . . . . . . . . . . . . . . . . . . . . 265
10.10 Impact of Infrastructure Projects . . . . . . . . . . . . . . . . . . . . . . 266
References . . . . . . . . . . . . . . . . . . . . . . . . . . . . . . . . . . . . . . . . . . . . 267
11 Status of Soil Pollution in India . . . . . . . . . . . . . . . . . . . . . . . . . . . 271
11.1 Land Use Pattern in India . . . . . . . . . . . . . . . . . . . . . . . . . . . 272
11.2 Soil Degradation in India . . . . . . . . . . . . . . . . . . . . . . . . . . . 272
11.3 Soil Pollution Due to Anthropogenic Activities . . . . . . . . . . . 273
11.3.1 Entry of Sodium into Ecosystem and Increase
in Soil Salinity and Sodicity . . . . . . . . . . . . . . . . . . 275
11.3.2 Entry of Heavy Metals in Soil . . . . . . . . . . . . . . . . . 275
11.4 Instances of Pollution from Industrial Effluents . . . . . . . . . . . 277
11.4.1 Ratlam Industrial Area, Madhya Pradesh . . . . . . . . . 278
11.4.2 Nagda Industrial Area, Madhya Pradesh . . . . . . . . . 281
11.4.3 Pithampur (Dhar) Industrial Area,
Madhya Pradesh . . . . . . . . . . . . . . . . . . . . . . . . . . . 282
11.4.4 Patancheru Industrial Area, Medak District,
Andhra Pradesh . . . . . . . . . . . . . . . . . . . . . . . . . . . 283
11.4.5 Zinc Smelting Area in Udaipur, Rajasthan . . . . . . . . 283
11.4.6 Soil and Water Pollution by Textile Industries
in Pali, Rajasthan . . . . . . . . . . . . . . . . . . . . . . . . . . 285
11.4.7 Korba (Chhattisgarh) Industrial Area . . . . . . . . . . . . 286
xvi Contents

11.4.8 Tiruppur Industrial Area, Tamil Nadu . . . . . . . . . . . 287
11.4.9 Coimbatore Industrial Area, Tamil Nadu . . . . . . . . . 288
11.4.10 Katedan Industrial Development Area in South
of Hyderabad, Andhra Pradesh . . . . . . . . . . . . . . . . 289
11.4.11 Industrial Area at Thane Region of Maharashtra . . . 289
11.4.12 Manali Industrial Area in Chennai, Tamil Nadu . . . . 292
11.4.13 Kanpur-Unnao Industrial Area of Ganga Plain,
Uttar Pradesh . . . . . . . . . . . . . . . . . . . . . . . . . . . . . 292
11.4.14 Chromium Pollution in Soils Around Vellore
Tannery Industries, Tamil Nadu . . . . . . . . . . . . . . . 293
11.4.15 Mercury Pollution in the Vicinity of Chlor-Alkali
Plant at Ganjam, Orissa . . . . . . . . . . . . . . . . . . . . . 294
11.4.16 Fluoride Contamination in Soil and Plant in the
Vicinity of Aluminium Smelter Plant at Angul,
Orissa . . . . . . . . . . . . . . . . . . . . . . . . . . . . . . . . . . 294
11.4.17 Lead Pollution in Some Industrial Cities
of Chhattisgarh . . . . . . . . . . . . . . . . . . . . . . . . . . . . 295
11.4.18 Heavy Metal Contamination in Agricultural Soils
and Plants in Peri Urban Areas of Some Cities
in Gujarat . . . . . . . . . . . . . . . . . . . . . . . . . . . . . . . 295
11.4.19 Impact of Industrial Effluent Form Visakhapatnam
City on Soil and Plants . . . . . . . . . . . . . . . . . . . . . . 296
11.4.20 Effect of Cement Kiln Dust Pollution of Heavy
Metal Accumulation in Soils . . . . . . . . . . . . . . . . . . 296
11.5 Soil Pollution in Mining Areas . . . . . . . . . . . . . . . . . . . . . . . 296
11.5.1 Coal Mines Impact in Eastern India . . . . . . . . . . . . . 297
11.5.2 Copper Mines Impact . . . . . . . . . . . . . . . . . . . . . . . 297
11.5.3 Chromite Mining Impact . . . . . . . . . . . . . . . . . . . . . 298
11.5.4 Arsenic Toxicity Near Gold Mining Area
of Karnataka . . . . . . . . . . . . . . . . . . . . . . . . . . . . . 299
11.6 Aerial Deposition of Heavy Metals on Land . . . . . . . . . . . . . . 299
11.6.1 Risk to the Peri-Urban Agriculture with
Atmospheric Deposition . . . . . . . . . . . . . . . . . . . . . 300
11.7 Pollution Around Municipal and Hazardous Waste
Dumpsites . . . . . . . . . . . . . . . . . . . . . . . . . . . . . . . . . . . . . . 301
11.8 Soil Contamination Due to Agricultural Activities . . . . . . . . . 302
11.8.1 Impact of Fertilizer Use on Heavy Metal
Build-Up in Agricultural Land . . . . . . . . . . . . . . . . 304
11.9 Soil Pollution Through Use of Geogenically Contaminated
Groundwater . . . . . . . . . . . . . . . . . . . . . . . . . . . . . . . . . . . . . 304
11.9.1 Use of Arsenic (As) Contaminated Groundwater
for Irrigation . . . . . . . . . . . . . . . . . . . . . . . . . . . . . 304
11.9.2 Use of Selenium Contaminated Ground Water
for Irrigation . . . . . . . . . . . . . . . . . . . . . . . . . . . . . 307
Contents xvii

11.10 Environmental Risks of Organic Pollutants
in Environmental Samples . . . . . . . . . . . . . . . . . . . . . . . . . . . 308
11.10.1 Indiscriminate Use of Pesticides and
Insecticides . . . . . . . . . . . . . . . . . . . . . . . . . . . . . . 308
11.10.2 Environmental Risks of Other Organic Pollutants
in Environmental Samples . . . . . . . . . . . . . . . . . . . 309
References . . . . . . . . . . . . . . . . . . . . . . . . . . . . . . . . . . . . . . . . . . . . 309
12 Remediation and Management of Polluted Sites . . . . . . . . . . . . . . . 317
12.1 Engineering Approaches . . . . . . . . . . . . . . . . . . . . . . . . . . . . 318
12.1.1 Isolation and Containment . . . . . . . . . . . . . . . . . . . 318
12.1.2 Excavation and Landfilling . . . . . . . . . . . . . . . . . . . 319
12.1.3 Vitrification . . . . . . . . . . . . . . . . . . . . . . . . . . . . . . 319
12.1.4 In-Place Stabilization/Immobilization . . . . . . . . . . . 320
12.1.5 Soil Washing . . . . . . . . . . . . . . . . . . . . . . . . . . . . . 320
12.1.6 Thermal Treatment . . . . . . . . . . . . . . . . . . . . . . . . . 322
12.1.7 Electro-Reclamation . . . . . . . . . . . . . . . . . . . . . . . . 323
12.2 Chemical Approaches . . . . . . . . . . . . . . . . . . . . . . . . . . . . . . 323
12.2.1 Red-mud and Steel Shot Waste . . . . . . . . . . . . . . . . 324
12.2.2 Clays and Aluminum Pillared Clays . . . . . . . . . . . . 324
12.2.3 Zeolites . . . . . . . . . . . . . . . . . . . . . . . . . . . . . . . . . 325
12.2.4 Coal Ashes . . . . . . . . . . . . . . . . . . . . . . . . . . . . . . 325
12.2.5 Phosphate Minerals . . . . . . . . . . . . . . . . . . . . . . . . 326
12.2.6 Alkaline Materials . . . . . . . . . . . . . . . . . . . . . . . . . 326
12.2.7 Biochar . . . . . . . . . . . . . . . . . . . . . . . . . . . . . . . . . 327
12.2.8 Organic Matter . . . . . . . . . . . . . . . . . . . . . . . . . . . . 327
12.3 Biological Approaches . . . . . . . . . . . . . . . . . . . . . . . . . . . . . 328
12.3.1 Microorganism Based Techniques . . . . . . . . . . . . . . 328
12.3.2 Phytoremediation of Soils Contaminated
with Trace Elements . . . . . . . . . . . . . . . . . . . . . . . . 329
12.4 Degradation of Organic Pollutants in Soil . . . . . . . . . . . . . . . . 332
12.4.1 Degradation of Polycyclic Aromatic Hydrocarbons
(PAHs) in Soil . . . . . . . . . . . . . . . . . . . . . . . . . . . . 339
12.4.2 Degradation of Polychlorinated Biphenyl
(PCBs) . . . . . . . . . . . . . . . . . . . . . . . . . . . . . . . . . . 341
12.4.3 Degradation of Dye Pollutants . . . . . . . . . . . . . . . . 341
12.4.4 Degradation of Antibiotics in Soil . . . . . . . . . . . . . . 342
12.5 Application of Nanotechnology for Remediation
of Polluted Soil . . . . . . . . . . . . . . . . . . . . . . . . . . . . . . . . . . . 342
12.6 Integrated management of Polluted Soil . . . . . . . . . . . . . . . . . 345
12.6.1 Agricultural Operations Influencing Remediation
of Polluted Land . . . . . . . . . . . . . . . . . . . . . . . . . . 346
12.7 Examples of Major Soil Remediation Projects . . . . . . . . . . . . 353
12.7.1 Homebush Bay, New South Wales, Australia . . . . . . 353
12.7.2 Zinc Smelter-Contaminated Sites at Palmerton,
USA . . . . . . . . . . . . . . . . . . . . . . . . . . . . . . . . . . . 353
xviii Contents

12.7.3 Love Canal at New York, USA . . . . . . . . . . . . . . . . 354
12.7.4 Phytoremediation of Metal Mined Soils . . . . . . . . . . 355
12.7.5 Phytoremediation of Soil Cd Contamination
in Japan . . . . . . . . . . . . . . . . . . . . . . . . . . . . . . . . . 355
12.7.6 Phytoremediation of Arsenic (As) Contaminated
Paddy Soils . . . . . . . . . . . . . . . . . . . . . . . . . . . . . . 356
12.7.7 Remediation of Radionuclides Contaminated
Land Near Chernobyl, Russia . . . . . . . . . . . . . . . . . 357
References . . . . . . . . . . . . . . . . . . . . . . . . . . . . . . . . . . . . . . . . . . . . 358
13 Soil Protection Policy . . . . . . . . . . . . . . . . . . . . . . . . . . . . . . . . . . . 373
13.1 Land Related National Policies Towards Food Security . . . . . 374
13.2 Focus of National Policies on Protection of Land
Resources . . . . . . . . . . . . . . . . . . . . . . . . . . . . . . . . . . . . . . . 374
13.3 Environment Protection Acts and Rules . . . . . . . . . . . . . . . . . 377
13.4 National Environmental Policy 2006 (NEP 2006) . . . . . . . . . . 378
13.5 Need for Soil Protection Policy . . . . . . . . . . . . . . . . . . . . . . . 379
13.5.1 Basic Functions of Soil . . . . . . . . . . . . . . . . . . . . . . 380
13.5.2 Threats to Soil and Issues of Soil Protection . . . . . . 381
13.5.3 Key Considerations in the Formulation of Soil
Protection Policy . . . . . . . . . . . . . . . . . . . . . . . . . . 382
Reference . . . . . . . . . . . . . . . . . . . . . . . . . . . . . . . . . . . . . . . . . . . . . 386
Contents xix

About the Authors
Dr. Jayanta Kumar Saha is head and principal scientist of the Division of
Environmental Soil Science, ICAR-Indian Institute of Soil Science, Bhopal,
India. He did his M.Sc. and Ph.D. in agricultural chemistry and soil science from
BCKV, Mohanpur (West Bengal), India. His major research areas are chemistry &
analysis of plant nutrients and pollutants in soil, soil pollution impact assessment,
food contamination, risk assessment on soil biological activities and toxicity ame-
lioration. He has worked under various capacities in national and international
forums. He has published several original research articles (52) in renowned
national and international journals, technical bulletins and books (9) and book
chapters (12) and serves as reviewer of several international journals. He is the
recipient of S. N. Ranade Memorial Junior Scientist Award for Excellence in
Micronutrient Research.
Dr. Rajendiran Selladurai is scientist in the Division of Environmental Soil
Science, ICAR-Indian Institute of Soil Science, Bhopal, India. He did his M.Sc.
and Ph.D. in agricultural chemistry and soil science from Chandra Shekhar Azad
University of Agriculture and Technology, Kanpur, and ICAR-Indian Agricultural
Research Institute, New Delhi, respectively. His specialized areas of work are
environmental impact assessment specifically soil pollution, soil quality assessment
and management and carbon sequestration. He has published many numbers of
research articles (more than 20) in renowned national and international journals,
book chapters (8) and technical bulletins. He is recipient of the Silver Medal for
University Second Topper, Junior and Senior Research Fellowships, Young Scien-
tist Awards, Best Poster and Paper Prizes, etc.
Dr. Mounisamy Vassanda Coumar is scientist in the Division of Environmental
Soil Science, ICAR-Indian Institute of Soil Science, Bhopal, India. He did his M.
Sc. and Ph.D. in agricultural chemistry and soil science from ICAR-Indian Agri-
cultural Research Institute, New Delhi. His specialized areas of work are environ-
mental impact assessment, soil quality and resilience and toxicity amelioration. He
xxi

has published several research articles (more than 20), books, book chapters and
bulletins in renowned national and international journals. He is the recipient of
many awards like Junior and Senior Research Fellowships, Best Poster and Paper
Prizes, etc.
Dr. Mohanlal Dotaniya is currently scientist at ICAR-Indian Institute of Soil
Science, Bhopal, India. He obtained his M.Sc. in soil science from GBPUA&T,
Pantnagar, and Ph.D. in soil science and agricultural chemistry from IARI, New
Delhi. His specialized areas of work are heavy metal interaction in soil and plant and
soil and water pollution. He has published more than 25 research papers/reviews in
reputed national and international journals. He is recipient of Young Scientist Awards
and the Excellence in Research Award. He serves as editorial member of national
journals as well as reviewer of many international reputed journals.
Dr. Samaresh Kundu is former head and principal scientist in the Division of
Environmental Soil Science, ICAR-Indian Institute of Soil Science, Bhopal, India. He
received his M.Sc. and Ph.D. in soil science at IARI, New Delhi, and postdocs at the
USSR and at Australia. His research areas are soil chemistry/fertility/soil microbiol-
ogy/application of nanoscience and nanotechnology in soil science and plant nutrition
research. He has published 130 research papers, 4 books, 8 research bulletins and
20 book chapters. He is a recipient of several awards/recognitions and fellowships,
namely, the Krishak Bharti Barani Kheti Award, Dr. Rajendra Prasad Puraskar Award
of ICAR, Meritorious Invention Award of NRDC, Hari Om Ashram Award of ICAR
and ICAR Award for Outstanding Team Research, as well as fellow of the Indian
Society of Soil Science and of the National Academy of Agricultural Sciences.
Dr. Ashok Kumar Patra is director of ICAR-Indian Institute of Soil Science,
Bhopal, India, since 2014. He obtained his MSc and PhD in soil science and
agricultural chemistry from ICAR-Indian Agricultural Research Institute (IARI),
New Delhi. Earlier he had served in ICAR-Indian Grassland and Fodder Research
Institute, Jhansi; ICAR-Central Institute of Fisheries Education, Mumbai; and
IARI, New Delhi. He has made outstanding contribution on various aspects of
nitrogen cycling and its ecology and biodiversity in different agroecosystems. He
has contributed more than 200 research publications. He is a recipient of British
Council TCT Award; DBT Overseas Associateship Award; FAI Dhiru Morarji
Memorial Award; Bharat Jyoti Award; Rajiv Gandhi Excellence Award; ISSS Dr.
G.S. Sekhon Memorial Lecture Award; Bioved Agri-Innovation Award; and
Hooker Award of IARI, New Delhi. He was editor of Range Management andAgroforestry and Journal of the Indian Society of Soil Science. He is associate
editor of the European Journal of Soil Science (2014–present); councillor of the
ISSS (2005–2006); vice president, Indian Society of Soil Science (2016 & 2017);
and president of Agriculture and Forestry Sciences Section of the Indian Science
Congress Association (2016–2017); He served as editorial advisor for several
international journals. He is a fellow of Indian Society of Soil Science, National
Academy of Agricultural Sciences, and Range Management Society of India.
xxii About the Authors

Chapter 1
Agriculture, Soil and Environment
Abstract Agriculture has always remained backbone of economy and socio-
political stability of low and middle income countries, and employs largest work
force in India. Maintenance of soil quality has been pointed out as one of the major
contributing factors for sustainability of agricultural production. Rising contribu-
tion of industry to India’s GDP has been speculated to cause adverse impact on the
precious land resources; though the issue has received less attention among the
policy makers. There is a complex relationship of Indian economy with industry
and agriculture, both of which competing for same natural resources with differ-
ential impact on land resources. This chapter highlights the need for reviewing
different developmental activities having direct or indirect impact on agricultural
productivity and the need for accelarating soil research to investigate upon migra-
tion of pollutants from source of generation and their impact on soil so as to devise
strategies for protection and remediation of precious non-renewable soil resources.
Keywords Agriculture • Industry • Economy • India • Land • Environmental
Impact
1.1 Agriculture in Indian Economy
The economy of India is the seventh-largest in the world by nominal GDP with an
average growth rate of approximately 7% over the last two decades. Sources
contributing to Indian economy is normally categorized in three sectors—Agricul-
ture (also includes livestock, forestry, fishing and related activities), Industry and
Services. While contribution of agriculture and allied sector to GDP of the country
was 51.81% in 1950–1951 at current prices, the same has declined gradually to
18.20% by the year 2013–2014 which is still higher than similar figures from most
of the developed and developing countries (Table 1.1). Although contribution of
agriculture & allied sector in Indian economy is smaller as compared to industry
and service sector, it engages about 50% of the total workforce which is the highest
among major developed and developing countries. This emphasizes the role of
agriculture & allied sector in maintaining socioeconomic and sociopolitical stabil-
ity of the country. Due to integrated efforts through genetic manipulation of crop
varieties as well as nutrient, water and pest management during the last 30 years,
© Springer Nature Singapore Pte Ltd. 2017
J.K. Saha et al., Soil Pollution - An Emerging Threat to Agriculture, Environmental
Chemistry for a Sustainable World 10, DOI 10.1007/978-981-10-4274-4_1
1

Table
1.1
StatusofIndia
agriculture
andeconomyam
ongthemajorcountriesin
theworldin
2014
GDP
(billion
US$)
Population
density
(perkm
2)
Averageannual
rainfall(m
m)
%contributionby
agriculture
inGDP
%irrigated
land
Cereal
yield
(kg/ha)
Employmentin
agriculture
(%oftotalem
ployment)
USAa
17348.0
35
715
1.3
5.5
7341
–
Chinaa
10354.8
145
645
9.2
10.5
5891
3
Germany
3868.3
232
700
0.7
–7318
1
UK
2988.9
267
1220
0.7
–6630
1
France
2829.2
121
867
1.7
–7074
3
Brazila
2346.1
25
1761
5.6
–4826
15
Russia
1860.6
9460
4.2
–2240
7
Canada
1785.4
4537
––
4170
2
Australiaa
1454.7
3534
2.4
0.6
1992
3
Netherlands
879.3
501
778
1.8
–8653
2
Denmark
342.4
133
703
1.4
–6211
2
Greece
235.6
85
652
3.8
16.9
4481
13
Indiaa
2048.5
436
1083
17.8
36.3
2962
50
Source:
WorldBankdata(http://data.worldbank.org)
aMegadiverse
country
2 1 Agriculture, Soil and Environment

India’s food grains production nearly doubled from 102 megatonne (Mt) in 1973 to
nearly 200 Mt in 1999. In 2013–2014, India achieved a record food grains produc-
tion of 264Mt in spite of continuous shrink in cultivated area due to its diversion for
non-agricultural use. However during the same period, Indian population increased
by about 3.4 times and is projected to be growing at 1.25% rate (Economic Survey
2014–2015 of Union Budget, Government of India). The massive increase in
population poses a challenge before the farmers and government to produce about
2.5 Mt of food grains extra each year; besides increasing supply of livestock, fish
and horticultural products. Being a source of livelihood and food for a vast majority
of low income, poor and vulnerable sections of society, performance of agriculture
assumes greater significance in view of the government’s target for ensuring food
security. In the last two 5-year plans, it has been clearly indicated that for the
economy to grow at the rate of 9%, it is important that agriculture should grow at
least by 4% per annum. In spite of the considerable emphasis given by government
in the agriculture sector, productivities of most of the crops are considerably lower
as compared to major countries of the world. This indicates that there is still a
considerable scope of increasing per-unit-area productivity in the country, provided
soil and water quality is maintained for achieving the targeted potential.
In this context, important issue that needs to be addressed is whether soil
resources of the country are adequate to meet the food demands for rapidly
increasing human population. Due to development of high yielding fertilizer
responsive cultivars and increased use of fertilizer nutrients and agrochemicals in
the post green revolution period in tandem with the enhanced availability of
irrigation water, agriculture witnessed major transformation in terms of increased
crop intensity and productivity per unit area during post 80s. However, sharply
declining partial factor productivity (yield response per unit quantity of NPK
applied) of fertilizer over the years (Fig. 1.1) has been attributed to rising concerns
for decreasing profitability and unsustainability of Indian agriculture, which is also
one of the major reasons for migration of human force from agriculture to other
sectors and causing the former a more vulnerable sector of Indian economy.
Fig. 1.1 Partial factor
productivity of fertilizer
NPK (Yadav et al. 1998)
1.1 Agriculture in Indian Economy 3

1.2 Role of Soil in Sustainability of Agriculture in India
An earlier estimate indicated that 89.5% of land area in the country was considered
threatened due to human activity (Eswaran et al. 1999). In broader context of
environment management, Wackernagel et al. (2002) defined sustainability as
living within the regenerative capacity of the biosphere. Within micro-environment
also, regenerative capacity of the soil contributes towards sustainability of agro-
ecosystem. Thus, enhancement and maintenance of soil regenerative capacity is
essential for the sustainability of agriculture and for meeting basic needs of rising
population of country. Wackernagel et al. (2002) also indicated that human
demands for goods and services have exceeded the biosphere regenerative capacity
since the 1980s and quantified this analysis by suggesting that humanity’s load
corresponded to 70% of the global biosphere in 1961 and this ballooned to 120% in
1999. Although quantitative estimate is not available, contribution of soil in
agricultural production during pre-green revolution period was assumed to be
higher than during later period when seed, water, fertilizers and agrochemicals
played larger role (Yadav et al. 1998). As majority of essential nutrient elements are
taken up by plant roots, quality of rhizospheric environment is important for higher
fertilizer nutrient use efficiency and agricultural profitability. Optimum root prolif-
eration, proper vertical air diffusion and absence of any adverse interactions among
soil constituents are some of the soil criteria which determine rhizosphere quality
for higher nutrient use efficiency. Beside several inappropriate agricultural man-
agement practices, excessive build-up of several elements/compounds has been
attributed to declining soil quality in and around the root zone. Hence, resilience
(i.e. regenerative capacity) of soil resources to the degrading forces is an emerging
area of investigation due to emergence of such forces caused by increased anthro-
pogenic activities.
1.3 Threat to Soil and Environment
India has been identified byWorld Conservation Monitoring Centre under UNEP in
1988 as one of the 17 megadiverse countries that harbor the majority of the Earth’s
species and high numbers of endemic species. Wide variation in climates, land
topography, soil types are some of the major drivers responsible for such large
biodiversity. Soil is by far the most biologically diverse part of Earth and has been
evolved in the nature to perform several ecosystem services critical for life and
performs as filter for water; acts as medium and nutrient reserve for plant growth;
provides habitat for billions of organisms contributing to biodiversity; supplies
most of the antibiotics used to fight diseases and regulates the Earth’s temperature
as well as many of the important greenhouse gases. However, with the progress of
modern civilization, humans additionally use land as a dumping site for solid
4 1 Agriculture, Soil and Environment

wastes, filter for wastewater, and foundation for our cities and towns. Except in
forest ecosystem at far away from pollution activities, positive balances of heavy
metals have been estimated during computation of trace elements budget (Kabata-
Pendias and Pendias 1992). This is due to their higher rate of inputs through
fertilizers, sludges, manures, residue recycling, atmospheric inputs etc. as com-
pared to the removal through crop uptake and infiltrating water, which indicates
gradual build-up of heavy metals in soils under agro-ecosystem.
In the quest of rapid growth in the national economy, India is increasingly
pushing forth for rapid urbanization, industrialization and transportation; all of
which are competing for agriculturally important natural resources like land and
water. From 2001 to 2010, it was observed that each state lost about 1% of its total
geographical area due to diversion of agricultural land for urban expansion and
magnitude of such diversion has been increasing steadily (Pandey and Seto 2015).
Large scale urbanization, industrialization and associated environmental alteration
and their impact on soil quality pose a threat to biodiversity as evident from the
extensive studies conducted at several developed countries. Although industry has
several adverse impacts on agriculture, their influential & dependency relationship
is many a times quite complex because of the unlimited human need. Different
agricultural and industrial requirements and activities affecting environment and
human life and their relationships are depicted below in Fig. 1.2.
Above complex relationships among different economic and social sectors and
associated activities indicate that most of the anthropogenic activities are essential
for meeting expectations and need of increasing population and socio-economic
development of the country; and any such developmental activities leaves irrepa-
rable damage to the environment including its natural resources. This is a transition
period for many developing economies like India to strike a balance between
industrial development and environmental protection so as to feed the bulging
population adequately with quality food as well as to improve the comfort and
quality of lifestyle. Although considerable researches are being conducted by
different institutes under Indian Council of Agricultural Research as well as by
State Agricultural Universities to address the issues of declining soil quality due to
faulty agricultural practices, insufficient research efforts have been put to address
the issue of soil and water pollution arising from high inputs of contaminated
fertilizers, soil amendments and agro-chemicals. Although long-term fertilizer
experiments at different agro-ecosystems across the country have conclusively
indicated that integrated and balanced fertilizer management systems in crop
production do not leave any adverse effect on soil quality (Swarup 1998), a study
conducted by ICAR-Indian Institute of Soil Science indicated groundwater con-
tamination with nitrate beyond permissible level at several places in high fertilizer
using districts of the country (Biswas et al. 2013).
In the early Anthropocene, rural population dominated but in the last
70–80 years, urban centers expanded rapidly with higher concentrations of people.
These urban centers and their encompassing ecosystems initiated a new set of
environmental problems mostly related to land surface sealing, water use, waste
management, and an insatiable appetite for food, fiber and energy needs.
1.3 Threat to Soil and Environment 5

Legends for FigureSector Requirement Activities affecting natureAgriculture From nature: Good quality soil
(Ar-1)Frequent tilling of land leading to enhanced erosion (An-1)
From nature: Good quality water (Ar-2)
Use of agrochemicals affecting food quality, soil biodiversity, water quality (An-2)
From industry: Fertilizers, pesticides, mine-products like lime, rock phosphates etc. (Ar-3)
Industry From nature: Good quality water (Ir-1)
Release of effluents in water bodies (In-1)
From nature: Fertile land, mine deposits (Ir-2)
Emission of pollutants to deposit on land; hazardous waste dumping (In-2)
From agriculture: Raw materials like fibre, sugarcane, oil, starch (Ir-3)
Human From agriculture: Adequate quantity and quality of food (Hr-1)
Sewage generation, solid wastes (Hn-1)
From industry: Housing material, clothing, comfort and lifestyle products etc. (Hr-2)
-
Fig. 1.2 Different agricultural and industrial requirements and activities affecting environment
and human life and their relationships
6 1 Agriculture, Soil and Environment

Widespread development of infrastructure such as housing, roads and railways have
contributed to environmental degradation by changing the general hydrology and
energy fluxes of the area. Apart from the threat of land consumption by
non-agricultural activities like urbanization, transport and industrialization, soil
contamination by different pollutants has become a major cause for deterioration
of its health; and in the long run the polluted soil may not be fit to grow food which
in turn may affect Indian economy directly or indirectly through reduction in raw
material supply to industries and emergence of several socio-economic problems.
Urbanization and industrialization exploited natural resources and damaged the
environment through their activities at every phases and processes of operation. It is
evident from several environmental tragedies that pollution from various sources
particularly from industries and mining had negative impact on environment which
was mostly irreversible in nature, and cause extinction of species resulting in loss of
unique genetic resources of valuable use. In agro-ecosystem, soil pollution is
caused by the presence of xenobiotic chemicals or other alteration in the natural
soil environment by industrial activity, agricultural chemicals, or improper disposal
of waste. The most common chemicals involved are petroleum hydrocarbons,
aromatic hydrocarbons, pharmaceutical products, solvents, pesticides, lead, and
other heavy metals. Impact of pollution on soil is quite alarming and introduction
of these hazardous chemicals into the soil environment results in huge disturbances
to the ecological balance of soil and injures health of living creatures on earth.
1.4 Addressing the Issue of Soil Pollution
To address issues related to land degradation, different countries have formulated
action plan and strategies to identify and combat soil pollution for the purpose of
protecting environment and organisms. United States Environmental Protection
Agency has taken up ‘Superfund’ program for cleaning up of some of the nation’smost contaminated land and responding to anticipated environmental emergencies,
oil spills and natural disasters. The European Commission has established a frame-
work based on common principles and objectives to address the different facets of
soil degradation, where member countries identified the issues and location of
problems and devised their own strategies to address those problems. In India,
attention has been given to protect environment from different types of pollution in
the country through environmental laws and act like ‘Environment Protection Act,
1986’, as well as through awareness program and education. However, almost all
the emphasis has been given to air and water pollution, probably due to higher
mobility of toxicants towards organisms through these matrices. Unlike many
developed countries, the information and awareness on pollution of land resource
and it impact is lacking in the country. In most of the Environmental Impact
Assessment (EIA) of different industrial/mining/infrastructural projects, impact
on land resources and agroecosystems are largely ignored.
1.4 Addressing the Issue of Soil Pollution 7

In India, information on extent of soil pollution, its impacts on other functional
area, plant and human health is not complete. About 60% of the geographical area
of the country is occupied by agricultural land, most of which is facing one or more
kind degradation stresses. The data given by different agencies on soil degradation
mainly focus on physical aspects of soil deterioration like erosion, waterlogging
etc. and in case of chemical degradation not much attention was given except
on soil salinity problems (Table 1.2).
In many developed countries like in North America and Western Europe, extent
of contaminated land been estimated with many of these having a legal framework
to identify and deal with the environmental problems. However, information on
magnitude of different developmental activities like mining, industries, urbaniza-
tion, transportation and others, and their impact on land/soil quality are meager in
India. Instances of soil pollution or chemical degradation are cited to be very
sporadic and region specific; and hence assessment of soil pollution, locating
their sources and impact across the country is specifically required for devising
suitable action plan for its protection and remediation. In India, each area is unique
in respect of nature and extent of anthropogenic interventions, climate, land mor-
phology, geology, hydrology and biodiversity. For precise EIA focusing land
degradation or soil pollution, one needs to have comprehensive knowledge on the
soil resources and its interaction with other environmental components as well as
pollutants so that protective/remedial soil management can be planned effectively.
To keep in view of the above, an attempt has been made to review the status of soil
Table 1.2 Degraded land areas of India
Type of degradation
Area under arable
land (million ha)
Area under open forest with
<40% canopy (million ha)
1. Water erosion (>10 t/ha) 73.27 9.30
2. Wind erosion (Aeolian) 12.40 –
3. Physical degradation
(a) Mining and industrial
wastes
0.19 –
(b) Permanent surface
inundation
0.88 –
4. Chemical degradation –
(a) Exclusively salt-
affected soils
5.44 –
(b) Salt-affected and water
eroded soils
1.20 0.10
(c) Exclusively acidic soils
(pH <5.5)
5.09 –
(d) Acidic (pH <5.5) and
water eroded soils
5.72 7.13
Total degraded area 104.19 16.53
NAAS (2010)
8 1 Agriculture, Soil and Environment

pollution in India under the background of ongoing anthropogenic activities with
appropriate interpretation using scientific knowledges generated on the subject and
to suggest future course of action.
References
Biswas AK, Srivastava S, Subba Rao A (2013) Delineation and mapping of nitrate contamination
of ground water in some intensively cultivated districts. In: Kundu S, Manna MC et al (eds)
IISS contribution in frontier areas of soil research. Indian Institute of Soil Science, Bhopal, pp
337–369
Eswaran H, Beinroth F, Reich P (1999) Global land resources and population supporting capacity.
Am J Alter Agric 14:129–136
Kabata-Pendias A, Pendias H (1992) Trace elements in soils and plants. CRC Press, Baton Raton
NAAS (2010) Degraded and wastelands of India: Status and spatial distribution. National Acad-
emy of Agricultural Sciences. ICAR, New Delhi
Pandey B, Seto KC (2015) Urbanization and agricultural land loss in India: comparing satellite
estimates with census data. J Environ Manag 148:53–66
Swarup A (1998) Emerging soil fertility management issues for sustainable crop productivity in
irrigated system. In: Swarup A, Reddy DD, Prasad RN (eds) Proceeding of national workshop
on long-term fertility management through integrated nutrient supply (2–4 April, 1998). Indian
Institute of Soil Science, Bhopal, pp 54–58
Wackernagel M, Schulz B, Deumling D et al (2002) Tracking the ecological overshoot of the
human economy. PNAS, Proc Nat Acad Sci 99:9266–9271
Yadav RL, Prasad K, Gangwar KS (1998) Prospects of Indian agriculture with special reference to
nutrient management under irrigation system. In: Swarup A, Reddy DD, Prasad RN (eds)
Proceedings of a national workshop on long-term soil fertility management through integrated
plant nutrient supply. Indian Institute of Soil Science, Bhopal, pp 16–33
References 9

Chapter 2
Soil and Its Role in the Ecosystem
Abstract Soil is highly heterogeneous body in the terrestrial ecosystem that has
evolved through thousands of years of natural processes and has remained habitat
for enormous biodiversity. Due variability in seasonal temperature, rainfall, parent
materials and vegetation, different types of soils have been found in India; and each
of these soils have distinct mineralogical compositions, physical and chemical
properties. Such heterogeneity has resulted wide variations in the response of
soils to polluting activities which causes differential location specific impacts. To
understand the interaction of pollutants with soil constituents and their impact on
agroecosystems, basic knowledge on various aspects of soil resources and its
functions are essential. This chapter describes in brief, the major soil types of
India and their properties, role of soil constituents on its quality, different soil
forming processes, inhabiting organisms and their role in different soil nutrient
cycling processes affecting crop productivity.
Keywords Soil type • Ecosystem • Organisms • Pedogenic processes •
Agroecological zone • India
Soil is a highly heterogeneous body in respect of physical, chemical and biological
characteristics as well as constituents and such heterogeneity arises both at micro-
and macro-scale in all three dimensions. Pollutants interact quite differently with
each of its constituents and hence, impact of anthropogenic activities on ecosystem
varies widely. This necessitates a comprehensive understanding on soil and its role
in the ecosystem by the personnel’s involved in environmental impact assessment.
This chapter briefly describes the important aspects of soil science mainly in the
perspective of crop productivity.
Soil is a resource on which every person’s life, well-being and fulfillment
depend. Poor management reveals itself in terms of social and economic costs
along with political repercussions. No sustainable agriculture and sustainable
development is possible without this awareness. Present societies show little inter-
est in this regard, and soil is often considered as no more than a support for human
activities. We abuse the land because we regard it as a commodity for use by us but
when we see it as a part of community to which we belong, we start looking at it
with respect. If soil is viewed as precious resource, its use should abide by certain
rules and a number of conditions so that different ecosystem functions are protected
© Springer Nature Singapore Pte Ltd. 2017
J.K. Saha et al., Soil Pollution - An Emerging Threat to Agriculture, Environmental
Chemistry for a Sustainable World 10, DOI 10.1007/978-981-10-4274-4_2
11

and sustained. In sum, soil is the source of life for humankind. Through the
intermediary of plants, animals, water and minerals, the soil shelters and nourishes
the people and their well being and health are dependent upon it. Soil is thus
essential for humanity, whether its uses are of an agricultural, forestry, industrial,
urban or ecological nature. No society can develop without using soils. Having said
this, all is a question of balance between functional and renovation capacities of soil
and anthropological pressure; the future is finely poised between the realization of
soil potential and the pressure of human activities. Indeed, the development of
human activity is linked with the functioning and properties of soils throughout the
world. Anthropogenic changes in the pedosphere influence the other spheres with
which it is interpenetrated viz.; lithosphere, hydrosphere, atmosphere and bio-
sphere. The soil cover is thus in a pivotal position in relation to whatever local,
regional or global changes the earth is undergoing. And here lies the importance of
soil, its quality and the immediate environment as a core element in the issues
related to sustainability and society.
The need to protect the environment will necessarily involve the knowledge
and the use of natural soil functions to ensure higher quality soils, better produce
quality, water and air quality and quality of life etc., through proper management
and rational use of soils. Since soil itself is a component of the ecosystem
comprising of soil, plant, animal, human and climate continuum, an impact on
any constituents is likely to have some effects on the other parts of system. The
environment of each of these components is intimately linked to one another so
much so that a change in one environment might adversely or benignly affect
other constituents. It is similar to throwing refuse into neighbor’s premises to keep
one’s own environment clean leading to ultimately to the peril of all. Goswami
and Rattan (1992) defined soil health, “as being a state of dynamic equilibrium
between organisms and its environment in which all the metabolic activities of the
former proceed optimally without any hindrance, stress or impedance from the
latter”.
The importance of soils to human well-being and cultural enrichment is glorified
in the ancient Indian scriptures dating back to the dawn of civilization. The “Prithvi
Sutra” in Artharva Veda narrates hymn as a prayer of goddess Prithvi, “O mother,with yours oceans, rivers, and other bodies of water, you give us land to growgrains, on which our survival depends”, and “May you, our motherland, on whomare born five races of mankind, be nourished by the cloud, loved by the rain”(Dwivedi and Tiwari 1987). Mahatma Gandhi reiterated this concept even more
directly by stating “Earth has plenty for every man’s needs but not for every man’sgreed” (Gandhi and Gandhi 1994).
12 2 Soil and Its Role in the Ecosystem

2.1 Physical and Chemical Characteristics of Soil
Soil and land, though related, are two different entities. Land is two dimensional
entity representing geographical area and landscape, while soil is a three-
dimensional body with length breadth and depth and is hidden below the land
surface. It is largely hidden from the outside world until it is lost and goes out of the
site. It is recognized by digging a pit and exposing its profile. ‘Soil’ a dynamic phase
of the earth’s outer crust serves as a delicate interface between atmosphere,
hydrosphere, lithosphere, and biosphere where various biogeochemical processes
occur that aid in its development to support key ecosystem functions such as plant
productivity, biotic activity and water quality. The soil fractionates the hydrologic
cycle in the terrestrial area into runoff, percolation and evapotranspirational com-
ponents. It is a source as well as a sink to absorb, desorb, fix or release mineral
elements and gases and grow plants and decompose crop residues incorporated into
it. It is a living factor where millions of tiny organisms are ceaselessly working day
and night, transforming the organic matter and participating in carbon and nitrogen
cycles. In our habitat planet of Earth, life could not exist without soil and no soil
without life. It is no wonder that the astronauts landing on the moon searched for
evidence of soil, life and water there and brought with them soil samples to make
detailed studies for an evidence of life. Soil is a limited and non-renewable resource
but a pivot for agriculture, food security, nutritional security, environmental safety
and quality of life. Since soil is pivot of natural resources, its management has to be
fully integrated with eco-friendly techniques.
2.1.1 Physical Properties of Soils
The physical properties of a soil play an important role in determining its suitability
for crop production. The characteristics like the supporting power and bearing
capacity, tillage practices, moisture storage capacity and its availability to plants,
drainage, and ease of penetration by roots, aeration, retention of plant nutrients are
all intimately connected with the physical properties of the soil. Soil as medium of
plant growth should also be physically fertile. The soil which supports plants is a
variable mixture of solids (mineral and organic matter), liquid (water) and gases
(air); and therefore is called three phase system. In a representative silt loam soil,
about 50% of the total volume is occupied by solids. At the optimum moisture for
plant growth, 25% of the volume occupied by water and 25% by air. Soil particle of
larger in size like sand are generally visible through unaided eye (naked eye),
whereas particles of colloidal in nature like clay can be seen only through electron
microscope. The liquid phase, consisting of soil water also contains dissolved salts
and thus it is called soil solution. The gaseous phase consists of soil air of varying
composition of oxygen and carbondioxide different from that of atmospheric air.
The important soil physical attributes are (a) bulk density, (b) texture, (c) structure,
2.1 Physical and Chemical Characteristics of Soil 13

(d) water holding and transmission characteristics, (e) soil color, (f) soil aeration
and (g) soil temperature, which are briefly described below:
(a) Soil Bulk Density The bulk density of soil is defined as its oven dry weight per
unit volume which is normally expressed as g cm�3 or Mg m�3. Typically, a silty
loam soil has bulk density around 1.33 g cm�3. Soil organic matter, texture, density
of mineral matter and compaction influence bulk density of soil. Soils rich in
organic matter content have lower bulk density and with increase in soil profile
depth, the bulk density increases gradually. Compact soils like clayey soil have
higher bulk density than the light textured of sandy soil. Bulk density of a soil
influences several important soil properties related to rhizosphere quality and
consequently, to plant growth. Its value of more than 1.6 g cm�3 may restrict
proper root growth in the soil.
(b) Soil Texture Quantitatively, soil texture refers to the relative proportion/distri-
bution of different particles size fractions, which are specifically referred to as
coarse sand (2.0–0.2 mm), fine sand (0.2–0.02 mm), silt (0.02–0.002 mm) and clay
(less than 0.002 mm). The soil texture is considered a permanent natural attribute of
the soil and therefore most often is used to specify its physical composition, having
a bearing on soil behavior. Sand particles can hold little water, and thus soils
dominated by sand are prone to drought. Clay is the fraction having negative charge
and greater surface area per unit mass and influence the soil behavior most. The
water gets absorbed by clay particles and hydrated resulted in swelling and shrink-
age of soil upon wetting and drying of soil. Normal agricultural practices do not
generally change soil texture. However, frequent inundation of land by flood water
and application of large quantities of inorganic amendment materials (e.g. coal ash)
may alter soil texture to a large extent.
(c) Soil Structure Physically a soil is a blend of inorganic particles, decaying
organic materials, air and water. The inorganic particles of various sizes (sand,
silt or clay fraction) generally cluster together to form complex and irregular
patterns of secondary particles which are called aggregates or peds. The term
‘soil structure’ refers to the arrangements of these primary and secondary particles
into a certain structural pattern. Soil structure greatly influences many soil physical
processes such as water retention and movement, porosity and aeration, transport of
heat, etc. The various soil management practices such as tillage, cultivation,
application of fertilizer and manures, amendments (liming, gypsum) and irrigation,
bring about changes in soil structure that influence other soil properties, thereby
affecting root growth, water & nutrient uptake, crop growth and yield. Organic
matter plays important role in the formation of stable soil aggregates of granular
and crumb type soil structure. The organic root exudates and microbial decompo-
sition products of organic materials play very important role in stable aggregates
formation.
(d) Water Holding and Transmission Characteristics In soil, water gets absorbed
on the surface of the soil particles as well as in the spaces between adjoining
particles (intervening voids) as pore water. Distribution of particle size fractions
14 2 Soil and Its Role in the Ecosystem

(texture) and their aggregation (structure) determine air-filled and water filled pore
spaces in soil which ultimately regulate the exchange of gases between atmosphere
and lithosphere. The major soil physical properties like soil consistency, compac-
tion, swelling and shrinkage properties determine soil water retention and its trans-
mission. The water is held in three forms depending on the tenacity with which it is
absorbed: hygroscopic water, capillary water and gravitational or free water. The
first two molecular layers of water on soil particles which have high suction are
termed as ‘Hygroscopic water’. Water held in capillary pores with suction ranging
from 0.1 to 31 bar is known as ‘Capillary water’. With further increase in water
content, when the macropores also get filled with water, it is more and more loosely
held. Under the action of gravitational force, this loosely held water is liable to
move downwards and hence it is known as ‘Gravity water or free water’. Thedrainage or deep percolation loss of water following irrigation results from the
downward movement of the gravity water.
(e) Soil Color Soil color is often a ready clue to its condition and some important
properties. For example, dark-colored surface soils absorb more solar radiation than
light colored soils and so get warm up faster. Color is often a diagnostic feature in
major soil classification and interpretation. Soil color is included in the description
of a soil profile. It is also indicative of other factors such as presence of excessive
salts (white), erosion etc. For determination of soil color, standard system using
‘Munsell’ colour chart is used.
(f) Soil Aeration A typical mineral soil, on volume basis, contains half solid and
half pore space. The solid part is consisted of mineral material and organic matter,
space part is filled with water and air interchangeably. Soil aeration refers to the
exchange of oxygen and carbon dioxide between the soil pore spaces and atmo-
spheric air. The process controls the deficiency of oxygen consumed during respi-
ration of plant roots and soil microorganisms and prevents toxicity of carbon
dioxide evolved during respiration in the soil air. The term ‘air capacity’ is usedto describe aeration status of soil. The air capacity of soil refers to the volume of
pore space filled with air when the soil is under a tension of 50 millibar. This value
is also called as ‘non-capillary porosity’. It corresponds to a pore size of 0.06 mm or
larger in diameter. The composition of soil is more or less similar to that of the
atmospheric air except the content of carbon dioxide. In the upper layer of a soil
having stable structure and ample macropores, the composition of air is taken as:
nitrogen and inert gases ¼ 79.1%, oxygen ¼ 20.6% and carbon dioxide ¼ 0.25%.
2.1.2 Soil Chemical Property
Soil chemical environment is regulated by number of soil chemical properties, such
as, soil pH, electrical conductivity, clay mineralogy and cation exchange capacity,
soil organic matters content, total and available plant nutrient status which are
briefly described below.
2.1 Physical and Chemical Characteristics of Soil 15

(a) Soil pH The concentration of hydrogen and hydroxyl ions of a solution
determines acidity or alkalinity. Soil reaction is denoted by pH of a soil water
suspension and is an important indicator of soil health. Soil pH is the negative
logarithm of the activity of H+ in solution. Soil having pH value of <5.5 is
considered acid soil. Soil pH is determined by active and potential acidity. While
active acidity refers to H+ ion concentration in soil solution, potential acidity
indicates H+ ions adsorbed on soil colloids. The former can easily be determined
by measuring soil solution pH; whereas, the determination of the potential acidity
additionally requires exchange of H+ by other cation species prior to the pH
measurement. The soil pH values may vary widely from pH 3 (e.g. in acid sulphate
and podzolic soils) to 10 (e.g. in sodic soil). The presence of weak acids (HCO3�)
and strong bases (Na+ or K+) in soil solution of alkali soils may results in high soil
pH as high as pH 10.5. The soil solution H+ ion concentration has a marked
influence on nutrient release dynamics through its effect on weathering and miner-
alization process. It also has significant influence on soil microbial diversity
composition and plant growth. Most of the crop plants grow well under near neutral
soil pH value of 6.0–7.2. At low pH, Fe, Mn, and Al are highly soluble and attain
toxic levels whereas at high pH, these ions become deficient. Nitrification is slow
below pH 5.5. Under acid conditions, the pH-dependents NH4+ fixation between
lattices of expanding layer silicates decreases with decreasing pH. The availability
of phosphorus, primarily H2PO4� and HPO4
2� ions, is highly pH dependent. Its
availability in many soils is maximum when the pH is neutral or slightly acidic and
it declines as the soil becomes strongly acidic or strongly alkaline. In general, the
availability of micronutrients present in cationic forms such as Fe, Mn, Cu and Zn,
increases with increase in soil acidity, whereas the availability of those present as
anions, namely molybdenum and boron decreases. Therefore, the leguminous plant
growth and nodulation are mostly affected by Mo deficiency rather than Al toxicity
in acid soil. It has been estimated that 40, 48 and 12% of acid soil in India falls
under mildly acidic (pH 5.5–6.5), moderately acidic (pH 5.0–5.5) and strongly
acidic (pH <5.0) soil, respectively. Neutralization of soil acidity is normally
accomplished through application of agricultural lime materials as well as compost
material. Carbonates, oxides and hydroxides of calcium and magnesium are
referred to as agricultural lime.
(b) Electrical Conductivity It is the measure of soluble salt content in the soil. Salt
affected soils are characterized by an excess of neutral soluble salts mostly of
chlorides and sulphates of calcium, magnesium and sodium. Based on the nature of
soluble salts, such soils termed as ‘halomorphic soils’ are generally classified into
saline and alkali soils. Saline soils are mainly distributed in arid and semi arid
regions characterized by the presence of white patches of salt crust on the surface.
Growth of most crop plants is adversely affected by the presence of excessive
soluble salts. Due to high evaporation and upward capillary movement of soil
moisture in arid and semi-arid region, salts get accumulated on the surface soil.
In dry period saline soils often show a white efflorescence of salts on their surface.
For this reason they are also sometimes known as ‘white alkali soils’. When
16 2 Soil and Its Role in the Ecosystem

appreciable quantities of Na+ are present on exchange sites, Na+ can come into
solution and hence Na2CO3 and NaHCO3 can be formed. These high soil pH
conditions and presence of relatively lower salt concentrations lead to the
deflocculation of clay and organic matter particles. The soil structure thus becomes
water unstable. The soils are black due to the dispersed humic particles and are
sometimes known as ‘black alkali soils’. The electrical conductivity is expressed asmillimhos/cm at 25 �C or deci-Siemens/metre (dSm�1) at 25 �C. As per the US
Salinity Laboratory Staff (1954), saline soils have pH of saturation paste less
than 8.5, Exchangeable Sodium Percentage (ESP) less than 15 and EC more than
4 dSm�1 at 25 �C. The alkali soils are characterized by pH more than 8.5, ESP more
than 15 and EC lower than 4 dSm�1 at 25 �C. Management of saline soil is basically
done by the removal of salts from saline soils through the process of leaching with
water and drainage. Reclamation of alkali soils requires neutralization of alkalinity
and replacement of most of the sodium ions from the soil exchange complex by the
more favorable calcium ions, through the application of gypsum (calcium sulphate).
(c) Clay Mineralogy and Cation Exchange Capacity Nutrient status and behavior
in soils depend on a large number of soil properties, of which types of clay mineral
and total quantity of clay are most important. Soil clays consist of two main kinds of
particles: (i) silicate lattice minerals (kaolinite group, montmorillonite group and
illite group) and (ii) hydrous oxides of Fe and Al. The kaolinitic group of clay
minerals is built up of flat units each consists of one silica sheet and one alumina
sheet tightly bound to each other by equally shared oxygen and atoms. This kind of
structure is characteristic of a 1:1 clay mineral. The montmorillonite group of
minerals consists of two silica sheets with one alumina sheet held between them
by mutually shared O-atoms. This is typical of a 2:1 clay mineral structure. In this
case the units are rather weakly held to each other and easily expandable. Water and
cations can thus readily be absorbed between them in these ‘inner surface’. Theparticles are much smaller than the kaolin clays. The illite group resembles mont-
morillonite. It is a 2:1 clay mineral but the units are bound to each other by K+ ions.
They are therefore less expandable and their properties lie between montmorillonite
and kaolinite. The hydrous oxides as their name suggests are oxides associated with
water molecules. The oxides are mainly those of Fe and Al with general formulae
Fe2O3.H2O and Al2O3.H2O. Hydrous oxides have much less marked colloidal
properties than lattice clays. They do, however, carry negative charges. The soils
in which they particularly predominate are present in the tropics and semi-tropics.
The presence of hydrous oxides in these soils gives rise to a high absorption
capacity. The cation exchange capacity of soil is determined by the nature of clay
minerals present in soil (kaolinite group: 3–15 cmol(þ) kg�1, montmorillonite
group: 80–200 cmol(þ) kg�1 and illite group: 20–50 cmol(þ) kg�1). Soils high
in clay content have tendency to get dispersed with consequent increase in total
surface area and micropore spaces. As a result, soil retains more water (in the
capillary pores) as the clay content increases. Thus, soils rich in clay content have
high cation exchange capacity and water holding capacity than soils low in clay.
2.1 Physical and Chemical Characteristics of Soil 17

(d) Soil Organic Matter Organic materials are intrinsic and essential components
of all soils. It is the key component in soil that supports all life and makes soil a
dynamic living system. The immense importance of soil organic matter (SOM)
accrues from the facts that it (i) provides food source for soil microorganisms and
soil fauna, (ii) act as store house for nitrogen, phosphorus and sulphur supply to
higher plants (iii) improves various chemical and physical properties of the soil.
SOM contains group of carbon containing compounds originated from living
beings, of which 10–15% is non humus substance and rest 85–90% is humic
substances. Soil organic matter also plays immense role in reducing toxicity of
various organic and inorganic pollutants that enters the agricultural land through
anthropogenic activities.
(e) Total and Available Plant Nutrient Status Soil fertility refers to the intrinsic
capacity of a soil to supply all essential plant nutrients in adequate and suitable
proportion for their optimal growth. Plant nutrient exist in soil both in organic and
inorganic forms which constitute reserve pool for the use by microorganism and
plant growth. Plant nutrients are exclusively absorbed by roots in their inorganic
forms. On the contrary and unlike green plant, other living beings like man, animal
and microorganisms need additional food stuff directly from organic source. An
essential plant nutrient may be defined as a chemical element which is absolutely
necessary for supporting normal growth, metabolism and completion of life cycle
of plants. Additionally, specific function(s) of these essential elements in plants
cannot be substituted by other elements. In other words, the deficiency symptom
caused by any of the essential elements cannot be corrected by supplying other
element. Most of the essential elements take part in plant metabolism and forms
integral part of structural components of cell, enzymes and energy related com-
pounds. Among the essential nutrients, C, H, O are derived from air and water and
therefore, these are termed as non-mineral essential nutrients. All other nutrient
elements are derived from soil and therefore they are called mineral essential
elements. These mineral essential elements are classified as primary elements
(N, P, K), secondary elements (Ca, Mg, S) and trace elements or micronutrients
(Zn, Cu, Fe, Mn, Cl, B, Mo, Ni) in accordance with their amount of uptake. The
essential micronutrients and other beneficial elements required for growth and
metabolism of plants, animals and human beings are given in Table 2.1.
Management of the fertility of Indian soil demands it’s built up and sustenance ata high level to produce adequate food for the ever increasing population. Fertilizers,
therefore, constitute one of the critical farm inputs and play a significant role for
achieving high crop productivity. Soil test based fertilizer recommendations ensure
Table 2.1 Essential trace element minerals for plants, animals and human beings
Species Micronutrients Beneficial elements
Plants Zn, Cu, Fe, Mn, Cl, B, Mo, Ni Si, Na, V, Sr, Co
Human beings Fe, Mn, Zn, Cu, Se, Cr, Mo, I, F As, B, Br, Cd, Pb, Ni, Li, Si, Zn V Co
Animals Fe, Zn, Cu, Mn, Se, I, Mo, Co Cr, Si, Pb, Ni, V, As, B, Sn
18 2 Soil and Its Role in the Ecosystem

balanced use of fertilizers and increase yields and profits. Balanced fertilizers
encompass, besides major nutrients, secondary and micronutrients whose deficien-
cies appear in different soils in various agro-eco-regions due to intensive cultiva-
tion. Soil testing laboratories in India generally follow identical critical limits for
sufficiency or deficiency of plants nutrients, irrespective of the mineralogy or
texture of soil or even crop species. However, the ideal soil testing should not
only take into account of amount of available nutrient reservoirs, but also the
environmental conditions of the rhizosphere which influence loss or transformation
of nutrients to less available forms. Integrated plant nutrient supply management
envisages the use of inorganic chemical fertilizers in combination with organic
manures; legumes based cropping system, biofertilizers and other locally available
nutrient sources for sustaining soil fertility and crop productivity. The combined
applications of organic manure and inorganic chemical fertilizers generally pro-
duces higher crop yields than when each is applied alone. This increase in crop
productivity may be due to the combined effect of nutrient supply, synergism and
improvement in soil physical and biological properties. Farmyard manure (FYM)
constitutes an important component for integrated nutrient management for
maintaining soil fertility and yield stability.
2.2 Soil Organic Matter and Its Role in Soil Productivity
Organic materials are intrinsic and essential components of all soils. This key
component in soil supports all terrestrial life forms directly or indirectly and
makes soil a dynamic living system. The immense importance of soil organic
matter (SOM) can be perceived from the following roles played in the ecosystem:
(a) It provides food for soil micro- flora and macro- fauna and helps in maintaining
the biological activity within soil.
(b) It is the storehouse of nutrients for their supply to higher plant. Plant available
inorganic nitrogen is normally quite low in soil and most of the plant require-
ment is met from its organic source through mineralization process (conversion
of organic to inorganic nutrient form). Further, major fraction of fertilizer
derived inorganic nutrients is immobilized by soil organic matter, as a result
of which their loss from the system is minimized.
(c) It improves cation exchange capacity, soil buffering capacity and enhances
capability to trap and exchange nutrient cations like potassium, calcium, mag-
nesium and micronutrients like zinc, manganese, copper, iron etc.
(d) SOM helps in releasing nutrients slowly from minerals through weathering
process in synchrony with their uptake rate by plant.
(e) Plant growth and development are enhanced through physiological and nutri-
tional effects of some organic substances that are directly utilized by plants.
2.2 Soil Organic Matter and Its Role in Soil Productivity 19

(f) Another important influence of SOM is improvement in soil physical properties
like soil structure, porosity, water holding capacity, infiltration, soil tempera-
ture, etc., which facilitate optimum root growth and nutrient uptake.
(g) Soil organic matter also influences a variety of pedogenic processes like
weathering of minerals, and their transportation leading to the soil formation.
2.2.1 Nature and Amount of Soil Organic Matter
The term SOM usually refers to those organic materials which are a part of the soil
matrix. This includes: (a) the litter layer which consists of dead plant residues at the
uppermost layer of the soil, (b) partly decomposed plants residues formed by the
action of soil microorganisms and fauna on the litter, (c) biological organic
molecules which are components of plants or animal tissues, e.g. proteins, carbo-
hydrates, lignins, lipids, peptides, amino acids, organic acids, alcohols, etc., which
are collectively called as non-humic substances, and (d) humic substances which
are the stable end products of decomposition of plant and animal residues.
Depending on the climatic condition, soil organic matter content in soil varies
widely. In general, cool and temperate regions contain relatively more organic
matter (5–10%) in the surface soil due to lower mineralization, whereas, cultivated
surface soils in the tropical region contains only less than 1% SOM owing to high
rate of decomposition under prevalent conditions of high temperature and moisture.
Climate (temperature and rainfall) plays one of the most important roles in
determining the extent of SOM accumulation. It has been observed that SOM
contents decrease to 2–3 times for each 10 �C increase in mean temperature.
Apparently, the decomposition loss of SOM (to CO2) increases more rapidly with
temperature than the rate of its formation. Therefore, in warmer climates, SOM
levels are generally lower than in cooler regions. In general, the activity of soil
microorganisms and decomposition of SOM increases with rise in temperature
from 0 to 35 �C; but above this temperature, the decomposition gets suppressed.
The decomposition of OM is also influenced by rainfall and therefore, by soil
moisture levels. Intensity of decomposition increases with moisture and reaches
maximum at 60–80% of the maximum water holding capacity.
The second important factor influencing OM levels in soil is the nature and
amount of vegetation. Vegetation provides the basic input in the form of leaf litter,
branches, roots. The effect of vegetation on OM accumulation is best seen in the
tropics. In the tropical evergreen forests, where litter input is very high, the soils are
very rich in OM; soils under grass cover in the same region have much lower OM
levels since litter input to the soil is relatively less; cultivated areas with limited
vegetative cover have very low levels of OM.
Other factors, which influence OM accumulation, are soil minerals and soil
texture. OM is easily lost from light textured sandy soils whereas loamy soils
tend to accumulate OM. This can best be seen along river banks in areas otherwise
covered by sandy soils.
20 2 Soil and Its Role in the Ecosystem

Topography also influences the OM levels through soil drainage and moisture
levels. Soils in depressions and valleys may accumulate more OM than those at the
slopes. If all other factors remain constant, OM accumulation reach equilibrium
levels with time. Further increase will not occur after a certain period of time, which
is normally a few years. However, the stable fraction (humus) can persist in the soil
for as long as 250–1900 years. This stable fraction takes much longer to accumulate
and has an average ‘turn-over period’ of about 150 years.
2.2.2 Humic Substances
Soil organic matter contains both humic and non humic substances which play an
important role in nutrient release dynamics influencing plant growth. Humic frac-
tion is relatively stable in soil than non-humic substances and constitutes largest
component of SOM (85–90%). This fraction plays a major role in maintaining soil
fertility and crop productivity. In general, humic substances are formed by the
decomposition of dead plant debris and animal residues by soil microorganisms and
fauna. They are colloid-sized, polymeric substance having dark colors (black and
brown-black to yellow). The three soil fractions (on the basis of solubility in acid
and alkali) of humic substances are (i) fulvic acid (FA) (ii) humic acid (HA), and
(iii) humin. Fulvic acid is the most mobile fraction being soluble in water, acids and
alkalis and is yellow to brownish yellow in color. Humic acid is soluble in alkali and
insoluble in water and acids. It has a dark brown to black color. The most insoluble
fraction of humus is humin, which is insoluble both in acid and in alkali. This
fraction is strongly bound to the soil mineral matrix and is difficult to extract.
2.3 Organisms in Soil and Their Activities
Land is a dynamic living ecosystem that forms a habitat for millions of living
organisms. Organisms present in soil are classified into two main groups: (i) soil
flora, belonging to plant kingdom, and (ii) soil fauna, the animal forms. These are
further divided into two sub-groups: macroorganisms, i.e. those organisms which
are big enough to be seen by an unaided eye and microorganisms which are so small
that these can be seen only after magnification using a microscope.
Soil organisms can also be classified on the basis of requirements of molecular
oxygen, temperature and mode of nutrition, etc. Organisms that need O2 for
respiration and cannot survive without it are called ‘obligate aerobes’ and those
which are aerobic but also adapt to grow under anaerobic environment using
oxidized substances like NO3, SO4, CO2 etc. as terminal electron acceptor in
place of O2 during respiration are classified as ‘facultative anaerobes’. An example
of such organisms of great agricultural substance in soil is the denitrifying bacteria.
Certain group of microorganisms like Clostridia, Actinomyces, Bacteroides,
2.3 Organisms in Soil and Their Activities 21

Fusobacterium and Methanobacteria thrives well in the absence of oxygen are
termed as ‘obligate anaerobes’.The organisms have specific temperature requirements for their growth. Any
change from the optimum temperature will not kill the organisms but will reduce
their growth rate. Psychrophiles have optimum temperature for growth below
10 �C, while the group of organisms with optimum temperature between
20–35 �C is termed as mesophiles. This group is highly dominant and numerous
in most of cultivated soils of India. A temperature higher than 45 �C favours
development of thermophiles, commonly encountered in the compost pits.
Based on the mode of nutrition, soil organisms are classified into two groups-
‘heterotrophs and autotrophs’. ‘Heterotrophs’ derive energy by oxidation of
organic compounds while autotrophs derive their carbon from CO2 for cell synthe-
sis. The group of autotrophs is further sub divided into chemoautotrophs which get
energy from the oxidation of simple reduced inorganic compounds like iron,sulphur
etc. and photoautotrophs, which derive energy from sunlight by the process of
photosynthesis.
2.3.1 Macroorganisms in Soil
The macroorganisms in soils include Acari, Collembola, Enchytracidae, Isoptera,
Isopoda, Amphipoda, Diplopoda, Earthworm, Coleoptera, Mollusca, etc. Popu-
lation or biomass estimation of these soil animals is highly difficult because they
are not uniformly distributed in the soil and are highly mobile. Even though fewer
in numbers than microorganisms, these organisms are very useful in soils as
(i) they help in the decomposition of organic residues by mixing, churning or
fragmentation as they eat on plant material, (ii) they form burrows and tunnels
which increase soil aeration, drainage and turn in large amount of surface soil,
(iii) enrich soil with organic material (as their food, ingested soil in the guts of
earthworms gets converted into worm casts called ‘mull humus’), and (iv) Some
of these organisms like mites, termites and acrinemites feed on soil microorgan-
isms including plant pathogens.
Roles of Earthworms The total biomass of earthworms in soil ranges from 110 to
1100 kg ha�1 (furrow slice). Their population decreases on cultivation due to
reduction in organic matter, with tillage which causes mechanical injuries and
upon pesticide application which is toxic in nature. Earthworm cast is a rich source
of nutrients, particularly N, P, Ca etc., and contains more bacteria and organic
matter. Earthworms do intimate mixing of organic matter with mineral matter
which increases the stabilization of clay bound carbon, depending on soil type.
Earthworm-worked soils generally have high porosity, increased water holding
capacity, higher water infiltration rate, more water stable aggregates and increased
availability of plant nutrients. These organisms may also affect microbial popula-
tion as they ingest microbes along with soil and organic matter.
22 2 Soil and Its Role in the Ecosystem

Roles of Termites Termites also influence soil properties and processes through
four types of activities: (i) physical modification of soil profiles by constructing
mounds, sheeting and foraging runways, (ii) changes in soil texture emanating from
movement of clay fractions from subsoil for construction they make (iii) changes in
the nature and distribution of organic matter and plant nutrient through litter
brought into nests which is digested by termites and decomposed by the microbes
in situ (the termite-worked soil has higher CEC and exchangeable bases than
surrounding soil), and (iv) the changes in soil drainage and moisture regimes
upon constructing subterranean galleries.
2.3.2 Microorganisms in Soil
Bacteria The number of bacteria is highly variable depending upon soil type,
nature of crop cover and climatic conditions. Generally, soils with low organic
matter and sandy texture have very low population. The different bacterial genera
commonly occurring in diverse soils are: Pseudomonas, Arthrobacter, Clostridium,Bacillus, Achromobacter, Micrococcus and Agrobacterium. The presence of
enterobacteria (not strictly soil bacteria) in soils, is of great ecological significance,
as it is indicative of fecal contamination. Their presence is a potential health hazard,
particularly in growing crops whose edible plant parts come in direct contact with
soil. Thus enteric pathogens may get into food chain and cause human diseases.
Due to their large number and rapid rate of multiplication, bacteria play a very
significant role in carrying out various biochemical reactions controlling availabil-
ity of plant nutrients. The processes of N2 fixation, phosphate solubilization,
organic matter decomposition and synthesis of humus, nitrification and denitrifica-
tion, protein decomposition and ammonification, etc., lead to transformation of
various macro- and micro-nutrients in soil and help in plant nutrition. Certain free-
living soil bacteria can reduce the atmospheric nitrogen to ammonical form, thus
enriching soil with plant available nitrogen. These bacteria belong to the genus
Azotobacter and Azotomonas, and grow abundantly in soil which are relatively high
in organic matter. The genus Beijerinckia and Derxia are unique; they can fix
nitrogen in soils which are highly acidic (pH 4.0). Clostridium fixes nitrogen
under anaerobic conditions and can be of economic significance in flooded soils.
Besides these free-living bacteria, there is another group belonging to the genus
Rhizobium which fixes nitrogen in symbiosis with the legumes forming tiny
out-growths on roots called legume root nodules, the sites of nitrogen fixation.
Azospirillum, a spiral bacterium fixes nitrogen in association with plants in rhizo-
sphere after entering into roots without forming nodule and the process is called
‘associative nitrogen fixation’. The soil bacteria responsible for transformation of
nitrate to oxide of nitrogen and gaseous nitrogen resulting in loss of fertilizer
nitrogen are termed ‘denitrifying bacteria’. The microbiological oxidation of
ammonium to nitrate is one of the most important transformations taking place in
2.3 Organisms in Soil and Their Activities 23

soil which helps plant nutrition since nitrogen is predominantly taken up as NO3
ion. This transformation is mediated by a group of bacteria called ‘nitrifyingbacteria’.
Actinomycetes They are more common in dry soils and in undistributed pastures
and grasslands. Like bacteria, they are more common in neutral to slightly alkaline
soils. They are aerobic organisms and therefore their number is less in lowlands. As
they can withstand drought conditions very well, they occur more frequently in
soils undergoing dry spells. Actinomycetes are nutritionally heterotrophic and are
highly adaptive to degrade wide range of organic substances, particularly those
which are difficult to be decomposed by other soil organisms.
Fungi Soil fungi can now grow in wide range of soil pH but their population is
more under acidic conditions because of severe competition with bacteria at neutral
pH. A majority of fungi are aerobic and prefer to grow at optimum soil moisture.
The contribution of these organisms in biochemical transformation under excessive
moisture is negligible. Fungi are heterotrophs and therefore derive nutrition from
either living plant tissues as a ‘parasite’, causing plant diseases or dead tissues as a
‘saprophyte’. Saprophytic fungi perform a very important function in the decom-
position of organic matter, particularly plant residues.
Some fungi form a symbiotic association with roots of higher plants facilitating
uptake of plant nutrients, particularly of those which are less mobile. This associ-
ation is known as ‘mycorrhizal association’. The beneficial effect of these fungi onnutrient uptake has been attributed to three factors: (a) increased absorption of
available nutrients from soil as the fungus changes root morphology; (b) increasing
the nutrient availability by solubilizing insoluble nutrients like P which thus
become available to plant, and (c) increasing the nutrient uptake due to faster
intracellular nutrient mobility.
Algae Soil algae are chlorophyll containing organisms. They are autotrophic,
and therefore their development is not restricted by organic carbon supply. They
are abundant in habitats exposed to light and have sufficient moisture. Blue green
algae have been reported to fix about 20 kg N per ha. Submerged soil condition in
the rice fields provides an ideal environment for the growth of algae as the soil
seldom dry out. A nitrogen fixing algae, ‘Anabaena azollae’, forms a symbiotic
association with a fresh water fern, Azollae and fixes nitrogen.
2.4 Soil Forming Processes
Soil is defined as outermost layer of earth’s crust consisting of complex mixture of
unconsolidated mineral and organic matter produced by the combined action of
water, wind and organic matter decay. Soils are formed from hard rocks, loose and
unconsolidated transported inorganic material and accumulated organic residues.
Even the loose mineral materials from which soils are formed are originated by the
24 2 Soil and Its Role in the Ecosystem

weathering of rock masses to stones, gravels, sands, silts, clays and soluble salts.
The unconsolidated material overlaying the rocks is known as regolith. The profile
of a soil with well marked horizons called A, B and C, tells the history of its
formation and bears the imprint of many physical, chemical and biological pro-
cesses which have led it to the present form. The common soil forming processes
are given in Table 2.2. Several of these processes operate simultaneously though
some may start acting sequentially. An example of the latter is translocation of clay
within a profile occurs after leaching of lime or soluble salts. However, in the long
run, one or two of these processes dominate and lead to the development of a soil
with a distinctive profile dictated by factors of soil formation.
2.5 Types of Soil and Their Distribution
2.5.1 Soil Order
USDA Soil Taxonomy, the most accepted system of soil classification worldwide
was developed by United States Department of Agriculture and the National
Table 2.2 Some important pedogenic processes
Structure development Grouping of individual particles (clay, silt and sand) together
with humus and free sesquioxides into aggregate or peds of fairly
distinctive size and shape
Humification Transformation of raw organic matter into humus
Translocation of lime Removal of lime from the upper part of profile and its partial or
total accumulation in the lower part. The process leads to the
formation of a kankar or calcic horizon
Leaching Removal of a constituent from soil solution e.g. soluble salts
Salinization Accumulation of soluble salts in soil
Clay migration or lessivage Removal of clay, particularly of fine clay in suspension from the
upper layer of soil profile and its accumulation in the lower part
Braunification/rubification/
ferruginisation
Release of iron from primary minerals and their dispersal as
coatings on soil particles or as complexes with organic matter/
clay or as discrete aggregates to impart a brown to red color to the
soil
Laterization Removal of silica from soil and accumulation of sesquioxides
(goethite, gibbsite, etc.) with or without the formation of iron
stone and concretions
Podzolization Removal of iron and aluminum, often as complexes with humus,
from the upper part and its deposition at some depth
Regur formation Formation of intensively dark color complex of smectitic clay
and humus. This dominant process occurs in black cotton soils
Gleization The reduction of iron under anaerobic (waterlogged) conditions
with production of bluish to greenish grey color with or without
mottles or ferro-manganese concretion
Buol et al. (1997)
2.5 Types of Soil and Their Distribution 25

Cooperative Soil Survey. This system of soil classification is based on soil proper-
ties along the profiles (Table 2.3) and grouped under several levels namely: Order,
Suborder, Great Group, Subgroup, Family, and Series (Table 2.4).
Table 2.3 Brief descriptions of the major soil orders in India according to soil taxonomy
Soil orders Description
Alfisols Soils are enriched with Fe and Al oxide minerals but lacks in CaCO3 in the upper
layer. Soils have diagnostic argillic horizon (rich with migrated clay), rich in
exchangeable cations (Ca2+, Mg2+, K+, Na+) contributing to base saturation of
greater than 35%. Downward migration of clay is generally less during pedogenic
process as compared to Ultisol.
Ultisols Soils are typically characterized with a humus rich surface layer having lower base
saturation (<35%) and mineral nutrients over a clayey B horizon. They are highly
weathered and acidic soil, mostly distributed in the humid areas of the tropical and
subtropical regions. The soil is enriched with kaolin type of clay mineral and metal
oxide (mainly of Fe & Al) imparting red color to it. Ultisols are more extensively
leached than Alfisols.
Oxisols Oxisols are highly weathered soils having oxic subsurface diagnostic horizon with
very little variation in texture along soil depth. Oxisol are formed under tropical
and subtropical climate along the equatorial region. Clay-size particles dominated
by hydrous oxides of iron and aluminum. Kaolinite dominates the clay minerals.
Oxisol differs with Alfisol and Ultisol by not having argillic horizon in the lower
depth.
Vertisols Soils are characterized by high clay content (>30%) which is dominated by 2:1
type of clay minerals (smectite). High cation exchange capacity, low permeability,
slickensides, high base saturation (Ca dominated) and medium to low organic
matter content (0.5–3%) are the characteristic features of Vertisol. This soil type
develops wide and deep cracks during dry season.
Mollisols This soil type is typically identified by humus rich (imparting dark color) surface
horizon developed under native grassland or forest region in the subhumid to
semiarid region. Such soil is rich in base cations (>50% base saturation with
dominance in exchangeable calcium and magnesium) and evolved from calcareous
rich colluvial deposits. This soil type has higher humus content than Alfisol, lacks
swell-shrink characteristics (as in Vertisol) and possesses higher CEC than Ultisol.
Inceptisols Inceptisols are formed under varying climatic condition except under aridic con-
dition. These soils are mostly formed from colluvial alluvial and loess materials
and lacks diagnostic argillic pedoturbation features. These soils are relatively
young and lack characteristics surface and subsurface horizons. However soil
profile indicates accumulation of humus and clays which are poorly developed to
indicate horizons.
Entisols Entisols are recently formed soils from the underlying sandy parent material with
little or no evidence of pedogenic horizon development in the profile. Such soils are
mostly formed in the floodplain area having significant erosion-deposition activity.
Entisols differ from Inceptisols by a minor subsurface build-up with
transported clay.
Aridisols Soils of arid region are formed from wide variety of parent material under
extremely dry climate. Such soils are low in humus and rich in sand sized particle.
Significant accumulation of migrated clay or gypsum or cemented clays are often
observed in the lower layers.
Adapted from Sehgal (2002)
26 2 Soil and Its Role in the Ecosystem

From soil pollution and remediation point of view, the issues ‘how a particular
soil is vulnerable, resilient and resistant to pollutants/disturbances’ and ‘how it
responses to specific management interventions’ are mainly influenced by soil
texture and organic carbon content of the soil. For example though coarse textured
soil (Entisols or Inceptisols) is easily disturbed by polluting activities; management
or remediation actions can easily restore it to some extent. Fine textured soil
(Vertisols) can resist soil pollutants some extent due to its buffering capacity. How-
ever after disturbance, it is either very difficult or sometimes not possible to restore
soil functions through management or remediation. Higher organic matter in a soil
type (Mollisols) causes higher microbial activity, CEC and metal chelation capacity
and all these lead to increase in resilience and resistance of soil to pollution.
2.5.2 Major Soil Types of India
The Indian soils have also been classified by the committee constituted by Indian
Council of Agricultural Research (ICAR) under major types as Alluvial Soils,
Black Soils, Red Soils, Laterite Soils, Mountain Soils, and Desert Soils. Physico-
chemical properties, mineralogical composition, physiography, geological forma-
tions, climate were the basis for this type of classification. The extent of area and
distribution of these soil types are presented in Table 2.5.
2.5.2.1 Alluvial Soil
Alluvial soil is the most important (from food production point of view) and the
largest soil group of India covering about 40% of the total land area of the country.
This soil type supports nearly half of Indian population and contributes to major
share of agricultural wealth. The alluvial soils have been formed from the deposi-
tion materials brought by river, glaciers and sea waves; and thus the parent material
Table 2.4 Taxonomical
order of Indian soils and
their distribution
Soil order Area (million ha) (%)
Entisols 78.7 23.94
Inceptisols 129.6 39.43
Vertisols 26.6 8.09
Aridisols 13.3 4.05
Mollisols 1.6 0.49
Ultisols 8.4 2.55
Alfisols 42.2 12.84
Othersa 28.2 8.58
Bhattacharyya et al. (2013)aIncludes glaciers, sand dunes, mangrove swamps, salt
waste, water bodies, rock land and rock outcrops
2.5 Types of Soil and Their Distribution 27

Table 2.5 Different soil types of India along with their corresponding USDA nomenclature
system
Major soils
(traditional
name)
Extent
Distribution in states
Soil orders US soil
taxonomy000 ha %
Alluvial 100,006 30.4 Andaman and Nicobar Islands,
Andhra Pradesh, Arunachal Pradesh,
Assam, Bihar, Delhi, Goa, Gujarat,
Haryana, Himachal Pradesh, Jammu
and Kashmir, Karnataka, Kerala,
Madhya Pradesh, Maharashtra, Man-
ipur, Meghalaya, Mizoram, Naga-
land, Odisha, Punjab, Puducherry,
Tamil Nadu, Tripura, Uttar Pradesh,
West Bengal
Alfisols, Entisols,
Inceptisols, Aridisols
Coastal
alluvial
10,049 3.1 Andaman and Nicobar Islands,
Andhra Pradesh, Gujarat, Karnataka,
Kerala, Lakshadweep, Odisha,
Puducherry, Tamil Nadu, West
Bengal
Inceptisols, Aridisols,
Entisols
Red 87,989 26.8 Andaman and Nicobar Islands,
Arunachal Pradesh, Andhra Pradesh,
Assam, Delhi, Gujarat, Goa,
Himachal Pradesh, Karnataka, Ker-
ala, Madhya Pradesh, Manipur,
Meghalaya, Nagaland, Mizoram,
Puducherry, Rajasthan, Tripura,
Tamil Nadu, Uttar Pradesh,
Alfisols, Entisols,
Inceptisols, Ultisols,
Mollisols, Aridisols
Laterites 18,049 5.5 Andhra Pradesh, Karnataka, Kerala,
Maharashtra, Odisha, Puducherry,
Tamil Nadu, West Bengal
Alfisols, Inceptisols,
Ultisols
Brown
forest
540 0.2 Karnataka, Maharashtra Mollisols,Inceptisols
Hill 2262 0.7 Manipur, Nagaland, Odisha, Tripura,
West Bengal
Inceptisols, Entisols
Terai 326 0.1 Sikkim, Uttar Pradesh Mollisols, Entisols
Mountain
meadow
60 – Jammu and Kashmir Mollisols
Sub-
montane
104 � Jammu and Kashmir Alfisols
Black 54,682 16.6 Andhra Pradesh, Bihar, Gujarat,
Madhya Pradesh, Maharashtra,
Odisha, Puducherry, Rajasthan,
Tamil Nadu, Uttar Pradesh
Inceptisols, Vertisols,
Entisols, Mollisols,
Aridisols
Desert 26,283 8.0 Gujarat, Haryana, Punjab, Rajasthan Aridisols, Entisols,
Inceptisols
Othersa 28,305 8.6 – –
Total 328,700 100 – –
Bhattacharyya et al. (2013)aIncludes glaciers, sand dunes, mangrove swamps, salt waste, water bodies, rock land and rock
outcrops in different states
28 2 Soil and Its Role in the Ecosystem

of this soil has always been transported from elsewhere. In India, it is distributed
widely in northern plains (starting from Punjab in the west to Assam and West
Bengal in the east) and river valleys (Deltas of Mahanadi, Godavari, Krishna and
Kaveri rivers in the Peninsular India). Alluvial soils are also found in coastal and
northern parts of Gujarat, Great Northern plain and lower valleys of Narmada and
Tapti. Alluvial soil is considered superior to other soil types due to the optimum
combination of good chemical and physical conditions for proper root growth as
well as having high fertility. This soil is composed of fine particles of sand, silt and
clay with dominance of silt fraction along with moderate organic matter content.
Geologically alluvial soil is classified into old alluvium termed as ‘bangar’ soil andnew alluvium known as ‘khaddar’ soil. Most of the new alluvial soils are found in
the flood plains and deltas area along the lower part of the course of rivers and may
even have nearly ten thousand years old deposits. Old alluvial soils are found on the
higher side of the river valley and termed locally as ‘bhangar’. The areas having
khadar soil are flooded almost every year and remain young with sandy/sandy loam
in texture and light in colour. Bangar soil is silty clay/clay loam in texture with
darker in color and may contain alkaline effloresces. Such old alluvial soils are
relatively less fertile than new alluvial khaddar soil. Alluvial soils are generally
deficient in organic carbon and nitrogen; however the soil is fertile due to presence
of adequate phosphorus, potassium and calcium. Illite is predominant mineral in the
clay fraction. These are deep loamy in texture having moderated cation exchange
capacity, moderate to high water holding capacity and with proper irrigation it
yields bumper produce of rice, wheat, sugar cane, maize, cotton, oilseeds, jute,
tobacco etc. The Indo-Gangetic plains of north India are the most fertile lands and
are largely irrigated, contributing 65% of the total food basket.
2.5.2.2 Black Soil
In contrast to alluvial soil, black soil has developed in-site through intense
weathering processes and is locally termed as ‘regur’ soil (derived from Telugu
word ‘reguda’). Cotton is the major crops grown in black soil and hence alterna-
tively termed as ‘black cotton soil’. Parent material of such soil was formed due to
solidification of lava during volcanic activity. The black soil is distributed mostly in
Deccan trap covering large areas of Maharashtra, Madhya Pradesh, Chhattisgarh
and Gujarat. It is also found in some parts of Krishna and Godavari river valleys,
covering parts of Andhra Pradesh, Karnataka and some parts of Tamil Nadu. Black
cotton soil is high in clay content and has high water holding capacity. Generally,
black soils are rich in potash and calcium, but poor in phosphate content. Due to its
high clay content, such soil develops deep and wide cracks during hot dry season;
but becomes sticky during rainy season imparting poor physical condition in the
context of crop cultivation. Therefore workable soil moisture range for tillage
operation is very narrow and the soil is required to be tilled immediately after the
first or the pre-monsoon shower. Black soil found near the valleys or lowlands is
deep, dark and highly fertile; whereas, such soil located upland is low in fertility.
2.5 Types of Soil and Their Distribution 29

Due to its high water holding capacity and rich in nutrients, black soil is best suited
for producing wheat, cotton, sugar cane, rice, millets, linseed, tobacco and oilseeds.
2.5.2.3 Red Soil
The red soil occupies about 10% of the total geographical area in India and is spread
across almost whole of the Tamil Nadu, parts of Karnataka, southeast Maharashtra,
eastern parts of Andhra Pradesh, Madhya Pradesh, Orissa and Jharkhand. It also
extends to large parts of south Bihar, western districts of West Bengal, the eastern
parts of Rajasthan; few districts of Uttar Pradesh; and parts of Nagaland, Assam,
Mizoram, Manipur, Tripura and Meghalaya. Red soil has been formed from the
weathering of iron rich acid granites (igneous) parent material and gneisses (meta-
morphic) rocks in a warm, moist climate under deciduous or mixed forests. Though
soil texture of red soils is mostly loamy in texture, it may vary widely from sandy to
clayey in nature. Such soil may have thin organic surface layer. It may be rich in
potash, but poor in organic carbon, nitrogen, phosphorus and calcium. As result
such soil has low fertility and is difficult to till. The red soils respond well to
fertilizers and irrigation and give excellent yields of wheat, rice, pulses, cotton,
millets, tobacco, oil seeds, potatoes and fruits.
2.5.2.4 Laterite Soil
The word ‘laterite’ is derived from a Latin word ‘later’ which means ‘brick’ due tothe tendency of the soil to harden upon exposure. The laterite soil is formed from
the parent material rich in iron and aluminum under high temperature and rainfall
condition of climate. It is also found in the high altitude areas of plateau regions and
has been widely spread on the summits of the Eastern Ghats, Western Ghats,
Rajmahal Hills, Satpuras, Vindhyas and Malwa plateau. It is abundantly found in
southern Maharashtra, and hilly parts of Orissa, Meghalaya and Assam, Karnataka,
West Bengal, Kerala, Andhra Pradesh and Bihar. Laterite soils are poor in soil
fertility due to prominent leaching process that takes place in intense rainfall areas.
During leaching process, calcium and silica is lost from soil profile leaving behind
high iron and aluminum content. Hence, laterite soils are poor in lime (calcium and
magnesium), organic carbon and nitrogen, while rich in iron, aluminum and potash.
Red and laterite soils (Alfisols) have good amount of sesquioxides, low in
organic matter and have a large proportion of kaolinite and non-expanding illitic
clay fractions. Laterite and associated soils are less water retentive and are thus
more drought-prone. The physical constraints to crop production in red and lateritic
soils are hardening of soil, low water-holding capacity, reduced soil volume due to
concretions, occurrence of hard plinthite or petroplinthite, drought related stress,
low cation exchange capacity, low organic matter, high acidity, iron and aluminium
toxicity, high phosphorus fixation and severe erosion. Laterite soil is composed of
less clay and more gravel which leads to poor soil fertility. But under proper
manuring and irrigation, the laterite soil is productive for crops like cashew nuts,
30 2 Soil and Its Role in the Ecosystem

ragi, rice, tea, coffee, rubber, coconut, arecanut, etc. In addition, laterite soil is
highly suitable for making bricks.
2.5.2.5 Mountain Soil
The mountain soil is normally found on the hill slopes covered with forests and such
soil accounts for around 8.7% of the total geographical area of India. It is distributed
in valley basins of Himalayan region, in the Western and Eastern Ghats and in some
parts of the Peninsular India. The mountain soil typically contains high humus due
to organic matter deposition from forest cover. However, it is poor in potash,
phosphorus and calcium. Mountain soil is highly heterogenous and its characteris-
tics vary from place to place due to changes in parent material, climate and
vegetation. The mountain soil is normally acidic, grey in colour and its textural
class varies widely from loamy/silty on valley sides to coarse-grained in the upper
slopes. Such soils are highly suitable for plantation crops like tea, coffee, spices and
tropical fruits in Karnataka, Tamil Nadu and Kerala. In the Himalayan region, crops
like wheat, maize, barley and temperate fruits can be produced under proper
fertilizer management.
2.5.2.6 Desert Soil
Arid and semi-arid regions having less than 50 cm of annual rainfall have predom-
inantly sandy textured desert soils. The desert soil is mostly found in Rajasthan and
the adjoining areas of Haryana, Punjab and the Rann of Kachchh in Gujarat. Desert
soils are mostly developed in-situ where sands originate from mechanical disinte-
gration of parent rocks under hot-dry climate. However, this may also develop from
wind-laden loess materials. The soil in the desert area has nearly 90–95% sand
particle and with very less amount of clay content (5–10%). Due to high evapo-
transpiration and less rainfall, some desert soils are saline in nature. Such soils are
generally poor in organic matter and nitrogen. Phosphate content may be as high as
that in alluvial soil. Due to water shortage in arid regions and also poor water
holding capacity of desert soil, additional irrigation facility is required to produce
variety of crops like wheat, millets, barley, maize, pulses, cotton etc.
2.5.3 Major Soil Types Under Different Agro-EcologicalZones (AEZ) of the Country
On the basis of climate characteristics, length of crop growing period and soil type,
total geographical area of India has been classified into 20 agro-ecological zones
(AEZ) for devising effective land use plan and farming strategy for various regions
(Table 2.6 and Fig. 2.1) (Sehgal 2002).
2.5 Types of Soil and Their Distribution 31

Table 2.6 Taxonomical order of Indian soils and their distribution
AEZ
No. Location Climate type Soil type
1. Western Himalayas Cold arid ecoregion Shallow, loamy
skeletal soils
2. Western Plain, Kachchh and part
of Kathiawar Peninsula
Hot arid ecoregion Desert and saline
soils
3. Deccan plateau Hot arid eco-subregion Red and black soils
4. Northern Plain (and Central
Highlands) including Aravallis
Hot semi-arid ecoregion Alluvium derived
soils
5. Central (Malwa) Highlands,
Gujarat plains and
Kathiawar Peninsula
Hot semi-arid ecoregion Medium and deep
clayey black soils
6. Deccan Plateau Hot semi-arid ecoregion Shallow and
medium (domi-
nant) black soils
7. Deccan Plateau (Telangana) and
Eastern Ghats
Hot semi-arid ecoregion Red and black soils
8. Eastern Ghats and Tamil Nadu
Uplands and Deccan (Karna-
taka) Plateau
Hot semi-arid ecoregion Red loamy soils
9. Northern Plain Hot sub-humid (dry)
eco-region
Alluvium derived
soils
10. Central Highlands (Malwa and
Bundelkhand)
Hot sub-humid (dry)
ecoregion
Red and black soils
11. Chattisgarh Mahanadi Basin Hot sub-humid (dry)
ecoregion
Red and yellow
soils
12. Eastern Plateau (Chhotanagpur)
and Eastern Ghats
Hot sub-humid ecoregion Red and lateritic
soils
13. Eastern Plain Hot sub-humid (moist)
ecoregion
Alluvium derived
soils
14. Western Himalayas Warm subhumid (to humid
with inclusion of perhumid)
ecoregion
Brown forest and
Podzolic soils
15. Assam and Bengal Plain Hot sub-humid (moist) to
humid (inclusion of
perhumid) ecoregion
Alluvium derived
soils
16. Eastern Himalayas Warm perhumid ecoregion Brown and red hill
soils
17. North-eastern Hills (Purvachal) Warm perhumid ecoregion Red and lateritic
soils
18. Eastern Coastal Plain Hot subhumid to semiarid
ecoregion
Coastal alluvium
derived soils
19. Western Ghats and Coastal Plain Hot humid-
perhumid ecoregion
Red, lateritic and
alluvium derived
soils
20. Islands of Andaman-Nicobar
and Lakshadweep
Hot humid to perhumid island
ecoregion
Red loamy and
sandy soils
Adapted from Sehgal (2002)
32 2 Soil and Its Role in the Ecosystem

2.6 Relationship Between Soil and Vegetation and Concept
of Top Soil
Soil, which is considered as common terrestrial substrate serves as a medium for
plant growth. Therefore, soil properties like texture, structure, water retention,
depth and nutrient status have major influence on species diversity and vegetation
establishment of any site. On the other side, vegetation and its species diversity
plays significant role in different pedogenic processes leading to soil formation.
Fig. 2.1 Agro-Ecological Regions of India (Adapted from Sehgal 2002)
2.6 Relationship Between Soil and Vegetation and Concept of Top Soil 33

Fundamental soil equation (Jenny 1958) states nature of soil in a given location
is dependent of several factors:
Soil ¼Z
climate; parent material; relief ; organisms; timeð Þ
Similarly, Major (1951) proposed equation for plant community in which same
environmental factors responsible for Jenny’s above soil formation equation are
also responsible for the vegetation that is produced :
Vegetation ¼Z
climate; parent material; relief ; organisms; timeð Þ
Above equations also indicate that specific plant community and soil type in an
area are mutually associated for their development. This further indicates that all
strata on the landscape with the same type of soil should have same vegetation
community, the same plant association, and the same habitat type. However several
studies conducted in this area either supported such association or failed to establish
any relationship between these two entities (soils and vegetation) (Hironaka et al.
1990). Studies of Koptsik et al. (2003) revealed a significant correlation between
the species diversity of plant community and soil properties. Soil factors acidity,
concentrations of exchangeable calcium, potassium, and magnesium, influenced
variations of species diversity indices for vascular plants and bryophytes in forest
ecosystem. Likewise strong relationship was observed between plant diversity
index and soil functional diversity (Rodrıguez-Loinaz et al. 2008). On the contrary,
inconsistent results were observed while predicting tree site index using selected
soil properties (Copeland 1958; Monserud et al. 1990).
Several authors (Daubenmire et al. 1968; Daubenmire 1979; Neiman 1988;
Jensen et al. 1990; Tisdale and Bramble-Brodahl 1983) have attempted to correlate
predominant vegetation community and soils. The results have been mostly incon-
clusive (Hironaka et al. 1990). These failures indicate that either relationship
between soil and vegetation does not exist or some underlying fundamental causes
have been overlooked. Johnson and Simon (1987) observed influence of ash and
loess (aeolian deposit) on species diversity of grasses and shrubs. For example,
bluebunch wheatgrass, scabland and xeric shrubland communities existed on soils
having little influence from loess deposits; whereas fescue-prairie junegrass and
mesic shrubland communities occur on soils that are considerably influenced by
loess. Likewise, forest species diversity was considerably influenced by ash (vol-
canic origin) content of the soil. However, researchers were unable to extrapolate
such findings (correlations between soils and vegetation) outside their area of study.
Similarly, a study from central western New South Wales, USA showed poor
associations between soil landscapes and vegetation types; where specific type of
vegetation was associated with several soil landscapes or soil types and specific soil
type or landscape was normally linked with several vegetation types (Rankin et al.
2007). In a study at Himalayan region of China, high tree diversity, height and
34 2 Soil and Its Role in the Ecosystem

vegetative cover were linked to good soil quality and favorable topographic posi-
tions with lower solar incident radiation, runoff and soil erosion potential (Xu et al.
2008). Plant diversity was mainly correlated with soil water content, and clay
content. In a flood plain area of Argentina, nature and type of plant communities
varied with drainage, pH and exchangeable sodium percentage in the soil of the
area and such vegetative diversity was related to hydromorphic, hydrohalomorphic
or halomorphic characteristics of soil (Debelis et al. 2005). Changes in soil chem-
ical environment due to entry of pollutants can have tremendous impact on species
diversity and density of natural vegetation. Only tolerant species and varieties
proliferate, while the population of sensitive species goes down.
Information generated thus indicates that correlation between selected soil
properties and vegetation had been successfully established by several researchers
in different parts of the world. However, these conclusions were found only locally
significant and could not be applicable elsewhere. Because of huge variation that
persists in classification units of soil and vegetation, universal relationship or
correlation has not been found to exist between soils and habitat type. Further it
is relatively difficult to confirm the correctness of above assumption pertaining to
vegetation due to absence of undisturbed vegetation across various geographical
and climatic regions.
References
Bhattacharyya T, Pal DK, Mandal C et al (2013) Soils of India: historical perspective, classifica-
tion and recent advances. Curr Sci 104:1308–1323
Buol SW, Hole FD, McCracken RW (1997) Soil genesis and classification, 4 th edition. Iowa State
University Press, Ames
Copeland OL Jr (1958) Soil-site index studies of western white pine in the northern Rocky
Mountain region. Soil Sci Soc Am Proc 22:268–269
Daubenmire R (1979) Steppe vegetation of Washington. Tech. Bull. 62. Washington State
University, Pullman, Washington Agricultural Experiment Station, p 131
Daubenmire R, Daubenmire D, Jean B (1968) Forest vegetation of eastern Washington and North
Idaho. Tech. Bull. 60. Washington State University, Pullman, Washington Agricultural Exper-
iment Station, p 104
Debelis SP, Bozzo AA, Barrios MB et al (2005) The relationship between soil characteristics and
vegetation as a function of landform position in an area of the flooding pampa. Span J Agric
Res 3(2):232–242
Dwivedi OP, Tiwari BN (1987) Environmental crisis and Hindu religion (verses from Artharva
Veda, 12.1). Geetanjali, New Delhi, p 202
Gandhi M, Gandhi MK (1994) An autobiography: the story of my experiments with truth. South
Asia Books, Columbia, p 754
Goswami NN, Rattan RK (1992) Soil health – key to sustained agricultural productivity. Fert
News 37:53–60
Hironaka M, Fosberg MA, Neiman KE (1990) The relationship between soils and vegetation.
Symposium on Management and Productivity of Western-Montane Forest Soils, Boise, ID,
April 10–12
Jenny H (1958) Role of the plant factor in the pedogenic functions. Ecol 39:5–16
References 35

Jensen ME, Simonson GH, Dosskey M (1990) Correlation between soils and sagebrush-dominated
plant communities of northeastern Nevada. Soil Sci Soc Am J 54:902–910
Johnson CG, Simon SA (1987) Plant associations of the Wallowa-Snake Province, Wallowa-
Whitman National Forest. R6-ECOL-TP-255a-86. US Department of Agriculture, Forest
Service, Pacific Northwest Region, Portland, pp 400
Koptsik SV, Koptsik GN, Livantsova SY et al (2003) Analysis of the relationship between soil and
vegetation in forest biogeocenoses by the principal component method. Russ J Ecol 34:34–42
Major J (1951) A functional, factorial approach to plant ecology. Ecol 32:392–412
Monserud RA, Moody U, Breuer DW (1990) A soil-site study for inland Douglas-fir. Can J For
Res 20:686–695
Neiman KE (1988) Soil characteristics as an aid to identifying forest habitat types in northern
Idaho. Res. Pap. INT-390. US Department of Agriculture, Forest Service, Intermountain
Research Station, Ogden, p 16
Rankin MO, Semple WS, Murphy BW et al (2007) Is there a close association between soils and
vegetation? a case study from central western new South Wales. Cunninghamia 10:99–214
Rodrıguez-Loinaz G, Onaindia M, Amezaga I et al (2008) Relationship between vegetation
diversity and soil functional diversity in native mixed-oak forests. Soil Biol Biochem 40:49–60
Sehgal J (2002) Soil classification. Fundamental of Soil Science, ISSS, New Delhi, pp p19–p53
Tisdale EW, Bramble-Brodahl M (1983) Relationships of site characteristics to vegetation in
canyon grasslands of west Central Idaho and adjacent areas. J Range Manag 36:775–778
US Salinity Laboratory Staff (1954) Diagnosis and improvement of saline and alkali soils. USDA
handbook 60. U.S. Government Printing Office, Washington, DC
Xu XL, Ma KM, Fu BJ et al (2008) Relationships between vegetation and soil and topography in a
dry warm river valley, SW China. Catena 75:138–145
36 2 Soil and Its Role in the Ecosystem

Chapter 3
Impacts of Soil Pollution and TheirAssessment
Abstract Impact assessment of pollution is important step towards initiating
appropriate remedial measures. However impact of soil pollution may not neces-
sarily be uniform across the agro-ecological regions due to complex relationship
among soil types, climate, crop types, nature and level of contamination as well as
soil and crop management methodologies adopted. Moreover land resources are
habitat of numerous organisms having varying degree of sensitivity towards con-
taminants. Hence, choosing right approach for assessing impact of pollution
becomes important for satisfying various stakeholders affected by soil pollution.
This chapter covers different types of impact of pollution on soil quality, economic
yield of crop, food quality, biodiversity, fertilizer nutrient use efficiency, economy
of the country etc. Pollution has already made adverse impacts on environment
including soil in different countries. Widely cited instances of different types of
pollution across the world and their impacts on soil and crop has also been
discussed in this chapter.
Keywords Impact • Soil • Pollution • Fertility • Biological activity •
Environmental tragedies
Global environmental concerns and related movements have widely been related
with the famous publication of “Silent spring” authored by Rachel Carson in the
year 1962, wherein the author thoroughly described the widely used pesticide
dichloro-diphenyl-trichloroethane (DDT) entering into the food chain of human
and animal, causing genetic damage and cancer (Carson 1962). This issue evolved
with changes in environmental aspects (activities, products or services that can
interact with the environment) in broader sense, and the need for ecological balance
and clean environment has been increasingly felt.
Soil is an important component of the biosphere where all the three components
lithosphere, hydrosphere and atmosphere interface. Hence disturbing any compo-
nent of the biosphere affects the other components severely because of the
interlinking of different ecological functions operating within. A range of chemical
substances is liberated into the environment by the activities of human at global
level and can be seen ubiquitously including in soil system. Anthropogenic activ-
ities leading to soil pollution have severe impacts on the quality of living organisms
ranging from impairment of functional quality to complete elimination of a species
© Springer Nature Singapore Pte Ltd. 2017
J.K. Saha et al., Soil Pollution - An Emerging Threat to Agriculture, Environmental
Chemistry for a Sustainable World 10, DOI 10.1007/978-981-10-4274-4_3
37

in most severe cases. As there has been wide variation in the diversity and
functional quality of living organisms across the geographical dimensions due to
the influence of climate and essential natural resources, identification of the impact
of soil pollution is many a times complex. This chapter briefly describes on
different ways to identify such impacts. Although several impacts can be perceived
within short span of time, some of these require longer period for expression due to
their slow rate of change. Now the era of modern technologies and significant
research in different branches of science have helped us to find out environmental
changes of even few weeks. Soil pollution has wide ranges of impacts on
agroecosystems which can be identified and quantified in following different ways.
3.1 Loss of Crop Productivity and Crop Diversity
Some of the direct impacts of soil pollution can be seen in agricultural production
system like loss/decline in soil productivity and loss in crop diversity. Pollution of
soil and water drastically has estimated to reduce the crop yields by about 15–25%
over the years and total cropped area has decreased significantly. Within 20 years,
the total cropped area has fallen about 10.5% in Vellore district (Dakiky et al. 2002;
Nath et al. 2005). In this tract, use/release of textile effluent in the agricultural field
has ruined the traditional cropping sequence with loss of crop productivity and
diversity. The toxicity of heavy metals mainly chromium (Cr) in irrigation water
and soil has replaced wheat crop to a large extent with other hardy horticultural
shrubs nearby Kanpur tannery on the bank of Ganga River.
In surrounding agricultural land of Ratlam industrial area, use of pol-
luted groundwater has adversely affected farming through changes in cropping
pattern, reduction in crop yield, as well as reduced longevity of irrigation infra-
structure (Saha and Sharma 2006). Area under vegetable and pulse cultivation
reduced considerably and the same under fallow has increased during rabi season
as many farmers prefer to keep their land fallow instead of using polluted ground-
water as irrigation. The yields of the traditional crops such as soybean, gram wheat,
methi and garlic are less in polluted area (Table 3.1). Onion grown using polluted
groundwater, has a very short keeping quality and starts rotting within 10–15 days
after harvest; thus inflicting heavy economic losses to the farmers. The iron pipes of
the tubewell rusted frequently incurring losses on account of repair and mainte-
nance of irrigation infrastructure.
Similar situation also prevailed in other part of Indian states i.e. Vellore (TN),
Howrah (WB). Loss of crop productivity in contaminated agricultural fields can be
assessed through following methods:
38 3 Impacts of Soil Pollution and Their Assessment

3.1.1 Farmer’s Interaction/Survey
In the villages, local agriculture officers measure the crop productivity loss by
recording views of key persons (old people or head of village local body) due to
having the vast knowledge of natural calamities as well as soil and crop history of
particular area. Though this type of estimation is not exact, this can be a preliminary
method for further investigation. During crop productivity assessment by this
method, distinction should be made between biological and economic yield and
correction must be made for threshing and moisture content.
3.1.2 Crop Cutting Survey
This is a popular method of crop loss measurement. The crop yield estimation in
many country is mostly carried out on the basis of sample survey approach. The
estimates of yield rates are obtained on the basis of scientifically designed Crop
Cutting Experiments (CCE) conducted in which, a particular shape and size of plots
are mentioned (Table 3.2). Same size and shape of plot cannot be taken for all
crops. As plot size increases, the estimated yield and standard deviation of yield
decreases and yield estimation attains a stable value when the plot size is signifi-
cantly large. Minimum recommended shape and size varies widely from 1/160 of
an acre for paddy to 1/10 of an acre for cotton. Limited evidences, however show
that farmers’ estimates may no more be biased than crop cutting; but require fewer
resources and supervision (Poate 1988). Crop cutting survey data from polluted
area should be compared with those from nearby unpolluted area in order to
quantify the pollution impact.
Selecting CCE Field for Crop Loss Measurements
• The area of the selected field should be more than the area of CCE plot, so that at
least a one CCE plot must be accommodated in the selected field.
Table 3.1 Estimation of loss due to reduction of yield of crops
Crop
Average yield (Mg ha�1)
Loss (US$ per ha)Unpolluted area Polluted area
Wheat 3.6 2.9 101
Gram 12.5 9a 108
Soybean 15 11.5 93
Methi 18 12 200
Garlic 60 45 667
Saha and Sharma (2006)aWhen irrigation is given at later stages
3.1 Loss of Crop Productivity and Crop Diversity 39

• If the field is sown with mixed crop. The experimental crop must constitute at
least 10% of its cropped area.
• In case experimental crop is damaged completely, yield must be recorded
as zero.
3.1.3 Use of Satellite Imagery
Nowadays imageries from remote-sensing satellites are being used for assessing the
crop growth condition and crop productivity loss. However, this method is suitable
when vast area is affected with soil pollution. Important advantage of this method is
that extent of area affected can be estimated. For more reliability of this method,
this technique should be supported with ground truth. Remote sensing based
methodologies have distinct advantages, e.g. in providing rapid objective assess-
ments without an investigator bias, longitudinal assessments (reporting changes
over time at the same location), providing assessments on the hostile terrains, and
rapid assessments of the extent of affected areas (Srivastava 2015). Environmental
impact of geothermal pollution activities in the Mt. Amiata area was studied using
on-site spectral analyses of various ecological components like vegetation and
lichens (Manzo et al. 2013). Spectral indices have been found sensitive to environ-
mental pollution and their responses are statically correlated to chemical and
ecophysiological analyses within a notable distance. Remote sensing technique
has been used to generate pollution potentiality map of Bhatinda district of Punjab
by relating groundwater quality (water quality index) with land use/land cover (land
cover index) (Srivastava et al. 2012). Researchers concluded from their study
indicated that most of the study area exhibited poor groundwater quality due to
very high pollution.
Table 3.2 Parameters of crop cutting experiments
Name of crop Shape
Length
(m)
Breadth
(m)
Diagonal
(m)
Paddy, wheat, jowar, bajra, ragi, maize, groundnut,
tobacco, sugarcane, okra, green gram, chillies,
mesta, horse gram, black gram, bengal gram,
sunflower
Square 5 5 7.07
Red gram, sesamum, caster, cotton Square 10 10 14.14
Panse (1947)
40 3 Impacts of Soil Pollution and Their Assessment

3.2 Decline in Nutrient Use Efficiency
Nutrient use efficiency is defined as quantum of food/fodder production per unit of
nutrient applied externally. Lower nutrient use efficiency indicates increase in
fertilizer requirement for same level of productivity; thereby increase in cost of
production. Different soil contaminants interact with soil components, microorgan-
isms and root cells in several ways at multiple levels to affect nutrient transforma-
tion processes in soils and their absorption by roots. Heavy metals have been found
to affect uptake of essential nutrients by plants which may consequently reduce use
of applied fertilizers (Aslam et al. 2014). Increase in soil salinity in polluted soils
affect absorption of water and hence, affect nutrient uptake from soil. Several
contaminants are harmful to microorganisms (like Cd, Cr, Cu) and thereby affect
several microbially mediated nutrient transformation processes like nitrogen fixa-
tion, nutrient mineralization etc. (Bondarenko et al. 2010; Arora et al. 2010;
Bianucci et al. 2011). Alkalinity development (as observed in soils near Ratlam
and Nagda industrial area) enhance volatilization loss of ammoniacal form of N
from soil and thereby reduces N use efficiency.
3.2.1 Measurement in Decline in Nutrient Use Efficiency(NUE)
Use efficiency may be defined as yield per unit input. In agricultural nutrient
management, this is usually related to the input of fertilizer. Improvement in
NUE is an essential pre-requisite for enhancing crop production in underdeveloped
countries having largely resource poor farmers. The efficient utilization of applied
fertilizers can be calculated with the help of partial factor productivity (PFP) and
agronomic efficiency (AE), which are computed using following formula:
PFP kg yield per kg of nutrient appliedð Þ ¼ Yf
Na
AE kg yield per kg nutrient appliedð Þ ¼ Yf � Yc
Na
where ‘Yf’ stands for yield from a N-fertilized plot, ‘Yc’ stands for yield in control
plot, and ‘Na’ stands for amount of N applied in kg/ha. Comparing PFP and AE
from polluted area with those from unpolluted area may indicate impact of soil
pollution on agriculture.
3.2 Decline in Nutrient Use Efficiency 41

3.3 Quality of Food: Vegetable, Fruit and Grain
Environmental pollution impacts can also be perceived as symptoms on crop
maturity through assessment of quality of vegetable and fruit like shelf life, size,
taste and aroma etc. Polluted soil may produce vegetables, having lower storage
life, foul smell and gives unpleasant aroma during cooking. Significant increases in
lipid peroxidation and H2O2 were observed in turnip and lettuce due to irrigation by
industrial wastewater, which indicated oxidative damage to the vegetables
(Hassanein et al. 2013). The significant increases in putrescine in shoots and roots
of these vegetables grown with industrial wastewater indicated decreased shelf life
of vegetables grown on polluted land. As transfer of heavy metals from soil to
edible parts of vegetable is higher as compared to grain crops, contaminated soil or
effluent (for irrigation purpose) contaminates vegetables with several heavy metals.
The effluent containing various pollutants may reduce the fruit size, distort colour
and may result in early drop of flowers (Fig. 3.1), poor quality aroma and market-
ability of fruits. Fruits grown with polluted irrigation water may emit foul smell
when stored for few days. Keeping quality of onion has been found severely
reduced when the crop is grown with polluted groundwater near Ratlam industrial
area (Saha and Sharma 2006).
In the adjoining area of mega cities, farmer’s use untreated sewage water as a
source of irrigation water. It provides farmer’s security in terms of ensured nutrient
enriched water supply (Ghosh et al. 2012) and also provides the society with a
reliable and inexpensive system for wastewater treatment and disposal (Feigin et al.
1991). However, untreated wastewater also contains considerable pathogens
Fig. 3.1 Early drop of immature fruits (yellow colour) due to use of sewage water coming from
Vapi city of Gujarat
42 3 Impacts of Soil Pollution and Their Assessment
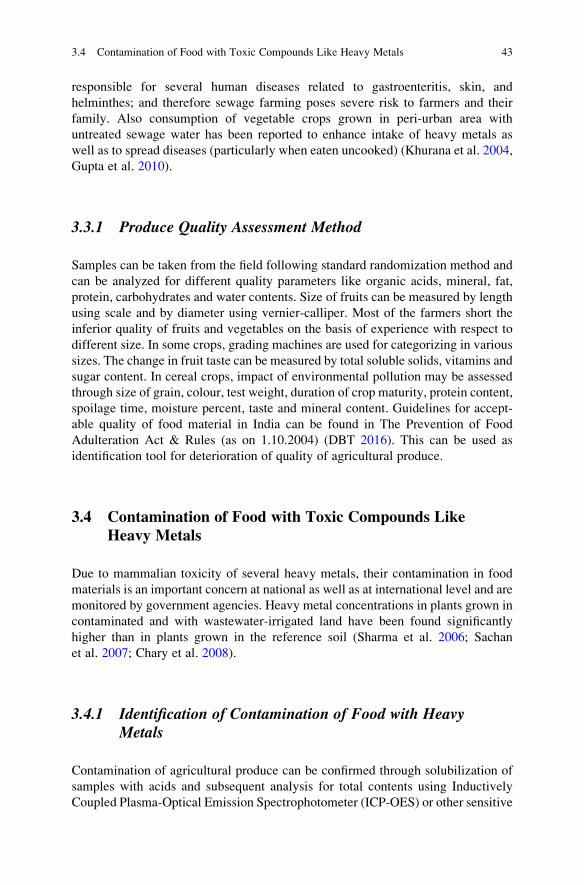
responsible for several human diseases related to gastroenteritis, skin, and
helminthes; and therefore sewage farming poses severe risk to farmers and their
family. Also consumption of vegetable crops grown in peri-urban area with
untreated sewage water has been reported to enhance intake of heavy metals as
well as to spread diseases (particularly when eaten uncooked) (Khurana et al. 2004,
Gupta et al. 2010).
3.3.1 Produce Quality Assessment Method
Samples can be taken from the field following standard randomization method and
can be analyzed for different quality parameters like organic acids, mineral, fat,
protein, carbohydrates and water contents. Size of fruits can be measured by length
using scale and by diameter using vernier-calliper. Most of the farmers short the
inferior quality of fruits and vegetables on the basis of experience with respect to
different size. In some crops, grading machines are used for categorizing in various
sizes. The change in fruit taste can be measured by total soluble solids, vitamins and
sugar content. In cereal crops, impact of environmental pollution may be assessed
through size of grain, colour, test weight, duration of crop maturity, protein content,
spoilage time, moisture percent, taste and mineral content. Guidelines for accept-
able quality of food material in India can be found in The Prevention of Food
Adulteration Act & Rules (as on 1.10.2004) (DBT 2016). This can be used as
identification tool for deterioration of quality of agricultural produce.
3.4 Contamination of Food with Toxic Compounds LikeHeavy Metals
Due to mammalian toxicity of several heavy metals, their contamination in food
materials is an important concern at national as well as at international level and are
monitored by government agencies. Heavy metal concentrations in plants grown in
contaminated and with wastewater-irrigated land have been found significantly
higher than in plants grown in the reference soil (Sharma et al. 2006; Sachan
et al. 2007; Chary et al. 2008).
3.4.1 Identification of Contamination of Food with HeavyMetals
Contamination of agricultural produce can be confirmed through solubilization of
samples with acids and subsequent analysis for total contents using Inductively
Coupled Plasma-Optical Emission Spectrophotometer (ICP-OES) or other sensitive
3.4 Contamination of Food with Toxic Compounds Like Heavy Metals 43

instruments. For the purpose of confirming contamination, an upper limit of back-
ground concentration (Cul) of any heavy metal should be determined using follow-
ing formula. Any sample having concentration of metal more than this limit is said
to be contaminated.
Cul ¼ μþ 3σ
where, mean (μ) and standard deviation (σ) are with respect to heavy metal
concentrations in large number (>30) of food samples collected from
uncontaminated area.
3.4.2 Contamination Beyond the Permissible Limitsof Government Quality Control Regulations
Some countries have formulated quality control regulation in respect of maximum
permissible heavy metal contents in certain food products/food additives for the
purpose of protecting human population. In India, heavy metal limits in certain
beverages/food additives/food products are mainly controlled by Prevention of
Food Adulteration Act No. 37 of 1954 (Table 3.3). Codex Alimentarious Commis-
sion (CAC 2011) has also prescribed International Food Standards (hereafter will
be referred as ‘FAO/WHO CODEX limit’) on some limited heavy metals contents
in food items. However, limited number of toxic elements (As, Cd, Pb, Hg, Cu, Zn
and Sn) are covered under this guideline for food crops grown on land. Maximum
safe limits in different agricultural produce (edible) have been prescribed only for
As, Cd and Pb based on maximum safe intake rate of heavy metals by human.
Guidelines for other toxic heavy metals (Hg, Cu, Zn and Sn) were issued as
Provisional Maximum Tolerable Daily Intake (PMTDI), Provisional Tolerable
Weekly Intake (PTWI), Provisional Tolerable Monthly Intake (PTMI) etc.
The daily intake of heavy metals through the consumption of a food item is
calculated according to the equation:
Table 3.3 Maximum
permissible concentration
limits of heavy metals as
specified in the Indian
Prevention of Food
Adulteration (PFA)
Act No. 37 of 1954
Heavy metals
Maximum permissible concentration
(mg kg�1)
Arsenic 1.1
Cadmium 1.5
Copper 30
Mercury 1.0
Methyl mercury 0.25
Lead 2.5
Zinc 50
Awashthi (2000)
44 3 Impacts of Soil Pollution and Their Assessment

Daily intake of metal μg day�1� � ¼ Daily consumption of the food item g day�1
� �� �� heavy metal concentration in the food item μg g�1ð Þ½ �:
Daily vegetable consumption can be obtained by conducting a survey in the
study area. Such computed daily intake of heavy metals through the consumption of
all food items and drinking water can be compared to the PMTDI values to assess
the impact of soil pollution on human population in the affected area.
Instances of heavy metal contamination in food crop beyond the permissible limits
have been reported from different parts of India. The vegetable samples from five broad
sampling areas in Delhi (Faridabad, Okhla, the Yamuna flood plain, Najafgarh and
Alipur) contained unsafe levels of Pb and Zn. In these areas waste water was being used
for vegetable cultivation (DFID 2003). About 72% samples (of total 222 samples
collected) of palak contained Pb concentrations that exceeded the Indian Prevention
of Food Adulteration Act (PFA) permissible limit of 2.5 mg kg�1. About 24% of the
samples exceeded the PFA permissible limit by more than two-fold (i.e. hadconcentrations of >5.0 mg kg�1). If the more stringent FAO/WHO CODEX limit
of 0.3 mg/kg is used in Table 3.4, then 100% of the palak samples exceeded safe
limits. About 21% of 609 palak samples analysed showed that Zn concentrations
exceeded Indian PFA limits (50 mg kg�1). About 3% had concentrations at twice
the PFA limit. Though cadmium in all the 260 samples of palak had concentrations
within the PFA limits (1.5 mg kg�1), the content in 70% samples exceeded the
much more stringent FAO/WHO CODEX limit (0.2 mg kg�1). In several vegetable
samples at market sites of Varanasi, concentrations of Cu in cauliflower, and of Zn
and Cd in both spinach and cauliflower had exceeded the PFA standard (Sharma
et al. 2009). In contrast, Pb in vegetables tested from both field and market sites was
below the PFA limit, but was considerably higher than the current FAO/WHO
CODEX standards. Heavy metals accumulation in vegetables were higher at market
sites than those at the crop production sites. The contributions of these vegetables to
dietary intake of Cu, Zn, Cd and Pb were 13%, 1%, 47% and 9% of provisional
tolerable daily intake, respectively.
3.5 Rejection of Export Consignment
Soil pollution can also exert significant adverse impact on country’s export of fooditems. Food export consignments may be rejected by exporting countries due to
presence of pesticides residues, heavy metals etc. In India, the reasons for rejection
varies from presence of pesticide residues in grapes beyond permissible levels
under the EU food laws to the presence of non-permissible artificial colour,
antibiotics, heavy metals etc. (Table 3.5). Several importing countries
have implemented stringent quality control measure in respect of heavy metal
contents, which raises concerns for agricultural products exporting countries.
3.5 Rejection of Export Consignment 45
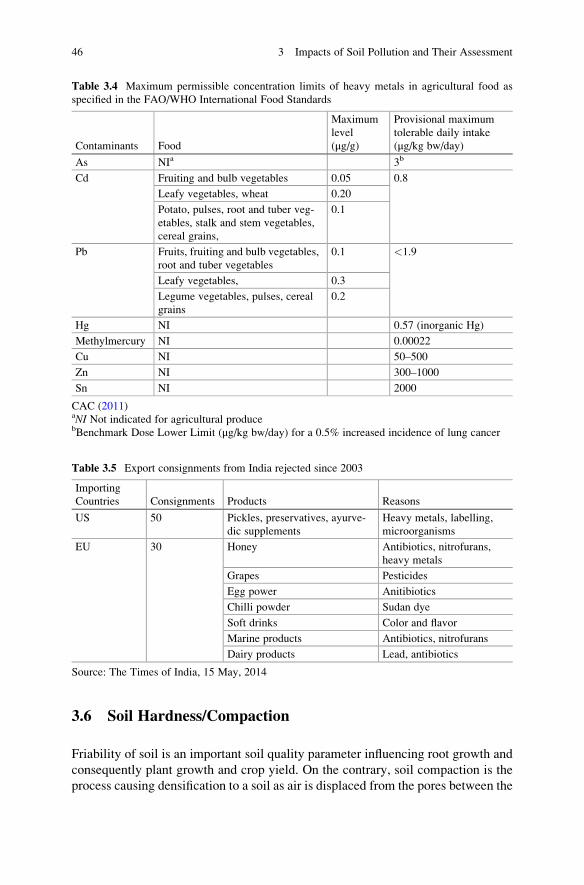
3.6 Soil Hardness/Compaction
Friability of soil is an important soil quality parameter influencing root growth and
consequently plant growth and crop yield. On the contrary, soil compaction is the
process causing densification to a soil as air is displaced from the pores between the
Table 3.5 Export consignments from India rejected since 2003
Importing
Countries Consignments Products Reasons
US 50 Pickles, preservatives, ayurve-
dic supplements
Heavy metals, labelling,
microorganisms
EU 30 Honey Antibiotics, nitrofurans,
heavy metals
Grapes Pesticides
Egg power Anitibiotics
Chilli powder Sudan dye
Soft drinks Color and flavor
Marine products Antibiotics, nitrofurans
Dairy products Lead, antibiotics
Source: The Times of India, 15 May, 2014
Table 3.4 Maximum permissible concentration limits of heavy metals in agricultural food as
specified in the FAO/WHO International Food Standards
Contaminants Food
Maximum
level
(μg/g)
Provisional maximum
tolerable daily intake
(μg/kg bw/day)
As NIa 3b
Cd Fruiting and bulb vegetables 0.05 0.8
Leafy vegetables, wheat 0.20
Potato, pulses, root and tuber veg-
etables, stalk and stem vegetables,
cereal grains,
0.1
Pb Fruits, fruiting and bulb vegetables,
root and tuber vegetables
0.1 <1.9
Leafy vegetables, 0.3
Legume vegetables, pulses, cereal
grains
0.2
Hg NI 0.57 (inorganic Hg)
Methylmercury NI 0.00022
Cu NI 50–500
Zn NI 300–1000
Sn NI 2000
CAC (2011)aNI Not indicated for agricultural producebBenchmark Dose Lower Limit (μg/kg bw/day) for a 0.5% increased incidence of lung cancer
46 3 Impacts of Soil Pollution and Their Assessment

soil grains. Several industrial activities adversely affect soil friability and result in
compaction or hardness. For example, dusts (containing mostly mineral matters)
emitted from thermal power plants, heavy traffics and other vehicular activities,
mining activities gets deposited on nearby agricultural land and imparts soil
hardness due to decrease in soil organic matter. Most of the industrial activities
deteriorate irrigation water quality in terms of increasing Na salt concentration
through discharge of liquid effluent. Use of such high Na containing irrigation water
for crop production enhances salinity, raises pH and high ESP on the exchangeable
sites. Alkaline soil condition destroys soil structure through dispersion of clay
minerals and thereby enhances soil hardness. Soil organic matter content is a
major soil quality parameter influencing soil structure and friability. Lower soil
organic carbon is also one of the prime factors for soil hardness. Polluted soils also
affect growth of vegetation and root biomass which results in lower C sequestration
in soil profile (and consequently lower content of soil organic matter).
Excessive soil hardness impedes root proliferation and consequently, decreases
the plant’s ability to take up nutrients and water. This also results in poor infiltration(hence, more soil erosion, less storage of water in soil profile, and lower ground-
water recharge). From the standpoint of crop production, the adverse effect of soil
hardness on water flow and storage may be more serious than the direct effect of
soil compaction on root growth. In dry years/seasons, this can lead to stunted,
drought stressed plants due to decreased root growth resulting in yield reductions.
Soil hardness in wet years decreases soil aeration resulting in increased denitrifi-
cation (loss of oxide of nitrogen to the atmosphere). Soil hardness considerably
increases draft power requirement of tillage implements. Hence, its measurement is
important during investigation on the impact of soil pollution.
3.6.1 Measurement of Soil Hardness
A soil penetrometer is an instrument used for estimating soil hardness or compaction.
This shaft with cone is inserted into the soil, where amount of pressure (kg cm�2)
required to cause penetration is taken as measure of soil hardness. The penetrometer
is designed to mimic a plant root. It consists of a 30-degree circular stainless steel
cone with a driving shaft and a pressure gauge. The tip is slightly wider than the
driving shaft to limit friction of the shaft with the soil. The driving shaft is usually
graduated every 3 inches to allow the determination of depth of penetration. Root
penetration decreases linearly with penetration resistance, until almost no root pen-
etrate into soil with a penetration resistance of 300 psi. The measurements should be
taken when the whole profile is at field capacity (approximately 24 h after a
soaking rain).
3.6 Soil Hardness/Compaction 47

3.7 Decrease in Available Soil Moisture Content
Available soil moisture content is an important factor influencing agricultural
productivity and fertilizer use efficiency. Depletion in available soil moisture
content increases the frequency of irrigation for agricultural crop production.
Early wilting is one of the visible symptoms in relation to lower available soil
moisture content. Entry of various pollutants in the agroecosystem causes degra-
dation of soil structure which affects available moisture retention in the soil profile.
As absorption of soil moisture by plant roots also depends on osmotic potential,
increased soil salinity (hence increased osmotic potential) reduces availability of
soil moisture. Entry of salt loaded effluent and wastes of industrial origin therefore,
reduces available soil moisture content in soil. Such impact is more severe in arid
and semi-arid climatic region and on heavy textured soils.
Several soil water/moisture determination methods are available viz.,
thermogravimetric method, electrical resistance method, nuclear techniques, time
domain reflectometry, microwave remote sensing, soil psychrometer, tensiometer
etc. Soil moisture content can be measured in cheaper way with the help of
Tensiometer under under field condition and by gravimetric method in laboratory
as described below.
3.7.1 Tensiometer
A tensiometer consists of a vacuum gauge connected by a tube to a porous ceramic
tip. The tube is filled with water and is normally transparent (made of plexiglass) so
that water level within it can easily be seen. The ceramic tip is permeable and is
saturated by the water in the tube. When inserted at the desired depth of soil profile,
water from the tube permeates to surrounding area through saturated ceramic tip
which is in contact with the unsaturated soils in the root zone. As water moves out
from the tube, a partial vacuum pressure is created which is measured by the gauge.
Vacuum pressure created inside the tensiometer can also be measured with the help
of mercury manometer. However, this type of tensiometer is discouraged keeping
in view of extreme toxicity of the mercury to environment. This measurement is not
a direct measurement of soil water content. Rather, it is a measurement of soil water
tension (also called soil moisture tension). Soil moisture tension increases when
there is less water in the soil. As a result, the tensiometer gauge reads high for dry
soils and low for wet soils.
48 3 Impacts of Soil Pollution and Their Assessment

3.7.2 Gravimetric Method
The soil moisture content may be expressed as the ratio of the mass of water present
to the dry weight of the soil sample, or by volume basis as ratio of volume of water
to the total volume of the soil sample. To determine any of these ratios for a
particular soil sample, the mass of soil moisture must be determined by drying
the soil to constant weight and measuring the soil sample mass after and before
drying. The water mass (or weight) is the difference between the weights of the wet
and oven dry samples. The criterion for a dry soil sample is the soil sample that has
been dried to constant weight in oven at temperature between 100 and 110 �C(105 �C is typical).
Soil moisture %ð Þ ¼ wt: of wet soilð Þ � wt: of dry soilð Þwt: of dry soilð Þ � 100
3.8 Waterlogging due to Poor Infiltration
Infiltration refers to the entry of water into the soil. The rate at which water enters is
referred to as the rate of infiltration. Problem of water-logging occurs if the irrigation
water does not enter the soil rapidly enough during a normal irrigation cycle to
replenish the soil with water needed by the crop before the next irrigation. Poor
infiltration rate reduces the quantity of water stored into the lower depth of soil profile
for later use by the crop. Hard pan due to continuous use of poor quality water in
Bikaner region of Rajasthan (India) was a well known event in 2003–2004, which
drew wide attention by media (Kar et al. 2009). Shallow water table enhanced
chances of contamination in ground water, but poor infiltration rate of soil made it
water logging or swampy lands. Hard pan results from silica cementation and clay
deposition. It may be due to leaching following episodic sheet flooding. Low salinity
water (less than 0.5 dS m�1 and especially below 0.2 dS m�1) tends to leach surface
soils free of soluble minerals and salts, especially calcium, reducing their strong
stabilizing influence on soil aggregates and soil structure. At lower salts and calcium
content, the fine soil particles (clay) disperse, which fill many of the smaller pore
spaces, sealing the surface and greatly reducing the infiltration rate. Such soil crusting
often results in poor crop emergence, in addition to a reduction in water storage in the
soil profile causing water stress between irrigations. The reduced infiltration rate, if
happen to be due to poor quality of applied water, is generally a problem within the
upper few centimetres of soil but occasionally may occur at lower depths.
With the help of infiltrometer, the rate of water infiltration into the soil is
measured. Two factors, salinity and SAR, must be considered together for a proper
evaluation of the ultimate effect on water infiltration rate. Indirectly, comparison of
3.8 Waterlogging due to Poor Infiltration 49

SAR and ESP measured in soil surface of polluted soil and unpolluted soil gives
indication of poor infiltration rate.
3.9 Impacts on Soil Fertility Parameters
Soil fertility refers to the ability of the soil to supply essential plant nutrients and
water in adequate amounts and proportions required for plant growth and repro-
duction in the absence of toxic substances which may inhibit plant growth. A fertile
soil has good physical and chemical environment for growth of plant roots as well
as for beneficial soil microflora and fauna responsible for carrying out nutrient
transformation leading to optimum supply of plant nutrients. Hence, self reliance on
food production for a country depends a lot on the availability and maintenance of
fertile land. Fertility of a soil is identified with its physical, chemical and biological
characteristics in a agro-ecosystem. Some of these soil characteristics are easy to
measure and therefore, are included in the fertility evaluation programme of the soil
testing laboratories in the many countries for the purpose of recommending fertil-
izers to the crops. Entry of pollutants in agroecosystem affects different soil
properties resulting in loss of soil fertility and hence crop productivity. Different
soil physical and chemical parameters are described below which can be used for
evaluating the impact of soil pollution.
3.9.1 Soil pH
The soil pH is a measure of the acidity or alkalinity in its chemical environment and
is defined as the negative logarithm (base 10) of the activity of hydronium ions (H+
or, more precisely, H3O+) in a solution. In general, pH below 7 is acidic and above
7 is alkaline. Different industrial activities have tremendous effect on soil pH. Acid
precipitation nearby industrial area (due to atmospheric emission of SO2 from
smelter industries) and its consequences on soil acidification is of worldwide
concern in the developed countries of temperate region. Continuous use/entry of
alkaline industrial wastes like fly ash, steel/basic slag and cement kiln dust may
alter pH of particularly acid soil. Likewise, continuous use of acidic industrial
effluent (like that from tannery industry, electroplating industry, distillery industry,
acid mine effluent) contaminated water for irrigation may remove essential basic
cations and lower soil pH. Most of the essential plant nutrients in soil are optimally
available in pH range of 6–7.5. Acidification may aggravate heavy metal toxicity to
plant, while depleting availability of phosphorus and molybdenum. On the other
hand, alkalization of soil may lead to deficiency of most of the plant nutrients and
encourage volatilization of N from fertilizer sources. Soil reaction (pH) can be
measured in soil water suspension (1:2 or 1:2.5) and with the help of a pH meter.
50 3 Impacts of Soil Pollution and Their Assessment

The United States Department of Agriculture (USDA) Natural Resources Conser-
vation Service, classifies soil pH ranges as described in Table 3.6.
3.9.2 Electrical Conductivity (EC)
Soil electrical conductivity is an indirect measurement of the concentration of salt
in soil solution (salinity) and is an important indicator of soil health. Electrical
conductivity is defined as the ability of soil suspension to conduct (transmit) an
electrical current and is commonly expressed in units of milli-siemens per meter
(mS m�1). High soil salinity (as indicated by high EC) affects crop selection, crop
yields, plant nutrient availability, and activity of soil microorganisms that influence
key soil processes including the emission of greenhouse gases such as nitrogen
oxides, methane, and carbon dioxide as described in Chap. 4. High salts in soils
occur naturally in arid and semiarid climates due to their net upward movement in
absence of adequate rainfall. Salt levels can also increase as a result of fertilization,
poor quality irrigation water, and land management. Although EC does not provide
a direct measurement of specific ions or salt compounds, it has generally
been correlated with concentrations of NO3�, K+, Na+, Ca+2, Mg+2,Cl�, SO4
�2,
and NH4+. Contribution of some other contaminant ions in EC measurement is also
possible in severely polluted soils. For certain non-saline soils, determining EC can
be a convenient and economical way to estimate the amount of nitrogen
(N) available for plant growth. In soil, EC is measured with the help of conductivity
meter in saturation paste or suspension (1:2 or 1:2.5 soil: water ratio).
Table 3.6 Soil pH Category pH range
Ultra acid <3.5
Extreme acid 3.5–4.4
Very strong acid 4.5–5.0
Strong acid 5.1–5.5
Moderate acid 5.6–6.0
Slight acid 6.1–6.5
Neutral 6.6–7.3
Slightly alkaline 7.4–7.8
Moderately alkaline 7.9–8.4
Strongly alkaline 8.5–9.0
Very strongly alkaline >9.0
Soil Survey Division Staff (1993)
3.9 Impacts on Soil Fertility Parameters 51

3.9.3 Sodium Adsorption Ratio (SAR)
It is a measure of the suitability of water for use in agricultural irrigation, as
determined by the concentrations of solids dissolved in the water. It is also a
measure of the sodicity of soil, as determined from analysis of water extracted
from the soil.
The formula for calculating sodium adsorption ratio is:
S:A:R: ¼ Naþffiffiffiffiffiffiffiffiffiffiffiffiffiffiffiffiffiffiffiffiffiffiffiffiffiffiffiffiffiffiffiffiffiffi12Ca2þ þMg2þ� �q
where, concentrations of Na, Ca, and Mg are in milliequivalents/liter.
In general, the higher the sodium adsorption ratio, the less suitable the water is
for irrigation. Irrigation using water with high SAR value may require soil amend-
ments to prevent long-term damage to the soil. If irrigation water with a high SAR is
applied to a soil for years, the sodium in the water can displace the calcium and
magnesium in the soil. This will cause a decrease in the ability of the soil to form
stable aggregates resulting in a loss of soil structure and tilth. This will also lead to a
decrease in infiltration and permeability of the soil to water leading to problems
related to crop production.
3.9.4 Bulk Density (BD)
Soil density is expressed in two well accepted concepts as particle density and bulk
density. In the metric system, particle density can be expressed in terms of grams
per cubic centimeter (g cm�3). Bulk Density is the oven dry weight of a unit volume
of soil inclusive of pore spaces is called bulk density. The bulk density of a soil
is always smaller than its particle density. The bulk density of sandy soil is about
1.6 g cm�3, whereas that of organic matter is about 0.5 g cm�3. BD is measured
with pycnometer. Bulk density normally decreases, as mineral soils become finer in
texture (Table 3.7). The bulk density varies indirectly with the total pore space
present in the soil and gives a good estimate of the porosity of the soil. Bulk density
is of greater importance than particle density in understanding the physical behavior
of the soil. Generally soils with low bulk densities have favorable physical condi-
tions. Some of the factors affecting the BD are pore space, soil organic matter and
texture.
52 3 Impacts of Soil Pollution and Their Assessment

3.9.5 Available Major and Micro Nutrients
Available plant nutrient contents are important defining parameters of the soil
fertility; these affect the crop productivity of a particular area. Contents of major
nutrients (N, P, K, Ca, Mg, S) and micronutrients (Cu, Zn, Fe, Mn, Ni, Co, Mo, B,
Cl) in soil vary from region to region and their requirement for crop are also
affected by crop and variety, management and environmental factors. For their
quantification, soil testing with the help of standard procedures is the prime way.
Procedures and corresponding limits of different fertility parameters are mentioned
in Tables 3.8 and 3.9.
3.9.6 Soil Organic Matter
Soil organic matter (SOM) consists of plant and animal residues at various stages of
decomposition, cells and tissues of soil organisms, and substances synthesized by
soil organisms. SOM exerts numerous positive effects on soil physical and chem-
ical properties, as well as the soil’s capacity to provide regulatory ecosystem
services. Quantity of SOM is regarded as being critical parameter for different
soil ecosystem functions and resilience capacity. Soil organic matter can be mea-
sured in mainly 4 different ways.
(i) Weight loss due to removal of organic matter by ignition at high temperature:
A known weight of sample in a ceramic/porcellin crucible is heated to a
temperature between 350 and 440 �C overnight (Nelson and Sommers
1996), which is subsequently cooled in a desiccator and weighed. Organic
matter content (expressed as %) is calculated as loss in weight during ignition
divided by the initial sample weight times 100. All weights should be
corrected for moisture content prior to organic matter determination. Ignition
temperature should be maintained below 440 �C to avoid any error due to
destruction of inorganic carbonates present in the sample.
(ii) Weight loss due to removal of organic matter, either by oxidation with H2O2:
The method involves the addition of concentrated H2O2 (30% or 50%) to a
pre-weighed soil sample. H2O2 is incrementally added to the sample until
frothing ceases. The samples may be heated to 90 �C during the process to
enhance speed of oxidation. After completion of oxidation process, the sample
is dried at 105 �C, cooled in a desiccator, and weighed. Organic matter
Table 3.7 Soil BD of various
textural classesTextural class Bulk density (g cm�3) Pore space (%)
Sandy soil 1.6 40
Loam 1.4 47
Silt loam 1.3 50
Clay 1.1 58
Source: http://agridr.in/tnauEAgri/eagri50/SSAC121/lec09.pdf
3.9 Impacts on Soil Fertility Parameters 53

content is calculated as loss in weight during ignition divided by the initial
sample weight times 100%. The major limitation of this method is that the
oxidation of the organic matter may not be complete and the extent of
oxidation varies markedly with soil type.
(iii) Oxidation of organic matter by chromic acid, either by heat of dilution or
applying external heat followed by either determination of the quantity of
chromic acid consumed for oxidation through titration method (Walkley and
Black 1934) or by photometric determination of Cr+3 produced due to oxida-
tion of organic matter (Datta et al. 1962). This method though rapid, suffers
from several limitations like incomplete oxidation of organic matter, use of
toxic heavy metals (Cr) and subsequent disposal of residues, interference with
other ions.
(iv) Oxidation by chromic acid (after carbonate removal) and measurement of CO2
evolved: Soil samples are pre-treated with dilute acid (HCl or H3PO4) to
remove inorganic carbonates and subsequently, organic matter in these sam-
ples are oxidized by chromic acid as above. Carbon dioxide evolved during the
Table 3.8 Standard method of soil fertility analysis
Characteristics Method/references
pH (soil:water 1:2.5) Jackson (1973)
EC (soil:water 1:2.5) (dS m�1) Jackson (1973)
Mechanical analysis Bouyoucos hydrometer (1962)
Organic carbon (%) Walkley and Black (1934)
Available phosphorus (kg ha�1) Olsen et al. (1954)
Available nitrogen (kg ha�1) Subbiah and Asija (1956)
Available potassium (kg ha�1) Jackson (1973)
DTPA extractable micronutrient (mg kg�1) Lindsay and Norvell (1978)
Table 3.9 Rating chart for soil test values of nutrients
Nutrient
Rating
Low Medium High
Organic carbon (%) <0.5 0.50 >0.75
Alkaline KMnO4-N (kg ha�1) <280 280–560 >560
Olsen’s P(kg ha�1) <10 10–25 >25
AmmoniumAccetate –K (kg ha�1) <120 120–280 >280
Sulphur (mg kg�1) <10 10–20 >20
Zinc (mg kg�1) <0.6 0.6–1.2 >1.2
Iron (mg kg�1) <4.5 4.5–9 >9
Manganese (mg kg�1) <5 5–10 >10
Copper (mg kg�1) <0.2 0.2–0.4 >0.4
Boron (mg kg�1) <0.4 0.4–0.8 >0.8
Molybdenum (mg kg�1) <0.02 0.02–0.04 >0.04
Kundu et al. (2012)
54 3 Impacts of Soil Pollution and Their Assessment

process are measured using in a Van Slyke-Neil apparatus by measuring the
change in pressure with a gauge (Nelson and Sommers 1996).
(v) Dry combustion and measurement of CO2 evolved (after removal of carbon-
ates): Generally a automated instrument (TOC analyzer or CHN analyzer) is
used for this type of measurement. Soil samples are pre-treated with dilute
acid (HCl or H3PO4) to remove inorganic carbonates. Subsequently, these are
combusted at elevated temperatures (between 900 and 1500 �C) in a furnace inthe presence of catalysts and pure oxygen stream (Nelson and Sommers 1996).
Evolved CO2 gas is measured using either thermal conductivity or infrared
detectors.
3.9.7 Available and Total Heavy Metals Contents
Collection of soil samples is an important step prior to analysis for heavy metals
content. Sampling area, frequency, time of collection, depth of sampling depend on
the objectives of the assessment and therefore, needs to be given equal or more
importance than analytical methods.
3.9.7.1 Soil
Plant Available Heavy Metals There are several special considerations for the
assessment of hazards due to heavy metal contamination (McLaughlin et al.
2000), including the examination of effects on different components of the envi-
ronment like humans, animals, plants, and microorganisms. Plants essentially take
up heavy metals from the soil via soil solutions (Schindler and Sposito 1991;
McBride 1991). It has been generally accepted that phytotoxicity of a metal is
related to its free ion activity in the solution to which the plant root is exposed
(Lund 1990; Parker and Pedler 1997) and also to soluble metal-organic complexes
and metal-inorganic ligand complexes (Smolders and McLaughlin 1996; Huang
et al. 1997; Jones 1998). Recent studies have also shown that less aggressive
reagents that extract predominantly soluble and exchangeable fractions, most
notably, dilute salt solutions such as 0.01 M CaCl2, are frequently better at
predicting plant availability of excess heavy metals in soils than the traditional,
more aggressive tests involving the use of reagents such as hydrochloric acid,
diethylene triaminepentaacetic acid, and ethylene diamine tetraacetic acid (Houba
et al. 2000; McBride et al. 2003, 2009; Menzies et al. 2007; Meers et al. 2007).
After a comprehensive review of literature, McLaughlin et al. (2000) concluded
that soil tests based on the determination of the most easily extractable metal pools
(like the neutral dilute salt-extractable fraction) appear to reflect the current toxicity
better than total metal concentrations or the amounts of metals removed by strong
extractants. To estimate plant-available fractions of metals, air-dried soil was
extracted with 0.01 M CaCl2 solution in the ratio of 1:2.5 after shaking for 4 h.
3.9 Impacts on Soil Fertility Parameters 55

Metals in extracting solution can be determined using Atomic Absorption Spectro-
photometer equipped with graphite furnace (GF-AAS) or Inductively Coupled
Plasma-Optical Emission Spectrometer (ICP-OES).
Total Heavy Metal Contents Heavy metals can be extracted from the oven-dried
soil samples by using a wet digestion method involving HF, HNO3, H2SO4, and
HClO4 as described by (Baker and Amacher 1982). Metals were detected in
extracted samples by using inductively coupled plasma-optical emission
spectroscopy.
3.9.7.2 Plant
Plant parts to be analyzed for heavy metals content depend upon the purpose of
impact assessment and it may be edible parts (in case of food chain contamination
assessment) or leaves and shoots (as in case of fodder for animal). As translocation
of metals within different plant parts is an important phenomenon, their distribution
may vary with plant parts. Therefore, leaf samples should be collected from a larger
number of plants from an uniform positions in a representative area (like youngest
full grown leaf). After collection, plant samples are washed thoroughly in deionized
water, and dried in the oven at 70 �C. Thoroughly pulverized biomass samples are
digested in di-acid (HNO3:HClO4 at 10:1 ratio) for the analysis of heavy metals.
3.9.8 Soil Enzyme Activity
Soil enzymes, mainly of microbial origin, are known to play a substantial role in
maintaining soil health and its environment. Their activity releases nutrients into
the soil by means of organic matter degradation. In the context of soil quality
assessment, their activities can be used as measures of microbial activity, soil
fertility, and toxic effects of pollutants. Activities of soil enzymes are assessed
using specific chemical compound, known as substrate and are quantified by
measuring the concentration of the product of the substrate specific biochemical
reaction. Simple laboratory biochemical assays are available for a large number of
soil enzyme activities, viz., dehydrogenase, urease, amidases, phosphatases,
arylsulphatase, cellulases, glucosidases, and phenol oxidases (Dick et al. 1996;
Tabatabai 1982). Role of these soil enzymes in soil process of agricultural impor-
tance is presented in Table 3.10.
56 3 Impacts of Soil Pollution and Their Assessment

3.9.9 Nitrogen Fixation Capacity
Nitrogen fixation from its gaseous form in the atmosphere to its compounds which
plants and other organisms can use (either NH4+ or NO3
�) is mediated either by
bacteria in symbiotic relationships with vascular plants, or by symbiosis between
cyanobacteria and fungi (lichens) or plants, or by free living heterotrophic or
autotrophic bacteria that are typically associated with soil. Ecological constraints
that may limit the success of N-fixing plants include the availability of soil nutrients
other than N (especially P or Mo), the existence of poor edaphic conditions such as
high acidity, alkalinity or aridity, removal of N-fixing species by preferential
grazing and removal of woody dicots (including woody legumes) by fire ( Fredan
2011).
Species potentially able to fix N2 (target species), or not (reference species) are
sampled in each plot. The target species are legumes with a known nodulation
capacity or without information on nodulation. Samples are collected from all the
target species found in each site and also from a reference species. After collection,
completely expanded healthy green leaves were selected, forming a composite
sample of 200 g of leaves per plant. The leaf material was oven dried at 60 �C for
72 h and then ground to fine powder. Total N was analyzed by micro Kjeldhal
methodology and 15N abundance by mass spectrometry and expressed in “delta”
notation, which is the deviation per thousand (%) of 15N abundance of the sample in
relation to the standard.
δ ¼ Rsample
Rstandard� 1
� �� 1000
where, Rsample and Rstandard are the ratio 15N:14N of the sample and the standard
(atmospheric N2), respectively (Dawson et al. 2002).
The enzyme responsible for N2-fixation (i.e. nitrogenage) also reduce acetylene
(C2H2) to ethylene (C2H4) (Dilworth 1966). This process has also been used to have
quantitative estimation of N2-fixation. Although for quantitative determination of
N2-fixation15N techniques should be used, the acetylene reduction assay is still
Table 3.10 Soil enzymes as indicators of soil health
Soil enzyme Enzyme reaction Indicator of microbial activity
Dehydrogenase Electron transport system C-cycling
β-glucosidase Cellobiose hydrolysis C-cycling
Cellulase Cellobiose hydrolysis C-cycling
Phenol oxidase lignin hydrolysis C-cycling
Urease Urea hydrolysis N-cycling
Amidase N-mineralization N-cycling
Phosphatase Release of PO4� P-cycling
Arylsulphatase Release of SO4� S-cycling
Das and Verma (2011)
3.9 Impacts on Soil Fertility Parameters 57

being used widely because it provides a highly sensitive and inexpensive way to
quantify the relative nitrogenase enzyme activity in N2 fixing samples of soil. In this
method, soil samples are incubated in a closed chamber with small quantity of
acetylene and after incubation period ethylene produced is measured using gas
chromatography.
3.9.10 Microbial Diversity Measurement
Microbial diversity can be defined as the range of different kinds of unicellular
organisms, bacteria, archaea, protists and fungi in soil. Various microbes thrive
throughout the biosphere, defining the limits of life and creating conditions condu-
cive for the survival and evolution of other living beings. The different kinds of
microbes are distinguished by their differing characteristics of cellular metabolism,
physiology, and morphology, by their various ecological distributions and activi-
ties, and by their distinct genomic structure, expression, and evolution. The diver-
sity of microbes presently living on earth is known to be high and is thought to be
enormous, but the true extent of microbial diversity is largely unknown. New
molecular tools are now permitting the diversity of microbes to be explored rapidly
and their evolutionary relationships and history to be defined.
Bacteria, fungi and actinomycetes are estimated by the serial dilution and plating
technique as described by Rolf and Bakken (1987). Microbe specific media are used
for culture of microorganisms which are plated on the glass petri dish. Small
volume of water extract from soil (generally 0.1 mL) after 101 to 105 dilutions is
poured on the surface of petri dish with the help of a micropipette and is evenly
spread with the help of a sterile spreader and incubated at 30 � 2 �C. Colony count
was carried out daily up to 10 days. Total media specific microorganism are
estimated from the number of colonies formed on the media plate after multiplying
by dilution factor and results are reported as colony forming units (CFUs). Total
bacterial population counts in diluted extracts can also be done through direct
observation of cells in a specialized counting chamber slide viewed under phase
contrast microscopy.
One gram of soil has been reported to contain up to ten billion microorganisms
and thousands of different species. Major limitation of above technique is that most
of the microorganisms (more than 99%) are unculturable and therefore true picture
of microbial biodiversity is not obtained. In recent years, soil microbial diversity is
being assessed in other ways using instrumental techniques. Using metagenomic
tools, genetic materials recovered directly from environmental samples. This broad
field is also referred to as environmental genomics, ecogenomics or community
genomics. Polymerase chain reaction (PCR), a biomedical technology in molecular
biology is used to amplify a single copy or a few copies of a piece of DNA across
several orders of magnitude, generating thousands to millions of copies of a
particular DNA sequence. With the help of various microbial tools and techniques,
large number of species of microorganisms can be measured.
58 3 Impacts of Soil Pollution and Their Assessment

3.9.11 Soil Quality Assessment
Soil is a dynamic, non-renewable resource. If neglected or misused, soil ecosystem
will cease to function properly and will result in adverse consequences on the
cycling of nutrients and organic matter. Traditionally, the quality of soil has been
mainly associated with its productivity, whereas more recently, the definition has
been expanded to include the capacity of a soil to function within ecosystem
environmental quality, and promote plant and animal health.
Under agroecosystem, major emphasis of soil quality assessment is to evaluate
its fitness to support crop growth without resulting in soil degradation or otherwise
harming the environment. At the beginning of soil-quality assessment, there is a
need to have answer for two main questions: (i) how does the soil function; and
(ii) what procedures are appropriate for making the evaluation. Subsequently, a
range of parameter values that indicate a soil is functioning at full potential can be
computed using landscape characteristics, knowledge of pedogenesis, and a more
complete understanding of the dynamic processes occurring within a soil. Neces-
sary steps for soil quality estimation can be mentioned as below (Table 3.11):
While selecting soil quality indicators, their desired attributes required to con-
sidered are like
• should represent desired soil function
• should be sensitive to changes in land use or management
• should be easily measured and reproducible
• should be reliable
• should be applicable under field conditions
Soil quality depends on a large number of chemical, physical, biological and
biochemical properties, and its characterization requires the selection of the prop-
erties most sensitive to change in management practices, called indicators. Since it
is impractical to measure every ecosystem or soil property, many researchers have
proposed a minimum data set, which is the smallest set of soil properties or
Table 3.11 Sequential framework to evaluate soil quality
Steps Sequential framework Question implied by the framework
1 Purpose What will the soil be used for?
2 Functions What specific role is being asked of the soil?
3 Processes What key soil processes support each function?
4 Properties/attributes What are the critical soil properties and their critical or
threshold levels?
5 Indicators, surrogates,or
pedotransfer function
When the attribute is difficult to measure or not available,
which indirect or related property or properties can be
used in its place?
6 Methodology
standardization
What methods are available to measure the attribute?
Technical rules and protocols for soil sampling, handling,
storage, analysis and interpretation of data.
3.9 Impacts on Soil Fertility Parameters 59

indicators needed to measure or characterize soil quality. Identifying key soil
properties or attributes that are sensitive to change in soil functions establish a
minimum data set. Different kinds of land uses may require increased capacities of
certain soil functions and, thus, prefer certain indicators over others for assessment.
For example, a wetland soil has a different role than a agricultural soil for the soil
function, partitioning of water. Therefore, infiltration would not be a useful indi-
cator of wetland soil quality, but would be very useful for assessing the quality of
most agricultural soils. Soil organic matter (SOM) is one of the more useful
indicators of soil quality, because it interacts with other soil components; affecting
water retention, aggregate formation, bulk density, pH, buffer capacity, cation
exchange properties, mineralization, sorption of pesticides and other agrochemi-
cals, colors (facilitate warming), infiltration, aeration and activity of soil organism.
3.10 Computation of Soil Quality Index fromthe Perspective of Capacity of Soil to Produceand Sustain Agricultural Productivity
The minimum data set of indicators are identified that best represent soil function
and, therefore, only those indicators which are thought to contribute to the function
of interest (management goals) are included for indexing soil quality. After iden-
tifying indicators that best represents soil functions, weight-factors are assigned to
each attributes on the basis their importance and relative contribution to the soil
function. Sum of all weight-factors are normalized to 100%. Once weightage is
assigned to the indicators, each attributes are characterized into different classes
with specified marks, called score (maximum mark for most desired class). Ana-
lytical values for each indicators under minimum data set are transformed into
scrore depending on the class in which it belongs.The soil quality index (SQI) is
calculated by using the following equation,
SQI ¼X
WiMi
where,
Wi ¼ Weight of the indicators
Mi ¼ the score of the indicators classes
The SQI is calculated by two steps: (i) multiplying weight of indicator and score
value of the indicator and (ii) summing up the multiplied values of all the indicators
to derive the SQI value for a particular soil.
60 3 Impacts of Soil Pollution and Their Assessment

3.11 Major Instances of Soil Contamination in the Worldand Their Impact on Environment
Ever since human started understanding the natural processes operating in the
environment and began manipulating environmental functioning through different
inventions for enhancing both their own chance of survival as well as comfort,
alteration and degradation of environment began, whose pace increased continu-
ously as civilization progressed with time. However, extent of environmental
degradation became severe as process & magnitude of industrialization took rev-
olutionary turn since late eighteenth century. As researches on environmental
consequences always lagged behind the degrading processes due to anthropogenic
activities, regulations to control industrial activities were formulated and
implemented much later and as a result, severe consequences on environment
happened during this transition period and cases of severe environmental damages
were reported from different parts of the world. Some of the widely reported
instances of land/soil pollution are described briefly below:
3.11.1 The Love Canal Tragedy
Love Canal is one of the most widely discussed environmental tragedies in Amer-
ican history. At the beginning of the twentieth century, William T. Love dug a canal
for the purpose of generating and supplying hydropower to meet the energy
requirement of industrial and residential areas in his community on the edge of
Niagara Falls in New York. However, Love couldn’t complete his project due to
certain economic and technical reasons. During the 1920s, the canal he dug was
turned into a landfill operated by a chemical company where the premises had been
filled with waste products resulting from the manufacturing of chemicals as well as
with municipal wastes. Subsequently after few decades, several houses and a ele-
mentary school were built on the site. Over the years, the underground containers
filled with approximately 21,000 tons of chemical waste were corroded. In 1977, a
record rainfall brought about a tragic consequence. The waste began to leach into
people’s homes, backyards, and playgrounds. In American history, this tragedy is
termed as one of the vast horrifying environmental disasters. The analysis of soil
and sediment samples collected from Love Canal area indicated the existence of
more than 200 various types of organic compounds. Among the pollutants, dioxin
was found most toxic and its highest concentration (300 ppb) was found in the
storm sewer in the adjoining area. Love Canal had been officially associated with
high rates of birth defects, miscarriages, and other severe illness resulting from land
contamination (Phillips et al. 2007). Following a federal emergency declaration in
May 1980, several remedial measures were taken viz., landfill containment with
leachate collection, treatment, and disposal; excavation and interim storage of the
sewer and creek sediments; thermal treatment of sewers and creeks sediments.
3.11 Major Instances of Soil Contamination in the World and Their Impact on. . . 61

These remedial measures eliminated the significant contamination exposure path-
ways, making the site safe for nearby residents and the environment.
3.11.2 Chernobyl Nuclear Disaster
World ill-famous Chernobyl disaster, known as the Chernobyl accident was a
catastrophic nuclear accident and happened on 26th April 1986 at the nuclear
power plant in Ukraine. Both acute radiation effects in the initial periods (radiation
death of plants and animals, loss of reproduction, etc.) and long term effects
(change of biodiversity, cytogenetic anomalies, etc.) have been observed in the
affected areas. The disaster happened in the fourth plant of Chernobyl located in the
city of Pripyat nearby Dnieper river, when sudden power surge followed by failure
of the emergency shutdown system caused a strong explosion in the reactor vessel.
More than 70% of area in Belarus, Russia and Ukraine were contaminated with the
radioactive materials due to their aerial spread (IAEA 2006). The toxicity of
disaster was huge, in which 237 plant workers were highly exposed, 134 were
diagnosed with acute radiation syndrome and more than 28 died in this massive
calamity. The zone was demarcated as a Chernobyl exclusion zone and more than
116,000 neighbouring residents were shifted to a safe place to prevent exposure to
harmful radiation. Environmental samples were periodically examined to see the
toxic effect of this accident on soil – plant –human system. The concentrations of
radioactivity in air, agricultural plants, animals and soil were more in the initial
months of the incidence, which might be due to surface deposition of contaminants.
This early period of the accident was more toxic due to fast decay of 131I. Such
toxicity was also observed in the milking animals, when the radioactive iodine was
speedily absorbed by milk. This impaired the normal functioning of thyroid gland
in contaminated milk consuming people in the belt of Belarus, Russia and Ukraine.
Apart from 131I, radioisotopes of caesium (134Cs and 137Cs) also created the human
health problems in the affected areas. The collected samples contained 137Cs at
concentration level of more than 100 Bq per kilogram, the limit requiring national
remedial action.
The radionuclides were absorbed by the plant roots and transferred to various
edible parts and therefore, soil and food contamination were regularly monitored in
the affected area. The half life of cesium (134Cs) is 2.1 years and in the mid 1990s
the level of 137Cs in soil is more toxic and harmfully affected the agricultural
production system (IAEA 2006). The radioactive caesium content in foodstuffs was
influenced not only by deposition levels but also by types of ecosystem, soil as well
as management practices. The persistent problems of residual radioactivity in the
affected areas occurred in extensive agricultural systems on soils with a high
organic content and in animals grazing on unimproved pastures that are
not ploughed or fertilized. The contaminated environment affected the primary
production system, mostly soil related production activities. The long term intake of137Cs even at smaller concentration, contaminated milk and animal products, and
62 3 Impacts of Soil Pollution and Their Assessment

food crops sufficiently contributed the harmful level of radioactive in human
internal dose. The regular monitoring of affected area showed the decreasing
concentration of 137Cs in vegetables as well as animal foodstuffs. The trace levels
of 137Cs in the human body persisted for a longer time and affected the healthy
function of organs. The other radioactive materials with longer half life like
Strontium (90Sr), plutonium isotopes and Americium (241Am) levels were found
at insignificant levels in human organs. In the Chernobyl exclusion zone, agencies
suggested that the environmental remediation part is still required. The most
effective countermeasures in the early phase were exclusion of contaminated
pasture grasses from animals’ diets and the rejection of milk.
3.11.3 Cadmium Contamination of Soils in China
The toxicity of Cd is considered most hazardous among the heavy metals as it has
several adverse impacts on soil microorganisms, plants, animal and human health.
A number of incidences of Cd contamination have been reported across the world.
A highly discussed case of Cd contamination happened in 2006 at the Xianghe
Chemical Factory, which is situated nearby the Liuyang River (Guangwei 2014). In
the adjoining Shuangqiao village, people were mostly dependent on this industry
for livelihood. The industry initially produced zinc sulphate in powdered and pellet
form to be used as the animal food supplements. Afterward, it started producing
indium, a highly priced metal (more than gold) in international market. However in
the process, it also generated Cd as a byproduct. In the year 2009, adverse effects of
Cd contamination was observed initially among Xianghe Chemical Factory
workers and subsequently, the number of victims of the tragedy increased enor-
mously in Shuangqiao village. The research agencies monitored the source and sink
of Cd contamination and found that most of the soil and agricultural food crops
were highly contaminated with this metal. More than 500 villagers were worst
affected with Cd toxicity and several of them died during the course of the
investigation. The run-off from the industries carrying sludge during rainy season
contaminated 659 acres area nearby the plant. Because of this unfortunate tragedy,
Shuangqiao village is infamously known as Cd village across the globe.
3.11.4 Thermal Power Plant Disaster
Thermal power plants are one of the backbone of industrial growth as well as
upliftment of society. However, accidents in such seemingly innocuous industry
can create havoc in the land of nearby areas. In this line, one of the major
disaster happened in the morning of December 22, 2008 at Roane County,
Tennessee, USA, due to rupture of ash dyke and as a result, 4.13 million m3 of
coal fly ash slurry spilled out and covered 84 acre area nearby the thermal power
plant. The coal fired power plant was situated across the Clinch River in the
3.11 Major Instances of Soil Contamination in the World and Their Impact on. . . 63

Kingston city. In order to prevent aerial release, the fly ash generated as a
byproduct of coal combustion was being transported in the ash dyke pond as
slurry which was stored in dredge cells in wet form. After rupture of ash dyke
during the accident, the slurry got released in the Emory River and spread in the
nearby fields. The quantum of release was about 4 million m3 and slurry covered
the land surface by up to 1.8 m high as measured by the survey of contaminated
area. This disaster created massive damage to residential buildings, water
bodies, agricultural fields and worst damage to roads, ruptured telephone and
gas lines, railway track, trees and power lines. The disaster killed fish population
in a large scale. An assessment study was carried out immediately after the
tragedy, which indicated that surface release of coal ash with high levels of toxic
elements (75 mg As kg�1; 150 μg Hg kg�1) and radioactivity (226Ra þ 228Ra ¼8 pCi g�1) to the environment had potential to generate atmospheric pollution
through suspended fine particles posing a health risk to local communities, to
contaminate of surface waters in low lying areas through leaching of contami-
nants, to poison fish with As and methyl mercury (Ruhl et al. 2009). However,
an 18 months investigation after the accident indicated that contaminant levels
in the downstream river water were relatively low (below the EPA drinking
water and ecological thresholds); although elevated levels of arsenic (up to
2000 μg L�1) were found in stagnated surface water bodies and in pore water
extracted from the river sediments downstream from the spill (Ruhl et al. 2010).
Most of the fly ash was removed from the deposition area by August 2010
through extensive dredging; however, about 10% of ash was left as river
sediments to avoid disturbing legacy contamination in the downside with haz-
ardous contaminants. Through a study, a concern was raised on the migratory
potential of toxic trace metals from aquatic system of the affected site to the
terrestrial system through food chain (Beck et al. 2013).
3.11.5 Seveso Disaster (Chemical Manufacturing Plant)
This disaster happened on July 10, 1976 in a small chemical plant nearby Milan,
Italy. The industry was manufacturing 2,4,5-trichlorophenol from 1,2,4,5-
tetrachlorobenzene with the help of nucleophilic aromatic substitution reaction
with sodium hydroxide. An explosion in the industry released a toxic cloud into
the atmosphere containing about 6 tonnes of TCDD (2,3,7,8 -tetrachlorodibenzo-p-
dioxin), which contaminated a densely populated area of about 18 km2, lying
downwind from the site (Mocarelli et al. 1991; Consonni et al. 2008).
For effective remediation plan, entire affected area was categorized into three
groups i.e. A, B and R, on the basis of concentrations of TCDD in surface soil. The
class A area with the 736 resident population was having >50 μg m�2 TCDD
concentration in soil. Class B area had 4700 residents and the concentration of
TCDD was in the range between 5 and 50 μg m�2 in upper soil layer. The class R
area with resident’s population of 31,800 was having lower concentration of TCDD(<5 μg m�2). In that tragic disaster, about 3300 animals mostly poultry and rearing
64 3 Impacts of Soil Pollution and Their Assessment

rabbits died. The toxicity of this chemical was widely found among inhabitants in
the area and more than 15 children were hospitalized due to skin inflammation and
irritation (De Marchi et al. 1996). Examination of about 1600 peoples of the
affected area indicated that 447 people suffered skin lesions or chloracne (acne-
like eruption of blackheads, cysts, and pustules). The government agencies issued
the awareness guidelines regarding the level of pollution and associated health
problems. The local peoples were advised not to touch and eat the vegetables and
fruits grown in this contaminated area. To prevent the spread of toxicity due to
TCDD into the food chain, a larger number of animals (more than 80,000) were
slaughtered in the year 1978. During 50 days after accident, class A area was
evacuated completely and fenced. A study conducted after 14 year of the disaster
showed that thousands of peoples in the area was suffering from toxicity mainly in
the form of chloracne. In the adjoining area of the accident, the toxic effects of
TCDD like neuropathy and liver enzyme induction, birth defects etc. were observed
among the population. The chemical contamination also enhanced the incidences of
mortality due to cardiovascular and respiratory diseases and the psycho-social
consequences also dominated in these areas. Apart from this, occurrence of diabetes
in the human population was found enhanced. The mortality due to gastrointestinal
cancer and cancer in lymphatic and hematopoietic tissue was also increased.
3.11.6 Organic Pollutants Contamination from PCBManufacturing Industry at Brescia (Italy)
The case is related to food and human exposure of a large contamination of
agricultural soil caused by industrial PCB mixtures.The source the pollutants was
an industrial plant inside Brescia city at the North-West of Italy, where about
31,000 ton of polychlorinated biphenyls (PCBs) were produced during
1930–1983. During monitoring programs for construction of a municipal waste
incinerator near the industrial plant, high PCB levels (3000–6000 folds higher than
the allowable limit of 0.001 mg/kg) were observed in the soils of an agricultural
area where several small farms were located (Brievik et al. 2002). The contamina-
tion process was not caused by a single major release of products; but probably due
to continuous leakage during operational phase of industry. Although production of
PCB was terminated in 1984, the contamination remained undetected for many
years. The vehicle of the propagation of the contamination into the environment
was the dispersion with irrigation water of contaminated sediments of a water
stream passing through the plant. The farmers had been consuming food, such as
milk and meat, produced in their own farms for a long time. Total levels of PCDD/
Fs varied from 8 to 592 pgTE(WHO)/g for soil samples and when the dioxin-like
PCBs (dl-PCBs) are included, the levels varied from 14.6 to 1033.7 pgTE(WHO)/g
(Turrio-Baldassarri et al. 2007). In several cases, the legal limit was exceeded by
more than one order of magnitude, with the highest contamination in some
3.11 Major Instances of Soil Contamination in the World and Their Impact on. . . 65

agricultural areas and in the surrounding zones. In the forage samples, total levels of
PCDD/Fs varied from 0.29 to 2.04 pgTE(WHO)/g and, when dl-PCBs are included,
this range increased from 2.04 to 4.75 pgTE(WHO)/g. Vapourization from con-
taminated land followed by condensation on leaf surface was ascribed as probable
way PCB contamination of the forage. The main component of the contamination
source is probably a heavy PCB mixture, such as Aroclor 1262. The most severely
contaminated area had some very peculiar features: four small farms were located
in it, and they included a sort of self contained food chain. Cows and calves were
grown and fed, partially or totally, on contaminated forage, while the farmers as
well as their family members consumed most of the meat and milk produced in their
farms. Due to a relatively closed system of food chain, families experienced a long-
lasting exposure to these chemicals, and exhibited a mean blood level of PCB,
PCDD and PCDF of 419 pgTE(WHO) g�1 lipid, roughly eight times higher than the
population of uncontaminated area from the same region (Turrio-Baldassarri et al.
2008). The contamination levels in the peri-renal fat, liver and milk of the overall
28 contaminated bovines indicated that TEQ levels varied from 30 to 81 pgTE
(WHO) g�1 in perirenal fat, from 107 to 138 pgTE(WHO) g�1 fat in liver and from
45 to 50 pgTE(WHO) g�1 fat in milk, which were roughly tenfold higher than the
European limits. Non-ortho dioxin-like (dl)PCBs (predominantly PCDF) were by
far the largest contributors to toxicity in all the biological samples from forages,
bovines and consumers of contaminated food. The indicator PCB levels varied
within the range 226–664 ng g�1 in peri-renal fat; 929–1822 ng g�1 fat in liver;
183–477 ng g�1 fat in milk and these levels were about 100 times higher than the
regional background (Turrio-Baldassarri et al. 2009) indicating grave environmen-
tal consequences due the manufacturing industry.
3.11.7 Soil Contamination at Palmerton, Pennsylvania, USAdue to Zinc Smelter
In the year 1889, a Zn smelter started in Pennsylvania, USA and continuously
operated up to 1980. During its operation, plant emitted toxic metals Zn and Cd
as oxides at high concentration (more than permissible limits of the toxic metals as
per the industrial norms). The rate of emission of Zn, Cd, Pb were 3575, 47 and
95 Mg per year respectively for the more than 80 years of duration (USEPA 1987).
Spread of these pollutants extended up to about 50 km away from the plant (Tan
1988) and forest soils at 100 km away from the plant recorded significantly higher
concentrations of these metals (Anderson et al. 1980). This resulted in ecosystem
collapse and prevented plant growth across a 3000-acre area. Due to lack of
protective vegetative cover, erosion of contaminated soil impacted the nearby
Lehigh River and Aquashicola Creek. Forage samples collected from farms nearby
Palmerton area showed high concentration of Zn and Cd, whereas Pb concentration
ranged up to 25 mg kg�1 (Chaney 1988). In the town and lawn area of Palmerton,
66 3 Impacts of Soil Pollution and Their Assessment

very high level of contamination with Zn (10,000 mg kg�1) and Cd (100 mg kg�1)
was observed in the soils. The concentration of heavy metals was dangerously high
in the soils at close vicinity of the smelter; the Zn concentration ranged from 26,000
to 80,000 mg kg�1 and Cd reached to the level of 900–1500 mg kg�1 (Buchauer
1973, Jordan 1975). Higher concentration of Zn, Cd and Pb reduced the microbial
activities in soil (Strojan 1978).
3.11.8 Soil Contamination at Noyelles-Godault, Francedue to Lead Smelter
A lead smelter company operated for more than a century in northern France and
emitted considerable amount of heavy metals in surrounding areas (18.4 tons of Pb,
26.2 tons Zn, 823 kg Cd emitted in the year 2001). As a result, top 30 cm soils of area
surrounding the smelter plant had been highly contaminated with heavy metals Cd,
Pb and Zn (to a lesser degree with As, Hg, Sb and In) (Godin et al. 1985; Sterckeman
et al. 2000, 2002). Even though smelter plants were shut down from operation in
2003, these left behind a large area of spoiled agricultural and urban soils as well as a
serious socio-economic crisis. The epidemiological studies carried out during the
industrial activity showed that Cd concentration in blood was higher among children
(2–4 years old) within 4 km of a zinc smelter compared with children living more
than 4 km away (Leroyer et al. 2000, 2001). The geometric mean of the blood-lead
levels of children living on the polluted site was 39.5 μg l�1 and that of the
non-exposed children was 30.6 μg l�1. About 10–15% of children had blood Pb
levels higher than the clinically identified critical level of 100 μg Pb L�1. The soil
particles of lawn and kitchen garden of the area had 47–68% human bioaccessible
heavy metals. Due to such high bioaccessibility in the contaminated soil, Pb was the
main concern for children and induced a relatively high health risk through soil
particle ingestion (Pelfrene et al. 2013). On the other hand, total soil Cd concentra-
tions in most soils exceeded the health risk level derived through site-specific
assessment criteria using the SNIFFER method, particularly from consumption of
vegetables grown on it.
The environmental problems including adverse effect on human health induced
by high contamination of the area had been reported even after closing-down of
smelter plants, especially in the urban soils, where metal concentrations of agricul-
tural soils were found very high (Douay et al. 2008a). Various studies have shown
that vegetables grown in kitchen gardens close to smelter plant, both before and just
after closing, frequently exceeded the European legislation limits for Cd and Pb
concentrations (Douay et al. 2008a; Pruvot et al. 2006). The Cd and Pb contents in
the agricultural soils of the contaminated area were respectively 20 and 15 times
above their contents in those from unpolluted area. Similarly, contents of Cd and Pb
in kitchen garden soils located near the smelter were respectively about 16 and
10 times above the reference garden soils (Pruvot et al. 2006). The highest
3.11 Major Instances of Soil Contamination in the World and Their Impact on. . . 67

concentrations in crops (agricultural crops, home grown vegetables and grass of
lawns) were found in the polluted area around the smelter (up to 8–16 times above
the reference areas according to the element). Seven years after the close-down of
smelting activities, the agricultural and urban soils were strongly contaminated by
Cd, Pb, and Zn; the effect being more on kitchen garden topsoils in the nearby urban
area (Douay et al. 2013). A high proportion of the vegetables produced in the
kitchen gardens did not conform to the European foodstuff legislation indicating
persisting nature of the risks of environment and the population’s health due to
heavy metals pollution in soil. The contaminated dusts existing in the area imme-
diately after closure of smelting operation were also found a potential source of
contamination of vegetables in the surrounding area (Douay et al. 2008b).
3.11.9 Itai-Itai Disease in Japan due to Cadmium Pollution
Itai-itai disease refers to osteomalacia which is associated with softening of bones
as a result of renal tubular dysfunction. The disease was first reported among
residents in a number of cadmium polluted areas throughout Japan, more severely
in the districts of Toyama near the Jintsu River, in Tsushima of Nagasaki region, in
the Kakehashi river basin of Ishikawa region, and in the Ichi river basin of Hyogo
region (Yoshida et al. 1999).
The disease was caused by the toxicity of Cd, mostly in Cd contaminated sites or
mining area of gold, zinc, copper and silver. The mining area released huge
amounts of Cd into the environment particularly into famous river Jintsu and its
tributaries. The contaminated river water was used mainly for irrigation of rice
fields and also for drinking, washing, fishing purpose etc. by the downstream
populations. Due to continuous irrigation with Cd contaminated river water, high
Cd was found in the rice grains and its consumption resulted Cd accumulation in the
people. Because high cadmium levels had been found in rice grains, problem of
cadmium toxicity was not only confined to the locality in which the cadmium was
originally dispersed into the soil but was also reported from other areas adjoining to
it (Friberg et al. 1971).
3.11.10 Red Mud Disaster in Hungary
Red mud is the fine fraction by-product of the Bayer process for refining bauxite for
alumina production. A major industrial disaster occurred in Ajka (Hungary) in
October 2010 when dam of the waste reservoir of the alumina refining plant
collapsed releasing about 1 million m3 of highly alkaline, metalliferous red mud
sludge. The sludge flooded three downside villages. Ten people died, and about
150 people were injured in the accident mainly from chemical burn due to high pH
(>12) of the waste material. The low-lying agricultural lands in the region of 10 km2
68 3 Impacts of Soil Pollution and Their Assessment
area on the flood plains of the Torna Stream and Marcal River were impacted by the
spill, alongside up to 120 km of river channel where the red mud was also deposited.
Besides caustic burn related injury, no major health effect was observed aftermath
of accident. Sludge flow into the nearby river severely destroyed aquatic life. After
2 years of accident, river water recorded moderately higher levels of As and Ni
compared to those observed in the pre-spill period (Nagy et al. 2013). The contam-
inated land area was sealed to prevent cultivation. Long-term salinization of soils
was identified as major risk affecting plant growth. Salinity build up in soil and
release of oxyanion-forming metals and metalloids (e.g., Al, As, Cr, Mo, and V) in
the soil–water environment were the potential impact of the accident due to red mud
pollution (Mayes et al. 2016).
Extensive remedial measures were carried out in the area which included
collection & removal of red mud and acid neutralization of leachate. These mea-
sures had resulted very rapid recovery toward pre-spill conditions of soils, stream
sediments, waters and aquatic biota (fungi, invertebrates and fish) (Mayes et al.
2016).
References
Anderson AM, Johnson AH, Siccama TG (1980) Levels of lead copper, and zinc in the forest floor
of the northeastern United States. J Environ Qual 9:293–296
Arora NK, Khare E, Singh S, Maheshwari DK (2010) Effect of Al and heavy metals on enzymes of
nitrogen metabolism of fast and slow growing rhizobia under explanta conditions. World J
Microbiol Biotechnol 26:811–816
Aslam U, Ahmad I, Hussain M et al (2014) Effect of heavy metal pollution on mineral absorption
in sunflower (Helianthus annuus L.) hybrids. Acta Physiol Plant 36(1):101–108Awashthi SK (2000) Prevention of food adulteration act no. 37 of 1954. Central and state rules as
amended for 1999. Ashoka Law House, New Delhi
Baker DE, Amacher MC (1982) Nickel, copper, zinc and cadmium. In: Page AL, Miller RH,
Keeney DR (eds) Methods of soil analysis, Part 2, Chemical and microbiological properties,
Agronomy monograph no. 9. ASA-SSSA, Madison, pp 323–336
Beck ML, Hopkins WA, Jackson BP (2013) Spatial and temporal variation in the diet of tree
swallows: implications for trace-element exposure after habitat remediation. Arch Environ
Contam Toxicol 65:575–587
Bianucci E, Fabra A, Castro S (2011) Cadmium accumulation and tolerance in Bradyrhizobium
spp. (peanut microsymbionts). Curr Microbiol 62:96–100
Bondarenko O, Rahman PKSM, Rahman TJ, Kahru A, Ivask A (2010) Effects of rhamnolipids
from Pseudomonas aeruginosa DS10-129 on luminescent bacteria: toxicity and modulation of
cadmium bioavailability. Microb Ecol 59:588–600
Bouyoucos GJ (1962) Hydrometer method improved for making particle size analysis of soils.
Agron J 54:464–465
Brievik K, Sweetman A, Pacyna JM, Jones KC (2002) Towards a global historical emission
inventory for selected PCB congeners- a mass balance approach 1. Global production and
consumption. Sci Total Environ 290:181–198
Buchauer MJ (1973) Contamination of soil and vegetation near a zinc smelter by zinc, cadmium,
copper and lead. Environ Sci Technol 7:131–135
References 69

CAC (2011) Working document for information and use in discussions related to contaminants
and toxins in the GSCTFF (CF/5 INF/1), Codex Alimentarious Commission (Joint FAO/WHO
Food Standards Programme Codex Committee On Contaminants In Foods) Fifth Session, The
Hague, The Netherlands, 21–25 March 2011
Carson R (1962) Silent spring. Houghton Mifflin Company, New York
Chaney RL (1988) Effect of zinc smelter emissions on farms and garden of Palmerton, PA. Trace
Subst Environ Health 22:263–280
Chary NS, Kamala CT, Raj DS (2008) Assessing risk of heavy metals from consuming food grown
on sewage irrigated soils and food chain transfer. Ecotoxicol Environ Saf 69:513–524
Consonni D, Pesatori AC, Zocchetti C et al (2008) Mortality in a population exposed to dioxin
after the Seveso, Italy, accident in 1976: 25 years of follow-up. Am J Epidemiol 167:847–858
Dakiky M, Khami A, Manassra A, Mereb M (2002) Selective adsorption of chromium(VI) in
industrial wastewater using low-cost abundantly available adsorbents. Adv Environ Res
6:533–540
Das SK, Varma A (2011) Role of enzymes in maintaining soil health. In: Shukla G, Varma A (eds)
Soil enzymology. Springer, Berlin/Heidelberg
Datta NP, Khera MS, Saini TR (1962) A rapid colorimetric procedure for the determination of
organic carbon in soils. J Indian Soc Soil Sci 10:67–74
Dawson TE, Mambelli S, Plamboeck AH et al (2002) Stable isotopes in plant ecology. Annu Rev
Ecol Evol Syst 33:507–559
DBT (2016) The prevention of food adulteration acts and rules (as on 01.10.2004). Indian
Biosafety Rules & Regulations, Department of Biotechnology, Govt of India. http://
dbtbiosafety.nic.in/act/PFA%20Acts%20and%20Rules.pdf. Accessed on 8 Oct 2016
De Marchi B, Funtowicz S, Ravetz J (1996) Seveso: a paradoxical classic disaster. In: Mitchell JK
(ed) The long road to recovery: community responses to industrial disaster, United Nations
University Press, Tokyo/New York/Paris. http://archive.unu.edu/unupress/unupbooks/uu21le/
uu21le00.htm#Contents
DFID (2003) Heavy metal contamination of vegetables in Delhi, Executive summary of technical
report. Department for International Development, London
Dick RP, Breakwell DP, Turco RF (1996) Soil enzyme activities and biodiversity measurements as
integrative microbiological indicators. In: Doran JW, Jones AJ (eds) Methods of assessing soil
quality. Soil Science Society of America, Madison, pp 247–271
Dilworth MJ (1966) Acetylene reduction by nitrogen fixing preparations from clostridium
pasteurianum. Biochim Biophys Acta 127:285–294
Douay F, Roussel H, Pruvot C, Waterlot C (2008a) Impact of a smelter closedown on metal
contents of wheat cultivated in the neighbourhood. Environ Sci Pollut Res 15:162–169
Douay F, Roussel H, Pruvot C, Loriette A, Fourrier H (2008b) Assessment of a remediation
technique using the replacement of contaminated soils in kitchen gardens nearby a former lead
smelter in northern France. Sci Total Environ 401:29–38
Douay F, Pelfrene A, Planque J et al (2013) Assessment of potential health risk for inhabitants
living near a former lead smelter. Part 1: Metal concentrations in soils, agricultural crops, and
homegrown vegetables. Environ Monit Assess 185:3665–3680
Feigin A, Ravina I, Shalhevet J (1991) Irrigation with treated sewage effluent: management for
environmental protection. Springer, Berlin, p 224
Fredan MAA (2011) Nitrogen fixing legumes in the plant communities. Am J Environ Sci
7:166–172
Friberg L, Piscator M, Nordberg GF, Kjellstr€om T (1971) Cadmium in the environment. CRC
Press, Cleveland, p 166
Ghosh AK, Bhatt MA, Agrawal HP (2012) Effect of long-term application of treated sewage water
on heavy metal accumulation in vegetables grown in northern India. Environ Monit Assess
184:1025–1036
Godin P, Feinberg M, Ducauze C (1985) Modelling of soil contamination by airborne lead and
cadmiumaround several emission sources. Environ Pollut 10:97–114
70 3 Impacts of Soil Pollution and Their Assessment

Guangwei H (2014) The soil pollution crisis in China: a cleanup presents daunting challenge. Yale
Environment 360, Yale School of Forestry & Environmental Studies, Yale University. Avail-
able via http://e360.yale.edu/feature/the_soil_pollution_crisis_in_china_a_cleanup_presents_
daunting_challenge/2786/. Accessed 15 Sept 2016
Gupta S, Satpati S, Nayek S, Garai D (2010) Effect of wastewater irrigation on vegetables in
relation to bioaccumulation of heavy metals and biochemical changes. Environ Monit Assess
165:169–177
Hassanein RA, Hashem HA, El-Deep MH, Shouman A (2013) Soil contamination with heavy
metals and its effect on growth, yield and physiological responses of vegetable crop plants
(turnip and lettuce). J Stress Physiol Biochem 9:145–162
Houba VJG, Temminghoff EJM, Gaikhorst GA, van Vark W (2000) Soil analysis procedure using
0.01 M calcium chloride as extraction reagent. Commun Soil Sci Plant Anal 31:1299–1396
Huang JW, Chen J, Berti WR, Cunningham SD (1997) Phytoremediation of lead-contaminated
soils: role of synthetic chelates in lead phytoextraction. Environ Sci Technol 31:800–805
IAEA (2006) Environmental consequences of the Chernobyl accident and their remediation:
20 years of experience, Report of the Chernobyl forum expert group ‘environment’. Interna-tional Atomic Energy Agency, Vienna
Jackson ML (1973) Soil chemical analysis. Prentice Hall, Englewood Cliffs
Jones DL (1998) Organic acids in the rhizosphere – a critical review. Plant Soil 205:25–44
Jordan MJ (1975) Effects of zinc smelter emissions and fire on chestnut-oak woodland. Ecology
56:78–91
Kar A, Galg BK, Singh MP, Kathju S (2009) Trends in arid zone research in India. Central Arid
Zone Research Institute, Jodhpur, p 481
Khurana MPS, Singh J, Nayar VK (2004) Assessment of heavy metal contamination in soils and
plants irrigated with sewage waters containing industrial effluents in district Amritsar, Punjab.
Indian J Environ Ecoplann 8:221–280
Kundu S, Coumar MV, Saha JK et al (2012) Assessing soil health of vertisol of AESR 10.1 using
selected physical, chemical and biological attributes of soils. J Indian Soc Soil Sci 60
(4):281–287
Leroyer A, Nisse C, Hemon D et al (2000) Environmental lead exposure in a population of
children in northern France: factors affecting lead burden. Am J Ind Med 38:281–289
Leroyer A, Hemon D, Nisse C et al (2001) Determinants of cadmium burden levels in a population
of children living in the vicinity of non-ferrous smelters. Environ Res 87:147–159
Lindsay WL, Norvell WA (1978) Development of a DTPA soil test for zinc, iron, manganese, and
copper. Soil Sci Soc Am J 42:421–428
Lund W (1990) Speciation analysis – why and how? Fresenius J Anal Chem 337:557–564
Manzo C, Salvini R, Guastaldi E, Nicolardi V, Protano G (2013) Reflectance spectral analyses for
the assessment of environmental pollution in the geothermal site of Mt. Amiata (Italy). Atmos
Environ 79:650–665
Mayes WM, Burke IT, Gomes HI et al (2016) Advances in understanding environmental risks of
red mud after the Ajka spill. Hung J Sustain Metall. doi:10.1007/s40831-016-0050-z
McBride MB (1991) Processes of heavy and transition metal sorption by soil minerals. In: Bolt GH
et al (eds) Interactions at the soil colloid-soil solution interface. Kluwer Academic Publishers,
Dordrecht, pp 149–174
McBride MB, Nibarger EA, Richards BK, Steenhuis T (2003) Trace metal accumulation by red
clover grown on sewage sludge-amended soils and correlation to Mehlich 3 and calcium
chloride extractable metals. Soil Sci 168:29–38
McBride MB, Pitiranggon M, Kim B (2009) A comparison of tests for extractable copper and zinc
in metal-spiked and field-contaminated soil. Soil Sci 174:439–444
McLaughlin MJ, Zarcinas BA, Stevens DP, Cook N (2000) Soil testing for heavy metals. Commun
Soil Sci Plant Anal 31:1661–1700
Meers E, Samson R, Tack FMG et al (2007) Phytoavailability assessment of heavy metals in soils
by single extractions and accumulation in Phaseolus vulgaris. Environ Exp Bot 60:385–396
References 71

Menzies NW, Donn MJ, Kopittke PM (2007) Evaluation of extractants for estimation of the
phytoavailable trace metals in soils. Environ Pollut 145:121–130
Mocarelli P, Marocchi A, Brambilla P et al (1991) Effects of dioxin exposure in humans at Seveso,
Italy. In: Banbury report 35: biological basis for risk assessment of dioxin and related
compounds. Cold Spring Harbor Laboratory Press, New York
Nagy AS, Szabo J, Vass I (2013) Trace metal and metalloid levels in surface water of Marcal River
before and after the Ajka red mud spill, Hungary. Environ Sci Pollut Res Int 20:7603–7614
Nath K, Saini S, Sharma YK (2005) Chromium in tannery industry effluent and its effect on plant
metabolism and growth. J Environ Biol 26:197–204
Nelson DW, Sommers LE (1996) Total carbon, organic carbon, and organic matter. In: Page AL
et al (eds) Methods of soil analysis, part 2, 2nd edn. American Society of Agronomy Inc,
Madison, pp 169–185
Olsen S, Cole C, Watanabe F, Dean L (1954) Estimation of available phosphorus in soils by
extraction with sodium bicarbonate, USDA circular nr 939. US Government Print Office,
Washington, DC
Panse VG (1947) Plot size in yield survey. Nature 15:820
Parker DR, Pedler JF (1997) Reevaluating the free-ion activity model of trace metal availability to
higher plants. Plant Soil 196:223–238
Pelfrene A, Douay F, Richard A, Roussel H, Girondelot B (2013) Assessment of potential health
risk for inhabitants living near a former lead smelter. Part 2: Site-specific human health risk
assessment of Cd and Pb contamination in kitchen gardens. Environ Monit Assess
185:2999–3012
Phillips AS, Yung TH, Bosela PA (2007) Love canal tragedy. J Perform Constr Facil 21:313–319
Poate D (1988) A review of methods for measuring crop production from smallholder producers.
Exp Agric 24:1–14
Pruvot C, Douay F, Herve F, Waterlot C (2006) Heavy metals in soil, crops and grass as a source of
human exposure in the former mining areas. J Soils Sediments 6:215–220
Rolf AO, Bakken LR (1987) Viability of soil bacteria: optimization of plate-counting technique
and comparison between total counts and plate counts within different size groups. Microb
Ecol 13:59–74
Ruhl L, Vengosh A, Dwyer GS et al (2009) Survey of the potential environmental and health
impacts in the immediate aftermath of the coal ash spill in Kingston, Tennessee. Environ Sci
Technol 43:6326–6333
Ruhl L, Vengosh A, Dwyer GS, Hsu-kim H (2010) Supporting information: the environmental
impacts of the coal ash spill in Kingston, Tennessee: an eighteen-month survey. Environ Sci
Technol 44:9272–9278
Sachan S, Singh SK, Srivastava PC (2007) Buildup of heavy metals in soil water plant continuum
as influenced by irrigation with contaminated effluent. J Environ Sci Eng 49:293–296
Saha JK, Sharma AK (2006) Impact of the use of polluted irrigation water on soil quality and crop
productivity near Ratlam and Nagda industrial area. IISS Bulletin, Indian Institute of Soil
Science, Bhopal, p 26
Schindler PW, Sposito G (1991) Surface complexation at (hydr)oxide surfaces. In: Bolt GH et al
(eds) Interactions at the soil colloid-soil solution interface. Kluwer Academic Publishers,
Dordrecht, pp 115–145
Sharma PD, Singh M, Ali M (2006) Recycling and utilization of urban and rural wastes for the
welfare of the society. In: Proceeding Indian Society of Soil Science, ICSWEQ, p 387–401
Sharma RK, Agrawal M, Marshall FM (2009) Heavy metals in vegetables collected from produc-
tion and market sites of a tropical urban area of India. Food Chem Toxicol 47:583–591
Smolders E, McLaughlin MJ (1996) Chloride increases cadmium uptake in Swiss chard in resin-
buffered nutrient solution. Soil Sci Soc Am J 60:1443–1447
Soil Survey Division Staff (1993) Soil survey manual, Soil conservation service. U.S. Department
of Agriculture handbook 18. Soil Survey Division Staff, Washington, DC
72 3 Impacts of Soil Pollution and Their Assessment

Srivastava MK (2015) Crop monitoring for improved food security. In: Proceedings of the expert
meeting Vientiane, Lao People’s Democratic Republic, 17 February 2014. Food and Agricul-
ture Organization of the United Nations and Asian Development Bank, Bangkok
Srivastava PK, Gupta M, Mukherjee S (2012) Mapping spatial distribution of pollutants in
groundwater of a tropical area of India using remote sensing and GIS. Appl Geomat 4:21–32
Sterckeman T, Douay F, Proix N, Fourrier H (2000) Vertical distribution of Cd, Pb and Zn in soils
near smelters in the north of France. Environ Pollut 107:377–389
Sterckeman T, Douay F, Proix N, Fourrier H, Perdrix E (2002) Assessment of the contamination of
cultivated soils by eighteen trace elements around smelters in the north of France. Water Air
Soil Pollut 135:173–194
Strojan CL (1978) Forest leaf litter decomposition in vicinity of a zinc smelter. Oecologia
32:203–212
Subbiah BV, Asija GL (1956) A rapid procedure for the determination of available nitrogen in
soils. Curr Sci 25:259–260
Tabatabai MA (1982) Soil enzymes. In: Page AL, Miller RH, Keeney DR (eds) Methods of soil
analysis, Part 2, Chemical and microbiological properties, Monograph no, vol 9. ASA-SSSA,
Madison, pp 903–947
Tan PM (1988) Palmerton zinc superfund site remediation strategy. Trace Sub Environ Health
22:296–305
Turrio-Baldassarri L, Alivernini S, Battistelli CL et al (2007) A study on PCB, PCDF/PCDF
industrial contamination in an mixed urban/agricultural area significantly affecting the food
chain and the human exposure Part I: Soil and feed. Chemosphere 67:1822–1830
Turrio-Baldassarri L, Abate V, Battistelli CL et al (2008) PCDF/PCDF and PCB in human serum
of differently exposed population groups of an Italian city. Chemosphere 73:228–234
Turrio-Baldassarri L, Alivernini S, Carasi S et al (2009) PCB, PCDD and PCDF contamination of
food of animal origin as the effect of soil pollution and the cause of human exposure in Brescia.
Chemosphere 76(2):278–285
USEPA (1987) Palmerton zinc superfund site remedial investigation/feasibility study for the blue
mountain project. USEPA, Philadelphia
Walkley A, Black IA (1934) An examination of Degtjareff method for determining soil organic
matter and a proposed modification of the chromic acid titration method. Soil Sci 37:29–37
Yoshida F, Hata A, Tonegawa H (1999) Itai-Itai disease and the countermeasures against cadmium
pollution by the Kamioka mine. Environ Econ Policy Stud 2:215–229
References 73

Chapter 4
Major Inorganic Pollutants Affecting Soiland Crop Quality
Abstract Inorganic pollutants are released into the environment due to activities of
mining, industry, transportation and urban activities. Environmental risks associ-
ated with inorganic pollutants vary widely due to several complex interactions at
both intracellular and extracellular levels. Salts of alkali metals degrade physical
and chemical environment of rhizosphere soil affecting water and nutrient uptake as
well as reduce rate of several nutrient cycling processes mediated by microbes with
overall impact on nutrient use efficiency. Toxic heavy metals and metalloids
interact quite strongly with soil constituents as compared to salts of alkali metals,
rate of which however, depend on the element and their speciation. Although their
mobility in soil is low, these elements disrupt biochemical processes in organisms
even at low concentration affecting physiological activities. Toxicity to organisms
and transformation reactions for inorganic pollutants with soil constituents and their
consequences on transfer to organisms including plants are discussed in this
chapter.
Keywords Environmental risk • Salts • Heavy metals • Plant • Microorganisms •
Human health
The population growth forced rapid growth of industrial sector due to larger
demand for consumer goods. Consequently it is also releasing huge amount of
potentially toxic compounds into the ecosystem affecting quality of life and eco-
logical functions. The pollutants being released in the environment can be catego-
rized on the basis of sources, types and mode of toxicity. Although considerable
knowledge has been generated, researchers are continuously engaged in finding out
the toxic effects of various pollutants on human activities or organism’s health and
also on the environment as a whole. Among the inorganic pollutants, heavy metals
are having the prime place and affected the system most. The most common listed
toxic metal pollutants in soil are arsenic, cadmium, chromium, copper, zinc,
mercury. These pollutants can enter into the soil system through poor agricultural
management practices, improper industrial effluent discharge, landfill leakage,
unauthorized dumping of household wastes, dry and wet deposition, volcanic
eruption and industrial emissions.
© Springer Nature Singapore Pte Ltd. 2017
J.K. Saha et al., Soil Pollution - An Emerging Threat to Agriculture, Environmental
Chemistry for a Sustainable World 10, DOI 10.1007/978-981-10-4274-4_4
75

The impact of pollutants may be categorized into long- and short-term damage
on environment, soil biota, plant and human system. The toxicity depends on the
type of metals, concentration and receiving host and also varies from species to
species.
4.1 Understanding Soil Contamination and Human Health
Introduction of toxic substances into the soil ultimately reach the organisms
including human being in several ways: direct deposition or through irrigation
water, manures and other soil amendments with considerable impact on ecosystem.
Crops grown on contaminated soil lead to accumulation of toxic substances in food
grain which indirectly enter the human physiological process to affect the human
health severely (Fig. 4.1). Hence it is essential to focus on soil-plant-human
continuum of toxic substances.
4.2 Risks Associated with Soil Pollution
Environmental risk assessment may be defined as the “process of estimating the
potential impact of a chemical or physical agent on a specified ecological system
under a specific set of conditions” (NHMRC 1992). In the context of human health,
risk assessment has been defined as the “characterization of the potential adverse
health effects of human exposures to environmental hazards” (NRC 1983). Soil
pollution risk establishment is very necessary to avoid human health exposure to
Fig. 4.1 Potential pathways for toxic elements to become concentrated in plants, soil, animals and
humans (Adapted from Connor 1990)
76 4 Major Inorganic Pollutants Affecting Soil and Crop Quality

many toxic substances in the soil. Although no specific established assessment
method exists, the most common steps of risk assessment of contaminated site are
the following (Markus and McBratney 2001):
(i) Identifying its specific purpose
(ii) Identifying critical receptors of the contaminants. Risk assessment should
determine on whether the risk assessment is for the entire species of organisms
or just the most sensitive species
(iii) Determining the level of acceptable risk
(iv) Exposure assessment to identify the pathways of exposure to individuals at
risk and wherever possible, to quantify their individual contribution
(v) Toxicity assessment to determine the nature of adverse effects related to
exposure and dose – response relationships for these effects
(vi) Risk characterization taking into account of all assumptions and uncertainties
to produce a final estimate of the risk
Risk assessment in the polluted sites can be studied through single pollutant effect
or combined effects. Ecotoxicological effect and biological availabilities
are discussed in detail below:
4.2.1 Risks Related to One Soil Pollutant
Majority of the researches in this regards have been carried out in and around areas
with high pollution activity and the survey information have been presented on
single contaminant basis in the form of statistical parameters and spatial maps
showing contaminant distribution. However, protocols for estimating the environ-
mental or health risk of a particular contaminant are not uniform and well-defined.
The USEPA adopted a modeling approach to quantify human exposure, which
involve (i) a comprehensive analysis on the pathways of pollutant transfer to
selected target organisms viz. humans, plants, animals and soil biota,
(ii) identification of dose – response relationships for the receptors followed by
an assessment of the likely harmful effects that metals may have on the target (iii)
determination of the concentration of contaminant that would protect the most
highly exposed individual from adverse effects (Ryan and Chaney 1997). Approach
of environmental risk assessment of the Netherlands is based on the soil concen-
tration at which half of the species in an ecosystem are potentially at risk (i.e., the
Hazardous Concentration for 50% of species) (Theelen 1997).
Ordinarily, possible influence of nonchemical stressors on chemical toxicity is
not considered during risk assessment and toxicity is assumed as an intrinsic
property of the contaminant, where influence of receptor properties is reflected
mainly through species-specific slopes of the dose-response curve.
4.2 Risks Associated with Soil Pollution 77

4.2.2 Risks Associated with Multiple Pollutants in Soil
Consideration of multiple-stressor scenarios has been recognized as one of the steps
to improve the method of assessment of toxicants and thereby reduce the uncer-
tainty due to extrapolations inherent to ecological risk assessment procedure (Hope
2006). Current approaches to assess the risk of pollution to ecosystems are devel-
oped for single contaminant and determine its impact primarily as a function of
properties of the contaminant. However, the cumulative impact of multiple con-
taminants and natural stressors may differ markedly from the impact of the single
contaminant and can result in nonlinear effects with ecological surprises (Segner
et al. 2014). So during the study of soil pollution, the combined effect of various
pollutants/stressors should also be considered. Interactions of natural antagonists
and pollutants have been shown to result in considerable impacts on ecologically
relevant parameters. Screening for non-additive effects among many stress factors
in simplified experimental designs by using the model of independent action has
been suggested as a valuable strategy for an environmentally more realistic risk
assessment of chemicals (Coors and De Meester 2008). Several researchers how-
ever, highlighted the problems in assessing multiple stressor effects as responses of
biological receptors to stressors vary with biological scale, physiological and
ecological traits, and receptor interactions and network organization (Munns
2006; Segner et al. 2014).
4.3 Inorganic Pollutants
4.3.1 Sodium, Salinity and Sodicity
Industries, particularly those associated with chlor-alkali, textiles, glass, rubber
production, animal hide processing and leather tanning, metal processing, pharma-
ceuticals, oil and gas drilling, pigment manufacture, ceramic manufacture, soap and
detergent production are the major consumer of salts (mainly NaCl) produced in the
world today. Due to their high mobility in the soil, salt ions present in the industrial
effluents when released into the environment, percolate through the soil profile and
contaminate the groundwater. Such salt-loaded groundwater and surface water
when used for irrigation to crops may lead to development of salinity/sodicity in
soils of agricultural land.
At higher concentration in soil, Na causes damage to normal plant growth and
such damage is also associated with high salinity and chloride. Thus, injury due to
salinity and excess Na occur together (Bergmann 1992). The growth inhibition
associated with high concentration of Na and salinity is often not attributed to
specific toxic effect, but to the reduced water availability (physiological water
stress). Moreover, when Na accounts for over 10–15% of the cation exchange
capacity of clayey and loamy soil or over 20% in sandy soils, situation (known as
78 4 Major Inorganic Pollutants Affecting Soil and Crop Quality

sodicity) results in destruction of soil structure and consequently affects root growth
due to compaction, poor permeability and aeration (Maliwal and Somani 2010). As
soil pollution due to high salts affects plant growth (consequently, crop-cover and
root anchorage), erodibility of land increases; and hence, accelerates soil erosion.
A review by Silva and Fay (2012) indicated detrimental effects of salinity on soil
microbial community, as well as on their activities and genetic diversity. Consid-
erable increase in N2O production under anaerobic condition in both unfertilized
and N-fertilized soil has been observed due to increase in salinity (Table 4.1)
(Adviento-Borbe et al. 2006). Therefore, irrigation with salt loaded industrial/
municipal effluent for submerged rice cultivation may aggravate environmental
pollution due to reduced N use efficiency and induced GHG emission. Activities of
soil enzymes, responsible for mineralization of nutrients were found severely
affected (Pathak and Rao 1998; Tripathi et al. 2007), thereby imparting additional
dimension to the plant stress in the salt affected soil.
4.3.1.1 Risk Assessment Due to Excess Salts
Risk on crop growth due to salinity build-up in soil can easily be assessed through
indirect measurement of electrical conductivity (EC) of soil solution, where electric
current is directly proportional to ionic concentration. The quantity (ppm) of ‘totaldissolved solids (TDS)’ in the form of soluble salts is approximately equal to
“EC � 640”, where EC is represented as mS cm�1. Impact of salinity has been
found related with soil texture and therefore, different salinity classes have been
recommended for different textural classes for identifying levels of salinity
(Table 4.2).
Remote sensing technique can identify salinity development in a shorter span of
time on large area. Multi-temporal optical and microwave remote sensing can be
successfully employed in detecting temporal changes of salt-related surface fea-
tures. Airborne geophysics and ground-based electromagnetic induction meters,
combined with ground data, have also shown potential for mapping depth of
salinity occurrence (Metternicht and Zinck 2003).
4.3.1.2 Risk Assessment Due to Sodicity
Adverse effect on soil quality due to excess Na is generally assessed by its
concentration in relation to the other competitive cations in either soil solution or
on exchange sites. Relative concentration of Na on exchange sites (CEC) is termed
as ‘exchangeable sodium percentage (ESP)’ and is expressed as:
ESP ¼ Exchangeable Na
CEC� 100
4.3 Inorganic Pollutants 79
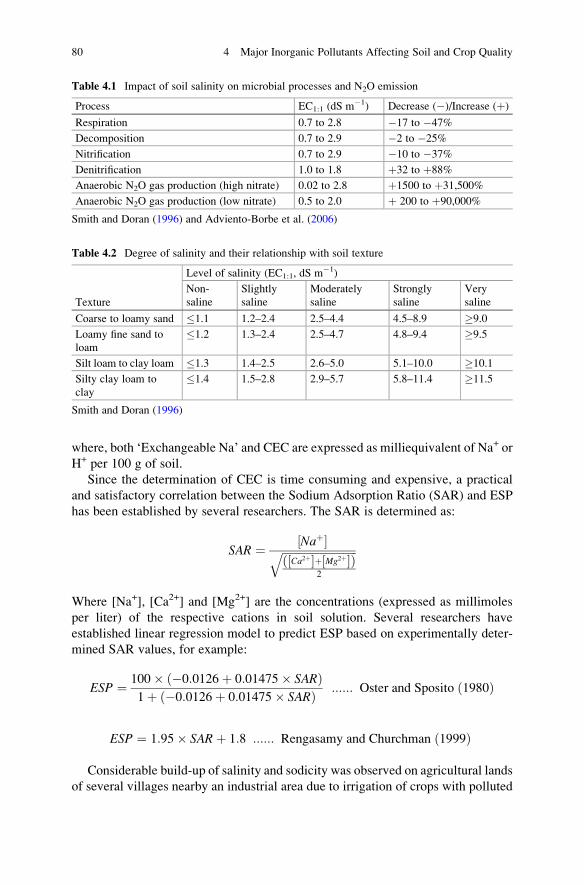
where, both ‘Exchangeable Na’ and CEC are expressed as milliequivalent of Na+ or
H+ per 100 g of soil.
Since the determination of CEC is time consuming and expensive, a practical
and satisfactory correlation between the Sodium Adsorption Ratio (SAR) and ESP
has been established by several researchers. The SAR is determined as:
SAR ¼ Naþ½ �ffiffiffiffiffiffiffiffiffiffiffiffiffiffiffiffiffiffiffiffiffiffiffiffiffiffiffi
Ca2þ½ �þ Mg2þ½ �ð Þ2
q
Where [Na+], [Ca2+] and [Mg2+] are the concentrations (expressed as millimoles
per liter) of the respective cations in soil solution. Several researchers have
established linear regression model to predict ESP based on experimentally deter-
mined SAR values, for example:
ESP ¼ 100� �0:0126þ 0:01475� SARð Þ1þ �0:0126þ 0:01475� SARð Þ :::::: Oster and Sposito 1980ð Þ
ESP ¼ 1:95� SARþ 1:8 :::::: Rengasamy and Churchman 1999ð Þ
Considerable build-up of salinity and sodicity was observed on agricultural lands
of several villages nearby an industrial area due to irrigation of crops with polluted
Table 4.1 Impact of soil salinity on microbial processes and N2O emission
Process EC1:1 (dS m�1) Decrease (�)/Increase (þ)
Respiration 0.7 to 2.8 �17 to �47%
Decomposition 0.7 to 2.9 �2 to �25%
Nitrification 0.7 to 2.9 �10 to �37%
Denitrification 1.0 to 1.8 þ32 to þ88%
Anaerobic N2O gas production (high nitrate) 0.02 to 2.8 þ1500 to þ31,500%
Anaerobic N2O gas production (low nitrate) 0.5 to 2.0 þ 200 to þ90,000%
Smith and Doran (1996) and Adviento-Borbe et al. (2006)
Table 4.2 Degree of salinity and their relationship with soil texture
Texture
Level of salinity (EC1:1, dS m�1)
Non-
saline
Slightly
saline
Moderately
saline
Strongly
saline
Very
saline
Coarse to loamy sand �1.1 1.2–2.4 2.5–4.4 4.5–8.9 �9.0
Loamy fine sand to
loam
�1.2 1.3–2.4 2.5–4.7 4.8–9.4 �9.5
Silt loam to clay loam �1.3 1.4–2.5 2.6–5.0 5.1–10.0 �10.1
Silty clay loam to
clay
�1.4 1.5–2.8 2.9–5.7 5.8–11.4 �11.5
Smith and Doran (1996)
80 4 Major Inorganic Pollutants Affecting Soil and Crop Quality

groundwater (pH 7.70; EC 2.84 mS cm�1) (Saha and Sharma 2006). While SAR
values were generally more in 15–30 cm layer, the salinity level was more in upper
15 cm layer. In that area with predominantly clayey soil, ESP was related to SAR of
the soil solution (Fig. 4.2) according to the regression equation:
ESP ¼ �0:2977þ 1:1621∗SAR r ¼ 0:96∗∗ð Þ
Sodium increases dispersibility of soil clays and affects soil physical properties
by breaking down aggregated structure, reducing permeability & porosity as well as
putting the land more vulnerable to soil erosion. Such impact is more in soils
predominated with montmorillonite clays than in soils with illite-vermiculite
clays, and much more than in soils with kaolinite-sesquioxide clays, which are
the least affected (Ayers and Westcot 1976). The threshold SAR and EC values for
sandy soil were 16 and 4.0 dS m�1 respectively; while such threshold values for
clays were 8 and 1.5 dS m�1 (Hanson et al. 1999). In a polluted area in India
affected with sodicity, first few spells of rain increased pH of soil considerably
(on an average by about 0.67 unit) due to replacement of Cl� with HCO3� in the
soil solution (Saha and Sharma 2006), which was further corroborated in the
leaching experiment under laboratory condition (Fig. 4.3). However, change in
pH due to leaching of Na-salts during monsoon also depends on the reserve pool of
counter cations Ca and Mg as well as on the extent of sodicity in the soil (Saha
2005). While monsoon rainfall (971 mm) caused decrease in pH of soil previously
irrigated with polluted groundwater, it resulted increase in pH of the soils previ-
ously irrigated with industrial effluent (Table 4.3).
0
5
10
15
20
25
30
0 10 20 30
SAR
ESP
Fig. 4.2 Relationship
between exchangeable
sodium percentage (ESP)
and sodium absorption ratio
(SAR) of soil solution in
polluted groundwater
irrigated area
4.3 Inorganic Pollutants 81

4.3.2 Heavy Metals and Metalloids
Heavy metals are naturally present in the deeper part of the earth from where they
are being mined out and released into the biosphere in the form of waste either
during the manufacturing process or after human use of the manufactured products
(Table 4.4). There are several industries and sources which release heavy metals in
the environment, like mines, smelters, thermal power plant, metallurgical indus-
tries, electronics, textiles, phosphatic fertilizers, municipal solid wastes (MSW),
sewage and industrial sludge etc. Burning of fossil fuel at stationery sources (as in
coal burning at power plants) contributed maximum emissions of Cr, Hg, Ni, V, Se;
vehicular traffic contributed maximum for Pb; copper production contributed
maximum for As, Cd and Cu; and zinc production contributed maximum for
Zn. After being emitted to the atmosphere, trace metals are subjected to transport
within air masses and a large part of this gets deposited on the land mass not only
0
0.5
1
1.5
2
2.5
3
3.5
4
4.5
5
6.5
7
7.5
8
8.5
9
Initial 3 porevolm.
6 porevolm.
9 porevolm.
12 porevolm.
15 porevolm.
EC (m
S/cm
)
pH
Amount of leaching
Fig. 4.3 Changes in pH and EC due to leaching of salts (Solid lines represent pH and broken linesrepresent EC values; ‘●’ represents soil from unpolluted area, and ‘■’ and ‘~’ represent soils frompolluted area.)
Table 4.3 Changes in salinity and sodicity parameters of polluted soils during monsoon rain
Soils previously irrigated with textile
effluent
Soils previously irrigated with polluted
groundwater
Pre-monsoon Post-monsoon Pre-monsoon Post-monsoon
pH 7.90 8.11 8.37 7.94
EC (mS/cm) 4.44 0.52 0.84 0.64
SAR 24.03 1.71 6.43 1.91
ESP 31.18 2.28 6.96 2.20
82 4 Major Inorganic Pollutants Affecting Soil and Crop Quality

around the source but also in area far away, even crossing boundaries of the
country/ continent (Pacyna and Pacyna 2001). Significant part of the metal loaded
effluents, generated particularly from small scale industries in developing and
under-developed countries are released untreated into land and water bodies. In
most of cases, metals are present in dilute and small quantities in polluted water
bodies and may not cause any harm to plant growth immediately when used for
irrigation. However, their immobility and consequent persistence imply that con-
centrations may become elevated in the long run to such an extent that they begin
exhibiting toxic effect on plant, soil microorganisms and food chain. Compost is
most commonly used organic amendment for improving soil productivity. How-
ever, such material prepared from MSW and sewage-sludge contains several
harmful heavy metals in high concentrations (Sullivan and Miller 2001; Saha
et al. 2010a). Also, some of the metals are impurities/constituents of extensively
used agrochemicals like fertilizers (e.g. Cd in phosphatic fertilizer), pesticides (e.g.,
Zn, Cu, Sn, Hg, organic pollutants) etc. and contaminate the rhizosphere when these
are used in intensive agriculture. Long-term exposure to heavy metals has been
reported to affect human and animal health adversely (ATSDR 2005). Among the
heavy metals, Ni, Co, Cr and Cu are relatively more toxic to plants and As, Cd, Pb
and Hg are relatively more toxic to higher animals (McBride 1994).
The presence of heavy metals in soil affects the edaphological environment in
several ways like contamination of food as well as a decrease in crop productivity
(Rooney et al. 2007) and diminution of soil microbial activity (Chaudri et al. 1993;
McGrath 1993; Akerblom et al. 2007). Heavy metals have a strong affinity for
chelating substances, including the enzymes implicated in cellular metabolism and
consequently by blocking these enzymes, they cause adverse physiological changes
leading to even death of cell. These were found to affect soil microbial activity
Table 4.4 Sources of hazardous elements
Metal Industry
Chromium
(Cr)
Mining, industrial coolants, chromium salts manufacturing, leather tanning
Lead (Pb) Lead acid batteries, paints, e-waste, smelting operations, coal- based thermal
power plants, ceramics, bangle industry
Mercury
(Hg)
Chlor-alkali plants, thermal power plants, fluorescent lamps, hospital waste
(damaged thermometers, barometers, sphygmomanometers), electrical
appliances
Arsenic (As) Geogenic/natural processes, smelting operations, thermal power plants, fuel
burning
Copper (Cu) Mining, electroplating, smelting operations,vanadium (Va) spent catalyst,
sulphuric acid plant
Nickel (Ni) Smelting operations, thermal power plants, battery industry
Cadmium
(Cd)
Zinc smelting, waste batteries, e-waste, paint sludge, incinerations and fuel
Combustion
Zinc (Zn) Smelting, electroplating
Adapted from CPCB (2010)
4.3 Inorganic Pollutants 83

much earlier than their adverse effect on plant growth were expressed (Saha et al.
2013). In long-term experiments, adverse effects on soil microbial biomass, as well
as on symbiotic N2-fixation by blue-green algae and Rhizobium were observed due
to heavy metals accumulation from sludge application (Brookes and McGrath
1984; Brookes et al. 1986; Martensson and Witter 1990). As soil microorganisms
play important role related to plant growth like nutrient mineralization from organic
matter, native P solubilization, N2 fixation from atmosphere, indirect adverse effect
of heavy metal accumulation on plant growth can be inferred. A comprehensive
review indicated inhibitory effect of Cr on uptake of several essential nutrients by
plants resulting in their deficiency and crop growth (Shanker et al. 2005).
Contamination of food with heavy metals is another serious issue in manage-
ment of polluted soils. Transfer of metals to edible part of plant depends on their
concentration in soil, interaction with soil constituents and ability of root to exclude
or inactivate metals and their translocation from root to edible parts. Fine-texture,
higher pH, organic matter and CEC favoured lower transfer coefficients for Cd, Cr
and Hg in flowering Chinese cabbage, resulting from their high sorption capacities
(Liu et al. 2007). Due to higher pH and clay content, Vertisol had higher capacity to
absorb Cd and Pb and as a result, expressed toxicity to soybean crop at higher levels
of contamination as compared to Inceptisol and Alfisol (Adhikari et al. 2012).
4.3.2.1 Behaviour of Some of the Potentially Toxic Heavy Metals,
Metalloids and Selenium in Soil and Their Impact on Plants
Cadmium
Chemical properties of Cd and Zn are quite similar because both of these belong to
same group (IIb) in the periodic table. Cadmium is thus able to mimic the behavior
of the essential element for Zn in its uptake and metabolic functions. This element is
universally acknowledged to be a dangerous heavy metal due to its toxicity in
human, animal and plant even at low concentrations. This is partly due to the ease
with which it is taken up by plants but also to the relative speed with which it is
translocated to the above ground parts (Table 4.5). Relative mobility of Cd is higher
than that of Pb or Zn.
Transfer coefficient is calculated as the ratio of the concentration of a metal in a
plant to the total concentration of that metal in soil. A higher transfer coefficient
indicates a greater mobility of metal from soil into plant. Transfer coefficient for Pb
in uncontaminated soil was about 2.5–4.4 times higher compared to Pb treated soil
which ranged from 0.06 to 0.11 (Saha et al. 2010b). In contrast, transfer coefficients
for Cd in treated soils were 1.1–1.7 times higher compared to control, which
Table 4.5 Transfer coefficients (ratio of concentration in plant to soil) according to Sauerbeck
(1986)
Transfer coefficients 1–10 0.1–10 0.1–1 0.01–0.1
Heavy metal Cd, Ti, Zn, B Mo, Se Cu, Ni, V Co, Cr, Hg, Pb, Sn, As, Be, F
84 4 Major Inorganic Pollutants Affecting Soil and Crop Quality

indicates that applied Cd was either equally or more available to plant in compar-
ison to native form. Very low values of transfer coefficient for Pb indicate that soil-
plant barrier for its translocation is very high as compared to Cd. Cadmium, which
has lower affinity for metal sorbing soil constituents (i.e. oxides, humified natural
organic matter) has the greatest potential for transmission to food chain in levels
that pose risk to consumers (Chaney and Ryan 1994; Chaney et al. 1999).
In nearly all the publications on the subject, the soil pH is listed as the major soil
factor controlling both total and relative uptake of Cd. Cadmium is more mobile in
acidic soils within the range of pH 4.5–5.5; whereas in neutral to alkaline soil, it is
rather immobile. At pH < 6, its high mobility/availability is attributable to the fact
that Cd+2 is adsorbed relatively weakly on major soil particles like organic matter,
silicate clays and iron-aluminium oxides. At the similar level of soil cadmium, its
availability is higher at low pH and lower contents of clay, organic matter and
oxides. Above pH 7, Cd+2 is co-precipitate with CaCO3 or precipitate as CdCO3
with consequent decline in solubility/availability. For this reason, liming acid soils
is recommended as ameliorant in Cd contaminated soils. However, as the pH is
increased in the alkaline range, monovalent hydroxy ion species are likely to occur
(e.g., CdOH+), which could not easily occupy the sites on cationic exchanges
complexes increasing its mobility. Geogenous cadmium and that accumulated in
the soil over very long periods of time are absorbed by the plant more slowly than
recent inputs.
Although content of Cd in natural soil is reported worldwide to vary in the range
0.06–1.1 μg g�1, its concentration exceeding 0.5 μg g�1 in soils is suspected to be
contaminated from anthropogenic sources. Plant species vary greatly in their ability
to translocate Cd at a given soil concentration, like: lettuce> spinach, tomato, carrot
> rape, cabbage, radish> maize, mustard> sunflowers, bean, pea, cucumber>wheat, oat. The symptoms of cadmium toxicity in plants include inhibited growth
with or without chlorotic blotches.
Chromium
Worldwide soil Cr in the unpolluted area range from 7 to 221; although those
derived from serpentine may contain several per cent Cr. Chromium in soils exists
in two oxidation states: inþ3 oxidation state as the Cr+3 cation, and inþ6 oxidation
state as chromate anion (CrO4�2). Normal soil conditions generally favour Cr+3
form which is highly immobile and hence, unavailable to plants due to strong
complexation/chemisorptions with soil organic matter, oxides, silicates even
under acidic condition as well as due to formation of relatively insoluble com-
pounds such as chromite Fe-Cr2O4. The concentrations of soluble Cr(III) in equi-
librium with insoluble compounds are < 10�9 M (0.05 ppb) in water at pH 6 to less
than 10�15 M at pH 8 (Richard and Bourg 1991). Chromates (Cr+6) are soluble and
highly toxic to organisms; and are only stable under alkaline condition in the soil.
When hexavalent chromate ion enters in to the soil along with polluted irrigation
water (e.g. tannery effluent), most or all of these are reduced to Cr+3 quite rapidly
(within 1 or 2 days) especially under acidic condition and in presence organic
matter. Due to such transformation of soluble Cr(VI) into insoluble Cr(III)
4.3 Inorganic Pollutants 85

compounds, plants do not accumulate Cr even when it is present in the soil in high
concentrations and tolerate relatively high levels of Cr applied to the soil through
wastewaters of sludge. Soil organic matter plays important role in minimizing risk
associated with Cr contamination. Further, availability of Cr decreases rapidly with
increasing pH value. Chromium applied to the soil surface is usually absorbed in the
top 5–10 cm. At higher pH, a small fraction of Cr+3 may be oxidized to soluble
hexavalent CrO4�2 and such oxidation is promoted by Mn oxides. The oxidation of
Cr(III) to Cr(VI) is limited by the concentration of water-soluble chromium, pH,
initial available surface area, and the ionic strength (Apte et al. 2005). A large
portion of chromium in soil will not be oxidized to Cr(VI) even in the presence of
manganese oxides and favorable pH conditions, due to the unavailability of mobile
Cr(III).
Cultivated crop plants can be placed in the following order of decreasing
chromium (VI) uptake: cauliflower > beet root > radish > carrot > tomato >maize > lettuce > barley > moong bean. Chromium toxicity manifests itself in
plants, as it greatly inhibits growth and photosynthesis, and develops chlorosis,
small brownish-red or purplish leaves and necrotic lesions. Root growth is greatly
inhibited by high chromium concentrations.
Lead
Worldwide mean total lead content of uncontaminated soils varies between 10 and
84 ppm, but more commonly below 50 ppm. Soils other than pure sandy soil have a
high fixing capacity of lead which increases with increase in clay and humus
content owing to strong affinity of Pb for minerals (�OH groups of silicates and
hydroxides) and organics (�OH and – COOH). Organic matter content determines
the immediate relative metal retention while iron oxides determine the redistribu-
tion of metals with time (Diagboya et al. 2015). About 60–80% of dissolved Pb
exists as organic complex, while the proportion may reach to 80–100% at near-
neutral pH (Sauve et al. 1997). Free Pb+2 concentration in soil solution depends
mainly on its total content and pH. Under oxidizing conditions, Pb+2 becomes less
soluble as pH is increased. In alkaline soils, however, its mobility may increase by
the formation of soluble Pb-organic and Pb-hydroxy complexes. Being a strong
chalcophile, Pb solubility is extremely reduced under reducing condition due to its
precipitation as sulphide.
Plants transfer little Pb+2 from soil to aboveground parts; enriching it at the root
surface and immobilizing in the cell wall of the root. Therefore, very high concen-
trations of Pb in the soil are necessary to exhibit toxicity. Soil factors such as high
cation exchange capacity, alkaline pH, high organic matter and P-content in the soil
antagonize its uptake by plants. It implies that if wastes rich in phosphorus and
organic matter (such as sewage waters and sludge) are applied to the soil, very little
hazards due to Pb are expected. However at very high Pb concentration in soil under
favourable chemical condition (low pH, light textured, less SOC and oxides), plant
can accumulate this metal in the above ground parts. The main consequences of
Pbtoxicity in plants are disruption of Ca metabolism, inactivation of various
86 4 Major Inorganic Pollutants Affecting Soil and Crop Quality

enzymes, reduced CO2 assimilation and consequently suppression of
photosynthesis.
Nickel
Soils throughout the world contain Ni within wide range from 4 to 55 mg kg�1,
depending upon type of parent material and soil forming processes. Ni behaves
largely like Zn in the soil-plant system, but it forms stronger chelates with soil
organic matter, thereby showing resemblance to Cu. Having similar electronic
configuration and electronegativity, Ni+2 forms stable complexes with organic
matter similar to Cu+2. Therefore, this metal occurs mainly in organically bound
forms in surface soil horizon, a part of which may exist as soluble chelates. High
soil organic matter level in Ni contaminated soil may mobilize it through formation
of soluble complex, particularly at higher pH. Fraction of soil Ni occluded in Fe and
Mn oxides also seems to be available to plants. Generally, solubility of Ni is
inversely related to soil pH and also to its sorption on Fe & Mn oxides which is
generally pH dependent. The metal does not play essential role in plant metabolism;
although evidence of its beneficial effects exists. Nickel is readily taken up by
plants from soil and its absorption is positively correlated with its concentration in
soil until certain Ni concentration in plant tissues is reached. Its content in the range
of 50–100 mg kg�1 within plant (on dry weight basis) is indicative of its toxicity in
plants. Restricted growth of plants and chlorosis in leaves are common symptom of
its toxicity. Possibility of Ni-toxicity to plants cannot be ruled out when industrial
or municipal wastes with high Ni concentrations are applied to agriculture lands.
Nevertheless, like Zn and Cu, phototoxicity of Ni appears to provide an effective
barrier against Ni toxicity to human population and animals.
Mercury
Mercury and its compounds are among the strongest toxic substances and are also
extremely dangerous to humans and animals. Its concentration in world soils of
uncontaminated region is very low and usually ranges from 0.02 to 0.4 ppm. In
normal rhizospheric environment, it exists in soil solution mainly as Hg+2, though
its reduced form (Hg+) may also be present at a very low concentration under
reduced condition. Even though the retention and accumulation of Hg in soils
depends highly on its chemical form, the mobility may also be controlled by the
transport of the mobile phase (soil water) and the soil properties (pH, CEC, mineral
composition, soil texture, organic matter, etc.). Mercury ions can be retained by
organic matter, oxides of iron-aluminium, and clay minerals; and may precipitate
with carbonate and hydroxide to form a stable solid phase in alkaline soils. As
mercury is strongly absorbed in the soils especially by organic matter, its uptake is
somewhat less pH dependent in comparison to other heavy metals. Mercury may be
reduced to its elemental form (Hg0) by both chemical and biological processes,
which is volatile and extremely toxic to organisms. Methylmercury ([CH3Hg]+ or
[CH3Hg]0), another toxic compound, may be formed by anaerobic microorganisms
under reduced condition. However, this process is highly competitive with the
chemical transformation process involving precipitation as HgS, which makes
prediction on its mobility/toxicity difficult. Strong interaction between humic acid
4.3 Inorganic Pollutants 87

and Hg0 through thiolate ligand-induced oxidative complexation has also been
observed under anaerobic environment (Gu et al. 2011). Oxidized Hg+2 may be
effectively reduced to Hg0 in the presence of reduced humic acid (having more
proton reactive site); whereas production of Hg0 is inhibited by complexation as
humic acid concentration increases. This dual role played by dissolved organic
matter in the reduction and complexation of mercury is expected to significantly
influence the mercury species transformations and its biological uptake that leads to
the formation of toxic methylmercury. In aquatic environments, inorganic mercury
is microbiologically transformed into methylmercury, which makes it more prone
to biomagnification in food chains. Consequently, populations with traditionally
high dietary intake of food originating from fresh or marine environment have
highest dietary exposure to this highly toxic element.
Mercury uptake by plants is little because of its very low solubility in soil due to
reasons described above. In the uncontaminated environment, Hg-content of plants
tissues seldom exceeds 500 parts per billion (ppb). In naturally contaminated areas,
its level can be as high as 3500 ppb. Mercurial fungicides constitute an important
source of Hg for crop plants. Its content in the above-ground plant parts is generally
low despite Hg seed treatment or its addition to soil. In general, Hg hazards are
much less in intensive agriculture in comparison to aquatic food chain.
Copper
Average concentrations of Cu in unpolluted soils vary from 6 to 80 mg kg�1,
depending on parent materials, topography, climatic conditions and soil properties.
It exists in soils almost exclusively as Cu+2. Copper ions are held very tightly on
both organic and inorganic exchange sites. The process controlling fixation by soil
constituents are related to adsorption, occlusion, organic chelation and complexing
and microbial fixation. All soil minerals are capable of absorbing Cu ions from
solution and these properties depend on the surface charge carried by the adsor-
bents. The surface charge is strongly controlled by pH, and therefore, the absorption
of Cu ions species can be presented as a function of pH. The greatest amount of
adsorbed Cu had always been found for Fe and Mn oxides (hematite, geothite,
birnessite), amorphous Fe and Al hydroxides, and clays (montmorillonite, vermic-
ulite, imogolite). In reduced soil (as under paddy cultivation), Cu has very low
mobility due to formation of insoluble sulfides, Cu2S and CuS. Chelation and
complexation are the key reactions governing Cu behavior in most soils. Many
kinds of organic substances form from both soluble and insoluble complexes with
Cu; and thus Cu-binding capacities of soils and Cu solubility are highly dependent
on the kind and amount of organic matter in soils. Although Cu is one of the least
mobile heavy metals in soil, this metal is abundant in soil solutions of all types of
soils. Overall solubility of both cationic and anionic forms of Cu decreases at about
pH 7–8. However, the most common forms of Cu in soil solution are soluble
organic chelates of this metal. Although very little is known of the kinds of soluble
organic Cu forms, about 80% of the soluble Cu forms have been estimated to be
as organic chelates. Although there is increasing evidence of the active absorption
88 4 Major Inorganic Pollutants Affecting Soil and Crop Quality

of Cu by plants, passive absorption is likely to occur, especially in the toxic range of
this metal in solutions.
Toxic metal pollution affects the composition and metal tolerance of soil
bacterial communities. In highly contaminated soils with CuSO4 of industrial origin
about 85 years ago, the relative abundances of members of several phyla or
candidate phyla, including the Proteobacteria, Bacteroidetes, Verrumicrobia,Chloroflexi, WS3, and Planctomycetes decreased with increasing bioavailable Cu,
while members of the dominant phylum, the Actinobacteria, showed no response
and members of the Acidobacteria showed a marked increase in abundance (Berg
et al. 2012). Pollution-induced community tolerance was significantly correlated to
bioavailable Cu, as determined by the results seen with a Cu-specific biolumines-
cent biosensor strain, demonstrating a specific community response to Cu.
Zinc
Worldwide mean Zn content in soils varies between 17 and 125 mg kg�1. During the
last two decades, Zn as a micronutrient is being used indiscriminately in agricultural
and husbandry practices. The most common and mobile Zn in soil is Zn2+; but several
other ionic species may also occur in soils. In aerobic soils having acidic pH, Zn had
medium mobility as it is predominantly held in exchange sites of clays and organic
matter. Unlike Cu, it does not complex tightly with soil humus in acidic condition.
Chemisorption on sesquioxides and clays and complexation with soil organic matter
markedly reduce Zn mobility at neutral and higher pH. Formation of soluble
Zn-organic complex and Zn-hydroxy anion [Zn(OH)4�2] at alkaline pHmay increase
its solubility. Under reducing environment (as in flooded rice cultivation), release of
Zn+2 from dissolving iron and manganese oxides may temporarily increase its
solubility; but may subsequently get precipitated as extremely insoluble ZnS.
Soluble forms of Zn are readily available to plants and uptake of Zn has been
reported to be linear with concentration in the nutrient solution and in soils. The rate
of Zn absorption differs greatly among plant species and growth media. Even
though Zn is an essential element in our diet, but its too much intake can be harmful.
Selenium
Soil selenium is normally present in the range between 0.05 and 1.25 mg kg�1, in
various oxidation states. Selenites (SeO3�2) predominate under aerobic acidic soil,
which have lower solubility due to strong chemisorptions by oxides and alumino-
silicates. On the other side in aerobic neutral to alkaline soil, it exists mainly as
selenates (SeO4�2), which bind weakly to soil minerals rendering these with higher
mobility. Under reduced condition, microbially mediated methylation of Se may
form volatile compounds making these more mobile. Selenium is essential for
animals and probably for people, but not for plants. However, concentration of Se
less than 4–5 mg kg�1 in the food is often suggested as the amount that will avoid
Se-toxicity. Se in wastewater and sludge is generally present as elemental Se,
selenities bound to hydrous iron oxides, or trimethylselenonium salts. These
forms when applied to soil are not easily available to plants. Thus, chances for
the occurrence of Se-hazards through the application of waste water or sludge
4.3 Inorganic Pollutants 89

containing Se are low. Some pockets of seleniferous soils have been identified in
northwestern India.
Arsenic
Arsenic content ranges from 2.2 to 25 mg kg�1 in the soils of unpolluted area. In
general, soils overlying sulphide ore deposits or derived from shales and granites
and those surrounding geothermal activity, have high arsenic contents. Release
from As-enriched minerals is the primary geogenic source of As in the
environment.
Trivalent arsenite [As(III)] and pentavalent arsenate [As(V)] are the most pre-
dominant forms in soil environment. Under reducing condition, arsenites are
predominantly found; while arsenates are stable in aerobic soils. Arsenates behave
similar to phosphates and undergo various immobilization processes such as sorp-
tion to solid phases such as Fe-, Al-, and Mn- (hydro)oxides, and to a smaller extent
by clay minerals (particularly kaolinite). Arsenic may also bind to organic matter in
soils, with arsenate and arsenite having maximum adsorption on humic acids at
pH 5.5 and 8.0, respectively; though contribution of organic matter is less compared
to oxides and aluminosilicates in this process. Multivalent cations like Fe, Al and
Mn, increases arsenic adsorption by humic substances by bridging complexes for
arsenate on humic acids. Adsorption affinity is higher for As(V) at lower pH values
and for As(III) at higher pH values. As a result, arsenate mobility in aerobic soils is
quite low in acidic condition with high clay and oxides content (as in red and
lateritic soils). Arsenic solubility increases under reduced environment due to
dissolution of Fe and Mn oxides/hydroxides and solubilized As(V) is further
reduced to As(III) compounds.
Certain higher eukaryotic organisms (e.g., fungi) along with specific archaea and
aerobic eubacteria can convert As(V) to As(III), which is then methylated to form
less toxic species, such as monomethylarsonous acid (MMAA), dimethylarsenic
acid (DMA) or trimethylarsine (TMA). However, methylated species are usually
not abundant in aqueous solutions compared to inorganic forms of arsenic. Gener-
ally, inorganic As species are more toxic and mobile than organo-arsenic species,
and As(III) is more toxic and mobile than As(V). Soluble As species are mostly
taken up by plants and organisms and are also responsible for groundwater con-
tamination. Uptake of different forms of As by rice plants follows the order: As
(III)>As(V)>MMAA>DMAA. Upon absorption, inorganic species and MMAA
are mainly accumulated in roots; while DMAA is readily translocated to the shoots
(Carbonell et al. 1998).
Arsenic is phytotoxic as well as a proven carcinogen in human causing skin
cancer and other internal cancers. As a result, concern on the toxicity of As to
humans and other living organisms is increasing. Different crop plants vary in their
tendency to accumulate As from the soil. Lowland rice seems to be especially
susceptible to As-toxicity.
90 4 Major Inorganic Pollutants Affecting Soil and Crop Quality

4.3.2.2 Phytotoxicity of Heavy Metals
Although some heavy metals (Cu, Fe, Mn, Mo, Zn, Co and Ni) are either essential
or beneficial to plant, these are phytotoxic at high concentration. Other heavy
metals (like Cd, Cr, Hg, Pb) do not have any role in plant physiology and are
toxic at concentrations beyond certain critical level. Some plants are able to
regulate heavy metal uptake, while others are able to tolerate high levels in their
tissue. As soon as their critical concentration within plant tissue is exceeded, heavy
metals can adversely affect metabolic processes directly or indirectly (through
substitution of another essential metal in metalloproteins). Further, toxicity of
heavy metals varies greatly from element to element and from species to species
of plants. Some of well established phytotoxic manifestations include generation of
reactive oxygen species and reactive nitrogen species as well as replacement of
enzyme cofactors and transcription factors, inhibitions of antioxidative enzymes,
cellular redox imbalance, ionic transport imbalance, DNA damage and protein
oxidation (Sytar et al. 2013). Genetic diversity among Bermuda grass populations
from Cd contaminated sites was found higher than those from populations from the
neighbouring heavy metal free areas Hunan province of China, which was attrib-
uted to a large number of tolerant individuals, successive colonization events,
pollen flow from adjacent normal populations and human disturbance (Xie et al.
2016). However several other researchers reported either no change or decrease in
genetic diversity among plant species in heavy metal polluted sites (Mengoni et al.
2000; Deng et al. 2007).
Induced Fe deficiency chlorosis due to decreased uptake of Fe and its translo-
cation to leaves is most commonly observed impact of heavy metal pollution on
plant; and severity of chlorosis has been found more with Cu and Ni as compared to
other metals (Bergmann 1992; Pandey and Sharma 2002). Cadmium has been
shown to interfere with the uptake, transport and use of several essential elements
(Ca, Mg, P and K) and water by plants (Das et al. 1997). Roots are damaged first,
where precipitation of proteins in the root and root hairs may lead to its complete
death. Although a great variation between plant species exists, critical leaf tissue
concentrations affecting growth in most species usually are observed in the range of
200–300 μg g�1 for Zn, 15–20 μg g�1 for Cu and 8–12 μg g�1 for Cd on dry weight
basis which indicates Cd is most phytotoxic followed by Cu (Pahlsson 1989).
Exposure to each Co2+, Ni2+ and Cd2+ decreased chlorophyll content (Ni2+>Cd2+
>Co2+), with concomitant decrease in the activities of the Fe enzymes – catalase
and peroxidase, suggesting reduced availability of Fe for chlorophyll–heme bio-
synthesis (Pandey and Sharma 2002).
At a particular given ecological condition, each metal has its own phytotoxicity
potential. Several studies demonstrated and reported the phytotoxicity sequence of
the heavy metals based on the effect of the heavy metals on plant growth, yield,
plant physiology, etc. Copper exerted the most adverse effects on seed germination
and early growth of crop seedlings followed by Zn and Pb (Mahmood et al. 2007).
Wheat and rice seedlings were more susceptible to metal toxicity than barley. Metal
4.3 Inorganic Pollutants 91

toxicity to new root primordia in Salix viminalis followed the order Cd> Cr> Pb,
whereas root length was affected more by Cr than by other heavy metals such as Cd
and Pb (Prasad et al. 2001). In another experiment, Cd was the most toxic metal to
affect plant growth and seed yield of maize (Zea mays L.) followed by Co, Hg, Mn,
Pb, and Cr (Abdul Ghani 2010). Toxicity of heavy metals when assessed using root
elongation of rye grass (Lolium perenne) followed the sequence; Cu> Ni>Mn>Ni>Pb> Cd> Zn> Al> Hg> Cr > Fe (Wong and Bradshaw 1982). Heavy metals
affected root growth and photosynthetic pigments production of white mustard
(Sinapis alba L.) and the order of toxicity followed Cu > Se > Cd > Zn >>Pb
(Fargasova 2004). It can be inferred from above instances of phytotoxicity exper-
iments that Cu and Cd are, by and large more toxic to plants while Pb exhibit less
toxicity. In an experiment on acidic sandy loam soil, order of toxicity of heavy
metals on growth of spinach (Spinacia oleracea L.) were observed as: Cd > Ni >Cr > Cu > Zn and the soil metal levels corresponding to 80% relative yields were
found to be 17.8 mg kg�1 Cd, 176.4 mg kg�1 Cr, 409 mg kg�1 Cu, 153 mg kg�1 Ni,
and 852 mg kg�1 Zn (Saha et al. 2013). Spiking the soil with Pb up to 150 mg kg�1
did not have any significant effect on the above-ground biomass of the plant.
Fig. 4.4 (top-left) Spinach crop with no visible symptom when grown with 0, 50 and 100 mg Cu
kg�1; (top-right) showing retarded growth and toxicity symptoms with application of 400, 500 and
600 mg Cu kg�1; (bottom-left) showing chlorosis of leaf at 400 mg Cu kg�1; (bottom-right)showing necrosis of leaf blade at 600 mg Cu kg�1
92 4 Major Inorganic Pollutants Affecting Soil and Crop Quality

Among the heavy metals investigated, only excess Cu levels showed visible
toxicity symptom on spinach (Fig. 4.4) (Table. 4.6).
4.3.3 Heavy Metals Toxicity in Soil Microorganisms
Heavy metals exhibit toxicity to soil microorganisms, and consequently affect
different microbially mediated soil processes of agricultural importance. Manifes-
tation of toxicity is mostly observed through inhibition of growth, morphology and
activities of various groups of microorganisms including symbiotic N2 fixers like
R. leguminosarum, Mesorhizobium ciceri, Rhizobium sp. and Bradyrhizobiumsp. (Vigna) and Sinorhizobium (McGrath et al. 1988; Khan and Scullion 2002;
Shi et al. 2002; Bondarenko et al. 2010; Arora et al. 2010; Bianucci et al. 2011).
Biological nitrogen fixation is severely affected in contaminated soils due to
expression of heavy metals toxicity by Rhizobia (Barajas-Aceves and Dendooven
2001; Hernandez et al. 2003). In heavy metal polluted sites, the frequency of
tolerant microbes increased with a rise in heavy metal concentrations (Xie et al.
2014). Using Biolog-Ecoplate method, functional diversity of soil microorganism
was analyzed in Cd contaminated or uncontaminated soils from Hunan province of
China (Xie et al. 2016). The study indicated that total bioactivity, richness, and
microbial diversity decreased with increasing concentration of heavy metal.
Nutrient cycling in the soil involves biochemical, chemical, and physicochem-
ical reactions, with biochemical processes being mediated mainly by microorgan-
isms. All the biochemical reactions are catalyzed by enzymes (Tabatabai 1982), and
depending on their nature and level of contamination, many heavy metals have been
found to impede soil enzyme activities to different extents (Tyler 1981; Kuperman
Table 4.6 Major Impacts of different pollutants on plants in brief
Pollutant Its impact on plant
As Red brown necrotic spots on old leaves, yellow browning of roots, growth reduction
Cd Restricted growth, brown margin to leaves, chlorosis: chlorotic patches in older
leaves and severe chlorosis in younger leaves at high level of toxicity, necrosis,
curved leaves, brown stunted roots, reddish veins and petioles, reduction in growth,
purple coloration
Cr Affect seed emergence, stunted plant growth and decreased dry matter production
Pb Dark green leaves, stunted foliage, increased amount of shoots
Ni Chlorosis similar to Fe deficiency, necrosis, stunting, inhibition of root growth,
decrease in leaf area
Hg Severe stunting of seedlings and roots, chlorosis, browning of leaf tips, reduction in
growth, tumor-like proliferations in deformed carrots
Cu Chlorosis, yellow coloration, purple colouration of the lower side of the midrib, less
branched roots, inhibition of root growth
Se Interveinal chlorosis, black spots,bleaching and yellowing of young leaves, pink
spots on root
4.3 Inorganic Pollutants 93

and Carreiro 1997; Welp 1999; Yang et al. 2006). Soil enzyme activities are
reflection of collective metabolism of the soil microbial community and therefore,
reflect the ecological health of terrestrial ecosystems under the influence of soil
heavy metal pollution. Soil enzyme activities such as those of arylsulfatase,
β-glucosidase, acid and alkaline phosphatase, protease, urease, cellulase, dehydro-
genase, protease, and invertase are sensitive to the presence of heavy metals
(Kunito et al. 2001; Effron et al. 2004; Oliveira and Pampulha 2006; Wang et al.
2008).
The activities of soil dehydrogenases, proteases, lipases, and esterases were seen
to decrease significantly with increasing levels of all the heavy metals in the soil
(Saha et al. 2013). The activity of acid phosphatases was, however, not affected
significantly by Pb, whereas the activity of arylsulfatases was significantly
decreased only by Ni and Cr (Fig. 4.5). The ecological dose corresponding to
20% inhibition of enzyme activity (ED20) due to Zn, Cd, and Ni toxicity were
low in case of dehydrogenase, indicating maximal toxicity of these metals. Order of
toxicity of different heavy metals towards dehydrogenase activity followed the
order: Cd >Pb> Cr > Ni > Cu > Zn. Copper and Cr showed maximal toxicity to
proteases, lipases, and esterases, as indicated by the low ED20 levels determined
using fluorescein diacetate substrate. In general, heavy metals showed relatively
lower toxicity towards acid phosphatase and arylsulfatase activities (Saha et al.
2013). Soil levels of all the heavy metals corresponding to 20% decrease in biomass
growth were considerably higher than the limiting levels (ED20) determined for soil
enzyme activities, indicating adverse effects on microbial activity to appear much
earlier than their adverse effects on plant growth (Saha et al. 2013). Mercury
inhibited soil microbial activities like dehydrogenase and nitrification rate. The
critical mercury contents (corresponding to 10% inhibition of enzyme activity)
were found to be less than the available safe limits for inorganic mercury which
demonstrated inadequacy of existing guideline values (Mahbub et al. 2016).
In an experiment under controlled condition, toxicity of different heavy metals
to plants and soil microorganisms were compared (Saha et al. 2013). Phytotoxic
concentration (PT20, resulting in 20% reduction in growth) in soil and plant tissue
followed the order Cd>Ni>Cr>Cu>Zn and Cr>Ni¼Cu>Cd>Zn, respectively
(Table 4.7). Such difference in order of toxicity in plant tissue from soil can be
ascribed to the differences among the heavy metals in transfer rate from soil to
above ground plant biomass. Microbial toxicity (ED20, concentration in soil at
which 20% reduction in microbial activity) in soil followed the order
Cd>Pb>Cr>Ni>Cu>Zn. Lower
4.3.4 Human Health Effects of Heavy Metals
Environmental pollution by heavy metals is of major health concerns all over the
world even if it is at low concentrations due to their long-term cumulative health
effects. Intake of heavy metal through food materials impairs the function of other
94 4 Major Inorganic Pollutants Affecting Soil and Crop Quality

120
100
80
60
40
20
0
120
100
80
60
40
20
0
120
100
80
60
40
20
0
120
100
80
60
40
20
0
120
100
80
60
40
20
0
120
140
100
80
60
40
20
000 50 100 150 200 250
00 500 1000
00
FDA
DHA
Acid Phosphatase
Arylsulphatase
FDA
DHA
Acid Phosphatase
Arylsulphatase
FDA
DHA
Acid Phosphatase
Arylsulphatase
FDA
DHA
Acid Phosphatase
Arylsulphatase
FDA
DHA
Acid Phosphatase
Arylsulphatase
FDA
DHA
Acid Phosphatase
Arylsulphatase
25 50 75 100 125 150 175 10 20
Soil Cd (mg kg-1)Soil Pb (mg kg-1)
Soil Cu (mg kg-1)
Soil Cr (mg kg-1) Soil Ni (mg kg-1)
Soil Zn (mg kg-1)
Rel
. En
zym
e ac
tivi
ty (
%)
Rel
. En
zym
e ac
tivi
ty (
%)
Rel
. En
zym
e ac
tivi
ty (
%)
Rel
. En
zym
e ac
tivi
ty (
%)
Rel
. En
zym
e ac
tivi
ty (
%)
Rel
. En
zym
e ac
tivi
ty (
%)
30
250 500 750 1000 1250
100 200 300
Fig. 4.5 Effects of heavy metal levels in soil on relative soil enzyme activities (FDA ¼ activities
of esterase þ lipase þ protease; DHA ¼ dehydrogenase activity)
4.3 Inorganic Pollutants 95

metal ions and decreases the immunology of body, retardation of growth, poor
mental development, poor psycho-social attitude, and a various type of disabilities
in human beings (Young 1991, Iyengar and Nair 2000, Türkdogan et al. 2003,
Nolan 2003, European Union 2002). Specific effects on human health due to high
heavy metals intake has been indicated as below:
Arsenic
• It is an analogue of phosphate and interferes with the ATP synthesis pathway.
• It is categorized as highly toxic metalloid, inorganic in nature and causes
carcinogenic diseases to skin, lungs, liver and bladder.
• Smaller level exposure caused vomiting and nausea, it impairs the function of
blood cells, i.e. red and white; abnormal the heart beat and very high level results
death.
• Long term exposure lead to dark color of skin and soles; failure of kidney and
liver.
Cadmium
• It has carcinogenic properties.
• Inhalation of very high Cd concentration causes abnormal body biocycles, and
leads to severely irritating stomach, vomiting and diarrhea.
• Long term contact with lesser Cd concentration causes damage to the kidneys
and lungs, and makes the bones fragile.
• Disease caused by Cd poisoning in human has been termed as itai-itai disease
which was detected in Japan in 1968. Disease is characterized by renal tubular
dysfunction associated with atrophic kidney and osteomalacia (softening of the
bones) and has been found among middle aged and elderly women with rela-
tively frequent pregnancy. Survival rate of itai-itai disease patients is signifi-
cantly lower.
Chromium
• Hexavalent Cr(VI) is more toxic to human health.
Table 4.7 Heavy metals
toxicity to plant and soil
microbial activity
PT20 in soil PT20 in spinach tissue ED20 in soil
μM g�1
Cd 0.16 1.17 0.08
Cr 3.39 0.58 0.6
Cu 6.44 1.03 2.82
Ni 2.61 1.02 0.87
Pb – – 0.39
Zn 13.03 37 5.99
Adapted from Saha et al. (2013)
96 4 Major Inorganic Pollutants Affecting Soil and Crop Quality

• Generally Cr(VI) is reduced to Cr(III) in soil in presence of oxidizing com-
pounds, which also reduces its carcinogenicity.
• Intake of the high amount of Cr compounds causes irritation of skin, ulcers in
nose; and its longer exposure causes damage to body organs, i.e. kidney, blood
circulatory system, nervous system and also leads to cancer.
Lead
• It affects children more than adults.
• Higher concentration in children reduces the proper growth of body and mind.
As a result it reduces intelligence; causes short memory, renal failure as well as
poor development of cardiovascular organs.
• In adults, adverse effects like weakness in fingers, higher blood pressure and
abnormal nervous system are observed.
• At high level of contamination, lead may cause death due to failure of multiple-
organs.
• High level of Pb in human body reduces the fertility level of man and causes
abnormal growth of the child during the pregnancy or miscarriage.
Mercury
• As per the EPA guidelines, mercury has been described as a human carcinogen.
• Among the body organs, nervous system is more sensitive to all types of Hg
compounds
• Neurological syndrome caused by severe mercury poisoning is known as
minamata disease. Symptoms include loss of physical control over bodily
movements, numbness in the hands and feet, general muscle weakness, loss of
peripheral vision, and damage to hearing and speech. In extreme cases, insanity,
paralysis, coma, and death follow within weeks of the onset of symptoms. The
disease was first detected in Japan in the year 1956.
• The toxicity can cause lasting damage to most of the body organs specially brain,
kidneys, and developing fetuses.
• Long term exposure of lead results in complete failure of organs and may leads
to death.
• Short term exposure causes irritation, diarrhea, abnormal blood pressure,
vomiting and lung damage.
Selenium
• It is beneficial for human and animal in trace amounts as it plays valuable role in
proper functioning of thyroid gland. However at higher level of contamination, it
causes toxic effect and imparts abnormality in organs. Upper tolerable intake
level of Se is 400 μg/day (ATSDR 2001).
4.3 Inorganic Pollutants 97

• Short period oral intact causes vomiting, nausea and diarrhea.
• The higher level intake of Se causes selenosis in human and animals, which is
characterized by loss of hair, weak nail. Neurological abnormalities are also
observed. It also causes stomach pain due to heavy intake of Se.
• Short term high level of Se exposure causes respiratory abnormalities,
i.e. difficulty in respiration, bronchitis pain or coughing.
4.3.5 Transfer of Heavy Metals in the Food Chain and TheirBioconcentration
Food chain is a linear network of links (organisms) in a food web starting from
producer (such as plant) and ending at apex predator species (like tiger or vulture or
killer whales). Metals are transferred across the food chain which begin with uptake
by plant from soil in an agroecosystem and may end to animals and/or to human by
various routes of food chain. Such transfer of heavy metals assumes severe human
health implication in the polluted ecosystem due to its increased pace and
biomagnification of metals in the tissue of organisms. Widely reported minamata
disease in Japan due to Hg poisoning in human population is a classic example of
biomagnifications of heavy metals. The level of different heavy metals (Hg, Cd, Pb)
was studied in the producers (food plants) and consumers (four species of acridid
grasshoppers) of a grassland of Greece (Devkota and Schmidt 2000). The solely
herbivorous grasshoppers had a significantly higher Cd and Hg concentrations than
in the food plants indicating their biomagnifications. On the contrary, Pb concen-
tration in grasshoppers was always lower than in their food plants. The accumula-
tion factor (concentration in grasshoppers/concentration in food plants) followed
the order Cd>Hg>Pb. Transfer of heavy metals along a soil-plant-insect-chicken
food chain at contaminated sites were investigated near lead-zinc mine in China
(Zhuang et al. 2009). While concentrations of Zn, Pb and Cu increased slightly from
plant to insect larva, Cd concentrations steadily declined with increasing trophic
level. Major fraction of Pb, Zn, Cu, and Cd entered in the insect and chicken body is
excreted through feces, avoiding metal bioaccumulation in insect and chicken body.
While monitoring Cu and Cd concentrations in a population of the grass hopper
in and around a copper refinery, Hunter et al. (1987) observed Cu accumulation of
up to 1600 μg/g among grasshoppers particularly in integuments indicating metal
exclusion mechanism to protect vital organs.
Polar Eskimos in North West Greenland have high dietary access to methylmer-
cury, though the area has no history of accidental mercury pollution (Hansen and
Dasher 1997). Such example of biomagnification occurred because population in
the area routinely consumes fish or a particular species of fish increasing the risk of
methylmercury poisoning of aquatic origin. The transformation from the hydro-
philic (Hg+2) to the lipophilic state (methyl mercury) makes it more prone to
98 4 Major Inorganic Pollutants Affecting Soil and Crop Quality

biomagnification in aquatic food chain. Polar bears occupy a higher trophic level
than bearded seals (Erignathus barbatus) and mercury increased significantly from
seal to polar bear tissues indicating biomagnifications (Dehn et al. 2006). On the
contrary, such biomagnification was not observed for Cd where concentrations of
renal and hepatic Cd were significantly lower or not statistically different in polar
bears compared to their primary prey ringed seals (Phoca hispida) and bearded
seals (Erignathus barbatus).Study on bioaccumulation in human tissue is limited. A study was conducted on
the trends of concentration of persistent organic pollutants, Hg and Pb in umbilical
cord blood of newly born infants belonging to indigenous inhabitants of northern
Quebec (Canada) (Dallaire et al. 2003). Those community people consume large
quantities of marine food and therefore, are exposed to high doses of food chain
contaminants. Organic pollutants PCBs, DDT and HCB were found decreasing
from 1994 through 2001. A significant reduction of Pb and Hg concentrations were
also observed, though the trend was not clear. Such decreases in pollutants con-
centrations in human tissue were suspected to be due to observed decrease in food
contamination and/or to changes in dietary habits.
Potential health risks of heavy metals were assessed in Anhui province of
Eastern China having high urban and industrial activity besides agricultural activity
in some parts (Zhao et al. 2014). Although soils of the area contained heavy metals
within safe limit, mean concentrations of Cr and Hg in grain exceeded the safety
limits. The grain carcinogenic risk for Cr, Pb and As exceeded the accepted risk
level and The target hazard quotient (THQ) of Cr, Pb, As and Hg exceeded the
target value of 1, indicating a level of exposure sufficient to cause adverse
non-carcinogenic health risks during a person’s lifetime. Bioconcentration factor
(concentration in grainconcentration in soil ) values of heavy metals decreased in the sequence Hg > Se > Cd
> Cr > Pb > As. Human gastric cancer correlated significantly with topsoil Pb
concentration and human liver cancer correlated significantly with grain Hg. The
study concluded that long-term low dose exposure of heavy metals may play a key
role in cancer development in human.
References
Adhikari T, Biswas AK et al (2012) Heavy metal pollution in soil-plant system and its remediation,
IISS Technical Bulletin. Indian Institute of Soil Science, Bhopal
Adviento-Borbe MAA, Doran JW, Drijber RA, Dobermann A (2006) Soil electrical conductivity
and water content affect nitrous oxide and carbon dioxide emissions in intensively managed
soils. J Environ Qual 35:1999–2010
Akerblom S, Baath E, Bringmark L, Bringmark E (2007) Experimentally induced effects of heavy
metals on microbial activity and community structure of forest mor layers. Biol Fertil Soils
44:79–91
Apte AD, Verma S, Tare V et al (2005) Oxidation of Cr (III) in tannery sludge to Cr (VI): field
observations and theoretical assessment. J Hazard Mater 121(1–3):215–222
References 99

Arora NK, Khare E, Singh S, Maheshwari DK (2010) Effect of Al and heavy metals on enzymes of
nitrogen metabolism of fast and slow growing rhizobia under explanta conditions. World J
Microbiol Biotechnol 26:811–816
ATSDR (2001) Toxicological profile for selenium. Agency for Toxic Substances and Disease
Registry, U.S. Department of Health and Human Services, Public Health Service, Division of
Toxicology/Toxicology Information Branch, Atlanta
ATSDR (2005) Toxicological profile for nickel. Agency for Toxic Substances and Disease
Registry, U.S. Department of Health and Human Services, Public Health Service, Division
of Toxicology/Toxicology Information Branch, Atlanta
Ayers RS, Westcot DW (1976) Water Quality for Agriculture. FAO Irrigation and Drainage Paper
No, 29 (Rev 1), Food and Agriculture Organization of the United Nations
Barajas-Aceves M, Dendooven L (2001) Nitrogen, carbon and phosphorus mineralization in soils
from semi-arid highlands of central Mexico amended with tannery sludge. Bioresour Technol
77:121–130
Berg J, Brandt KK, Al-Soud WA et al (2012) Selection for Cu-tolerant bacterial communities with
altered composition, but unaltered richness, via long-term Cu exposure. Appl Environ
Microbiol 78:7438–7446
Bergmann W (1992) Nutritional disorders of plants. Gustav Fischer, Jena/Stuttgart/New York
Bianucci E, Fabra A, Castro S (2011) Cadmium Accumulation and Tolerance in Bradyrhizobium
spp. (Peanut Microsymbionts). Curr Microbiol 62:96–100
Bondarenko O, Rahman PKSM, Rahman TJ, Kahru A, Ivask A (2010) Effects of rhamnolipids
from Pseudomonas aeruginosa DS10-129 on luminescent bacteria: toxicity and modulation of
cadmium bioavailability. Microb Ecol 59:588–600
Brookes PC, McGrath SP (1984) The effect of metal toxicity on the size of soil microbial biomass.
J Soil Sci 35:341–346
Brookes PC, McGrath SP et al (1986) Metal residues in soils previously treated with sewage-
sludge and their effects on growth and nitrogen fixation by blue green algae. Soil Biol Biochem
18:345–353
Carbonell AA, Aarabi MA, DeLaune RD, Gambrell RP, Patrick WH (1998) Arsenic in wetland
vegetation: availability, phytotoxicity, uptake and effects on plant growth and nutrition. Sci
Total Environ 217:189–199
Chaney RL, Ryan JA (1994) Risk based standard for As, Pb, and Cd in urban soils. DECHEMA,
Frankfurt, p 25
Chaney RL, Ryan JA, Brown SL (1999) Environmentally acceptable endpoints for soil metals. In:
Anderson WC et al (eds) Environmental availability in soils: chlorinated organic, explosives,
metals. American Academy of Environmental Engineers and Scientists, Annapolis, pp
111–154
Chaudri AM, McGrath SP, Giller KE, Rietz E, Sauerbeck DR (1993) Enumeration of indigenous
Rhizobium leguminosarum biovar trifolii in soils previously treated with metal –contaminated
sewage-sludge. Soil Biol Biochem 25:301–309
Connor JJ (1990) Bedrock geochemistry and the environment. In: Doe BR (ed) Proceedings of a
U.S. Geological Survey Workshop on Environmental Geochemistry, US Geological Survey
circular 1033. U.S. Department of The Interior, Washington DC, pp 61–62
Coors A, De Meester L (2008) Synergistic, antagonistic and additive effects of multiple stressors:
predation threat, parasitism and pesticide exposure in Daphnia magna. J Appl Biol
45:1820–1828
CPCB (2010) Protocol for performance evaluation and monitoring of the common hazardous
waste treatment Storage and disposal facilities including common hazardous waste incinera-
tors, Hazardous waste management series. Central Pollution Control Board, New Delhi
Dallaire F, Dewailly E, Muckle G, Ayotte P (2003) Time trends of persistent organic pollutants
and heavy metals in umbilical cord blood of inuit infants born in Nunavik (Quebec, Canada)
between 1994 and 2001. Environ Health Perspect 111:1660–1664
100 4 Major Inorganic Pollutants Affecting Soil and Crop Quality

Das P, Samantaray S, Rout GR (1997) Studies on cadmium toxicity in plants: a review. Environ
Pollut 98:29–36
Dehn LA, Follmann EH, Thomas DL et al (2006) Trophic relationships in an Arctic food web and
implications for trace metal transfer. Sci Total Environ 362:103–123
Deng J, Liao B, Ye M, Deng D, Lan C, Shu W (2007) The effects of heavy metal pollution on
genetic diversity in zinc/cadmium hyperaccumulator Sedum alfredii populations. Plant Soil297:83–92
Devkota B, Schmidt GH (2000) Accumulation of heavy metals in food plants and grasshoppers
from the Taigetos Mountains, Greece. Agric Ecosyst Environ 78:85–91
Diagboya PN, Olu-Owolabi BI, Adebowale KO (2015) Effects of time, soil organic matter, and
iron oxides on the relative retention and redistribution of lead, cadmium, and copper on soils.
Environ Sci Pollut Res 22:10331–10339
Effron D, de la Horra AM, Defrieri RL, Fontanive V, Palma PM (2004) Effect of cadmium,
copper, and lead on different enzyme activities in a native forest soil. Commun Soil Sci Plant
Anal 35:1309–1321
European Union (2002) Heavy metals in wastes, European Commission on Environment. http://ec.
europa.eu/environment/waste/studies/pdf/heavy_metalsreport.pdf. Accessed 16 Sept 2016
Fargasova A (2004) Toxicity comparison of some possible toxic metals (Cd, Cu, Pb, Se, Zn) on
young seedlings of Sinapis alba L. Plant Soil Environ 50:33–38
Ghani A (2010) Toxic effects of heavy metals on plant growth and metal accumulation in maize.
Iranian J Toxicol 3:325–334
Gu B, Bian Y, Miller CL et al (2011) Mercury reduction and complexation by natural organic
matter in anoxic environments. Proc Natl Acad Sci U S A 108:1479–1483
Hansen JC, Dasher G (1997) Organic mercury: an environmental threat to the health of dietary
exposed societies? Rev Environ Health 12:107–116
Hanson B, Grattan SR, Fulton A (1999) Agricultural salinity and drainage. University of Califor-
nia irrigation program. University of California, Davis
Hernandez L, Probst A, Probst JL, Ulrich E (2003) Heavy metal distribution in some French forest
soils: evidence for atmospheric contamination. Sci Total Environ 312:195–219
Hope BK (2006) An examination of ecological risk assessment and management practices.
Environ Int 32(8):983–995
Hunter BA, Hunter LM, Johnson MS, Thompson DJ (1987) Dynamics of metal accumulation in
the grasshopper Chorthippus brunneus in contaminated grasslands. Arch Environ Contam
Toxicol 16:711–716
Iyengar V, Nair P (2000) Global outlook on nutrition and the environment: meeting the challenges
of the next millennium. Sci Total Environ 249:331–346
Khan M, Scullion J (2002) Effects of metal (Cd, Cu, Ni, Pb or Zn) enrichment of sewage-sludge on
soil micro-organisms and their activities. Appl Soil Ecol 20:145–155
Kunito T, Saeki K, Nagaoka K, Oyaizu H, Matsumoto S (2001) Characterization of copper-
resistant bacterial community in rhizosphere of highly copper-contaminated soil. Eur J Soil
Biol 37:95–102
Kuperman RG, Carreiro MM (1997) Soil heavy metal concentrations, microbial biomass and
enzyme activities in a contaminated grassland ecosystem. Soil Biol Biochem 29:179–190
Liu WX, Shen LF, Liu JW (2007) Uptake of toxic heavy metals by rice (Oryza sativa L) cultivatedin the agricultural soil near Zhengzhou City, People’s Republic of China. Bull Environ ContamToxicol 79:209–213
Mahbub KR, Krishnan K, Megharaj M, Naidu R (2016) Mercury Inhibits Soil Enzyme Activity in
a Lower Concentration than the Guideline Value. Bull Environ Contam Toxicol 96:76–82
Mahmood T, Islam KR, Muhammad S (2007) Toxic effects of heavy metals on early growth and
tolerance of cereal crops. Pak J Bot 39:451–462
Maliwal GL, Somani LL (2010) Nature, properties and management of saline and alkali soils.
Agrotech Publishing Academy, Udaipur
References 101

Markus J, Mcbratney AB (2001) A review of the contamination of soil with lead II. Spatial
distribution and risk assessment of soil lead. Environ Int 27:399–411
Martensson AM, Witter E (1990) Influence of various soil amendments on nitrogen fixing soil
organisms in a long-term field experiments, with special reference to sewage sludge. Soil Biol
Biochem 22:977–982
McBride MB (1994) Environmental chemistry of soils. Oxford University Press Inc, New York
McGrath SP (1993) Soil quality in relation to agricultural use. In: HJP E, Hamers T (eds)
Integrated soil and sediment research: a basis for proper protection. Kluwer Academic Pub-
lishers, Dordrecht, pp 187–200
McGrath SP, Brookes PC, Giller KE (1988) Effects of potential toxic metals in soil derived from
past applications of sewage sludge on nitrogen fixation by Trifolium repens L. Soil Biol
Biochem 20:415–424
Mengoni A, Gonnelli C, Galardi F et al (2000) Genetic diversity and heavy metal tolerance in
populations of Silene paradoxa L. (Caryophyllaceae):a random amplified polymorphic DNA
analysis. Mol Ecol 9:1319–1324
Metternicht GI, Zinck JA (2003) Remote sensing of soil salinity: potentials and constraints.
Remote Sens Environ 85:1–20
Munns Jr WR (2006) Assessing risks to wildlife populations from mulitple stressors: Overview of
the problem and research needs. Ecol Soc 11(1):23. http://www.ecologyandsociety.org/vol11/
iss1/art23/
NHMRC (1992) Australian and New Zealand guidelines for the assessment and management of
contaminated sites. Australian and New Zealand Environment and Conservation Council
(ANZECC) and National Health and Medical Research Council (NHMRC), Gov. of
Australia. https://www.nhmrc.gov.au/guidelines-publications/eh17. Accessed 16 Sept 2016
Nolan K (2003) Copper toxicity syndrome. J Orthomol Psych 12:270–282
NRC (1983) Risk assessment in the federal government: managing the process. National Research
Council, National Academy Press, Washington, DC
Oliveira A, Pampulha ME (2006) Effects of long-term heavy metal contamination on soil
microbial characteristics. J Biosci Bioeng 102:157–161
Oster JD, Sposito G (1980) The gapon coefficient and the exchangeable sodium percentage-
sodium adsorption ratio relation. Soil Sci Soc Am J 44:258–260
Pacyna JM, Pacyna EG (2001) An assessment of global and regional emissions of trace metals to
the atmosphere from anthropogenic sources worldwide. Environ Rev 9:269–298
Pahlsson AB (1989) Toxicity of heavy metals (Zn, Cu, Cd, Pb) to vascular plants. Water Air Soil
Pollut 47:287–319
Pandey N, Sharma C (2002) Effect of heavy metals Co2+, Ni2+ and Cd2+ on growth and
metabolism of cabbage. Plant Sci 163:753–758
Pathak H, Rao DLN (1998) Carbon and nitrogen mineralization from added organic matter in
saline and alkali soils. Soil Biol Biochem 30:695–702
Prasad MNV, Greger M, Landberg T (2001) Acacia nilotica bark removes toxic elements from
solution: corroboration from toxicity bioassay using Salix viminalis in hydroponic system. Int J
Phytoremed 3:289–300
Rengasamy P, Churchman GJ (1999) Cation exchange capacity, exchangeable cations and
sodicity. In: Peverill K et al (eds) Soil analysis and interpretation manual. CSIRO Publishing,
Melbourne, pp 35–50
Richard FC, Bourg ACM (1991) Aqueous geochemistry of chromium: a review. Wat Res
25(7):807–816
Rooney CP, Zhao F, McGrath SP (2007) Phytotoxicity of nickel in a range of European soils:
influence of soil properties, Ni solubility and speciation. Environ Pollut 145:596–605
Ryan JA, Chaney RL (1997) Issues of risk assessment and its utility in development of soil
standards: the 503 methodology as an example. In: Prost R (ed) Contaminated Soils: Pro-
ceedings of the third international symposium on biogeochemistry of trace elements, Paris,
France, 15–19 May 1995. Colloque No. 85. INRA Editions, Paris. pp 393–414
102 4 Major Inorganic Pollutants Affecting Soil and Crop Quality

Saha JK (2005) Changes in salinity and sodicity of soils with continuous application of contam-
inated water near Industrial area. J Indian Soc Soil Sci 53:612–617
Saha JK, Sharma AK (2006) Impact of the use of polluted irrigation water on soil quality and crop
productivity near Ratlam and Nagda industrial area, IISS Bulletin. Indian Institute of Soil
Science, Bhopal, p 26
Saha JK, Panwar N et al (2010a) An assessment of municipal solid waste compost quality
produced in different cities of India in the perspective of developing quality control indices.
Waste Manag 30:192–201
Saha JK, Panwar N, Singh MV (2010b) Determination of lead and cadmium concentration limits
in agricultural soil and municipal solid waste compost through an approach of zero tolerance to
food contamination. Environ Monit Assess 168:397–406
Saha JK, Panwar N et al (2013) Risk assessment of heavy metals in soil of a susceptible agro-
ecological system amended with municipal solid waste compost. J Indian Soc Soil Sci
61:15–22
Sauerbeck DR (1986) Effects of agricultural practices on the physical, chemical and biological
properties of soils: part II, use of sewage sludge and agricultural wastes. In: Barth H, Hermite
PL (eds) Scientific basis for soil protection in the European community. Elsevier, London, pp
181–210
Sauve S, McBride M, Hendershot W (1997) Speciation of lead in contaminated soils. Environ
Pollut 98:149–155
Segner H, Schmitt-Jansen M, Sabater S (2014) Assessing the impact of multiple stressors on
aquatic biota: the receptor’s side matters. Environ Sci Technol 48:7690–7696
Shanker AK, Cervantes C, Loza-Tavera H, Avudainayagam S (2005) Chromium toxicity in plants.
Environ Int 31:739–753
Shi W, Bischoff M, Turco R, Konopka A (2002) Long-term effects of chromium and lead upon the
activity of soil microbial communities. Appl Soil Ecol 21:169–177
Silva CMMS, Fay EF (2012) Effect of Salinity on Soil Microorganisms, Soil Health and Land Use
Management, Dr. Maria C. Hernandez Soriano (Ed.), ISBN: 978–953–307-614-0, InTech,
Available from: http://www.intechopen.com/books/soil-health-and-land-use-management/
effect-of-salinity-on-soil-microorganisms
Smith JL, Doran JW (1996) Measurement and use of pH and electrical conductivity for soil quality
analysis. In: Doran JW, Jones AJ (eds) Methods for assessing soil quality. Soil Science Society
of America Spec Publ 49, SSSA, Madison, pp 169–185
Sullivan DM, Miller RO (2001) Compost quality attributes, measurements, and variability. In:
Stofella PJ, Kahn BA (eds) Compost utilization in horticultural cropping systems. Lewis
Publishers, New York, pp 97–120
Sytar O, Kumar A, Latowski D et al (2013) Heavy metal-induced oxidative damage, defense
reactions, and detoxification mechanisms in plants. Acta Physiol Plant 35:985–999
Tabatabai MA (1982) Soil enzymes. In: Page AL, Miller RH, Keeney DR (eds) Methods of soil
analysis, part 2, chemical and microbiological properties, Monograph no. 9. ASA-SSSA,
Madison, pp 903–947
Theelen RMC (1997) Concepts in the Netherlands of risk assessment of soil contamination. Int J
Toxicol 16:509–518
Tripathi S, Chakrabarty A et al (2007) Enzyme activities and microbial biomass in coastal soils of
India. Soil Biol Biochem 39:2840–2848
Türkdogan MK, Fevzi K, Kazim K, Ilyas T, Ismail U (2003) Heavy metals in soil, vegetables and
fruits in the endemic upper gastrointestinal cancer region of Turkey. Environ Toxicol
Pharmacol 13:175–179
Tyler G (1981) Heavy metals in soil biology and biochemistry. In: Paul EA, Ladd JN (eds) Soil
biochemistry. Marcel Dekker Inc., New York, pp 371–414
Wang Y, Li Q, Shi J et al (2008) Assessment of microbial activity and bacterial community
composition in the rhizosphere of a copper accumulator and a non-accumulator. Soil Biol
Biochem 40:1167–1177
References 103
Welp G (1999) Inhibitory effect of the total watersoluble concentrations of nine different metals on
the dehydrogenase activity of a loess soil. Biol Fertil Soils 30:132–139
Wong MH, Bradshaw AD (1982) A comparison of the toxicity of heavy metals, Using root
elongation of Rye Grass, Lolium perenne. New Phytol 91:255–261
Xie Y, Luo H, Du Z, Hu L, Fu J (2014) Identification of cadmium- resistant fungi related to Cd
transportation in bermuda grass [Cynodon dactylon (L.) Pers.] Chemosphere 117:786–792
Xie Y, Fan J, Zhu W et al (2016) Effect of heavy metals pollution on soil microbial diversity and
bermudagrass genetic variation. Front Plant Sci 7(755):1–12. doi:10.3389/fpls.2016.00755
Yang Z, Liu S, Zheng D, Feng S (2006) Effects of cadmium, zinc, and lead on soil enzyme
activities. J Environ Sci 18:1135–1141
Young RA (1991) Toxicity profiles: toxicity summary for cadmium, Risk Assessment Information
System, University of Tennessee. https://rais.ornl.gov/tox/profiles/cadmiu_c.html. Accessed
21 Mar 2016
Zhao Q,Wang Y, Cao Y et al (2014) Potential health risks of heavy metals in cultivated topsoil and
grain, including correlations with human primary liver, lung and gastric cancer, in Anhui
province, Eastern China. Sci Total Environ 470–471:340–347
Zhuang P, Zou H, Shu W (2009) Biotransfer of heavy metals along a soil-plant-insect-chicken
food chain: field study. J Environ Sci 21:849–853
104 4 Major Inorganic Pollutants Affecting Soil and Crop Quality

Chapter 5
Organic Pollutants
Abstract Concerns on organic pollutants as threat to environment is increasingly
perceived since later half of the previous century. Although initially focus was on
some of the pesticides used in controlling insects in agriculture and disease spread-
ing vectors in residential area, concerns on several other types of organic pollutants
increased afterwards with activities of chemical and petrochemical industries and
use of xenobiotics in many lifestyle products. Threat from organic pollutants arises
many a times due to their extreme toxicity at very low level of exposure as well as
their high persistency in the soil. Due to advancements in detection capabilities,
researchers have generated considerable information on the source, routes of
contamination to soil, interactions with soil constituents, degradability by and
impact on soil microorganisms, uptake by plants and contamination of food etc.
The impacts on agroecosystem are indicated as multidimensional like food con-
tamination, reduced soil enzymes activity leading to disruption in nutrient trans-
formation processes, diminished biodiversity, mutagenicity among microorganisms
etc. Most common groups of organic pollutants in soil including polycyclic aro-
matic hydrocarbons (PAHs), polychlorinated biphenyls (PCBs), pesticides, dye
pollutants, antibiotics are discussed for their sources, fate and impact on the
ecosystem.
Keywords Soil • Food • Water • Pollution • Polycyclic aromatic hydrocarbons •
Polychlorinated biphenyls • Persistent organic pollutants • Dye • Antibiotics
The soil quality is immediate concern for most people, because we all depend on
this natural resource on a daily basis for food, fodder, fibre and fuel. Due to intense
pressure on land resource from industrial and urban related activities, soil gets
contaminated or polluted; as a result its quality is at greater risk to sustain plant,
animal and human life on long run. Soil is contaminated with various organic
pollutants from various sources like industrial effluents discharges containing
toxic pollutants, improper disposal of urban and industrial solid waste, and acci-
dental spillage of contaminants during transportation or handling of hazardous
materials and indiscriminate use of pesticide and fertilizers. This chapter attempts
to discuss in details about various potential organic pollutants particularly those,
which contribute considerably to environmental pollution and their adverse impact
on soil, plant and microbes. Organic pollutants can be both naturally occurring and
© Springer Nature Singapore Pte Ltd. 2017
J.K. Saha et al., Soil Pollution - An Emerging Threat to Agriculture, Environmental
Chemistry for a Sustainable World 10, DOI 10.1007/978-981-10-4274-4_5
105

synthesised compounds and may pollute agro-ecosystem either deliberately
through crop management activities or accidentally through entry of industrial/
urban wastes. Their behaviour and fate in the soil depend mainly on their chemical
structure, which determines interactions with mineral particulates, organic matter,
water, gas and biota of the soil.
Most common organic pollutants are pesticides, polycyclic aromatic hydrocar-
bons (PAHs), polychlorinated biphenyls (PCBs), BTEX (benzene, toluene, ethyl-
benzene, and xylenes), other persistent organic pollutants (POPs) trichloroethylene
(TCE), and perchloroethylene, nitro-aromatic compounds, organophosphorus com-
pounds, petroleum oil, etc. These organic pollutants must be investigated thor-
oughly and controlled as they cause life /life-style threatening diseases such as
cataracts, kidney and liver damage, jaundice and cancer; as well as degrade immune
system, reproductive system, nervous system, endocrine system of human beings.
Beyond the potentially harmful effects on humans, these chemicals affect the
biogeochemical cycle and the ecosystem conservation. These organic pollutants
even at low concentration in soil may inhibit metabolic activities and growth of
soil-associated microbes (Moore et al. 2006). The advanced research has also
proved that the few azo-dyes cause bladder cancer, hepatocarcinomas and chromo-
somal aberrations in mammalian cells in human and animal system.
5.1 Organic Pollutants Entry in Soil, Its Uptake by Plantand Food Chain Contamination
Organic pollutants can reach the soil either by purpose, such as pesticides and other
agricultural chemicals, or incidentally through a variety of materials commonly
used in agricultural practices, e.g., fertilizers and amendments. Once on the soil
surface, the organic pollutant can be partially photo-decomposed and/or volatilized,
and partially enter the soil or be transported to surface aquatic bodies by runoff
and/or erosion. When in the soil, the pollutant can be subjected to partial or total
chemical decomposition and/or biodegradation. The original pollutant and possi-
bly, its breakdown products may be adsorbed to soil organic and inorganic constit-
uents, taken-up by plant roots, and/or leached through the unsaturated zone
eventually reaching the groundwater. All these processes are controlled by several
factors including the physical and chemical properties of the pollutant and its
breakdown products, the nature and thickness of the soil, the amount of water
applied to the soil, and the type and extent of interactions between the pollutant and
soil components.
Different models for uptake of organic chemicals have been proposed (Trapp
2004; Dettenmaier 2008). Organic chemicals are generally taken up by plant roots via
vapor or water phases of soil through active (phenoxy acid herbicides), passive and
diffusive process (Bromilow and Chamberlain 1995) and transported to the above
ground biomass. Uptake of organic compounds through plant transpiration stream is
106 5 Organic Pollutants

significant for slightly hydrophobic compounds, but may be severely restricted for
soil-bound highly hydrophobic compounds in many higher plants (Bromilow and
Chamberlain 1995; Briggs et al. 1982; Ryan et al. 1988). Recent evidence indicates
that plants can also translocate some hydrophilic compounds. Such organic com-
pounds likely to be translocated by plants more closely resemble those that can cross
the blood � brain barrier as compared to the intestine (Limmer and Burken 2014).
Experimental evidences have shown that PAHs, chlorobenzenes, PCBs, and
polychlorinated dibenzo-p-dioxins/dibenzofurans (PCDD/Fs) are found accumulated
significantly in plant roots (Duarte-Davidson and Jones 1996). In addition to the
chemical properties of the contaminant, plant root anatomy plays a major role in
uptake mechanism. The higher uptake of organic contaminants by barley plant root
over beans root is probably due to higher lipid content in the root of former plant
(Bromilow and Chamberlain 1995). Similar observation on organic contaminants
uptake based on lipid content in roots has been reported by Fismes et al. (2002) and
Wild and Jones (1992). Specific surface area and lipid content were found the most
crucial factors for phenanthrene (a PAH compound) uptake with contribution of
former being greater than that of lipid content (Zhan et al. 2013). However, no
correlation was found between phenanthrene uptake and total root length, and root-
water. Several pharmaceuticals compounds have also been found to be taken up by
plants. For example diclofenac which has been held responsible for collapse of
vulture population in south Asia, was found to accumulate in plant through root
uptake (Carter et al. 2014). These evidences indicate that organic pollutants may be
taken up by plants from soil and accumulate in above ground plant biomass. Another
model was proposed for plant contamination with pollutants based on aerial deposi-
tion, soil volatilization, and systemic translocation pathway (Collins and Finnegan
2010). However, this pathway could be significant only in locations with pollutant
concentrations >100 mg kg�1 in soil. If such organic contaminant accumulated
biomass is used for feeding livestock, it consequently increases the probability of
exposure of pollutants to humans. In the following sections of this chapter, some of
the commonly found organic pollutants, their sources and its effect on soil, plant and
human life have been discussed in details.
5.1.1 Pesticides
Pesticides are substances or mixtures of substances used in various terms like
herbicides, insecticides, fungicides, rodenticides, molluscicides, and nematicides
to prevent, destroy or control any pest, and these are widely used mainly in
agriculture and in domestic sector. Based on the chemical constituents, pesticides
are classified as organochlorine, organophosphate, carbamate, synthetic
pyrethroides and inorganic pesticides. There is another class of pesticides which
is produced from natural materials called as biopesticide. These various pesticide
formulations have been extensively used for decades and have significantly
increased food production.
5.1 Organic Pollutants Entry in Soil, Its Uptake by Plant and Food Chain. . . 107

Global insecticide use in 2007 has been estimated at 404000 t of active ingre-
dient (Grube et al. 2011). The agricultural sector is the primary user of pesticides,
consuming over four million tons (Mt) of pesticides annually. However, according
to an estimate by Abhilash and Singh (2009), about 2 Mt. of pesticides are
consumed every year throughout the world; and out of these 24% is consumed in
USA, 45% in Europe and 25% in rest of the world. Among the Asian countries,
pesticide consumption is the highest in China followed by Korea, Japan and India.
The usage of pesticide in India is about 0.5 kg/ha, of which major contribution is
from organochlorine pesticides. In global level, the consumption of herbicide is the
highest, whereas in India and other tropical countries, the consumption of insecti-
cides is more. This is due to increased insect pest attack caused mainly by the
prevailing warm humid climatic condition.
Some of the pesticides were banned several decades before due to longer
persistence in the environment. Even after prohibition on use in most of the
countries around the world, organochlorines are still found in agricultural soil,
sediment and groundwater (Singh and Singh 2006, Matin et al. 1998; Singh 2001;
Manirakiza et al. 2003; Goncalves and Alpendurada 2005; Hilber et al. 2008). The
organochlorine insecticides such as dichlorodiphenyl-trichloroethane (DDT) and
hexachlorocyclohexane (HCH) were used widely previously in India due to their
effectiveness in controlling malaria, locust and wide range of insects effectively.
Presently, many organochlorine pesticides have been banned since 2003, except for
DDT (permitted only for restricted use in disease spreading vector control) (Singh
et al. 2007). However, some of these pesticides are still preferred by the small
farmers because they are cost effective, easily available, and display a wide
spectrum of bioactivity (Devi and Raha 2013). Intense and frequent use of these
chemicals has led to accumulation of pesticides in soil due to lack of their speedy
degradation. Low solubility and high structural stability of the pesticide limit their
degradation in soil via chemical and biochemical processes by plants and microbes.
Most of the hydrophobic pesticides are adsorbed to soil surface or to organic matter
and get sequestrated into tiny pores of soil matrix, becoming less bioavailable. Soil
microorganism generally degrades pesticides and converts them into less toxic
form; but many a times, end products become more toxic than the original pesticide.
Some of the factors that influence their persistency are microbial diversity, rainfall,
soil temperature, exposure to sunlight, application rate as well as their solubility
and mobility in soil.
5.1.1.1 Pesticides on Food Chain Contamination and Human Health
Generally less than 1% applied pesticides are used for the control of insect pest in
crops (Arias-Estevez et al. 2008) and remaining unused pesticide contaminates soil,
water and crop produce. Further, indiscriminate use of pesticides by the farmers’due to lack of awareness also results in their unwanted entry into soil with
consequent adverse effects on the environment (Igbedioh 1991; Jeyaratnam 1985;
Saiyed et al. 2003; Karunakaran 1958). Thus continued application of pesticides
108 5 Organic Pollutants

increases their concentration in soils and waters, which have adverse effect on
different strata of organisms. The extent of these effects however, depends on the
toxicity of the pesticides and degree of sensitivity of the organisms. This negative
impact of pesticides is mainly due to the highly toxic, stable, less soluble active
ingredients of pesticide. Among the various pesticides used, organochlorine pesti-
cides pose serious health concerns. This group includes atrazine, DDT, benzene
hexachloride (BHC), Lindane and Endosulfan. Humans are exposed to pesticides
(found in environmental media such as soil, water, air and food) by different routes
such as inhalation, ingestion and dermal contact, and such exposure results in acute
and chronic health problems. Some of the chronic and acute toxicological effects of
pesticides are chronic liver damage, endocrine and reproductive disorders,
immune-suppression, various cancer, inhibition of choline esterases, Parkinson’sand Alzheimer’s diseases etc. (Ceron et al. 1995). Death and chronic illness caused
by pesticide poisoning numbers about 1 million per year (Lorenz 2006).The World
Health Organization has estimated that about 200,000 people are killed by pesti-
cides worldwide every year. Even after ban, residues of organochlorine pesticides
had been detected in edible crops, fruit, milk samples because of their transfer from
soil through food chain (Jensen 1983; Banerjee et al. 1997). The incidence of
pesticides contamination in the food chain is being reported regularly and is
expected to increase in the future due to heavy dosage of pesticide use (Devi and
Raha 2013). Organophosphate pesticides are generally regarded as safer as com-
pared to organochlorine pesticides for use on crops and animals due to their
relatively fast degradation rates.
Dieldrin and endrin residues in agricultural fields cause contamination of not
only the aquatic environment but also of crops grown in contaminated soil. High
levels of these pesticides have been detected in soils and in a variety of crops around
the world. In spite of ban or restriction in use of organochlorine pesticides, their
concentrations have been reported in soil of different countries (Table 5.1).
Although use of pesticides in general is quite low in Africa, the presence of
organochlorine pesticides in food crops have been reported from many countries in
that continent. In Togo, West Africa, dieldrin and endrin residue levels of 39.50 and
13.16 ng g�1, respectively, were found in cowpea and a dieldrin residue level of
18.09 ng g�1 was found in maize (Mawussi et al. 2009). In Nigeria, dieldrin
residues of 6–80 ng g�1 were found in tubers (Adeyeye and Osibanjo 1999).
Researchers from other countries have also reported residues of these pesticides
in food; for example in cucumbers in Japan (Hashimoto 2005), winter squash in the
USA (Johgenson 2001), in wheat in Serbia (Skrbic 2007) and vegetables such as
spinach, garlic leaf, and pumpkin in China (Gao et al. 2005).
DDT and HCH concentrations in soils from India were lower and comparable
with other locations of the world. Using the ratio of DDT/(DDD þ DDE) for the
contents in soils, Kumar et al. (2014) concluded that source of DDT in soils of
Korba (India) may be from both ongoing and past applications. Also source of HCH
in soil may be both lindane and HCH as indicated by ratio of α-HCH/γ-HCH.Cancer risk (ILCR) and non-cancer health hazard (HQ) were however lower than
5.1 Organic Pollutants Entry in Soil, Its Uptake by Plant and Food Chain. . . 109

acceptable guideline values, suggesting low risk for adults and children residing in
the area of study.
5.1.1.2 Effect of Pesticides on Biodiversity
Accumulation of pesticides may reduce number of macro- and micro-flora and
fauna species like arthropods, earthworms, fungi, bacteria, protozoa, and other
organisms in soil, which are responsible for several ecosystem functions related
to soil fertility and soil formation. In a comprehensive review, Pelosi et al. (2014)
concluded that pesticides had adverse impact on earthworms in soil at all organi-
sation levels as these agro-chemicals disrupt enzymatic activities, increase individ-
ual mortality, decrease fecundity and growth, change individual behaviour such as
feeding rate and decrease the overall community biomass and density of earth-
worms. Pesticides also affect other invertebrates in soil; although the impact varies
with their types and accumulation levels as well as species of invertebrates
(Frampton et al. 2006; Desneux et al. 2007). Exposure of birds to such toxic
pesticides reduces the reproductive rate and biochemical reaction in the body, or
even kills them directly at high doses (Wilson and Tisdell 2001).
Soil microbial diversity is important for maintenance of soil quality as well as
for optimum ecosystem functions. The diverse groups of microorganisms com-
monly found in soil are mostly unicellular of prokaryotic or eukaryotic origin which
include bacteria (eubacteria and archaebacteria), cyanobacteria, actinomycetes,
fungi and algae. These soil microbes perform a variety of activities required for
the proper functioning of the soil as a dynamic system. While soil enzymes released
by soil microbes are responsible for many C and nutrient transformation processes
important in crop production, microbial diversity plays important role in ecosystem
multi-functionality, degradation of organic pollutants and resistance to invasion by
pathogens (Kennedy and Smith 1995; He et al. 2009; van Elsas et al. 2012). Any
change in their number or proportional distribution can potentially prohibit/enhance
one or other soil biochemical processes important for soil fertility. Pesticides have
been found to affect both soil enzyme activities and microbial diversity adversely
and the effect depends on type of pesticides, their doses and time elapsed after
application (Jacobsen and Hjelmsø 2014). Generally, impact on microbial diversity
Table 5.1 Levels of DDT
and HCH in soils (μg kg�1)
reported after 2006
Country ΣDDT ΣHCHChina ND – 663 ND – 654
Spain 126 – 316 1.8
Romania 20 – 50 –
Mexico ND – 26980 –
Vietnam BDL – 1538 BDL – 20.57
Pakistan BDL – 1538 BDL – 119
India BDL – 315 BDL – 104
Adapted from Kumar et al. (2014)
110 5 Organic Pollutants
is more due to fumigant type of agro-chemicals like dithiocarbamate, organosulfur,
organobromide etc. Glyphosate, an herbicide was found to impact negatively on the
growth promoting bacteria in the rhizosphere (Zobiole et al. 2011).
Some pesticides (particularly non-organochlorine group) stimulate the growth of
microorganisms, but other pesticides have either depressive effect or no effect.
Organophosphorus pesticides are found less toxic to soil microorganisms (Digrak
and Kazanaki 2001; Das et al. 2005). Soil microorganisms generally adapt initially
to these pesticides and therefore, biodegradation is faster in soils that have had
repeated applications of OPs compared to control soils which have never had OP
applications (Ragnarsdottir 2000). Although half-life of OPs are generally
1–2 weeks, these may be detected in trace amount in soil years after application,
probably due to their sorption on soil particles rendering these unavailable for
microbial degradation (Das et al. 2005). Carbofuran (a carbamate compound)
stimulated the population of Azospirillum and other anaerobic nitrogen fixers in
flooded and non-flooded soil, but butachlor (acetanilide group) reduced the popu-
lation of Azospirillum and aerobic nitrogen fixers in non-flooded soil (Lo 2010).
Application of phorate (an organophosphorus compound) and carbofuran induced
growth and development of several groups of microorganisms including N2-fixing
bacteria and phosphate solubilizing microorganisms (Das et al. 2005). In rice field
agro-ecosystems of India, endosulfan and dichlorvos application at normal dose
(@ 1 mL L�1) did not show any adverse effect on soil micro flora; but showed a
negative effect at double dose (Bhagabati and Sarma 2011). On the other hand,
carbofuran showed an adverse effect on the growth of actinomycetes, bacteria and
fungi even at recommended dose of application. Some pesticide compounds can
severely limit the nitrogen-fixing capacities of blue-green algae, thereby affecting
the overall nitrogen economy of soils in general (DaSilva et al. 1975). Application
of aldrin, HCH, carbofuran, 2,4-D, and machette in higher dose lead to the reduc-
tion in the nitrifying bacteria population and in the concentrations of nitrate and
nitrite in soil (Pandey and Rai 1993). Acid and alkaline phosphatase activities
(responsible for phosphate mineralization) as well as the nitrification process
(conversion of NH4+ to NO3
�) were inhibited due to herbicide napropamide
application (Cycon et al. 2013). Pesticide application in paddy field soil decreased
soil dehydrogenase activity with increasing doses and toxicity increased in the
order insecticide > fungicide > herbicide (Subhani et al. 2002).
5.1.2 PAHs
The polycyclic aromatic hydrocarbons (PAHs) include more than 200 compounds
with two or more fused benzene rings, the most significant of them are phenan-
threne, anthracene, pyrene, fluoranthene, chrysene, benzo(a)pyrene, and benzo(a)
anthracene. The differences in ring configurations lead to differences in chemical,
physical, and toxicological characteristics of PAHs compounds. These are catego-
rized as low molecular weight (LMW) and high molecular weight (HMW) PAHs
5.1 Organic Pollutants Entry in Soil, Its Uptake by Plant and Food Chain. . . 111

based on molecular structure. The LMW PAHs include two and three rings struc-
ture while HMW PAHs comprise four and more rings structure and the aqueous
solubility of PAHs decrease almost linearly with increase in molecular mass
(Heitkamp and Cerniglia 1989).
5.1.2.1 PAH and Its Toxicity
The PAHs in environment are known to possess mutagenic, teratogenic, or carci-
nogenic properties and are widely associated with adverse effects on public health
(Rost et al. 2002; Cerniglia 1993). A long back during 1791, the physician John Hill
first linked nasal cancer with PAHs (Cerniglia 1984). The PAHs toxicity occurs
mainly due to intercalation of the PAH aromatic ring system into the DNA
molecule and this biochemical process is responsible for mutagenicity and carci-
nogenicity by this organic pollutant. The carcinogenicity of PAHs increased with
increasing molecular weight. Human exposure to PAHs has been associated with an
increased risk of developing cancer in the variety of organs (such as lung, bladder,
stomach, skin, larynx, scrotum, breast, oesophageal, prostate, kidney and pancreas).
Furthermore, they are known to suppress the immune system and are suspected of
being endocrine disrupters. There are various industrial workplaces at which a
significant increase of certain cancer diseases has been found that may be attributed
to an unusually high exposure to PAHs. For instance, PAHs exposure is high in
coke plants, coal tar manufacturing industries, asphalt, bitumen, aluminium plants,
iron and steel industries, creosote, rubber, mineral oil, soot and carbon black-
producing or manufacturing companies. As highly exposed occupational groups,
chimney sweepers, road-men (involved in pavement-tarring) and roofers (involved
in roof-tarring) are also under increased risk from these pollutants (Jacob and Seidel
2002). In a study, dermal absorption was found a major route of PAH entry in the
body of coke-oven workers; where 75% of the total absorbed amount of PAHs
(specifically pyrene) entered the body through the skin (VanRooij et al. 1993).
United States Environmental Protection Agency has identified sixteen PAHs as
priority pollutants due to their adverse effect on human health.
5.1.2.2 Sources of PAHs in Soil and Their Concentration Level
PAHs in soils may be generated from natural processes like biosynthesis (bacterial
and algal synthesis, decomposition of vegetative liter fall) or geochemical reactions
(forest fires or volcanic activity, erosion of sedimentary rocks containing petroleum
hydrocarbons, fossil-fuel and mineral production). It is also believed that PAHs are
produced during combustion of plant biomass, where these are synthesized during
the chemical transformation of monomeric lignin components present in plant
biomass (Medeiros and Simoneit 2008; Nussbaumer 2003). The species composi-
tion of burning biomass can influence the amount and nature of PAH compounds
generated. Combustion of coniferous wood in fire place generated the maximum
112 5 Organic Pollutants

concentrations of hydrocarbons (Schauer et al. 2001). Also combustion of both pine
and deciduous wood produced naphthalenes as the predominant PAH; however the
amount being relatively smaller in case of deciduous wood. Combustion of herba-
ceous plants generated predominantly phenanthrene, pyrene and fluorene (Masclet
et al. 1995). However, the amount of hydrocarbons produced in such case was
comparable to that generated from the combustion of deciduous species, but smaller
than during combustion of coniferous plants. These organic pollutants may also
originate from anthropogenic sources such as burning of fossil fuels and biomass,
industrial emissions, motor vehicle exhausts, abrasion of road surfaces and tires and
petroleum processing (Masih and Taneja 2006). Contribution of anthropogenic
sources in PAH introduction into the environment is much higher in comparison
to their natural sources (Nam et al. 2003). Other potential sources of PAHs in soil
include disposal from public sewage treatment, irrigation with coke oven effluent,
and use of MSW compost (Santodonato et al. 1981; White and Lee 1980). In Brazil,
Grossi et al. (1998) found increased concentrations of PAHs, PCBs, and PCDD/Fs
in composts prepared from unsegregated MSW from metropolitan areas.
Concentration of total PAHs in soil may vary from 1 μg kg�1 to 300 g kg�1 soil,
depending on the sources of contamination like combustion of fossil fuels, gasifi-
cation and liquefaction of coal, incineration of wastes, and wood treatment pro-
cesses (Bamforth and Singleton 2005). The high concentration of PAHs in the
surface soil layer is observed especially in areas of municipal–industrial agglom-
erations, around roads/highways and fuel processing; and concentration of individ-
ual PAHs varies from below limit of detection to up to several hundred μg per kg ofsoil (Gasecka et al. 2015). Coal-tar has been found a major source of PAHs in the
environment particularly along roadside soils and water bodies (van Metre et al.
2009; Mahler et al. 2012). Median ΣPAH concentrations in dust from sealcoated
pavement were 2200 mg kg�1, which was almost 80 times higher than the similar
concentration in dust samples received from unsealcoated roads (Van Metre et al.
2009). Such dust particles may be carried by air or storm water to contaminate
nearby land. In India, most of the highways and city roads use coal-tar extensively
as seal-coat and therefore, contamination of soils in the agricultural land alongside
roads and highways with PAHs and their transfer to plant & food need to be
investigated. High concentration of PAHs was observed in the atmosphere of
Durg-Bhilai (India) city due to heavy vehicular traffic (Pandey et al. 1999). In an
experiment at Jalandhar (Punjab), PAHs contamination in soil along the roadside
was quantified. The average total PAHs concentration was found 4.04 μg g�1, while
16 individual PAH concentration ranged between 0.008 and 28.4 μg g�1 (Kumar
and Kothiyal 2011). The concentration of these pollutants was the highest within
1 m distance from road side. The ratio of noncarcinogenic and carcinogenic PAHs
in all the soil samples was 1:2.95. In the most of the city locations, total carcino-
genic PAHs concentration ranged from 60% to 80% of the total PAHs. The
combined status of PAHs and metals in surface (0–5 cm) soils of three different
land-use regions (industrial, flood-plain and a reference site) in Delhi was studied
over a period of 1 year (Khillare et al. 2014). Mean Σ16PAH concentrations at the
industrial and flood-plain sites (10.9 � 2.8 and 3.1 � 0.9 mg kg�1, respectively)
5.1 Organic Pollutants Entry in Soil, Its Uptake by Plant and Food Chain. . . 113

were ~15 and ~4 times respectively, higher than reference levels. Toxicity poten-
tials (Benz[a]pyrene–equivalent concentrations, as a measure of carcinogenic
potencies) of industrial and flood-plain soils were ~88 and ~8 times higher than
reference levels.
Benz a½ �pyrene� equivalent concentrations ¼Xn
i
Ci � TEFið Þ
where, TEFi is Toxic equivalency factor of individual PAH relative to Benz[a]
pyrene, as given by Tsai et al. (2004); and Ci is the concentration of an individual
PAH. The values of TEF ranged from 0.001 (for Naphthalene, Acenaphthylene,
Acenaphthene, Fluorene, Phenanthrene, Fluoranthene, Pyrene, Perylene,
Coronene) to 1.0 (for Benzo(a)pyearene, Dibenzo(a,h)anthracene, Dibenzo(a,e)
pyrene).
The identified sources of PAHs in the study were coal and wood combustion,
vehicular and industrial emissions, and atmospheric transport. Health risk assess-
ment (incremental lifetime cancer risk and hazard index) showed that flood-plain
soils have potential high risk due to PAHs while industrial soils have potential risks
due to both PAHs and Cr (Khillare et al. 2014). In another study to assess the health
risk from PAH in Delhi, median concentrations of benzo(a)pyrene in soil was 0.029
(�0.002) mg/kg (Kumar et al. 2013a). Health risk from soil accumulated benzo(a)
pyrene was low, as computed incremental life time cancer risk (ILCR) and index
of additive cancer risk (IACR) values were much lower than the guideline values of
10�6 � 10�4 (ILCR) and <1 (IACR), respectively.
These organic contaminants have high environmental stability due to generally
being resistant to microbial decomposition (Harrison et al. 1996; Zhang et al. 2009).
Biochemical persistence of PAHs arises from dense clouds of π-electrons on both
sides of the ring structures, making them resistant to nucleophilic attack. Their
physical properties include low aqueous solubility and high solid-water distribution
ratios, which decrease bioavailability for microbial utilization and promote their
accumulation in the solid phases of soil mass. Bioavailability of the PAHs
decreases almost logarithmically with increasing molecular mass. As a conse-
quence of their low water-solubility, low vapour pressure and high degree of
association with soil organic matter, PAHs tend to adsorb strongly onto soil
particles (Kipopoulou et al. 1999; Orecchio 2010). In fact, most of the environ-
mental burden of PAHs is considered to be due to their presence in soil (approx-
imately 95%), as opposed to air (approximately 0.2%) (Smith et al. 1995). Once
such PAHs seep into the soil, these get accumulated in horizons rich in organic
matter and are likely to be retained for many years due to their persistence,
hydrophobicity and slow degradation rate (Krauss et al. 2000).
114 5 Organic Pollutants

5.1.2.3 Impact of PAHs on Soil and Crop Quality
While contaminated air and water are main routes of direct PAHs entry in human,
their entry through contaminated soil is suspected only indirectly to food plant
contamination or through grazing animals (soil ingestion). Soil system seems to be
the important long-term repository for PAHs and is considered to be a steady
indicator of the state of environmental pollution. PAHs with three rings or more
tend to be very strongly adsorbed to the soil matrices (Knox et al. 1993), preferen-
tially to small aggregates (<50 μm), which also contain the most humified organic
matter (Quantin et al. 2005). Strong adsorption coupled with very low water
solubility render PAH loss by leaching insignificant. The investigations have
showed that assimilation of PAHs from soil into plants can be treated as an
equilibrium process, where the accumulated PAHs are in equilibrium with available
PAHs in soils. Available PAHs are only part of the total PAHs concentrations in
soil. Therefore, the degree of bioaccumulation in plants, besides the physicochem-
ical properties of organic pollutants and the plants’ sensitivity to PAHs uptake, is
closely related to the bioavailability of PAHs (van Bohemen and van de Laak
2003).
Absorption of PAHs from soil through roots and their transport into above-
ground parts of the plant has been found possible mainly for low molecular weight
(containing 2- and 3-ring) hydrocarbons due to their high solubility; whereas larger
molecules (having >3 ring) of these are accumulated on the surface of the roots
(Oleszczuk and Baran 2004). From a number of experiments, it has been concluded
that contamination of crop plants via root absorption with PAHs is negligible
(Ellwardt 1977; O’Connor 1996). Tao et al. (2006) determined the relationship
among the contents of 16 PAHs (listed by EPA) present in cabbage, in air as well as
in soil. The concentration of PAHs in cabbage was positively correlated with the
concentration in the air, whereas dependence of the level of soil contamination was
statistically insignificant indicating air pollution being major concern in respect
food contamination. In another study, contamination of plants (trees, grasses, grain)
including vegetables and fruits with PAHs depended on their contents in both soil
and air (Liste and Alexander 2000). Only limited data are available on the toxicity
of PAHs for plants; although it is generally opined that these pollutants do not
produce any perceptible toxic effects in vegetation. PAHs did not have any adverse
effect on the germination of several crops even at higher concentration (Ghanem
et al. 2010). A study compared PAHs uptake by different plants in the vicinity of
highway (Kluska 2005) and indicated that cabbage recorded the highest concen-
tration (358 ng kg�1) of total PAHs among studied vegetables, followed by
cucumbers (71.3 ng kg�1) and root of parsley (29 ng kg�1). The concentrations in
soil and plant decreased with distance away from highway. Aerial deposition of
PAHs on leaves and their subsequent entry-translocation within plant are important
mechanisms of their contamination of food. Leaf morphological features (cuticular
wax, surface area, hairs, and stomata), leaf components (lipids) and contaminant
molecular structure (low and high molecular weight PAHs) play important role in
5.1 Organic Pollutants Entry in Soil, Its Uptake by Plant and Food Chain. . . 115

PAH uptake and translocation by plant (Howsam et al. 2000). Many plants with
relatively large surface area have greater potential to accumulate PAH from the
polluted atmosphere through particle deposition on waxy leaf or by uptake in the
gas phase through stomata (Kipopoulou et al. 1999; Lehndorff and Schwark 2004).
Changes in soil microbial activity and biodiversity have been reported due to
accumulation of persistent and toxic organic pollutants. In the presence of PAHs,
biomass-C, respiration, protease activity and heterotrophic counts were signifi-
cantly enhanced, while urease activity was depressed. Mineralization of organic
N in soil was initially, but reversibly inhibited in the presence of PAHs (Margesin
et al. 2000). Adverse effect of these organic pollutants on enzymatic activity
(dehydrogenase, phosphatase, urease and protease) was found influenced by soil
physicochemical properties such as total organic carbon content and pH (Baran
et al. 2004). Soil enrichment with organic matter considerably decreases the
negative influence of PAH’s on enzymatic activity (Kucharski et al. 2000; Baran
et al. 2004). PAHs affected nodulation of alfalfa significantly and the effect was
more in absence of humic matter (Wetzel and Werner 1995). In some of the soil
samples, stimulating effect of PAH on dehydrogenase activity was also observed,
which was attributed to an adaptation of the soil microflora and the use of the
pollutant as a C and energy source (Baran et al. 2004).
5.1.2.4 Food Chain Contamination with PAHs
Accumulation of PAHs in soils and atmospheric pollution may lead to food chain
contamination (Kipopoulou et al. 1999; Mueller and Shann 2006) and subse-
quently, cause direct or indirect exposure (ingestion, inhalation, and dermal con-
tact) to human. Food appears to be the main source of PAH intake for humans who
are not occupationally exposed to PAH. Raw foods should not contain high levels
of PAH. In areas remote from urban or industrial activities, levels of PAH found in
unprocessed foods reflect the background contamination. Generally, the average
background values are in the range of 0.01–1 μg kg�1 in uncooked foods. Such
PAH usually originates from long distance airborne transportation of contaminated
particles as well as natural emissions from volcanoes and forest fires. In the
neighbourhood of industrial areas or along highways, the contamination of vegeta-
tion can be ten-fold higher than in rural areas. The waxy surface of vegetables and
fruits can concentrate low molecular mass of PAH mainly through surface adsorp-
tion. PAH concentrations are generally greater on plant surface (peel, outer leaves)
than on internal tissue. Careful washing may remove up to 50% of the total PAH.
Particle bound PAH are easily washed off the surface; whereas those in the waxy
layer are less efficiently removed. Sediments of lakes and sea also accumulate
organic pollutants originated from anthropogenic activities like biomass & fossil
fuel combustion, road construction, oil spill etc. (Magi et al. 2002; Perra et al.
2009). The main route of human exposure to sedimentary PAHs is through marine
lives which make up part of the human diet. PAHs contained in sediments and pore
water are taken in by benthic organisms such as lobsters, mussels, and clams which
116 5 Organic Pollutants

are either consumed directly by humans or are consumed by higher predators such
as squid and fish which are also a part of the human diet. Therefore, knowledge on
contamination in soil, groundwater, marine and atmosphere with PAHs is needed to
avoid any food production risk and to restrict the deleterious effect of these
contaminants on human.
5.1.3 Other Persistent Organic Pollutants (POPs)
Persistent organic pollutants (POPs) are toxic chemicals that adversely affect
human health and the environment around the world. Some of the most well-
known POPs are PCBs, DDT, and dioxins. PCBs and DDT were being produced
chemically due to their usefulness. PCBs were extensively used as dielectric and
coolant fluids in transformers and capacitors, lubricants, plasticizers, paints, etc.
Dioxins result from some industrial processes and from waste combustion (for
example, municipal and medical waste incineration and backyard burning of trash).
A study on assessment of air quality of different potential sources in different cities
of India indicated that the concentrations of both polychlorinated dibenzo-p-dioxins
and dibenzofurans (PCDDs/DFs) and dioxin-like PCBs from hazardous waste
incinerators are much higher than those from some thermal processes (Thacker
et al. 2013). A monitoring and toxicological study by Center for Marine Environ-
mental Studies, Ehime University (Japan) revealed that municipal dumping sites
were the major reservoirs and sources of terrestrial dioxins and related POPs,
particularly PCDDs/DFs (Subramanian and Tanabe 2007). They also indicated
that PCDD/DF homologue profiles of the dumpsite soils from India synchronized
with the profiles reported for the soils representing environmental sources of these
chemicals (municipal waste incinerator emissions) from United States. A decade
after, the same group revisited the status of POPs in environmental samples of India
and concluded that organochlorines such as DDTs and HCHs showed decreasing
trend due to ban on the use of such chemicals, though their levels were still higher
(Subramanian et al. 2015). Dumping site at Chennai (India) was estimated to
receive 1400 mg of PCDD/DF annually (Minh et al. 2003). Use of polychlorinated
biphenyls (PCBs) is more in Indian industries, but the production is totally contrib-
uted by other countries. Several experiments with increased sewage sludge appli-
cation rates also demonstrated an accumulation of PCBs in the treated soils (Folch
et al. 1996; Delschen 1999). Since 1966, PCBs and other organohalide compounds
were identified in soil system and the sources of contribution were industrial
effluent, sewage-sludge incinerators and biomass combustions. The discharged
PCBs are adsorbed by the soil particles; affect the soil properties and persist for
longer time. Exposure to these compounds is recognized as an important environ-
mental risk factor for humans and animals because of the following effects: cancer;
nervous system damages; reproductive and immune system impairments; and
hormonal imbalance (Darnerud et al. 2001; Safe 2004). Presence of these organic
contaminants however, has generally not been found to affect soil microorganisms
5.1 Organic Pollutants Entry in Soil, Its Uptake by Plant and Food Chain. . . 117

and associated biochemical processes (Wild et al. 1994). However, their extreme
persistence in the environment and ability to bioconcentrate in the food chain
makes them great environmental and human health risks that need remedial action
(Cousins and Jones 1998; Hickey 1999). Due to their high toxicity, many industri-
alized countries imposed regulations and bans on the production, use and discharge
of these compounds. However developing countries are yet to initiate such actions
due to the availability of limited baseline data.
Several studies reported elevated levels of persistent organic pollutants (POPs)
in various environmental and biotic samples from India (Kumari et al. 2008;
Devanathan et al. 2009; Someya et al. 2010; Sharma et al. 2014) (Table 5.2). In a
study, large number of environmental samples (fish, dust and human milk) from
different locations of India were analyzed for PCBs and other organohalide com-
pounds (Devanathan et al. 2012). High levels of PCBs were found in human milk
from surrounding municipal waste dumping site indicating higher risk for infants
living near these sites. Significantly higher levels of organohalide compounds were
found in dust samples from e-waste recycling locations, suggesting that the crude
e-waste recycling/dismantling activities are the major emission sources of these
contaminants. The hazard quotients values of PCBs were above one for the infants
and toddlers living near the municipal dumping and e-waste recycling areas indi-
cating high risk, which warrants regular monitoring and regulations to reduce the
pollution levels. Dietary intake values of PCBs and polybrominated diphenyl ethers
(PBDEs) through farm-raised fish were far lower than the guideline values indicat-
ing less risk through fish consumption. Soil samples from agricultural land near
pesticide manufacturing industry at Lucknow contained very high concentrations of
HCH (Jit et al. 2011; Abhilash and Singh 2009). Concentrations of DDTs and
HCHs were generally lower in urban areas than in agricultural soils indicating
higher use of these POPs as pesticides in agriculture (Sharma et al. 2014). Meta-
analysis on time trend of data did not indicate a general decline in DDT and HCH
Table 5.2 Average concentrations of POPs in different environmental samples from various
regions of India
Nature of sample ΣDDT ΣHCH/BHC
Period of
sampling/
reporting
Surface water (ng L�1) ND – 16,367,000 0.1 – 17,430,000 1988–2011
Groundwater (ng L�1) ND – 75,000 88.43 – 400,000 2001–2011
Soil (ng g�1) 13.81 – 934 1.65 – 404,520.9 1996–2012
Sediments (ng g�1) <0.01–128,600 <0.01 – �234,000 1998–2012
Aquatic organisms
(ng g�1)
0.38 – 19,970 0.87 – 32,200 1995–2010
Human blood (μg L�1) 8 – 32,200 6 – 2633.7 1983–2012
Human milk (ng g�1
lipid wt.)
175.5 – 3210 127.25 – 4500 1981–2006
Adapted from Sharma et al. (2014)
118 5 Organic Pollutants

residues in the environment and human body in India in spite of ban on their use;
whereas, such samples from China showed a tendency towards decline in POP
contamination (Sharma et al. 2014). In urban soils of Kurukshetra city, average of
28 PCBs and dioxin-like PCBs were 11.57� 2.00 μg kg�1 and 2.58� 0.34 μg kg�1,
respectively. However, analysis of incremental life time cancer risk indicated that
these contaminated soils were not likely to pose any health risk to adults and
children (Kumar et al. 2013b).
5.1.3.1 Impact of POPs on Soil and Produce Quality
Persistent organic pollutants are lipophilic /hydrophobic in nature and hence, these
are strongly adsorbed to soil organic matter restricting their uptake by plant root.
Availability of organic pollutants for plant uptake is governed its solubility in water
which are generally determined by octanol-water partition coefficient (Kow). Con-
centration of organic pollutants in soil and that in aboveground plant parts were
found to be related by the equation below (Travis and Arms 1988):
log Bv ¼ 1:588� 0:578 log Kow
where, Bv is the ratio of conc. of organic in aboveground plant to that in soil.
Contaminants with values of Kow ranging between 0.5 and 3 are considered
moderately hydrophobic and are most likely to be taken up by plants (Ryan et al.
1988; Wenzel et al. 1999). Hawker and Connell (1988) determined Kow values for
13 PCB congeners and found its strong relationship with total surface area. Transfer
of PCBs from contaminated soil to plant root is generally low; and higher chlori-
nated congeners are further less preferentially absorbed (Suzuki et al. 1977;
McCrady et al. 1990; Wild et al. 1994). Several researches have also concluded
that uptake and translocation of PCBs to aboveground biomass is very small with
bioaccumulation factor of about 0.0045 (Webber et al. 1990; Gan and Berthouex
1994). However, some PCBs (like 2,3,7,8-Tetrachlorodibenzodioxin, TCDD) are
likely to be absorbed by plant leaves via volatilization from soil surface (McCrady
et al. 1990). In a study on a highly contaminated soil (0.6–200 μg g�1 total PCBs in
terms of Aroclor 1254/1260), sedge (Carex normalis) showed significant accumu-
lation of PCBs in shoot with bioaccumulation factors up to 0.29 indicating its
potential for phytoremediation (Whitfield Aslund et al. 2007). Turrio-Baldassarri
et al. (2007) found significant level of contamination in forage crop nearby PCB
manufacturing plant in Brescia, Italy which was assumed to be from
air-borne PCBs.
POPs are highly stable chemicals that resist the natural processes of degradation.
Once introduced into the environment, they can persist for a long time. These are
readily absorbed in fatty tissue and accumulate in the body fat of living organisms;
and become more concentrated as they move up the food chain, especially into
larger, longer-living organisms. Long-term consumption of contaminated forage
plants led to their build-up in the body of bovines and human population residing in
5.1 Organic Pollutants Entry in Soil, Its Uptake by Plant and Food Chain. . . 119

the contaminated area (Turrio-Baldassarri et al. 2008, 2009). Soil contamination
with PCB (Aroclor1248; tetrachlorbiphenyl) resulted significant reduction in root
growth of several plants (Chekol et al. 2004). This group of organic pollutant,
particularly higher-chlorinated congeners has considerable adverse effect on soil
microorganisms (Camara et al. 2004; Correa et al. 2010). Soil ingestion during
grazing has been found to play key role in toxic POPs transfer into livestock which
in turn increases risk of their exposure to human (Wild et al. 1994).
5.1.4 Dye Pollutants
Several textile, pharmaceutical and printing industries use large volume of azo-dyes,
which is a group of synthetic organic colorants (generally derivatives of benzene,
toluene, naphthalene, phenol and aniline) containing N as azo group –N¼N. Due to
the extensive use of these dyes in industries, they have become an integral part of
industrial effluent. A considerable fraction (about one-tenth) of azo-dyes used by
textile industries does not bind the fabrics, and therefore is released through waste-
water (Puvaneswari et al. 2006). In fact, of the one million ton of organic dyes
annually produced worldwide, more than 11% is lost in effluents during manufacture
and application processes (Forgas et al. 2004). The presence of dyes in water imparts
color to it which can block sunlight penetration and oxygen dissolution, both of which
are essential ingredients for aquatic life (Pereira and Alves 2012). Thus, there is a
considerable need to treat these colored effluents before discharging them to various
water bodies. Further, some azo dyes are bonded with heavy metals like Cr and Cu in
order to impart shades and resistance to washing. As a result, wastewaters from textile
industries, unless treated properly, pose considerable threat to environment from both
organic and metal pollutants. Groundwater of several villages near industrial area of
Ratlam and Bichhri (India) has been turned red due to contamination from dye
industry effluents (DTE 1999; Saha and Sharma 2006) (Fig. 5.1). Several types of
azo-dyes and their breakdown products are toxic (lethal, mutagenic and carcinogenic)
to terrestrial and aquatic organisms including mammals (Brown and De Vito 1993;
Puvaneswari et al. 2006). Many of these dyes are resistant to degradation and
remediation under natural conditions and through conventional treatment methods
(Tahir et al. 2016). Reported half-life of hydrolyzed Reactive-Blue 19 is 46 years
(Hao et al. 2000).
5.1.4.1 Impact of Dye Pollutants on Soil Quality
Dyes show different degree of stability in soils from days to several weeks
depending upon the nature of chemical compounds. Direct-Red 81 was more
resistant to microbial degradation as compared to Reactive-Black 5 and Acid-
Yellow 19 (Imran et al. 2015). As a result of irrigation with effluent from dye
industries, considerable accumulation of total organic dyes in cultivated soil had
120 5 Organic Pollutants

been observed and such accumulation has also been transported in plant tissue
(Zhou 2001). Phytotoxicity of dyes has been reported by some workers (Kalyani
et al. 2008; Ayed et al. 2011). There are evidences of plant uptake of dye com-
pounds by plants (Uera et al. 2007; Muthunarayanan et al. 2011). Different azo dyes
have expressed toxicity to soil microorganisms and toxicity is more on Gram-
negative bacteria than Gram-positive bacteria (Imran et al. 2015). Certain
azo-dye had been found to affect adversely on growth of atmospheric N fixing
cyanobacterium Anabaena sp. (Hu and Wu 2001). Sulfonated azo dye had signif-
icant adverse effect on urease activity, ammonification and nitrification rates in soil
and therefore reduces nitrogen use efficiency in crop production (Topac et al. 2009).
Ammonia oxidizing bacteria population and rate of nitrification process was
depressed considerably in presence of reactive-black 5 dye (Batool et al. 2015).
These results show dye pollutants show considerable toxicity to soil microorgan-
isms and agriculturally important nutrient cycling processes.
5.1.5 Antibiotics Contamination in Soil and Their Impact
Antibiotics inhibit the activity of microorganisms, viruses, and eukaryotic cells and
are commonly used in human and veterinary (bovines, swines and birds) medicines
for treating infections. Their benefits have been recognized in agriculture, aquacul-
ture, beekeeping, and livestock as growth promoters. A significant quantity of these
is also routinely used as a feed supplement to promote growth of food and milch
animals to inhibit subclinical infections and to reduce growth-depressing microbial
Fig. 5.1 Groundwater near Ratlam industrial area has turned red, suspected to be due to
contamination with azo-dyes
5.1 Organic Pollutants Entry in Soil, Its Uptake by Plant and Food Chain. . . 121

metabolites (Kumar et al. 2005a, b). There are several different kinds of antibiotics
and these can be classified based on their chemical structure, action mechanism,
action spectrum, and the route of administration. Although antibiotics are designed
to perform effectively at very low concentration, they are administered in the body
at larger dose because of lower efficacy in reaching the targeted pathogens. Most
antibiotics administered in human or fed to animals are poorly absorbed in the gut
and as a result a substantial amount of these are excreted through urine and faeces,
which in turn end up in municipal sewage effluent and manure.
5.1.5.1 Antibiotics Release into Environment and Their Entry into
Agroecosystem
It is estimated that as much as 90% of some antibiotics may be excreted as parent
compound, thereby contaminating the environment (Phillips et al. 2004). Tetracy-
clines (oxytetracycline and chlortetracycline), tylosin, sulfamethazine, amprolium,
monensin, virginiamycin, penicillin, and nicarbazine are the most common antibi-
otics present in swine, beef, and poultry/turkey manures. The concentration of these
antibiotics varies from traces to as high as 216 (mg L�1) of manure slurry (NAAS
2010). Soil, sediment, sludge, groundwater, wastewater, tap water, surface water
(lakes, streams, rivers, sea), plants, and aquatic animals have been reported for
contamination with antibiotics by several researchers (Hirsch et al. 1999; Hamscher
et al. 2002; Fick et al. 2009). Pharmaceutical industries in Hyderabad (India) have
been reported to contaminate surface, groundwater and drinking water severely
with antibiotics like ciprofloxacin, ofloxacin, cetirizine. Wastewater from a com-
mon effluent treatment plant receiving process water from approximately 90 bulk
drug manufacturers contained several antibiotics in very high concentration (Fick
et al. 2009). Mutiyar and Mittal (2013) found concentration of amoxicillin in the
untreated raw sewage in Delhi (India) in the range from “not detected” (ND) to
172.6 ng L�1. In another study by this group, significant concentrations of ampicil-
lin (23.5–263.3 μg l�1), ciprofloxacin (9.7–45.4 μg l�1), sparfloxacin (ND to
63.2 μg l�1) and gatifloxacin (ND to 8.4 μg l�1) had been found in wastewater
influents from Delhi (Mutiyar and Mittal 2014). Removal efficiencies of the STP
varied between 55 and 99%. Thus significant amounts of antibiotics in the effluents
were discharged in Yamuna River. The Yamuna River also receives effluents from
17 STPs and also carries sewage and industrial discharges from 17 stormwater drains.
The concentration of the antibiotics in the river varied from ND to 13.75 μg l�1
ampicillin, ND to 1.44 μg l�1 for ciprofloxacin, ND to 0.48 μg l�1 for gatifloxacin,
and ND to 2.09 μg l�1 for sparfloxacin. Similarly, significant levels of antibiotics had
been detected in different river-water in different countries (Munoz et al. 2009;
Feitosa-Felizzola and Chiron 2009; Watkinson et al. 2009; Lin and Tsai 2009). As
use of treated and untreated sewage effluent for irrigation is quite prevalent in urban
and peri-urban areas, soil contamination with antibiotics may be widespread.
Animal derived manure, an important soil amendment in Indian agriculture is
also considered as another source of antibiotic contamination in soil. Most of the
122 5 Organic Pollutants

antibiotics fed to animals are poorly absorbed in the animal gut and consequently, a
substantial amount of these is excreted with the urine and faeces within a few days
of medication (Aust et al. 2008). In general, 72% of the active ingredients initially
dispensed in animals were recovered in the animal wastes within 2 days of
application (Winckler and Grafe 2001). Tetracyclines, tylosin, sulfamethazine,
amprolium, monensin, virginiamycin, penicillin, and nicarbazine are commonly
observed antibiotics in pig, cattle, and turkey manures (Webb and Fontenot 1975;
De Liguoro et al. 2003; Kumar et al. 2005a). Antibiotics were found to degrade
during composting of animal dung and the extent of degradation is highly variable
among different antibiotics (Dolliver et al. 2008). At the end of the composting
period, degradation of chlortetracycline was >99%; whereas monensin and tylosin
degraded to the extent of 54–76%. Sulfamethazine, however, didn’t degrade sig-
nificantly during composting.
Composting methods (passively aerated composting or frequently turned aerobic
composting, or vessel composting) did not have significant impact on degradation
of antibiotics (Mitchell et al. 2015). Thermophilic stage (with �60 �C) during
composting process has been found to enhance degradation kinetics of antibiotics,
with greater degradation in cattle dung manure as compared to biosolids from
wastewater treatment plant. However, most of the composting in India is not
properly managed to impart thermophilic treatment for whole feedstock due to
infrequent turning (Saha et al. 2010). Therefore certain antibiotics can still persist in
the manure being prepared in the country. A review by Kumar et al. (2005a)
indicated that antibiotic concentrations in manure ranged from trace levels to
>200 mg kg�1, with typical concentrations in the 1–10 mg kg�1 range. Although
there is very few data available on veterinary antibiotics use in various food-
producing animals in developing countries such as India (WHO 2001), their amount
may be considerable due to huge livestock population (more than 33% of the world)
and lack of regulatory mechanism with antimicrobial drug use in animals intended
for food. Antibiotics have been detected in soils amended with livestock manure,
with periods of detection ranging from days to months after application, depending
on the antibiotics type and their degradation kinetics (Hamscher et al. 2002; De
Liguoro et al. 2003). Sustained elevated levels of externally added antibiotics in the
environment may contribute to the development of antibiotic-resistant microbial
populations; and even very low quantities of antibiotics encourage the selection of
antibiotic-resistant bacteria (Boxall et al. 2003). Contact of such antibiotic-resistant
bacteria in the soil and water with human-associated microbiota has been suspected
to be a cause in development of multi-drug-resistant human pathogens, a concern
among medical practitioners (Baquero et al. 2008).
For sustainable agriculture, maintenance of soil organic matter is of paramount
importance under different land use management systems and this necessitates
regular incorporation of organic matter into the rhizosphere from external sources.
Indian soils are generally deficient in organic matter due to high mineralization rate
under prevalent climatic condition and therefore, frequent application of animal
manure in crop land is advocated for improving and sustaining soil quality. Data
from long-term experiments have revealed that additional yields of different crops
5.1 Organic Pollutants Entry in Soil, Its Uptake by Plant and Food Chain. . . 123

can be realized over and above soil test based optimum NPK rates, only if 10–-
15 tonnes of FYM per hectare are annually supplemented (Swarup and Wanjari
2001). Similarly scarcity of irrigation water for agriculture is prevalent in India due
to erratic rainfall and stiff competition for this resource with industry and munic-
ipality. As a result, farmers in the peri-urban area who live nearby such water
sources divert this untreated wastewater for irrigation whenever needed as it proves
to be low-cost alternative to conventional irrigation water. It supports livelihood
and generates considerable value in urban and peri-urban agriculture of India,
despite the health and environmental risks associated with this practice. Conclu-
sions based on the considerable research worldwide, limited studies in Indian
context and available related secondary information indicates that presence of
antibiotics in manure and wastewater (both being important inputs for agriculture)
may be widespread across India and their regular use may be contaminating the soil.
5.1.5.2 Antibiotics Persistence and Its Effects on Soil Properties
Antibiotics concentration in soil has been reported by researchers across the world
to vary widely in the range of ND to 1534.4 μg kg�1 (Du and Liu 2012). Impact of
antibiotics in soil depends on their persistence and solubility. Distribution coeffi-
cients (Kd), a measure of contaminant activity retardation, for the adsorption to soil
constituents of different groups of antibiotics vary from 0.6 to 4.9 for sulfonamides,
from 290 to 1620 for tetracyclines and from 310 to 6310 for fluoroquinolones
(Thiele-Bruhn 2003). Sorption of antibiotics to soil minerals is weaker than to soil
organic matter and is governed by pH, ionic strength, and type of ions in the
medium. Adsorption of most of the antibiotics is fast and reduces their antibiotic
potency; though the process does not completely eliminate their antimicrobial
activity. Most of the antibiotics have low solubility and therefore, their mobility
in soil is mainly facilitated by their association with mobile soil colloids and
dissolved organic matter (Thiele-Bruhn 2003).
Soil microorganisms play important role in several nutrient transformation
processes in soil like nitrogen fixation, nitrification, ammonification, phosphate
solubilisation etc. As antibiotics are meant to kill mainly microorganisms, their
entry is expected to have harmful effects on agriculturally important soil microor-
ganisms. Repeated contamination through livestock manure application and waste-
water irrigation during cropping can accumulate antibiotics in the soil, which may
reach beyond the level of the threshold inhibitory concentrations for agriculturally
important microorganisms in the soil ecosystem. A comprehensive review by
Thiele-Bruhn (2003) indicated that effects of antibiotics in soil are diverse and
are generally microorganism and dose specific, which tend to cause shift in micro-
bial community. Antibiotics on the soil have been found to reduce microbial
population including soil enzyme activities (Kotzerke et al. 2008; Akimenko
et al. 2015). For example, sulfonamides affected activities of dehydrogenase
(responsible for organic matter mineralization) and urease (responsible for hydro-
lysis of urea) as well as structural diversity of the soil microbial community
124 5 Organic Pollutants

(decrease in bacterial biomass and increase in proportion of fungal biomass) even at
a relatively low concentration (Gutierrez et al. 2010). In another study, six antibi-
otics (chlortetracycline, tetracycline and tylosin; sulfamethoxazole, sulfamethazine
and trimethoprim) inhibited soil phosphatase activity during the 22 days’ incuba-tion; while sulfonamides (sulfamethoxazole and sulfamethazine) inhibited total
microbial activity as indicated by reduced soil respiration (Liu et al. 2009). The
effective concentration doses (EC10) for soil respiration in the first 2 days were
7 mg kg�1 for sulfamethoxazole, 13 mg kg�1 for sulfamethazine and 20 mg kg�1
for trimethoprim.
5.1.5.3 Effect of Antibiotics on Plant
The presence of antibiotics in surface water, groundwater, seawater, soil and sludge
opened their entry into biota. The contaminant transfer usually takes place from
contaminated soils to the plants, via retention by root surfaces, root uptake, trans-
location and foliar uptake. There are some reports available which indicate adverse
effects of antibiotics on plant growth and yield; although their toxic doses are
several folds higher in plants as compared to soil microorganisms. Phytotoxicity
depended on plant species and antibiotic types (Batchelder 1982; Jjemba 2002;
Farkas et al. 2007; Liu et al. 2009). For example, significant gentamicin (but not
streptomycin) uptake was observed in radish, while carrot roots or lettuce leaves
didn’t uptake these two antibiotics (Bassil et al. 2013). Experimentally determined
phytotoxicity doses for different antibiotics are generally much higher than the
reported range of antibiotics in different contaminated sites, which indicates that
phytotoxicity due to antibiotic contamination is rare in agroecosystem (Thiele-
Bruhn 2003). High-level accumulation of antibiotics in food crops may raise
potential human health concerns through food chain. A recent review indicated
absorption of antibiotics by crops from contaminated soils and detected concentra-
tions in different plant parts ranged between 0.9 and 6.1 mg/kg (Du and Liu 2012).
A greenhouse studies with plants grown in antibiotic contaminated manure-applied
soil indicated that corn, green onion and cabbage absorbed chlortetracycline but not
tylosin antibiotics present in manure (Kumar et al. 2005a). The concentrations of
chlortetracycline in plant tissues were small (2–17 ng g�1 fresh weight), but these
concentrations increased with increasing amount of antibiotics present in the
manure. Antibiotics with large molecular weight are generally not taken up easily
by plants (Kumar et al. 2005b). Although the maximum residue value for antibiotics
in animal-based products has been established, the limit for antibiotics in plant-
based products is absent. Antibiotics present in plant materials ingested by humans
may provide resistance to human pathogens thus resulting in illnesses that may be
difficult to cure with currently available antibiotics. This can be a serious threat, as
has been proved in many animal studies.
5.1 Organic Pollutants Entry in Soil, Its Uptake by Plant and Food Chain. . . 125

5.1.5.4 Antibiotic Resistance in Microbes
The most obvious risk of antibiotic release into the environment is related to the
development of antibiotic-resistant microorganisms which has resulted in the
reduction of therapeutic potential against human and animal pathogens. Residues
of antibiotics can induce resistance in pathogens either directly or indirectly by
transfer of plasmids from non-pathogens to pathogenic microorganisms. The detec-
tion of antibiotics residues (even at sub-nanogram per liter) is alarming for ecosys-
tem sustainability. These compounds are specially engineered to show their effect
at trace levels. There are no reports of direct effect on human beings from contam-
inated water but effects on other organisms have been documented. Kummerer
(2004) reported the development of various resistant bacterial strains associated
with discharges of antibiotics. A study on archived long-term soil-series from
different locations in The Netherlands showed a significant accumulation of anti-
biotic resistance genes in agricultural soils sampled since 1940, postulated to be due
to decades of increasing use of antibiotics (Knapp et al. 2010). Three Indian soil
samples irrigated with wastewater (from Aligarh, Kanpur and Ghaziabad)
contained the antibiotic resistance genes (ampC); while it was absent in the samples
from groundwater irrigated soils (Malik et al. 2008). Similarly, E. coli resistant tocefotaxime, ciprofloxacin, and cefoxitin was present in treated effluent (originated
from hospital) samples (Galvin et al. 2010). These observations indicate that
antibiotic resistant genes might have been transferred from the sewage system to
soil. Therefore, anthropogenic activities such as manure/biosolid application,
wastewater irrigation, and agricultural application of antibiotic compounds are
supposed to be responsible in transmitting antibiotic resistance to the environment.
Studies have also found that highly diverse and abundant levels of antibiotic
resistant bacteria are already present in soils. Rhizosphere comprises large
populations of different microorganisms and some of these naturally produce
antibiotics which are lethal to susceptible rhizobial populations in the soil. There-
fore, intrinsic resistance to antibiotics is a desirable trait for the rhizobial popula-
tion. It increases the rhizobia’s chances of growth, multiplication and persistence in
the soil (Naamala et al. 2016). Hollowell et al. (2015) genotyped more than 400 iso-
lates from plant roots and soils across California and assayed 98 of them for
resistance traits against 17 clinically relevant antibiotics. However, resistance to
certain group of antibiotics had been found to reduce symbiotic effectiveness of
Rhizobium sp. and that affect biological nitrogen fixation (Pankhurst 1977; Turco
et al. 1986). Thus, there is a need for detailed investigations on assessing impacts
antibiotics of anthropogenic origin on soil biodiversity, development of multidrug
resistant organic organisms and transfer to human through food chain
contamination.
126 5 Organic Pollutants

References
Abhilash PC, Singh N (2009) Pesticide use and application: an Indian scenario. J Hazard Mater
165:1–12
Adeyeye A, Osibanjo O (1999) Residues of organochlorine pesticides in fruits, vegetables and
tubers from Nigerian markets. Sci Total Environ 231:227–233
Akimenko YV, Kazeev KS, Kolesnikov SI (2015) Impact Assessment of soil contamination with
antibiotics (for example, an ordinary chernozem). Am J Appl Sci 12:80–88
Arias-Estevez M, Lopez-Periago E, Martınez-Carballo E et al (2008) The mobility and degrada-
tion of pesticides in soils and the pollution of groundwater resources. Agric Ecosyst Environ
123:247–260
Aust MO, Godlinski F, Travis GR et al (2008) Distribution of sulfamethazine, chlortetracycline
and tylosin in manure and soil of Canadian feedlots after subtherapeutic use in cattle. Environ
Pollut 156:1243–1251
Ayed L, Mahdhi A et al (2011) Decolorization and degradation of azo dye methyl red by an
isolated Sphingomonas paucimobilis: biotoxicity and metabolites characterization. Desalina-
tion 274:272–277
Bamforth SM, Singleton I (2005) Bioremediation of polycyclic aromatic hydrocarbons: current
knowledge and future directions. J Chem Technol Biotechnol 80(7):723–736
Banerjee BD, Zaidi SSA, Pasha ST et al (1997) Levels of HCH residues in human milk samples
from Delhi, India. Bull Environ Contam Toxicol 59:403–403
Baquero F, Martinez JL, Canton R (2008) Antibiotics and antibiotic resistance in water environ-
ments. Curr Opin Biotechnol 19:260–265
Baran S, Bielinska JE et al (2004) Enzymatic activity in an airfield soil polluted with polycyclic
aromatic hydrocarbons. Geoderma 118:221–232
Bassil RJ, Bashour II, Sleiman FT, Abou-Jawdeh YA (2013) Antibiotic uptake by plants from
manure-amended soils. J Environ Sci Health B 48:570–574
Batchelder AR (1982) Chlortetracycline and oxytetracycline effects on plant growth and devel-
opment in soil systems. J Environ Qual 11:675–678
Batool S, Khalid A, Jalal KCA et al (2015) Effect of azo dye on ammonium oxidation process and
ammonia-oxidizing bacteria (AOB) in soil. RSC Adv 5:34812–34820
Bhagabati KS, Sarma H (2011) Differential effects of pesticides on soil microflora in cultivated
soil of Indian rice field agro-ecosystems. J Appl Nat Sci 3:277–279
Boxall ABA, Kolpin DW, Halling-Srensen B et al (2003) Are veterinary medicines causing
environmental risks? Environ Sci Technol 37:286–294
Briggs GG, Bromilow RH, Evans AA (1982) Relationships between lipophilicity and root uptake
and translocation of non-ionised chemicals by barley. Pest Manag Sci 13:495–504
Bromilow RH, Chamberlain K (1995) Principles governing uptake and transport of chemicals. In:
Trapp S, McFarlane JC (eds) Plant contamination: modeling and simulation of organic
chemical processes. Lewis Publishers, Boca Raton, pp 37–68
Brown MA, De Vito SC (1993) Predicting azo dye toxicity. Crit Rev Environ Sci Technol
23:249–324
Camara B, Herrera C, Gonzalez M et al (2004) From PCBs to highly toxic metabolites by the
biphenyl pathway. Environ Microbiol 6:842–850
Carter LJ, Harris E, Williams M et al Boxall (2014) Fate and uptake of pharmaceuticals in soil–
plant systems. J Agric Food Chem 62 (4):816-825
Cerniglia CE (1984) Microbial metabolism of polycyclic aromatic hydrocarbons. Adv Appl
Microbiol 30:31–71
Cerniglia CE (1993) Biodegradation of polycyclic aromatic hydrocarbons. Curr Opin Biotechnol
4:331–338
Ceron JJ, Gutierrez-Panizo C, Barba A, Camara MA (1995) Endosulfan isomers and metabolite
residue degradation in carnation (Dianthus caryophyllus) by product under different environ-
mental conditions. J Environ Sci Health A 30:221–232
References 127

Chekol T, Vough LR et al (2004) Phytoremediation of polychlorinated biphenyl-contaminated
soils: the rhizosphere effect. Environ Int 30:799–804
Collins CD, Finnegan E (2010) Modeling the plant uptake of organic chemicals, including the
soil�air�plant pathway. Environ Sci Technol 44:998–1003
Correa PA, Lin L et al (2010) The effects of individual PCB congeners on the soil bacterial
community structure and the abundance of biphenyl dioxygenase genes. Environ Int
36:901–906
Cousins IT, Jones KC (1998) Air soil exchange of semi-volatile organic compounds (SOCs) in the
UK. Environ Pollut 102:105–118
Cycon M, Wojcik M, Borymski S, Piotrowska-Seget Z (2013) Short-term effects of the herbicide
napropamide on the activity and structure of the soil microbial community assessed by the
multi-approach analysis. Appl Soil Ecol 66:8–18
Darnerud PO, Eriksen GS, Johannesson T et al (2001) Polybrominated diphenyl ethers: occur-
rence, dietary exposure, and toxicology. Environ Health Perspect 109:49–68
Das AC, Chakravarty A, Sen G et al (2005) A comparative study on the dissipation and microbial
metabolism of organophosphate and carbamate insecticides in Orchaqualf and Fluvaquent soils
of West Bengal. Chemosphere 58:579–584
DaSilva EJ, Henriksson LE, Henriksson E (1975) Effect of pesticides on blue-green algae and
nitrogen-fixation. Arch Environ Contam Toxicol 3:193–204
De Liguoro M, Cibin V, Capolongo F et al (2003) Use of oxytetracycline and tylosin in intensive
calf farming: evaluation of transfer to manure and soil. Chemosphere 52:203–212
Delschen T (1999) Impacts of long-term application of organic fertilizers on soil quality param-
eters in reclaimed loess soils of the Rhineland lignite mining area. Plant Soil 213:43–54
Desneux N, Decourtye A, Delpuech JM (2007) The sublethal effects of pesticides on beneficial
arthropods. Annu Rev Entomol 52:81–106
Dettenmaier E (2008) Measuring and modelling of plant root uptake of organic chemicals.
Dissertation, Utah State University, Logan, Utah
Devanathan G, Subramanian A, Someya M et al (2009) Persistent organochlorines in human breast
milk from major metropolitan cities in India. Environ Pollut 157:148–154
Devanathan G, Isobe T, Subramanian A et al (2012) Contamination status of polychlorinated
biphenyls and brominated flame retardants in environmental and biota samples from India. In:
Kawaguchi M, Misaki K, Sato H et al (eds) Interdisciplinary studies on environmental
chemistry. Environmental pollution and ecotoxicology, pp 269–277
Devi NL, Raha P (2013) Contamination of Organochlorine Pesticides (OCPs) in India. Bull
Environ Sci Res 2:9–14
Digrak M, Kazanaki F (2001) Effect of some organophosphorus insecticides on soil microorgan-
isms. Turk J Biol 25:51–58
Dolliver H, Gupta S, Noll S (2008) Antibiotic degradation during manure composting. J Environ
Qual 37:1245–1253
DTE (1999) Bloody waters. Down To Earth, Issue Apr 1–15, Society for Environmental Com-
munications, New Delhi, India. http://www.downtoearth.org.in/node/19679
Du L, Liu W (2012) Occurrence, fate, and ecotoxicity of antibiotics in agro-ecosystems. A review.
Agron Sustain Dev 32:309–327
Duarte-Davidson R, Jones KC (1996) Screening the environmental fate of organic contaminants in
sewage sludge applied to agricultural soils: II. The potential for transfers to plants and grazing
animal. Sci Total Environ 185:59–70
Ellwardt P (1977) Variation in content of polycyclic aromatic hydrocarbons in soil and plants by
using municipal waste compost in agriculture. In: Proceedings of symposium on soil organic
matter studies. Vol. II. International Atomic Energy Agency, Vienna. p 291
Farkas MH, Berry JO, Aga DS (2007) Chlortetracycline detoxification in maize via induction of
glutathione S-transferases after antibiotic exposure. Environ Sci Technol 41:1450–1456
Feitosa-Felizzola J, Chiron S (2009) Occurrence and distribution of selected antibiotics in a small
Mediterranean stream (Arc River, Southern France). J Hydrol 364:50–57
128 5 Organic Pollutants

Fick J, S€oderstr€om H, Lindberg RH et al (2009) Contamination of surface, ground, and drinking
water from pharmaceutical production. Environ Toxicol Chem 28:2522–2527
Fismes J, Perrin GC, Empereur BP et al (2002) Soil-to-root transfer and translocation of polycyclic
aromatic hydrocarbons by vegetables grown on industrial contaminated soils. J Environ Qual
31:1649–1656
Folch I, Vaquero MT et al (1996) Extraction and clean-up methods for improvement of the
chromatographic determination of polychlorinated biphenyls in sewage sludge-amended
soils: elimination of lipids and sulphur. J Chromatogr A 719:121–130
Forgas E, Cserhati T, Oros G (2004) Removal of synthetic dyes wastewaters: a review. Environ Int
30:953–971
Frampton GK, Jaensch S, Scott-Fordsmand JJ et al (2006) Effects of pesticides on soil inverte-
brates in laboratory studies: a review and analysis using species sensitivity distributions.
Environ Toxicol Chem 25:2480–2489
Galvin S, Boyle F, Hickey P (2010) Enumeration and characterization of antimicrobial-resistant
Escherichia coli bacteria in effluent from municipal, hospital, and secondary treatment facility
sources. Appl Environ Microbiol 76:4772–4779
Gan R, Berthouex P (1994) Disappearance and crop uptake of PCBs from sludge amended
farming. Water Environ Res 66:54–69
Gao HJ, Jiang X, Wang F, Wang DZ et al (2005) Residual levels and bioaccumulation of
chlorinated persistent organic pollutants (POPs) in vegetables from suburb of Nanjing, Peo-
ple’s Republic of China. Bull Environ Contam Toxicol 74:673–680
Gasecka M, Włodarczyk-Makuła M et al (2015) Phytoremediation of PAH- contaminated areas.
In: Ansari AA et al (eds) Phytoremediation: management of environmental contaminants,
Volume 1. Springer International Publishing, Cham, pp 295–308
Ghanem A, D’Orazio V et al (2010) Phytotoxicity assay of selected plants to Pyrene contaminated
soil. 19th World congress of soil science, soil solutions for a changing world, 1–6 August 2010,
Brisbane, Australia. Published on DVD, pp 74–77
Goncalves C, Alpendurada MF (2005) Assessment of pesticide contamination in soil samples from
an intensive horticulture area, using ultrasonic extraction and gas chromatography-mass
spectrometry. Talanta 65:1179–1189
Grossi G, Lichtig J, Kraub P (1998) PCDD/F, PCB, and PAH content of Brazilian compost.
Chemosphere 37:213–216
Grube A, Donaldson D, Kiely T et al (2011) Pesticides industry sales and usage: 2006 and 2007
market estimates. U.S. Environmental Protection Agency, Office of Chemical Safety and
Pollution Prevention, Washington, DC
Gutierrez IR, Watanabe N, Harter T et al (2010) Effect of sulfonamide antibiotics on microbial
diversity and activity in a Californian mollic haploxeralf. J Soils Sediments 10:537–544
Hamscher G, Sczesny S, Hoper H et al (2002) Determination of persistent tetracycline residues in
soil fertilized with liquid manure by high-performance liquid chromatography with
electrospray ionization tandem mass spectrometry. Anal Chem 74:1509–1518
Hao OJ, Kim H, Chang PC (2000) Decolorization of wastewater. Crit Rev Environ Sci Technol
30:449–505
Harrison R, Smith DJT, Luhana L (1996) Source apportionment of atmospheric polycyclic
aromatic hydrocarbons collected from an urban location in Birmingham, UK. Environ Sci
Technol 30:825–832
Hashimoto Y (2005) Dieldrin residue in the soil and cucumber from agricultural field in Tokyo. J
Pestic Sci 30:397–402
Hawker DW, Connell DW (1988) Octanol-water partition coefficients of polychlorinated biphenyl
congeners. Environ Sci Technol 22:382–387
He JZ, Ge Y, Xu Z, Chen C (2009) Linking soil bacterial diversity to ecosystem multifunctionality
using backward-elimination boosted trees analysis. J Soils Sediments 9:547–554
References 129

Heitkamp MA, Cerniglia CE (1989) Polycyclic aromatic hydrocarbon degradation by a Myco-
bacterium sp. in microcosms containing sediment and water from a pristine ecosystem. Appl
Environ Microbiol 55:1968–1973
Hickey WJ (1999) Transformation and fate of polychlorinated biphenyls in soil and sediment. In:
Adriano DC (ed) Bioremediation of contaminated soils. ASA, CSSA and SSSA, Madison, pp
213–237
Hilber I, Mader P, Schulin R et al (2008) Survey of organochlorine pesticides in horticultural soils
and there grown Cucurbitaceae. Chemosphere 73:954–961
Hirsch R, Temes T, Haberer K et al (1999) Occurrence of antibiotics in the aquatic environment.
Sci Total Environ 225:109–118
Hollowell AC, Gano KA, Lopez G et al (2015) Native California soils are selective reservoirs for
multidrug-resistant bacteria. Environ Microbiol Rep 7(3):442–449
Howsam M, Jones KC, Ineson P (2000) PAHs associated with the leaves of three deciduous tree
species. I – concentrations and pro- files. Environ Pollut 108:413–424
Hu T, Wu SC (2001) Assessment of the effect of azo dye RP2B on the growth of a nitrogen fixing
cyanobacterium – Anabaena sp. Bioresour Technol 77:93–95
Igbedioh SO (1991) Effects of agricultural pesticides on humans, animals and higher plants in
developing countries. Arch Environ Health 46:218–223
Imran M, Shaharoona B, Crowley DE et al (2015) The stability of textile azo dyes in soil and their
impact on microbial phospholipid fatty acid profiles. Ecotoxicol Environ Saf 120:163–168
Jacob J, Seidel A (2002) Biomonitoring of polycyclic aromatic hydrocarbons in human urine. J
Chromatogr B 778(1–2):31–47
Jacobsen CS, Hjelmsø MH (2014) Agricultural soils, pesticides and microbial diversity. Curr Opin
Biotechnol 27:15–20
Jemba PK (2002) The effect of chloroquine, quinacrine, and metronidazole on both soybean plants
and soil microbiota. Chemosphere 46:1019–1025
Jensen AA (1983) Chemical contaminants in human milk. Residue Rev 89:1–12
Jeyaratnam J (1985) Health problems of pesticide usage in the third world. Brit J Ind Med
42:505–506
Jit S, Dadhwal M, Kumari H et al (2011) Evaluation of hexachlorocyclohexane contamination
from the last lindane production plant operating in India. Environ Sci Pollut Res Int 18
(4):586–597
Johgenson JE (2001) Aldrin and dieldrin: a review of research on their production, environmental
deposition and fate, bioaccumulation, toxicology, and epidemiology in the United States.
Environ Health Perspect 109:113–139
Kalyani DC, Patil PS et al (2008) Biodegradation of reactive textile dye Red BLI by an isolated
bacterium Pseudomonas sp. SUK1. Bioresour Technol 99:4635–4641
Karunakaran CO (1958) The Kerala food poisoning. J Indian Med Assoc 31:204–207
Kennedy AC, Smith KL (1995) Soil microbial diversity and the sustainability of agricultural soils.
Plant Soil 170:75–86
Khillare PS, Hasan A, Sarkar S (2014) Accumulation and risks of polycyclic aromatic hydrocar-
bons and trace metals in tropical urban soils. Environ Monit Assess 186:2907–2923
Kipopoulou AM, Manoli E, Samara C (1999) Bioconcentration of polycyclic aromatic hydrocar-
bons in vegetables grown in an industrial area. Environ Pollut 106:369–380
Kluska M (2005) Polycyclic aromatic hydrocarbons uptake by selected plants in the vicinity of
highway. Archiwum Ochrony Srodowiska 31:61–70
Knapp CW, Dolfing J, Ehlert PAI, Graham DW (2010) Evidence of increasing antibiotic resistance
gene abundances in archived soils since 1940. Environ Sci Technol 44:580–587
Knox RC, Sabatini DA, Canter LW (1993) Subsurface transport and fate processes. Lewis
Publishing, Boca Raton
Kotzerke A, Sharma S, Schauss K et al (2008) Alterations in soil microbial activity and
N-transformation processes due to sulfadiazine loads in pig-manure. Environ Pollut
153:315–322
130 5 Organic Pollutants

Krauss M, Wilcke W, Wolfgang Z (2000) Availability of polycyclic aromatic hydrocarbons
(PAHs) and polychlorinated biphenyls (PCBs) to earthworms in urban soils. Environ Sci
Technol 34:4335–4340
Kucharski J, Jastrzebska E, Wyszkowska J et al (2000) Effect of pollution with diesel oil and
leaded petrol on enzymatic activity of the soil. Zesz Probl Postep Nauk Rol 472:457–464
Kumar V, Kothiyal NC (2011) Distribution behavior of polycyclic aromatic hydrocarbons in
roadside soil at traffic intercepts within developing cities. Int J Environ Sci Technol 8:63–72
Kumar K, Gupta SC, Baidoo SK et al (2005a) Antibiotic uptake by plants from soil fertilized with
animal manure. J Environ Qual 34:2082–2085
Kumar K, Gupta SC, Chander Y, Singh AK (2005b) Antibiotic use in agriculture and their impact
on terrestrial environment. Adv Agron 87:1–54
Kumar B, Gaur R, Kumar S, Sharma CS (2013a) Environmental and human health risk assessment
of benzo[a]pyrene levels in agricultural soils from the national capital region Delhi, India. Hum
Ecol Risk Assess 19:118–125
Kumar B, Verma VK, Kumar S, Sharma CS (2013b) Probabilistic health risk assessment of
polycyclic aromatic hydrocarbons and polychlorinated biphenyls in urban soils from a tropical
city of India. J Environ Sci Health, Part A: Toxic Hazard Subst Environ Eng 48:1253–1263
Kumar B, Verma VK, Mishra M et al (2014) DDT and HCH (Organochlorine Pesticides) in
residential soils and health assessment for human populations in Korba, India. Hum Ecol Risk
Assess 20:1538–1549
Kumari B, Madan VK, Kathpal TS (2008) Status of insecticide contamination of soil and water in
Haryana, India. Environ Monit Assess 136:239–244
Kummerer K (2004) Resistance in the environment. J Antimicrob Chemother 54:311–320
Lehndorff E, Schwark L (2004) Biomonitoring of air quality in the cologne conurbation using pine
needles as a passive sampler – part II: polycyclic aromatic hydrocarbons (PAH). Atmos
Environ 38(23):3793–3808
Limmer MA, Burken JG (2014) Plant translocation of organic compounds: molecular and phys-
icochemical predictors. Environ Sci Technol Lett 1:156–161
Lin AYC, Tsai YT (2009) Occurrence of pharmaceuticals in Taiwan’s surface waters: impact of
waste streams from hospitals and pharmaceutical production facilities. Sci Total Environ
407:3793–3802
Liste HH, Alexander M (2000) Accumulation of phenanthrene and pyrene in rhizosphere soil.
Chemosphere 40:11–14
Liu F, Ying GG, Tao R et al (2009) Effects of six selected antibiotics on plant growth and soil
microbial and enzymatic activities. Environ Pollut 157:1636–1642
Lo CC (2010) Effect of pesticides on soil microbial community. J Environ Sci Health B
45:348–359
Lorenz ES (2006) Potential health effects of pesticides. College of Agricultural Science Penn State
University, University Park
Magi E, Bianco R, Ianni C, Di Carro M (2002) Distribution of polycyclic aromatic hydrocarbons
in the sediments of the Adriatic Sea. Environ Pollut 119:91–98
Mahler BJ, Metre PCV, Crane JL et al (2012) Coal-tar-based pavement sealcoat and PAHs:
implications for the environment, human health, and stormwater management. Environ Sci
Technol 46(6):3039–3045
Malik A, Celik EK, Bohn C et al (2008) Detection of conjugative plasmids and antibiotic
resistance genes in anthropogenic soils from Germany and India. FEMS Microbiol Lett
279:207–216
Manirakiza P, Akinbamijo O, Covaci A, Pitonzo R, Schepens P (2003) Assessment of organo-
chlorine pesticide residues in west African city farms: Banjul and Dakar case study. Arch
Environ Contam Toxicol 44:171–179
Margesin R, Walder G et al (2000) The impact of hydrocarbon remediation (diesel oil and
polycyclic aromatic hydrocarbons) on enzyme activities and microbial properties of soil.
Acta Biotechnol 20:313–333
References 131

Masclet P, Cachier H, Liousse C et al (1995) Emissions of PAH by savannah fires. J Atmos Chem
22:41–45
Masih A, Taneja A (2006) Polycyclic aromatic hydrocar-bons (PAHs) concentrations and related
carcinogenic po-tencies in soil at a semi-arid region of India. Chemosphere 65:449–456
Matin MA, Malek MA, Amin MR, Rahman S, Khatoon J, Rahman M, Aminuddin M, Mian AJ
(1998) Organochlorine insecticide residues in surface and underground water from different
regions of Bangladesh. Agric Ecosyst Environ 69:11–15
Mawussi G, Sanda K, Merlina G, Pinelli E (2009) Assessment of average exposure to organo-
chlorine pesticides in southern Togo from water, maize (Zea mays) and cowpea (Vignaunguiculata). Food Addit Contam Part A Chem Anal Control Expo Risk Assess 26:348–354
McCrady JK, McFarlane C, Gander LK (1990) The transport and fate of 2,3,7,8-TCDD in soybean
and corn. Chemosphere 21:359–376
Medeiros PM, Simoneit BRT (2008) Source profiles of organic compounds emitted upon com-
bustion of green vegetation from temperate climate forests. Environ Sci Technol
42:8310–8316
Minh NH, Minh TB, Watanabe M et al (2003) Open dumping site in Asian developing countries: a
potential source of polychlorinated dibenzo-p-dioxins and polychlorinated dibenzofurans.
Environ Sci Technol 37:1493–1502
Mitchell SM, Ullman JL, Bary A et al (2015) Antibiotic degradation during thermophilic
composting. Water Air Soil Pollut 226:1. doi:10.1007/s11270-014-2288-z
Moore FP, Barac T, Borremans B et al (2006) Endophytic bacterial diversity in poplar trees
growing on a BTEX-contaminated site: the characterization of isolates with potential to
enhance phytoremediation. Syst Appl Microbiol 29:539–556
Mueller KE, Shann JR (2006) PAH dissipation in spiked soil: impacts of bioavailability, microbial
activity, and trees. Chemosphere 64:1006–1014
Munoz I, Gomez-Ramos MJ, Aguera A et al (2009) Chemical evaluation of contaminants in
wastewater effluents and the environmental risk of reusing effluents in agriculture. Trends Anal
Chem 28:676–694
Muthunarayanan V, Santhiya M, Swabna V et al (2011) Phytodegradation of textile dyes by Water
Hyacinth (Eichhornia crassipes) from aqueous dye solutions. Int J Environ Sci 1:1702–1717
Mutiyar PK, Mittal AK (2013) Occurrences and fate of an antibiotic amoxicillin in extended
aeration-based sewage treatment plant in Delhi, India: a case study of emerging pollutant.
Desalin Water Treat 51:6158–6164
Mutiyar PK, Mittal AK (2014) Occurrences and fate of selected human antibiotics in influents and
effluents of sewage treatment plant and effluent-receiving river Yamuna in Delhi (India).
Environ Monit Assess 186:541–557
Naamala J, Jaiswal SK, Dakora FD (2016) Antibiotics resistance in rhizobium: type, process,
mechanism and benefit for agriculture. Curr Microbiol 72:804. doi:10.1007/s00284-016-1005-0
NAAS (2010) Antibiotics in manure and soil- a grave threat to human and animal health, Policy
paper no 43. National Academy of Agricultural Sciences, New Delhi, p 20
Nam JJ, Song BH, Eom KC, Lee SH et al (2003) Distribution of polycyclic aromatic hydrocarbons
in agricultural soils in South Korea. Chemosphere 50:1281–1289
Nussbaumer T (2003) Combustion and co-combustion of biomass: fundamentals, technologies,
and primary measures for emission reduction. Energy Fuel 17:1510–1521
O’Connor GA (1996) Organic compounds in sludge-amended soils and their potential uptake by
crop plants. Sci Total Environ 185:71–81
Oleszczuk P, Baran S (2004) Concentration of PAHs in plants growing on soils amended with
various doses of sewage sludge. Arch Environ Prot 30:35–50
Orecchio S (2010) Contamination from polycyclic aromatic hydrocarbons (PAHs) in the soil of a
botanic garden localized next to a former manufacturing gas plant in Palermo (Italy). J Hazard
Mater 180(1–3):590–601
Pandey RK, Rai SN (1993) Effect of varying doses of pesticides on nitrifying bacteria and nitrogen
transformations. Indian J Agric Chem 26(2/3):123–132
132 5 Organic Pollutants

Pandey PK, Patel KS, Lenicek J (1999) Polycyclic aromatic hydrocarbons: need for assessment of
health risks in india? Study of an urban-industrial Location in India. Environ Monit Assess
59:287–319
Pankhurst CE (1977) Symbiotic effectiveness of antibiotic-resistant mutants of fast- and slow-
growing strains of Rhizobium nodulating Lotus species. Can J Microbiol 23:1026–1033
Pelosi C, Barot S, Capowiez Y, Hedde M, Vandenbulcke F (2014) Pesticides and earthworms- a
review. Agron Sustain Dev 34:199–228
Pereira L, Alves M (2012) Dyes-environmental impact and remediation. In: Malik A, Grohmann E
(eds) Environmental protection strategies for sustainable development, Strategies for sustain-
ability. Springer ScienceþBusiness Media B,V, Dordrecht, pp 111–162
Perra G, Renzi M, Guerranti C et al (2009) Polycyclic aromatic hydrocarbons pollution in
sediments: distribution and sources in a lagoon system (Orbetello, Central Italy). Transit
Waters Bull 3:45–58
Phillips I, Casewell M, Cox T et al (2004) Does the use of antibiotics in food animals pose a risk to
human health? A critical review of published data. J Antimicrob Chemother 53:28–52
Puvaneswari N, Muthukrishnan J et al (2006) Toxicity assessment and microbial degradation of
azo dyes. Indian J Exp Biol 44:618–626
Quantin C, Joner EJ, Portal JM, Berthelin J (2005) PAH dissipation in a contaminated river
sediment under oxic and anoxic conditions. Environ Pollut 134:315–322
Ragnarsdottir KV (2000) Environmental fate and toxicology of organophosphate pesticides. J
Geol Soc 157:859–876
Rost H, Loibner AP, Hasinger M, Braun R, Szolar OHJ (2002) Behavior of PAHs during cold
storage of historically contaminated soil samples. Chemosphere 49:1239–1246
Ryan JA, Bell RM, Davidson JM, O’Connor GA (1988) Plant uptake of non-ionic organic
chemicals from soils. Chemosphere 17:2299–2323
Safe S (2004) Endocrine disruptors and human health: is there a problem. Toxicology 205:3–10
Saha JK, Sharma AK (2006) Impact of the use of polluted irrigation water on soil quality and crop
productivity near Ratlam and Nagda industrial area. IISS Bulletin, Indian Institute of Soil
Science, Bhopal, p 26
Saha JK, Panwar N et al (2010) An assessment of municipal solid waste compost quality produced
in different cities of India in the perspective of developing quality control indices. Waste
Manag 30:192–201
Saiyed HN, Bhatnagar VK, Kashyap R (2003) Impact of pesticide use in India. Asia Pacific
Newsletter: 1999–2003. http://www.ttl.fi/Internet/Eng-lish/Infotion/Electronicþjournals/
Asian-PacificþNews-let-ter/1999-03/05.htm
Santodonato J, Howard P et al (1981) Health and ecological assessment of polynuclear aromatic
hydrocarbons. J Environ Pathol Toxicol Oncol 5:1–364
Schauer JJ, Kleeman MJ, Cass GR et al (2001) Measurement of emissions from air pollution
sources, 3. C1–C29 organic compounds from fireplace combustion of wood. Environ Sci
Technol 35(9):1716–1728
Sharma BM, Bharat GK, Tayal S et al (2014) Environment and human exposure to persistent
organic pollutants (POPs) in India: a systematic review of recent and historical data. Environ
Int 66:48–64
Singh RP (2001) Comparison of organochlorine pesticide levels in soil and groundwater of Agra,
India. Bull Environ Contam Toxicol 67:126–132
Singh AN, Singh JS (2006) Experiments on ecological restoration of coal mine spoil using native
trees in a dry tropical environment, India: a synthesis. New For 31:25–39
Singh KP, Malik A, Sinha S (2007) Persistent organochlorine pesticide residues in soil and surface
water of northern Indo-Gangetic alluvial plains. Environ Monit Assess 125:147–155
Skrbic B (2007) Organochlorine and organophosphate pesticide residues in wheat varieties from
Serbia. Food Addit Contam Part A Chem Anal Control Expo Risk Assess 24:695–703
References 133

Smith DJT, Edelhauser EC, Harrison RM (1995) Polycyclic aromatic hydrocarbon concentrations
in road dust and soil samples collected in the United Kingdom and Pakistan. Environ Technol
16:45–53
Someya M, Ohtake M, Kunisue T et al (2010) Persistent organic pollutants in breast milk of
mothers residing around an open dumping site in Kolkata, India: specific dioxin-like PCB
levels and fish as a potential source. Environ Int 36:27–35
Subhani A, Min L, Yong HC et al (2002) Alteration of certain soil microbiological indices of a
paddy soil under anthropogenic stress. J Zhejiang Univ Sci A 3:467–474
Subramanian A, Tanabe S (2007) Persistent toxic substances in India. In: Li A, Tanabe S, Jiang G
et al (eds) Developments in environmental science, vol 7, pp 433–485. doi:10.1016/S1474-
8177(07)07009-X
Subramanian A, Kunisue T, Tanabe S (2015) Recent status of organohalogens, heavy metals and
PAHs pollution in specific locations in India. Chemosphere 137:122–134
Suzuki M, Aizawa N, Okano G et al (1977) Translocation of polychlorobiphenyls in soil into
plants: a study by a method of culture of soybean sprouts. Arch Environ Contam Toxicol
5:343–352
Swarup A,Wanjari RH (2001) Lessons from long-term fertility experiments. All India coordinated
research project on long-term fertilizer experiments to study changes in soil quality, crop
productivity and sustainability. Indian Institute of Soil Science, Bhopal
Tahir U, Yasmin A, Khan UH (2016) Phytoremediation: potential flora for synthetic dyestuff
metabolism. J King Saud Univ Sci 28:119–130
Tao S, Jiao XC, Xu FL et al (2006) Uptake of vapor and particulate polycyclic aromatic
hydrocarbons by cabbage. Environ Pollut 140:13–15
Thacker N, Sheikh J, Tamane SM et al (2013) Emissions of polychlorinated dibenzo-p-dioxins
(PCDDs), dibenzofurans (PCDFs), and dioxin-like polychlorinated biphenyls (PCBs) to air
from waste incinerators and high thermal processes in India. Environ Monit Assess
185:425–429
Thiele-Bruhn S (2003) Pharmaceutical antibiotic compounds in soils-a review. J Plant Nutr Soil
Sci 166:145–167
Topac FO, Dindar E, Ucaroglu S, Baskaya HS (2009) Effect of a sulfonated azo dye and sulfanilic
acid on nitrogen transformation processes in soil. J Hazard Mater 170:1006–1013
Trapp S (2004) Plant uptake and transport models for neutral and ionic chemicals. ESPR – Environ
Sci Pollut Res 11(1):33–39
Travis CC, Arms AD (1988) Bioconcentration of organics in beef, milk, and vegetation. Environ
Sci Technol 22:271–274
Tsai PJ, Shih TS, Chen HL et al (2004) Assessing and predicting the exposures of polycyclic
aromatic hydrocarbons (PAHs) and their carcinogenic potencies from vehicle engine exhausts
to highway toll station workers. Atmos Environ 38:333–343
Turco RF, Moorman TB, Bezdicek DF (1986) Effectiveness and competitiveness of spontaneous
antibiotic-resistant mutants of Rhizobium leguminosarum and Rhizobium japonicum. Soil BiolBiochem 18:259–262
Turrio-Baldassarri L, Alivernini S, Battistelli CL et al (2007) A study on PCB, PCDF/PCDF
industrial contamination in an mixed urban/agricultural area significantly affecting the food
chain and the human exposure. Part I: soil and feed. Chemosphere 67:1822–1830
Turrio-Baldassarri L, Abate V, Battistelli CL et al (2008) PCDF/PCDF and PCB in human serum
of differently exposed population groups of an Italian city. Chemosphere 73:228–234
Turrio-Baldassarri L, Alivernini S, Carasi S et al (2009) PCB, PCDD and PCDF contamination of
food of animal origin as the effect of soil pollution and the cause of human exposure in Brescia.
Chemosphere 76(2):278–285
Uera RB, Paz-Alberto AM, Sigua GC (2007) Phytoremediation potentials of selected tropical
plants for ethidium bromide. Environ Sci Pollut Res 14:505–509
van Bohemen HD, van de LaakWHJ (2003) The influence of road infrastructure and traffic on soil,
water, and air quality. Environ Manag 31:50–68
134 5 Organic Pollutants

van Elsas JD, Chiurazzi M, Mallon CA et al (2012) Microbial diversity determines the invasion of
soil by a bacterial pathogen. Proc Natl Acad Sci U S A 109:1159–1164
Van Metre PC, Mahler BJ, Wilson JT (2009) PAHs underfoot: contaminated dust from coal-tar
sealcoated pavement is widespread in the United States. Environ Sci Technol 43(1):20–25
VanRooij JGM, Bodelierbade MM, Jongeneelen FJ (1993) Estimation of individual dermal and
respiratory uptake of polycyclic aromatic-hydrocarbons in 12 coke-oven workers. Brit J Ind
Med 50:623–632
Watkinson AJ, Murby EJ, Kolpin DW et al (2009) The occurrence of antibiotics in an urban
watershed: from wastewater to drinking water. Sci Total Environ 407:2711–2723
Webb KE, Fontenot JP (1975) Medicinal drug residues in broiler litter and tissues from cattle fed
litter. J Anim Sci 41:1212–1217
Webber MD, Pietz RI et al (1990) Plant uptake of PCBs and other organic contaminants from
sludge-treated coal refuse. J Environ Qual 23:1019–1026
Wenzel WW, Adriano DC, Salt D, Smith R (1999) Phytoremediation: a plant-microbe-based
remediation system. In: Bioremediation of contaminated soils, Agronomy monograph no. 37.
SSSA, Madison, pp 457–508
Wetzel A, Werner D (1995) Ecotoxicological evaluation of contaminated soil using the legume
root nodule symbiosis as effect parameter. Environ Toxicol Water Qual 10:127–133
White CM, Lee ML (1980) Identification and geochemical significance of some aromatic com-
ponents of coal. Geochim Cosmochim Acta 44:1825–1832
Whitfield Aslund ML, Zeeb BA, Rutter A, Reimer KJ (2007) In situ phytoextraction of
polychlorinated biphenyl – (PCB) contaminated soil. Sci Total Environ 374:1–12
WHO (2001) Bathing water quality and human health, HO/SDE/WSH/01.2, Geneva
Wild SR, Jones KC (1992) Polynuclear aromatic hydrocarbons uptake by carrots grown in sludge
amended soil. J Environ Qual 21:217–225
Wild SR, Harrad SJ, Jones KC (1994) The influence of sewage sludge applications to agricultural
land on human exposure to polychlorinated dibenzo-p-dioxins (PCDDs). Environ Pollut
83:357–369
Wilson C, Tisdell C (2001) Why farmers continue to use pesticides despite environmental, health
and sustainability costs. Ecol Econ 39:449–462
Winckler C, Grafe A (2001) Use of veterinary drugs in intensive animal production. J Soils
Sediments 1:66–70
Zhan X, Liang X, Xu G, Zhou L (2013) Influence of plant root morphology and tissue composition
on phenanthrene uptake: stepwise multiple linear regression analysis. Environ Pollut
179:294–300
Zhang Y, Tao S, Shen H, Ma J (2009) Inhalation exposure to ambient polycyclic aromatic
hydrocarbons and lung cancer risk of Chinese population. Proc Natl Acad Sci U S A
106:21063–21067
Zhou Q (2001) Chemical pollution and transport of organic dyes in water soil crop system of the
chinese coasts. Bull Environ Contam Toxicol 66:784–793
Zobiole LHS, Kremer RJ, Oliveira RS, Constantin J (2011) Glyphosate affects micro-organisms in
rhizospheres of glyphosate- resistant soybeans. J Appl Microbiol 110:118–127
References 135

Chapter 6
Collection and Processing of Polluted Soil
for Analysis
Abstract Risk assessment of polluted land generally involves formulation of site
specific remedial strategy, which further depends on history and type of polluting
activities, contaminant migration pathways and their visible impact on ecosystem.
Methods of soil sample collection and their processing before analysis in the
laboratory become highly important for accurate interpretation of results and
devising appropriate strategy for remediation of the site. Several statistical and
non-statistical methods have been used for identifying sampling locations, each of
which has advantages over other. Systematic and judgmental sampling methods are
preferred where contaminant migration history is known and polluted area requires
more intensive sampling due to high heterogeneity. On the other hand, statistical
methods avoid sampling biasness and minimize uncertainty related errors in situ-
ations. Processing and storage of samples before analysis of samples depend on the
type of contaminants. This chapter also discusses on selection of appropriate
instruments for soil sampling, methods of processing and storage as well as
precautionary measures for minimizing errors of analysis.
Keywords Soil • Polluted site • Collection • Sampling • Processing • Storage
Soil samples collection and their processing are the initial steps during impact
assessment process of soil pollution cases. Although these are also integral part of
soil fertility evaluation, collection and processing of soils demands extra care and
precautions during EIA due to several following reasons.
(i) Stakeholders in this case are more than one (only farmer or researcher in the
other case), which may include aggrieved party (land owner), government,
judiciary, polluting agency, researcher etc. This demands satisfactory protocol
for all the stakeholders.
(ii) In many cases, pollutants to be determined in samples are present in very small
concentration requiring extra precision and accuracy of determination through
minimization of error in sample handling.
(iii) In most cases, contaminants migration pathway (both horizontal and vertical)
are not known on polluted sites, which makes impact assessment more com-
plex and uncertain. On the contrary, agricultural land are relatively uniform
© Springer Nature Singapore Pte Ltd. 2017
J.K. Saha et al., Soil Pollution - An Emerging Threat to Agriculture, Environmental
Chemistry for a Sustainable World 10, DOI 10.1007/978-981-10-4274-4_6
137

within a limited boundary area due to similar cropping and soil management
history which makes soil sampling for fertility evaluation is relatively simple.
This chapter briefly describes different sampling and processing methodology
(including tools) usually followed under different pollution scenario with their
advantages and uncertainties.
6.1 Environmental Risk Assessment
Environmental risk assessment of the soil pollution is a site based approach, which
provides a decision support during formulating remedial strategy. The major
objective of risk assessment is to assess whether a contaminated site poses any
harmful effect on organisms residing in the ecosystem. In the perspective of human
health, risk assessment generally involves following sequential steps (Malherbe
2001):
1. Site characterization
2. Exposure assessment
3. Toxicity assessment
4. Risk characterization
The 1st step of the risk assessment (i.e., site characterization) is very important as it
influences the success of decision making process and remedial actions. Sampling
of soils is an important part of site characterization. It may be carried out in one or
more steps depending on the existing information on the site and the objective(s) of
site characterization. Due care is needed to devise appropriate strategy as it has
consequences on cost of remediation and public health. Following points should be
given due care before initiating sampling process for achieving its objectives.
• Identifying site location
• Determining sample density
• Selection of sampling method
• Type of sample
• Depth of sample
In case of polluted land, soil samples are collected with one or more of following
different objectives
1. To identify the exact locations having accumulated pollutants
2. To identify the nature of contaminants and quantify their concentrations
3. To assess quantitatively the area and volume of land/soil mass requiring
remediation
4. To evaluate quantitatively the accumulation of toxic elements/components in the
soil fractions which contribute more in the exposure pathway(s)
138 6 Collection and Processing of Polluted Soil for Analysis

The first two objectives are most commonly adopted in India and other countries
mostly to fulfill different legal obligations in reply to public interest litigations.
Care and diligence should be exercised to ensure that the samples collected were
truly representative of the environmental components to be studied. Different types
sampling pattern have been used depending on the purpose, cost and availability of
time to deliver outcome, which can be categorized into statistical and non-statistical
approaches.
6.2 Sampling Pattern Selection
Several factors like history of contamination, nature of contaminants, and objective
of sample collection will determine sampling pattern selection. The sampling cost,
time, error and its efficacy is influenced by sampling pattern. If the concentration
levels of a contaminant are known or are suspected to exhibit periodic spatial
variations, the sampling pattern should be oriented in such a way that it will not
be in or out of phase with the periodicity of the variations. Where periodic
variations are known to exist but the orientation of the periodicity is not known, a
‘stratified random’ sampling pattern should be considered.
6.2.1 Sampling Based on Non-statistical Approach
6.2.1.1 Judgmental Sampling Pattern
For this method, sampling points are selected on the basis of the investigator’sknowledge of the probable distribution of contaminants at the site. It is an efficient
sampling method which makes use of the site history and field observations but has
the disadvantage of being potentially biased. The quality of the sampling results
depends on the experience of the investigator and the available site history infor-
mation. This technique may be used during preliminary investigation to recognise
the nature of contamination before conducting systematic sampling.
Sampling Location Identification The selection of sampling locations depends
upon the study objectives, the data quality objectives, preliminary information, and
on-site conditions (Paetz and Wilke 2005). While sampling from the identified
locations the details of the following on-site conditions need to be considered:
(i) Local topography
(ii) Climatic conditions
(iii) Bedrock/Parent material type
(iv) Soil type and its physicochemical characteristics (texture, pH, organic matter
content etc.)
(v) Ground cover
6.2 Sampling Pattern Selection 139

(vi) Water and its proximity to the location site
(vii) Location of contaminant source and its background level of contamination
(viii) Nature of contaminants
(ix) Contaminant pathway
(x) Ecological receptors
For the purpose of soil sample collection, the site should be divided into areas
representing similar material types (like tailings, natural soil or rock), similar
contaminants, and other site-specific features as indicated in the site history.
Variation in contamination distribution in soil differs on depth as well as surface
location. Finer sized particles and organic matter have relatively more contaminant
than the coarse sized particle and its deposition on the site location (surface and
depth) depends on flow characteristics (velocity) of a body of water. Hence, the soil
with finer and high organic carbon content, the sampling is most likely from
depositional zones. On the other hand, soils with low organic carbon and coarse
texture have few pollutants and are mostly found in erosion zones. Therefore,
sampling location selection greatly influences the analytical results.
6.2.1.2 Systematic Sampling
Systematic sampling is collection of samples from points at regular and even
intervals. The site is divided into rectangular or triangular grids and each grid
points are given numbers. If sampling is done from each of the grid points, it is
termed as systematic sampling (see Fig. 6.1 as an example). This method of
sampling ensures complete site coverage and a homogeneous distribution of sam-
ples, hence minimizing bias in the estimation of mean concentrations of the
pollutant. Systematic sampling does not generate clusters of sampling points and
is easier to use for identifying survey sampling locations than random sampling
technique. A square grid is the most preferred type of systematic sampling pattern.
Major advantage of the method is that results of analysis of the collected samples
can be used to prepare geographical maps showing spatial variability in contami-
nants concentration using geostatistical tool.
6.2.2 Statistical Approach
In a statistically-based sampling strategy, samples should be collected in an unbi-
ased manner, i.e, all locations within the sampling area should have an equal chance
of being selected as a sampling point. Sampling patterns can be classified into
following two basic types.
140 6 Collection and Processing of Polluted Soil for Analysis

6.2.2.1 Random Sampling Pattern
For random sampling pattern, the site is divided into rectangular or triangular grids
and each grid points are numbered (see Fig. 6.2 as an example). Sampling points are
selected randomly but not arbitrarily. A legitimate ‘random number generator’should be used to determine sampling point coordinates. This randomization
process ensures that any location within the sampling area has an equal chance of
being selected as a sampling point. While random sampling is statistically unbiased,
sampling points by chance, can cluster together. Highly contaminated regions may
be insufficiently sampled making it inefficient in detecting hot spots. Although, an
overall picture of the spatial distribution of the contamination may be obtained, it
has limited use for decision making during remediation process.
6.2.2.2 Stratified Sampling Pattern
At the first step, the site is divided into sub-areas according to geological and
geographical features, nature of the contamination, previous usage pattern of the
Fig. 6.1 Schematic layout
showing ‘systematic
sampling’ locations
Fig. 6.2 Schematic layout
showing ‘random sampling’pattern
6.2 Sampling Pattern Selection 141

site, intended future use of the sub-area and other relevant factors. Each sub-area
can then be treated as an individual site; and subsequently different sampling
patterns and sampling densities can be applied (see Fig. 6.3 as an example). A
stratified sampling pattern approach is best suited for investigations of large sites
with complex contaminant distributions. This sampling pattern may require a more
complex statistical analysis. However advantageously, it avoids the risk of insuffi-
cient sampling from highly contaminated area.
6.2.2.3 Stratified Random Sampling
Polluted site is divided into several blocks/strata through grids and subse-
quently, exact sampling points within each of the blocks are determined randomly
(see Fig. 6.4 as an example). If minimization of number of sampling points is
necessary in view of technical limitations, the blocks/strata for sampling may be
selected statistically using random number and subsequently, sampling points may
be selected randomly (see Fig. 6.5 as an example).
6.2.2.4 Multi-stage Sampling
Selection of appropriate sampling strategy is only possible if prior information
related to site characteristics and soil contamination is available. In case such facts
are not available, a two- or multi-stage sampling is often better for devising
appropriate sampling strategy, which can be modified and improved at each step.
However, time and cost of sampling increases with stage of sampling. Collection of
information on nature of polluting activities, mode of contaminants spread, land-
scape, slope, present and past land use helps in reducing number of sampling stages.
Fig. 6.3 Schematic layout showing ‘stratified sampling’ pattern
142 6 Collection and Processing of Polluted Soil for Analysis

6.3 Sampling Uncertainty
One can never be ‘certain’ about an answer derived from sampling. Therefore, the
uncertainty must be specified for a statistical statement to have meaning. In
statistics, uncertainty is technically referred to as confidence level or risk. Confi-dence level is quantified as a percentage. A 95% confidence’ level is equivalent to a0.05 risk. For example, if a particular statistical statement is quoted as having a 95%
Fig. 6.4 Schematic layout
showing ‘stratified random
sampling’ pattern where
randomised sampling is
done for each block
Fig. 6.5 Schematic layout
showing ‘stratified random
sampling’ pattern where
randomised sampling is
done for few blocks selected
randomly
6.3 Sampling Uncertainty 143

confidence level or a 0.05 risk, this implies that on average the statistical statement
will be correct 95 out of 100 times.
In a set of normally distributed measurements, ‘mean, μ’ is used as true value. Inenvironmental analysis, ‘variance, σ2 ’ (indicating spread of the measurements from
true value) of measurements is also used to represent ‘measure of uncertainty’ andcalculated using the formula:
σ2 ¼P
xi � μð Þ2n� 1
where, xi is ith measurement and ‘n’ is the number of measurements.
Variance during measurement can arise from two sources; during sampling and
during analysis of contaminants. Therefore, uncertainty in sampling can be derived
as:
σ2s ¼ σ2T � σ2a
where, σ2T is total variance due to sampling and is estimated by collecting and
analyzing several samples for a contaminant which are expected to produce iden-
tical results;
σ2a is variance due to analytical measurements and is estimated from the several
analysis of same sample for the contaminant; and
σ2s is variance due to sampling.
6.3.1 Number of Samples to Be Collected
During EIA, ‘average concentration’ of a contaminant in a land area is most
frequently sought parameter. In view for the inherent uncertainty in sampling,
number of samples collected to determine ‘average concentration’ becomes an
important determinant for the quantum of uncertainty or error associated the
conclusion.
A simple approach to calculate the number of samples is to collect and analyze
for estimating an overall standard deviation, σs from few samples through prelim-
inary study (Mitra and Kebbekus 1998). Using Students-t distribution, the number
of samples ‘n’ required for achieving a given confidence level is calculated as:
n ¼ t� σsσ∗s
� �2
where ‘t’ is the t-statistic value selected for a given confidence level, and ‘σ∗s ’ is theacceptable level of uncertainty (i.e. standard deviation). If an experimental value of
σs is not available, an estimate may be done from previous similar studies.
144 6 Collection and Processing of Polluted Soil for Analysis

6.4 Sampling Instruments
Depending upon the type of samples required and soil type, different sampling
methods and equipment’s are used for soil sample collection. Soil samples are
collected using devices like scoop, digger, auger and drills. Surface litters of
non-decomposed plant materials should be removed before sampling so as to ensure
that only soil sample is collected. The use of hand auger ensures the reproducibility
of test results, and guarantees high quality data collection. Following sample
collection, the soil has to be uniformly homogenized in a uncontaminated container
and properly stored in a labeled sample containers. While using devices for
sampling, due care must be taken to avoid devices plated with chrome or other
metals. A stainless steel or lab spoon or plastic scoop suits better for most of
sampling applications. Since most of the probable contamination occurs on the
surface of the sample which comes in contact with the sampling tool, contamination
can be reduced by collecting samples with high volume to surface ratio.
6.4.1 Sampling Surface Soils with a Trowel/Spade and HandScoop
While collecting soil samples with a scoop and trowel the following protocol has to
be kept in mind:
1. Vegetation and stubbles should be removed from soil surface area. Thereafter,
soil volume from the desired depth (usually in the zone of maximum root
activity of annual crops) is loosened with trowel/spade and subsequently, the
desired volume of soil can be collected from the sampling area with a scoop.
Collected sample is thereafter, transferred into an appropriate samples container.
2. For obtaining a composite sample, bulk samples are collected from several
points from a small area (usually<1000 m2) and are homogenized in a container
made of stainless steel using the stainless steel spoon, pestle or trowel. If sample
volume is required to be reduced, the homogenized sample is spread on plastic
sheet in a circular shape and four quarters are marked. At each time any two
opposite quadrants were selected and the rest quadrants were rejected. This
process of homogenizing- quartering is repeated if further reduction of sample
volume is required.
3. If the samples type is solid, chemical preservation is not recommended.
4. Sample containers need to be properly labeled and tagged. All the relevant
information like depth, location, color, proximity to source/water bodies etc.
should be recorded on the soil sample data sheets.
6.4 Sampling Instruments 145

6.4.2 Sampling Surface Soils with a Hand Auger
The hand held auger has a series of extension rod with ‘T’ shaped handle along witha thin-walled sampler tube. While sampling for a desired depth, a hole is made with
the help of auger rod and the rod has to be withdrawn from the hole. Thereafter the
auger tip is replaced with a tube core sampler, is lowered down the bore hole, and
subsequently is withdrawn along the sample. During this process The following
precautions and steps should be followed while collecting soil samples with a hand
auger:
1. The auger has be inserted at 0� to 45� angle from vertical which helps in
minimizing spillage of the sample from the tube sampler. While extracting
samples from the tube auger, tilting of the sampler may be required.
2. Make the auger to rotate once or twice so as to cut a core of material.
3. The auger should be slowly withdrawn, while ensuring the slot to face upward.
6.4.3 Sampling Subsurface Soils with a Drill Rig
A coring device, handle, and hammer are required for this sampling method. The
procedure for collecting subsurface samples using a sample coring device is
described below:
1. The sampler is placed in a position perpendicular to the land surface. In case of
firm/hard soil, the sampler has to be used with the drive hammer, whereas in case
of soft soil, “T” shaped handle is sufficient for sampling. While using the “T”
handle in soft soil for sampling, downward pressure has to be applied until the
device reached the desired soil depth.
2. Thereafter the sampler is withdrawn by pulling the hammer upward direction
and subsequently removing the hammer from the sampler.
3. The sample thus collected has to be transferred to an uncontaminated stainless
steel or plastic bucket and it should be mixed thoroughly so as to achieve a
representative homogeneous sample.
4. If the sample type is volatile in nature, it has to be collected directly from the
bucket before mixing the sample in order to minimize the volatilization loss of
contaminants.
6.5 Preventing Sample Cross-Contamination
Sampling equipment should not be made of a material that will contaminate the
sample (e.g., sampling devices should not be painted, plated, greased, or have some
other type of chemically treated surface). Stainless steel is usually preferred, and
inert plastic equipment may also suit in some cases while collecting metal-
146 6 Collection and Processing of Polluted Soil for Analysis

contaminated soils. Prevention of cross-contamination in the field is essential, and
the level of effort required will depend upon the characteristics of the contaminant
(s) of concern. Sampling devices should be cleaned between sampling locations and
sites as well as at the end of sampling by:
• Wiping, washing, or scrubbing the equipment
• Rinsing the equipment with purified water
• Equipment can also be cleaned with non- phosphate containing soap, but the
equipment must be thoroughly rinsed following a soap wash to ensure that the
samples do not become contaminated with soap residue.
• If the samples are to be used to collect soil containing organic contaminants,
rinsing the equipment should be done at least three times with a solvent (acetone
or hexane) followed by air-drying.
6.6 Soil Sample Collection from Profile
If soil horizons are not distinct, soil samples should be collected at depth-wise
interval. Depth-wise collection of soil samples is appropriate in many industrial,
commercial, residential, or urban soils where the surface soil horizons have been
mixed or disturbed either through construction, landfilling, dumping or capping. As
a standard, soil sample collection at 0 to 15 cm, 0 to 30 cm, 15 to 30 cm, 15 to
60 cm, and 30 to 60 cm depths are followed (Mason 1992; Dalpe and Hamel 2008).
If the soil is contaminated with atmospheric deposition, 0 to 5 cm depth soil sample
collection is recommended. Similarly, sampling not deeper than 30 cm (where most
of microbes habitat exists) is appropriate in case of any ecologically relevant
studies (Spurgeon et al. 2002; ISO 2006). For any specific crop related studies,
rooting depth is considered for sampling zone (Dalpe and Hamel 2008).
There are some challenges associated with sampling forest top soil (Ah horizon)as it can sometimes be difficult to identify the exact boundary between overlying
organic matter (forest floor) and the mineral horizon. For comparison of certain soil
characteristics (e.g., soil carbon pools) among forest management practices, the
collection of soil samples by depth may be preferred (Belanger and Van Rees
2008).
6.7 Composite Sampling
Composite soil sampling is defined as a technique that combines a number of
discrete samples collected from a body of material into a single homogenized
sample so as to represent the average conditions in the sampled body of material
for the purpose of analysis. In the contaminated site, composite sampling is used to
reduce sampling and analytical costs. The principal limitation of composite
6.7 Composite Sampling 147

sampling is the potential hotspots to remain undiscovered due to the inherent
characteristics of the process. For example, a discrete subsample may contain a
high concentration of contaminant that may be masked due to the dilution effect in
the composite sampling procedure. Though Composite sampling may be useful for
assessment of soil fertility of a piece of land with definite ownership boundary; it
should not be used for site-specific health and ecological risk assessments. Com-
posite sampling is not generally recommended to determine the extent of site
contamination, for health and safety risk assessment related to remediation activ-
ities and also during validation purpose following remediation of contaminated site.
Further composite soil sampling should not be practiced for soils contaminated with
semi-volatile or volatile compounds such as polycyclic aromatic hydrocarbons and
petroleum hydrocarbon.
6.8 Reference Soil Collection for Testing
While conducting a site-specific soil testing, one of the most important and some-
times the most challenging tasks is the collection of a well-matched, site-specific,
field-collected reference soil(s). A site-specific field-collected reference soil is a
one that has physical and chemical properties similar to those of the contaminated
field-collected soil(s), but is not contaminated. The importance of including a
reference soil as a control soil in a site-specific ecotoxicity assessment is that it
enables the investigator to differentiate between the influence of the soil’s physicaland chemical properties on test organism’s performance from that of soil contam-
inants. In many cases inherent soil properties such as texture, pH, electrical
conductivity, fertility, and organic matter content strongly influence the growth
and vigour of plants, the growth and reproduction of invertebrates, and the activity
and diversity of soil microorganisms. In order to avoid a misinterpretation of the
toxicity data, well-matched reference soils should therefore be included in any site-
specific ecotoxicity assessment.
General guidance on the degree to which a difference in soil physicochemical
properties between contaminated and reference soils is considered acceptable, is
difficult to prescribe as it will vary with the type of soil, toxicity test being
performed, test organisms chosen etc. Some of the most critical soil physicochem-
ical properties that are normally considered to match for both the reference and
contaminated soils are:
• Particle size distribution (Per cent distribution of clay, sand, and silt)
• Cation exchange capacity
• Fe and Al oxides content
• Content of silicates
• Type of clay minerals
Other soil properties may also be critical to match depending on the type of
testing to be conducted. More than one reference soil might be required to match the
148 6 Collection and Processing of Polluted Soil for Analysis

contaminated soil samples, especially if there is a wide range of physicochemical
properties among site soils.
6.9 Sample Identification/Coding
To ensure preservation of the integrity of the samples collected, sample identifica-
tion/coding should be written on a permanent label mentioning specific details so as
to ensure sample authenticity. Samples should be properly sealed, carrying labels
with information such as, identification code or sample number (location of sam-
ple), date and time of sampling, type of preservation, sample description etc.
6.10 Sample Preservation, Containers, Handling,
and Storage
For soil sampling, different containers have to be used for specific purpose like
(i) aluminum foil for total hydrocarbons determination, and (ii) polythene bags/
containers for general physico-chemical and heavy metal analysis. Chemical pres-
ervation of solids is generally not recommended and therefore, cooling is usually
the best approach, supplemented by the appropriate holding time (Zagury
et al. 2002).
6.11 Preparation of Soil Samples
The extent and type of soil preparation before analysis is dependent on the type of
biological testing to be conducted, soil type, and the condition of the soil sample
upon receipt at the laboratory.
6.11.1 Preparation of Soil Samples for Microbial Testing
Due care must be taken while preparing unconsolidated soil samples for microbial
tests, including microcosm tests for functional capability, biomass, or diversity.
During soil preparation, visible plant materials, stubbles and fauna should be
removed properly. Drying-rewetting procedure is commonly used while preparing
soils. If possible air-drying should be avoided because it changes microbial com-
position (Topp et al. 2008). Also wetting-drying events can induce significant
changes in microbial C and N dynamics. Pre-incubating soils by adding moisture
can significantly influence respiration rates, substance utilization efficiency,
6.11 Preparation of Soil Samples 149

nitrification potential, microbial biomass, nitrate and ammonium concentrations of
soil samples, and these changes can persist for more than a month following the
stress (Fierer and Schimel 2002). Re-wetting after drying also causes bursts of
respiration and growth of distinct populations of bacteria (ISO 2006). Therefore
testing soils as soon as possible after sample collection, and thereby avoiding the
necessity of drying and rewetting, is recommended. If the field moisture of the soil
is too high to sieve, the soil should be air-dried at ambient temperature to workable
moisture content. Normally, the soil samples were sieved through 2 mm sieve and
aerobic soil conditions has to be maintained. However, if the soil is high in organic
matter, 5 mm mesh sieve is recommended and the sieved samples has to be
homogenized thoroughly (Bailey et al. 2008).
6.11.2 Preparation of Soil Samples for Toxicity Testing
This section describes recommended procedures to prepare unconsolidated samples
for testing other than microbial testing.
6.11.2.1 Drying
Drying of soil samples might be required if the sample is too moist to homogenize
and sieve. Soil samples should not be dried, if the method or study objectives
require soils to be tested at field moisture level. Soils should be air-dried at ambient
temperature to “workable” moisture content. A “workable” moisture content is a
soil moisture content usually between field moist and completely air- dried soil
(completely air-dried soil has moisture in equilibrium with the humidity of the
ambient air). A “workable” moisture content result in soil sufficiently dry to allow
sieving without the production of dust and/or permits the soil to flow freely to
facilitate thorough homogenization. Soils should not be completely air-dried or
oven- dried during analysis for microbial parameters. Completely air-drying or
oven- drying soil to any degree, causes a number of reactions in the soil: micro-
fauna and flora die or become senescent; contaminants dissolved in soil pore water
become concentrated, precipitate or coagulate; and, solid organic matter deforms,
can become hydrophobic and/or expose underlying mineral surfaces (Sheppard and
Addison 2008).
Method of Air-Drying of Soils
• Spread out the sample on a sheet of thick polyethylene or polypropylene plastic
or clean stainless steel surface and air-dry the soil only until it is dry enough to
sieve/homogenize; leave sufficient margins between the soil and the edge of the
work surface to avoid contamination from other sources.
• The time required to dry might range from 1 hour to 5 days, depending on the
moisture content of the soil, the texture of the soil, and the temperature and
humidity of the room.
150 6 Collection and Processing of Polluted Soil for Analysis

• Ensure that while drying, the soil sample is placed in a location safe from
disturbance, dust and/or contamination.
• If there is too much standing water, decant the standing water before spreading
out the soil and then dry the soil as described above.
6.11.2.2 Sieving
Soil sample contains coarser materials (gravel, stones), plant roots, macro flora and
fauna which has to be removed before analysis by sieving. Depending upon the soil
analysis method, different mesh sieves (stainless steel) like 2, 4, 6, 8 or 10 mm were
used for sieving dry samples. Sometimes even smaller sized mesh sieves (0.25,
0.50, 0.75 and 1 mm) are also used for specific analysis. For example, soil sample
sieved by 0.5 mm mesh is recommended for organic carbon estimation. In most of
the cases, soil samples are sieved through 2 mm sieve which contains all soil
separates like sand, silt and clay in proportionate amount. While sieving, minimum
disturbance has to be maintained so as to ensure that soil sample aggregate remains
closer to the field condition. If soil samples of larger in size > 2 mm is removed
entirely by sieving, it may sometimes leads to bias during contaminant determina-
tion. For example, removing plant roots or other plant related materials having size
greater than > 2 mm sieve size where contaminants are associated, may result in
underestimation of pollutants.
6.11.2.3 Crushing or Grinding
Soil samples are subjected to grinding, crushing or milling when their homogeni-
zation is difficult to attain by normal sieving method. Further, if the soil gets harder
while drying as in case of clayey soil, crushing/grinding is recommended. It
also helps in proper homogenization of organic matter along with soil separates.
However, grinding of soil samples should be avoided as much as possible as it
destroys the soil aggregates that represent the field condition.
6.11.3 Preparation of Soil Samples for Plant AvailableNutrient Testing
6.11.3.1 Drying of Samples
Moist samples received in the laboratory for plant nutrient analysis should be air
dried by spreading the samples on a polyethylene or polypropylene or plastic or
wooden trays. Proper care should be taken to maintain the identity of each sample at
all stages of preparation either by numbering or tagging the sample trays. After
6.11 Preparation of Soil Samples 151

labeling, the trays may be air dried or placed under racks in a hot air cabinet whose
temperature should not exceed 35 �C and relative humidity should be between
30 and 60%. Soil sample drying either at high temperature or by oven drying is not
recommended as it can cause profound changes in soil parameter. For example, the
microbial population and nitrogen transformation is highly affected by high tem-
perature drying and exposure time. With excessive drying, soil potassium may be
released or fixed depending upon the original level of available potassium.
Exchangeable potassium will increase, if its original level is less than
1 meq/100 g soil (1 cmol kg�1) and vice-versa, but the effect depends upon the
nature of clay minerals in the soil. In general, excessive drying, such as oven drying
of soil, affects availability of most of the nutrients present in the sample and should
be avoided and therefore, only air drying is recommended.
Nitrate, nitrite and ammonium determinations must be carried out on samples
brought straight from the field (Drury et al. 2008). These samples should not be
dried. However, the results are expressed on oven dry basis by separately estimating
moisture content in the samples.
6.11.3.2 Post Drying Care
Air dried samples are ground with a wooden pestle and mortar so that the soil
aggregate are crushed but the soil particles do not breakdown. After grinding, the
soil sample is sieved though 2 mm mesh sieve. While sieving, the entire sample lot
should be used without retaining/discarding sample subset. If some sample portion
is discarded or not used for sieving, the rejected/discarded portion may have
element of interest that may leads to erroneous result while analyzing the sample.
Therefore, repeated sieving is required to pass the soil sample as much as possible
through 2 mm sieve, leaving (retaining) only the coarser fractions (gravels, stones),
organic matter and concretions on the sieve. If the soil is to be analyzed for trace
elements, containers made of copper, zinc and brass must be avoided during
grinding and handling. After sieving, the sample should be mixed thoroughly and
placed in an uncontaminated sample container. The sample container has to be
labeled properly and placed with numbered wooden/plastic tray in a separate room.
6.12 Sampling Plan Checklist
Sampling plan or check list is a key component of the study plan which contains
detailed description of the procedures to be followed during sample collection and
preparation stage. A sampling plan is an important supporting document which
includes all of the information like site location, site manager contact details,
sampling point identification, sampling devices and procedures, sample density,
field observations, sample preparations and handlings (packaging, transportation
and storing).
152 6 Collection and Processing of Polluted Soil for Analysis

References
Bailey VL, Bolton JH, Smith JL (2008) Substrate-inducted respiration and selective inhibition as
measures of microbial biomass in soils. In: Carter MR, Gregorich EG (eds) Soil sampling and
methods of analysis, Canadian society of soil science, 2nd edn. Boca Raton, CRC Press Taylor
and Francis Group, pp 515–526
Belanger N, Van Rees KJC (2008) Sampling forest soils. In: Carter MR, Gregorich EG (eds) Soil
sampling and methods of analysis, Canadian society of soil science. CRC Press Taylor and
Francis Group, Boca Raton, pp 15–24
Dalpe Y, Hamel C (2008) Vesicular-arbuscular mycorrhiza. In: Carter MR (ed) Soil sampling and
methods of analysis. Canadian society of soil science, Lewis Publishers, Boca Raton, pp
287-302
Drury CF, Hart SC, Yan XM (2008) Nitrification techniques for soils. In: Carter MR, Gregorich
EG (eds) Soil sampling and methods of analysis, Canadian society of soil science. Boca Raton,
CRC Press, Taylor and Francis Group, pp 495–513
Fierer N, Schimel JP (2002) Effects of drying-rewetting frequency on soil carbon and nitrogen
transformations. Soil Biol Biochem 34:777–787
ISO (2006) Draft 10381-6. Soil quality sampling part 6: Guidance on the collection, handling and
storage of soil under aerobic conditions for the assessment of microbial processes, biomass and
diversity in the laboratory. International Organization for Standards, Geneva, Switzerland
Malherbe L (2001) Designing a contaminated soil sampling strategy for human health risk
assessment. Eurolab/Eurachem International Workshop “Sampling”, Lisbonne, Portugal
Mason BJ (1992) Preparation of soil sampling protocols: sampling techniques and strategies.
United State Environmental Protection Agency, Washington, DC
Mitra S, Kebbekus B (1998) Environmental chemical analysis. Chapman and Hall/CRC, Boca
Raton
Paetz A, Wilke BM (2005) Soil sampling and storage. In: Margesin R, Schinner F (eds) Manual of
soil analysis – monitoring and assessing soil bioremediation, soil biology, vol 5. Springer-
Verlag, Berlin/Heidelberg, pp 1–45
Sheppard SC, Addison JA (2008) Soil sample handling and storage. In: Carter MR, Gregorich EG
(eds) Soil sampling and methods of analysis, Canadian Soc Soil Sci. CRC Press Taylor and
Francis Group, Boca Raton, pp 39–49
Spurgeon D, Svendson C, Hankard P et al (2002) Review of sublethal ecotoxicological tests for
measuring harm in terrestrial ecosystems, Environment Agency science report P5-063/TR1.
Environment Agency, Bristol, p 191
Topp E, Tien YC, Hartmann A (2008) Bacterial community analyses by denaturing gradient gel
electrophoresis. In: Carter MR, Gregorich EG (eds) Soil sampling and methods of analysis,
Canadian society of soil science. CRC Press Taylor and Francis Group, Boca Raton, pp
567–576
Zagury GJ, Dudal Y, Bureau J, Bastien C, Chasse R (2002) Sample handling and preparation for
estimation of mobility, bioavailability and toxicity of contaminants in soils. In: Sunahara GI
et al (eds) Environmental analysis of contaminated sites, Ecological and environmental
toxicology series. John Wiley and Sons Ltd, West Sussex, pp 9–23
References 153

Chapter 7
Assessment of Heavy Metals Contamination
in Soil
Abstract Several heavy metals are toxic to organisms including human and
therefore their entry into food chain from polluted agricultural land is required to
be controlled. Management and remedial measures of metal contaminated sites
depend on the level and distribution of contamination. In view of high heterogene-
ity of soils in respect of heavy metals concentration, mere analysis of a sample may
not confirm contamination due to polluting activities. This chapter describes vari-
ous approaches for assessing heavy metals contamination of soil and expected
degree of threat it may pose to the environment. Importance of baseline concentra-
tion in areas with high polluting activity is thoroughly discussed along with
statistical significance. Degree of contamination and its threat has also been esti-
mated by researchers through various models. Methods of assessment of risks to
organisms due to heavy metals contamination in soil involving critical analysis of
their translocation within plants and to human through various routes have also
been described. Different countries have adopted regulatory limits to protect the
land from contamination based on different approaches which resulted wide vari-
ations in their limiting values. Soil testing methods for rapid assessment of con-
taminated site has also been described in this chapter.
Keywords Heavy metals • Assessment • Contamination • Risks • Organisms •
Critical limits
Toxic heavy metals and other pollutants are increasingly introduced into the envi-
ronment by different anthropogenic activities. Precautionary measure and manage-
ment of heavy metal contaminated sites are easier to adopt and cost effective when
contamination levels do not cross threshold limit and adverse effect on environment
is exhibited. However, identification of a contaminated site (level of which has not
reached threshold limit) is very difficult unless information on pollutant levels before
pollution activity in soils for the area is available. In most of the sites particularly
having lower levels of polluting activities, contamination could not be confirmed due
to large variations in the natural heavy metal contents in soils. Soils of different
regions naturally contain variable concentrations of different heavy metals due to
differences in parent material, climate, land topography, texture etc. Many fold
variations in metal contents in soils of different regions of the world have been
reported (Kabata-Pendias and Pendias 1992; McBride 1994). Hence, natural
© Springer Nature Singapore Pte Ltd. 2017
J.K. Saha et al., Soil Pollution - An Emerging Threat to Agriculture, Environmental
Chemistry for a Sustainable World 10, DOI 10.1007/978-981-10-4274-4_7
155

concentration of heavy metals determined for a particular region may not be
applicable for other regions. While investigating heavy metals contamination in
soils of a particular region, it is therefore important to establish background/
baseline concentrations. Reliable data on this aspect are also needed because if
these data are incorrect, legislators may mistakenly mandate guideline levels lower
than those are realistically attainable (Davies 1992). Therefore, proper legislation
can only be enacted when databases exist with accurate background trace element
concentrations of soil. Although several EU countries and USA has determined
baseline concentrations in soil for different regions, very few studies have been
undertaken in this respect in low and middle income countries including India.
India’s agricultural land mass has been categorized under 20 agro-ecological
zones covering 103 soil suborders which clearly indicates large variability in soil
properties (Bhattacharyya et al. 2013). Recommended soil management also varies
according to the soil type (Rao and Saha 2012). Nevertheless, it is important to
assess the background concentration which is essential for assessing the degree of
metal pollution affected by anthropogenic activities and inputs and also for regu-
lation of metals in water/soil systems (Zhao et al. 2007; Marandi and Karro 2008;
Vencelides et al. 2010). Due to large variations in parent materials, topography and
climate, different soil types have been developed in India (Kabata-Pendias 2011).
Heavy metals of lithogenic (inherited from lithosphere) and pedogenic (concentra-
tion and distribution of lithogenic metals change due to pedogenic processes) origin
ideally constitute the natural background level in soils. However, anthropogenic
heavy metals (entered due to direct or indirect human activities) into the soil bodies
cannot be ruled out even in areas far away from point sources having significant
polluting activities.
7.1 Presence of Heavy Metals in Natural Soil
Heavy metals occur naturally in the soil as these are derived due to weathering of
rocks. Soil formation from parent material occurs in two stages: first, physical and
chemical changes in primary mineral constituents of the parent rocks (weathering);
and secondly, formation of a soil profile from the weathered rock material (pedo-
genesis). Weathering and pedogenesis are continuous processes occurring simulta-
neously at the same site. Weathering involves dissolution, hydration, hydrolysis,
oxidation, reduction, and carbonation processes. Temperature, rainfall, vegetation
and rock types of a geographical region determine the severity of each of these
processes, resulting into formation of soil types. Though rock types generally
determine trace elements (including heavy metals) concentration in the initial
phases of soil development, other three factors are responsible for their transfor-
mation and movement within the soil profile or outside the system. All these factors
and processes ultimately determine background concentration of elements in the
surface soil layers.
156 7 Assessment of Heavy Metals Contamination in Soil

Natural background concentration is defined as the ambient concentration of
chemicals in soils without human influence (Kabata-Pendias and Pendias 1992;
Gough et al. 1994). Mean heavy metal concentrations varies widely from
0.06–1.1 mg kg�1 for Cd, 1.6–21.5 mg kg�1 for Co, 7–221 mg kg�1 for Cr,
6–80 mg kg�1 for Cu, 0.02–0.41 mg kg�1 for Hg, 4–55 mg kg�1 for Ni,
10–84 mg kg�1 for Pb, 17–125 mg kg�1 for Zn in uncontaminated soils of the
world (McBride 1994). The content of various elements in the soils is depicted in
Table 7.1. Wide variations have been observed in the contents of several heavy
metals among the soil types as well as within a soil type (Kabata-Pendias and
Pendias 1992). This is due to differences in parent materials (from which soil has
developed), climate, land-use history, soil composition etc., influencing soil
forming processes (McBride 1994). Multivariate statistical approach using principal
component analysis (PCA) and cluster analysis as well as GIS tools have been used to
find out large scale variability, origin (pedogenic or anthropogenic) and possible
non-point sources of contamination of heavy metals in cultivated soils (Ratha and
Sahu 1993; Garcia et al. 1996; Facchinelli et al. 2001; da Silva et al. 2016). Variability
of Cr, Co and Ni was mainly controlled by parent materials; while Pb, Cu and Zn were
controlled by long-term anthropogenic activities as indicated by large scale anomalies
in spatial distribution map in Piemonte region of northwestern Italy (Facchinelli et al.
2001). In order to distinguish natural background (geogenic) concentration from
anthropogenic contribution in soils, geochemical mapping technique has been used
with the help of multifractal IDW (Inverse Distance Weighted) interpolation method,
spectral analysis (S-A) and the concentration–area fractal method (C-A) (Cheng
Table 7.1 Content of various elements in soils
Metals
World average
for Soils, mg
kg�1
Range of trace
elements in world
Soils, mg kg�1
Reported range of contents in soils of
polluted area in India (Panwar et al. 2010;
Krishna and Govil 2007, 2008; Bhagure
and Mirgane 2011; Parth et al. 2011;
Purushotham et al. 2012)
As 6.83 <0.1–66.5 0.073–411
B 42 <1–210
Cd 0.41 0.01–2.7 0.05–39
Cr 59.5 1–1100 43–480
Co 11.3 0.1–70 7.6–97
Cu 38.9 1–140 21.2–373
F 321 <10–1194
Pb 27 1.5–176 1.1–1833
Mn 488 7–9200
Hg 0.07 0.008–1.11 1.11–1.54
Mo 1.1 0.1–7.35 2.3–15
Ni 29 0.2–450 14.1–465
V 129 6.3–500 18.4–452
Zn 70 3.5–770 65–7120
Adopted from Kabata-Pendias (2011) and Murthy (2008)
7.1 Presence of Heavy Metals in Natural Soil 157

et al. 1996, 2000; Lima et al. 2003). In volcanic soils of the metropolitan and
provincial areas of Napoli (Italy), Cicchella et al. (2005) used this technique to
identify baseline concentration values of heavy metals. Maps obtained by the S-A
method indicated anthropogenic contribution for some metals (Pb, Zn, Sb, Hg, Cd,
Cr, Cu) due to the long period of constant human activities in the study area. These
maps also showed a high geogenic contribution most probably derived from
hydrothermal fluids of nearby active volcanic fields. The maps obtained using the
S-A method and implemented in GeoDAS, reflected both the geogenic and anthro-
pogenic contribution. Concentration–area fractal method (C-A) was used to classify
the pixel values of baseline maps for determining background values to be used as
reference values for the environmental Italian regulatory Law. Multivariate analysis
has been used to estimate degree of contamination in surface soils of Guangdong
Province in China due to intense industrialization and urbanization (Hu et al. 2013).
Mean Cd, Cu, Zn, and As concentrations were over two times higher than the
background values, with Cd, Cu, and Zn clearly contributed by anthropogenic
sources. In Spain, similar technique was used to identify the sources of heavy
metals in soils under vegetable cultivation (Mico et al. 2006). The content of Co,
Cr, Fe, Mn, Ni and Zn were associated with parent rocks and corresponded to the
first principal component called the lithogenic component. A significant correlation
was found between lithogenic metals and some soil properties such as soil organic
matter, clay content, and carbonates, indicating an important interaction among
them. On the other hand, elements such as Cd, Cu and Pb were related to anthropic
activities and comprised the second (Cu and Pb) and third principal components
(Cd), designated as anthropogenic components.
Due to large variation in their contents, it becomes very difficult to identify a
possibly contaminated soil through mere chemical analysis of a particular site
without the knowledge on background concentration of the area. It is almost
impossible to establish the true natural background level of trace metals in soils
because of long-range atmospheric transport and precipitation of contaminants
along with various other anthropogenic impacts. However, contributions of these
anthropogenic sources are very small and hence are generally ignored during
baseline concentration determination in soils of particular region.
7.2 Concept of Baseline Concentrations of Metals in Soil
The information on baseline concentrations are needed to provide regulators for a
scientific database in order to address the how clean is clean issues and to establish
reasonable clean up criteria. Baseline concentration represents an expected range of
element concentrations around a mean in a normal sample medium and is defined as
95 % of the expected range of background concentrations. This can be determined
in both numerical and statistical ways as a measure of central tendency(e.g. mean)� a measure of deviation from central tendency (e.g. standard devia-tion). Although ‘range’ and ‘mean’ of analytical data is widely used by researchers
158 7 Assessment of Heavy Metals Contamination in Soil

to indicate true background values, these are not applicable to other area or to even
other sets of data in the same area due to some exceptionally high or low analytical
values, which may not be a result of predominant ongoing lithogenic and pedogenic
processes. In many naturally occurring processes, population follow a normal
distribution where about 68%, 95% and 99% of the population lies within μ� σ,μ� 2∗ σ and μ� 3∗ σ range (μ¼mean, and σ¼ standard deviation), as indicated
in Fig. 7.1 (Feller 1971). Geochemical baseline concentration has statistically been
defined as concentration range in which 95% of samples are expected to belong
(Gough et al. 1994). Several researchers computed baseline concentration values as
‘μ� σ’ (Campos et al. 2003). Quality reference values (similar to background
concentration) of metals in soils of Cuba were determined based on 75th percentile
of samples after removing anomalies through a boxplot (Alfaro et al. 2015).
However, many investigators found that heavy metal concentrations in naturally
occurring unpolluted soils follow a log-normal distribution, as exemplified in
Fig. 7.2 (Chen et al. 1999; Zhang et al. 2008). Log-transformation of data mini-
mizes distorting effects of a few high concentrations. In view of this, baseline
concentration of a region is generally represented using geometric mean (GM, a
measure of central tendency) and geometric standard deviations (GSDs, a measure
of variation of the data). Natural background concentrations of major heavy metals
are, thus defined as the range between GM/GSD2and GM�GSD2 which represents
the varied concentrations between the 5th and the 95th percentiles. Upper baseline
concentration of a heavy metal (i.e. GM�GSD2), thus includes 95% of the samples
(Dudka et al. 1995; Chen et al. 1999, Zhang et al. 2008).
7.2.1 Baseline Concentrations Determined for DifferentCountries in the World
Background concentrations have been determined in various countries, for exam-
ple, in United Kingdom (Thornton 1982), Belgium (De Temmerman et al. 1984),
Italy (Bini et al. 1988), India (Kuhad et al. 1989), China (Chen et al. 1991), the
Fig. 7.1 Normal distribution curve (X-axis: sample value; Y-axis: frequency of occurrence)
7.2 Concept of Baseline Concentrations of Metals in Soil 159

Netherlands (Denneman and Robbersen 1993), Western Europe (Angelone and
Bini 1992), Poland (Andersen et al. 1994), Germany (Bachman et al. 1995), United
States of America (Holmgren et al. 1993; Bradford et al. 1996; Ma et al. 1997), and
Spain (Bech et al. 2005) (Table 7.2). All the reports indicated that the origin of
heavy metals is parent materials and anthropogenic activities influenced their
spatial distribution. Apart from these, climate, organic and inorganic components
of soils as well as redox potential also affect the concentration level of trace metals
in soils. In a study to determine spatial distribution of heavy metals in Guangdong
province, Zhang et al. (2008) concluded that the primary source of heavy metals in
soil is parent material and their concentrations are also influenced by pedogenesis.
Anthropogenic activities were other secondary factor playing crucial role in their
spread over the region.
Although several EU countries and USA have determined baseline concentra-
tions in soil for different regions by various methods, very few studies have been
Fig. 7.2 Log-normal
distribution curve (X-axis:
sample value; Y-axis:
frequency of occurrence)
Table 7.2 Upper baseline concentration of heavy metals reported from different countries
Cubaa Spainb USAc Polandd USAe USAf USAg Chinah Spaini
Ag 1 – 2.5 – – – – – –
Ba 111 617.9 112 409 – 380 1110 – –
Cd 0.6 – 0.33 – 0.41 – – 0.13 0.7
Co 25 – – – – – – – 11
Cr 153 120.2 80.7 75.3 17.2 29 392 87 36
Cu 83 111.6 21.9 18 16.3 20 77.8 28.7 28
Ni 170 118.6 48.5 27 9.4 4.6 207 23.5 31
Pb 50 217.5 42.0 50.1 18.1 15 48.8 57.6 28
Sb 6 – 0.79 – – – – – –
V 86 101.2 – 84.2 – – – – –
Zn 86 326.8 29.6 154.7 20.3 12 – 77.8 83
Mo 0.1 – 6.76 – – – – – –
As 19 – 7.01 – 37.0 – – – –
Hg 0.1 – 0.04 – 0.028 – – 0.15 –
Sr – 128.8 – 138.5 – – – – –
Sources: aAlfaro et al. (2015), bBech et al. (2005), cChen et al. (1999), dDudka (1992), eMa et al.
(1997), fGough et al. (1994), gBradford et al. (1996), hZhang et al. (2008) and iMico et al. (2007)
160 7 Assessment of Heavy Metals Contamination in Soil

undertaken in this respect in India. Geochemical distribution as well as baseline
levels of 29 elements were determined in soils of Siddipet, Medak District, Andhra
Pradesh (Dantu 2010). Regional parent materials and pedogenesis were the primary
factors influencing the concentrations of trace elements while anthropogenic activ-
ities had secondary influence. For agricultural soils of Indo-Gangetic plains of
Haryana, Kuhad et al. (1989) determined background levels of some heavy metals
in physiographic zones and found no significant differences among them. However,
investigators did not follow any statistical approach in their methods.
7.2.2 Assessment of Heavy Metal Contamination AroundIndustrial Congregations
While baseline concentration of heavy metals for a specified geographical area is a
useful tool to detect occurrence of contamination due to anthropogenic activities
with a certain degree of confidence, its determination requires systematic collection
and analysis of a large number of samples. Hence, such information is not available
for most of the locations. Several other techniques have also been proposed for
assessing the extent and degree of contamination of heavy metal in and surrounding
area of industrial sites.
7.2.2.1 Enrichment Factor
Enrichment factors (EFs) are commonly used as a means of identifying and
quantifying human interference with global element cycles and are also used to
differentiate trace metals originating from human activities and those from
lithogenic source (parent material) (Blaser et al. 2000; Reimann and de Caritat
2005; Dantu 2009; Karageorgis et al. 2009; Namaghi et al. 2011). Enrichment
factor is calculated using modified formula given by Krzysztof et al. (2004) based
on the equation suggested by Buat-Menard and Cherselet (1979), which is double
ratios of the target metal and a reference metal in the soil and earth’s crust as
indicated below. The reference metal must be one that is overwhelmingly derived
from a single source. Usually, Al, Sc, Ti, Fe Mn and Sr are used as the reference as
these are present in significantly larger concentrations in soil and are not signifi-
cantly altered by anthropogenic activities (Reimann and de Caritat 2000; Suther-
land 2000; Saur and Juste 1994). As an example, EFs can be calculated using Fe as
the reference, with the following relationship:
EF ¼XFe
� �sample
XFe
� �crust
7.2 Concept of Baseline Concentrations of Metals in Soil 161

Where, XFe
� �sample
and XFe
� �crust
refer, respectively, to the ratios of mean concen-
trations (milligrams per kilogram, dry weight) of the target metal (X) and Fe in the
sediments and continental crust. The EFs are calculated on the basis of earth’s crustmean abundance of the elements (Lide 2005).
Five contamination categories are recognized on the basis of the enrichment
factor (Sutherland 2000).
EF ¼< 2 Deficiency to mineral enrichment
EF ¼ 2� 5 Moderate enrichment
EF ¼ 5� 20 Significant enrichment
EF ¼ 20� 40 Very high enrichment
EF ¼> 40 Extremely high enrichment
7.2.2.2 Enrichment Ratios
This is another approach used to characterize degree of anthropogenic pollution in
soil. Originally, enrichment ratio (ER) based assessment approach was used by
Chester et al. (1985) and is computed as below:
ERext ¼ Cn Sample
μnBack þ 2� σð Þ
where ‘ERext’ is the enrichment ratio for a given extraction for a given element, ‘Cn
Sample’ represents the concentration of a given element ‘n’ in sample under
investigation, ‘μn Back’ represents the mean concentration of the element ‘n’ inthe background soil samples, and ‘σ’ is standard deviation for concentration of the
element ‘n’ in the background soil samples. The method of extraction may be for
total content or for more labile fraction of metals by acid, EDTA etc.
Sutherland (2000) used ‘Median’ and ‘Median absolute deviation (MAD)’ inplace of ‘Mean’ and ‘standard deviation (σ)’ for the background samples and
computed enrichment ratio ERext as below:
ERext ¼ Cn Sample
MediannBack þ 2�MADnð Þ
Median absolute deviation (MAD) is calculated as:
MAD ¼ median Xi � median Xð Þj jð Þ
Above equation had been indicated as more robust as it overcomes the problem of
positive skewness commonly encountered with geochemical data. Values of
ERext> 1 reflect a potential anthropogenic input above the background geogenic
162 7 Assessment of Heavy Metals Contamination in Soil

variation. Using this method, Sutherland et al. (2000) found enrichment ratios for
EDTA-extractable Pb� 11.5 in one-fourth of 169 roadside soil samples.
7.2.2.3 Contamination Index
Assessment of soil contamination is also performed by the contamination index (Pi)
and integrated contamination index (Pc) as suggested by Huang (1987), and is
expressed by the fuzzy functions given below:
Pi ¼ Ci
Xa: . . . . . . if Ci � Xa
Pi ¼ 1þ Ci � Xa
Xb � Xa. . . IfXa < Ci � Xb
Pi ¼ 2þ Ci � Xb
Xc � Xb. . . IfXb < Ci � Xc
Pi ¼ 3þ Ci � Xc
Xc � Xb. . . IfCi > Xc
Where,
Ci is the observed concentration of heavy metal in the soil sample;
Xa is the no-polluted threshold concentration of heavy metal;
Xb is the lowly polluted threshold concentration of heavy metal;
Xc is the highly polluted threshold concentration of heavy metal.
Xa, Xb and Xc in the above functions have been defined according to Class I, Class
II, and Class III criteria (Table 7.3), respectively, based on Chinese Environ-
mental Quality Standard for Soils (GB 15618-1995) (SEPAC 1995). Class I
criteria were suitable to keep natural background values, and Class II could be
used as the threshold values for protecting human health, while Class III could
be used as the threshold values for plant growth.
7.2.2.4 Integrated Contamination Index
Integrated contamination index (Pc) for each site is defined as the summation of the
difference between the contamination index (Pi) for each metal and 1 (one) and is
calculated by the following formula:
Table 7.3 Threshold values (mg kg�1) for contamination index
Threshold concentrations Zn Cd Pb Ni Cu As
Xa 100 0.2 35 40 35 15
Xb 200 0.3 250 60 50 30
Xc 500 1.0 500 200 400 40
SEPAC (1995)
7.2 Concept of Baseline Concentrations of Metals in Soil 163

Pc ¼Xi¼1
n
Pi � 1ð Þ
Average and standard deviation values of Pc were used to establish confidence
intervals. Accordingly, a Pc � distance curve was adjusted using a log scale for real
distance. Values of contamination index (Pi) and integrated contamination index
(Pc) have been interpreted as below in the Table 7.4.
7.2.2.5 Geo-accumulation Index
Index of geo-accumulation (Igeo) enables the assessment of contamination by
comparing current and pre-industrial concentrations. Background concentration
of heavy metals in the earth’s crust was used as a reference value implicating
pre-industrial environment. This is calculated using below equation:
Igeo ¼ log2Cn
1:5Bn
where, Cn denoted the concentration of a given element in the soil tested, while Bn
denoted the concentration of elements in the earth’s crust (Taylor and McLennan
1995). The metal content accepted as background was multiplied each time by the
constant 1.5 in order to take into account natural fluctuations of a given substance in
the environment as well as very small anthropogenic influence.
Descriptive classification for the index of geo-accumulation (Igeo) is given in
Table 7.5.
7.2.2.6 Nemerow’s Pollution Index (Pn)
Geo-Accumulation Index is suitable for the evaluation of soil heavy metal contam-
ination in industrial and mining affected areas. However, it is only applicable for
assessing the impact of single heavy metal contaminant; and therefore, this index
Table 7.4 Limits for contamination indices
Contamination level Contamination index (Pi) Integrated contamination index (Pc)
No Pi� 1 Pc� 0
Low 1�Pi� 2 0<Pc� 7
Moderate 2�Pi� 3 7<Pc� 21
High Pi> 3 Pc> 21
164 7 Assessment of Heavy Metals Contamination in Soil

cannot provide a comprehensive description of the contamination status of the
study area. Nemerow’s pollution index was applied to assess degree of soil eco-
system pollution and integrative assessment of soil ecosystem quality (Jie-liang
et al. 2007; Guan et al. 2014). The method can be described as below:
Pn ¼ffiffiffiffiffiffiffiffiffiffiffiffiffiffiffiffiffiffiffiffiffiffiffiffiffiffiffiffiffiffiffiffiffiffiffiffiffiffiffiffiffiMaxP2
i þ AveP2i
� �=2
q
where,
Pi ¼ Ci
Si
Pn is the Nemerow’s pollution index, Pi is the pollution index of the ith heavy metal,
Ci is the measured concentration of the ith heavy metal, Si is the required standard
of the ith heavy metal, AvePi and MaxPi is the average and the maximum value of
the pollution indices of all heavy metals respectively. Higher value for Pn indicates
more serious pollution. The soil quality classification criterions based on
Nemerow’s Pollution index is indicated in Table 7.6.
Guan et al. (2014) modified the above traditional Nemerow’s Pollution index byreplacing the single factor index with Igeo as per following equation:
Pn ¼ffiffiffiffiffiffiffiffiffiffiffiffiffiffiffiffiffiffiffiffiffiffiffiffiffiffiffiffiffiffiffiffiffiffiffiffiffiffiffiffiffiI2geomax þ I2geoave
� �=2
r
where, Igeomax is the maximum Igeo value and Igeoave is the arithmetic mean value
of Igeo.
Table 7.5 Interpretation of geo-accumulation index values
Class Igeovalue Interpretation
0 Igeo< 0 practically uncontaminated
1 0< Igeo< 1 uncontaminated to moderately contaminated
2 1< Igeo< 2 moderately contaminated
3 2< Igeo< 3 moderate to strongly contaminated
4 3< Igeo< 4 strongly contaminated
5 4< Igeo< 5 strongly to very strongly contaminated
6 5< Igeo very strongly contaminated
Forstner (1990)
Table 7.6 Classification of
contaminated sites based on
Nemerow’s Pollution index
Class Nemerow’s pollution index Interpretation
1 Pn� 0.7 Unpolluted
2 0.7< Pn� 1.0 Marginally polluted
3 1.0< Pn� 2.0 Slightly polluted
4 2.0< Pn� 3.0 Moderately polluted
5 Pn> 3.0 Severely polluted
Jie-liang et al. (2007)
7.2 Concept of Baseline Concentrations of Metals in Soil 165

They proposed classification on soil quality based on the pollution index values
as:
Class Nemerow’s pollution index Interpretation
0 0<Pn� 0.5 Uncontaminated
1 0.5<Pn� 1 Uncontaminated to moderately contaminated
2 1<Pn� 2 Moderately contaminated
3 2<Pn� 3 Moderately to heavily contaminated
4 3<Pn� 4 Heavily contaminated
5 4<Pn� 5 Heavily to extremely contaminated
6 Pn> 5 Extremely contaminated
7.2.2.7 Contamination Factor
Hakanson (1980) proposed an overall indicator of contamination by integrating
data for several heavy metals under study. This method is based on the calculation
of a contamination factor (Cif ) for each pollutant. The Ci
f is the ratio obtained by
dividing the mean concentration of each metal in the soil (Ci0�1) by the baseline or
background value (concentration in unpolluted soil, Cin) as below.
Cif ¼
Ci0�1
Cin
where,Ci0�1 is the mean content of metals from at least five sampling sites and Ci
n is
the pre-industrial concentration of individual metal. Based on Cif value for the
specified element, four classes contamination levels are specified (Hakanson 1980).
Major limitation of this method is that information on pre-industrial level of heavy
metals concentration in soil is a prerequisite for determining contamination levels.
This method was originally developed for contamination assessment for sediments,
where bottom sediment was considered for assessing Cin. However, in absence of
data on pre-industrial heavy metal concentration for the site, upper value of baseline
concentration range can be taken as Cin. Researchers have also considered the
concentration of elements in the Earth’s crust as a reference value (Loska et al.
2004).
Hakanson (1980) categorized contaminated soils into four classes based on
contamination factor values as below.
Cif < 1 Low contamination
1 � Cif < 3 Moderate contamination
3 � Cif < 6 High contamination
6 � Cif
Very high contamination
166 7 Assessment of Heavy Metals Contamination in Soil

The calculated value of the contamination degree can be used for describing the
role of an element in the global contamination of the reservoir by determining the
proportion of a given element in the contamination (Hakanson 1980; Hakanson and
Jansson 1983).
7.2.2.8 Contamination Degree
TheCif is the index of single element ‘i’ and the addition of contamination factors of
all elements examined, describe the contamination degree (Cdeg) of the
environment.
Cdeg ¼Xni¼0
Cif
Based on Cdeg values, following four levels of contamination were recognized by
Hakanson (1980). However, such categorization is dependent on number of con-
taminants considered in the study.
Cdeg< 8 Low degree of contamination
8�Cdeg< 16 Moderate degree of contamination
16�Cdeg< 32 Considerable degree of contamination
32�Cdeg Very high degree of contamination
7.2.2.9 Pollution Load Index
Each sampling site can be evaluated for the extent of the metal pollution by
employing the method based on the pollution load index (PLI) developed by
Tomlinson et al. (1980) as below:
PLI ¼ C1f∗C2
f∗C3f∗ . . . . . . . . .∗Cn
f
� �1=n
where n is the number of metals studied and Cnf is contamination factor for nth
element as mentioned above. The PLI provides simple but comparative means for
assessing a site quality, where a value of PLI< 1 indicate uncontaminated site;
PLI¼ 1 present that pollutants are present only at baseline level and PLI> 1 would
indicate deterioration of site quality (Thomilson et al. 1980).
7.2 Concept of Baseline Concentrations of Metals in Soil 167

7.3 Assessment of Risks to Organisms Due to Heavy Metals
Contamination in Soils
Soil analysis for heavy metals and their interpretation using above tools may
indicate occurrence of contamination, its degree, spatial distribution and probable
source. Such information has been extensively used in taking precautionary steps
for the purpose protecting land resources. However, availability of heavy metals to
organisms is not necessarily dependent on total contamination level. Chemical
properties of metals as well as soil constituent and their interactions reflect on the
transfer/availability to organisms. In order to have proper assessment of risks to
organisms including plants and human health, several techniques have been devel-
oped for assessing the risk from contaminated sites as described below.
7.3.1 Soil–Plant Partition Coefficient or Transfer Factor
Heavy metal transfer from soil to plants can be calculated by soil–plant partition
coefficients. This parameter has been used during screening crops suitable for
growing in contaminated land as well as for screening accumulator plants during
phytoremediation. The heavy metal transfer from soil to plant can be quantitatively
estimated by soil–plant Partition Coefficient or Transfer Factor (TF) which is
concentration Ratio as below (Hope 1995; Roca and Vallejo 1995; Dinelli and
Lombini 1996; Rodriguez et al. 2002; Tome et al. 2003).
TF ¼ Cplant
Csoil
where, Cplant and Csoil are the plant and soil concentrations of heavy metal,
respectively. A prerequisite of the soil–plant transfer factor concept is the presence
of a statistically significant relationship between the content of a given element in
the soil and that in the plant (Bunzl et al. 2000). Such values are needed for many
assessment models to predict the concentration of an element for a given plant
species at an anticipated contamination level in the soil (Bunzl et al. 2000). Transfer
factor (TF) describes the amount of an element expected to enter a plant from its
substrate, under equilibrium conditions (Sheppard and Sheppard 1985; Davis et al.
1999). The index value above one indicates the plants as accumulators; the value
around one indicates a rather undistinguished their behavior towards these metals
and lower than one show the plants as excluders. This computation assumes a linear
relationship between the concentrations of a certain element in the plant with that in
the soil. This linearity does not hold for essential elements (the content of which is
under strict metabolic control), but does apply to non-essential elements and
pollutants within certain range.
168 7 Assessment of Heavy Metals Contamination in Soil

7.3.2 Bioaccumulation Factor (BAF)
One of the major drawbacks of above-mentioned transfer factor is that it expresses
metal transfer in a certain condition i.e. at one place, at the same time and under the
same circumstances. But it does not incorporate the variation in such metal transfer
behaviour in treated site compared to the control site. To overcome this, Baltrenaite
et al. (2012) introduced following dynamic factors, where natural processes affect-
ing metal transfer are integrated in the factor calculation.
7.3.2.1 Dynamic Factor of Metal Bioaccumulation (BAdyn)
Dynamic factor of metal bioaccumulation reflects the physiological sensitivity of
plants to the general soil contamination degree and is calculated as:
BAdyn ¼ CContamPlant
CContamSoil� CControlSoil
CControlPlant
where,
CContamPlant¼ total concentration of a metal in plant (root þ shoot) growing on
contaminated agricultural soil;
CContamSoil¼ total concentration of the metal in contaminated agricultural soil;
CControlSoil¼ total concentration of metal in the control soil; and
CControlPlant¼ total concentration of the metal in the plant (rootþshoot) growing on
control soil.
7.3.2.2 Dynamic Factor of Metal Biophilicity
Dynamic factor of metal biophilicity reflects changes in metal participation in plant
metabolism. Generally, metal biophilicity is the ratio of metal accumulation in
living biomass and metal concentration in the Earth’s crust. This indicates metal
involvement in the metabolism in vegetation on the global basis. Dynamic factor of
metal bilophicity (BFdyn) was calculated using following equation:
BFdyn ¼ BFcontam
BFcontrol¼ CContamPlant
CEarthCrust� CEarthCrust
CControlPlant¼ CContamPlant
CControlPlant
where, BFcontam and BFcontrol are the biophilicities of a metal on contaminated and
control sites, respectively; CEarthCrust is the concentration of the metal in the Earth’scrust and CContamPlant and CControlPlant are the concentrations of the metal in plant
biomass on the contaminated and control sites, respectively.
7.3 Assessment of Risks to Organisms Due to Heavy Metals Contamination in Soils 169

7.3.2.3 Dynamic Factor of Metal Translocation (TRdyn)
Dynamic translocation factor (TRdyn) of metals is calculated as:
TRdyn ¼ TRContam
TRControl¼ CContamShoot
CContamRoot� CControlRoot
CControlShoot
where,
TRContam is the translocation factor of a metal in plant on the contaminated site;
TRControl is the translocation factor in plant on the control site;
CContamShoot is total concentration of the metal in plant shoot growing on contam-
inated agricultural soil;
CContamRoot is total concentration of metal in plant root growing on contaminated
agricultural soil;
CControlRoot is total concentration of metal in the plant root growing on control soil;
CControlShoot is total concentration of metal in the plant shoot growing on
control soil.
7.3.2.4 Assessment of Phytoremediation Potential of Plant
To evaluate the phytoextraction/ phytostabilization potential of the plant species,
the following factors were calculated using the following formulae:
Bioabsorption Coefficient BAC½ � ¼ metal content in shoot
metal content in soil
Bioconcentration Factor BCF½ � ¼ metal content in root
metal content in soil
Translocation Factor TF½ � ¼ metal content in shoot
metal content in root
This criteria were used to classify plants as phytoextractors and phytostabilizers
as in Table 7.7. Higher ratios of BAC and TF indicate better phytoextraction
potential of plants.
Dynamic factor of phytoremediation (FRdyn) reflects phytoremediation capabil-
ity of a plant and its changes with time. Dynamic factor of phytoremediation
(FRdyn) is calculated using following equation:
FRdyn ¼ FRContam
FRControl
where, FRContam and FRControl are the annual phytoremediation effectiveness fac-
tors of plant on the contaminated and control sites, respectively. In the case of a
specific metal and a specific tree, they are calculated using equation:
170 7 Assessment of Heavy Metals Contamination in Soil

FRi ¼ Ci�plant � B
1000� Ci�soil � ρ� d
where FRi is the annual metal phytoremediation factor (in kg ha�1); Ci� plant is the
metal concentration in tree (in mg kg�1); B is the annual tree increment (in kg ha�1);
Ci� soil is the metal concentration in root zone soil layer (in mg kg�1); ρ is the soil
bulk density (in g cm�3); and d is the depth of root zone soil layer (cm).
7.4 Risk Assessment for Contaminated Soil on Human
Health
Heavy metals in soil pose potential threats to the environment and can damage
human health through various absorption pathways such as direct ingestion, dermal
contact, and food. The human health risk models proposed by USEPA have been
adopted worldwide. The model pertaining to health risk from polluted soil is
summarized by Liu et al. (2013) as below:
Exposure pathway: Soil-ingestion (I)
CDII ¼ CS� IRS� EF� ED
BW � AT� CF
Exposure pathway: Dermal contact (D)
CDID ¼ CS� SA� AF� ABS� EF� ED
BW � AT� CF
Exposure pathway: Food (F)
CDIF ¼ CF� IRF� EF� ED
BW � AT
CDI ¼ chronic daily intake (mg kg�1 d�1); CS ¼ exposure-point concentration
(mg/kg); EF ¼ exposure frequency (day/year); ED ¼ exposure duration (year); AT
¼ averaging time (day); BW ¼ body weight (kg); SA ¼ exposed skin area (cm2);
AF ¼ adherence factor (mg cm�2); ABS ¼ dermal absorption fraction; CF¼ unit’s
Table 7.7 Criteria for assessment of phytoremediation potential of plants
Phytoremediation potential BAC BCF TF
Good phytoextractor (Fitz and Wenzel, 2002) >1 – >1
Good phytostabiliser (Mendez and Maier, 2008) – >1 <1
7.4 Risk Assessment for Contaminated Soil on Human Health 171

conversion factor (10�6 kg mg�1); IRS ¼ ingestion rate of soil (mg d�1); IRF ¼ingestion rate of food (kg d�1).
Cancer risk can be evaluated using the equation:
Cancer risk ¼X n
k¼1CDIk � SFk
The non-carcinogenic risk from individual heavy metals can be expressed as the
chronic hazard index (HI):
Chronic hazard index HIð Þ ¼Xn
k¼1CDIk � RFDk
where the chronic hazard index (HI) is the sum of more than one hazard quotient for
multiple substances or multiple exposure pathways, CDIk is the daily intake of the
heavy metal ‘k’, SF is the slope factor of hazardous substances (mg kg�1 d�1) and
RFDk is the chronic reference dose (mg kg�1 d�1) for the heavy metal ‘k’. HI values> 1 indicates that there is a chance of non-carcinogenic risk to occur, and when
HI< 1 the reverse applies. Using above method of risk assessment, arable fields
near industrial and waste mining sites in Zhejiang province of Southeast China were
found unsuitable for growing leafy and root vegetables in view of the risk of
elevated intake of heavy metals (Liu et al. 2013). Chromium and Pb were the
primary heavy metals posing non-cancer risks while Cd caused the greatest cancer
risk among local residents.
7.4.1 Human Health Risk Assessment for Heavy Metals fromContaminated Food
Risk to human health (Hazard Quotient, HQ) for intake of heavy metals through
consumption of vegetables grown on sewage-irrigated soils is also calculated using
the following relationship (Pierzynski et al. 2000):
HQgv ¼add
RfD
where, ‘HQgv’ is the hazard quotient to a human from consumption of green
vegetables, ‘add’ is the average daily dose (mg metal/kg body-weight/day) and ‘RfD’ is the reference dose.
Average daily dose (add) is computed as below:
add ¼ mc� cf � di
dw
172 7 Assessment of Heavy Metals Contamination in Soil

where, ‘mc’ is the metal concentrations in plant (mg kg�1) on dry weight basis, ‘cf’the fresh to dry weight conversion factor, ‘di’ the daily intake of green vegetable
(kg) and ‘bw’ the body weight (kg). A reference dose corresponds to the maximum
amount of a metal that can safely be consumed per day, per kilogram of body
weight. Integrated Risk Information System of United States Environmental Pro-
tection Agency (IRIS 2016) computed reference doses as 0.001 mg kg–1 d–1 for Cd;
0.035 mg kg–1 d–1 for Pb; 0.3 mg kg–1 d–1 for Zn; and 0.04 mg kg–1 d–1 for Cu. If
HQ is greater than 1, then the add of that particular metal exceeds the RfD,
indicating that there is a potential risk associated with consumption of food
containing that metal.
7.5 Regulation in Respect of Heavy Metals Entry into
the Agricultural Land
Life forms that have evolved through millions of years in metallic stress free
environment are facing threat in the present times from heavy metal contaminated
ecosystem. These metals in soil are known to affect environment in several ways:
contamination of food through plants grown on it, decrease in crop productivity
(Rooney et al. 2007) and depression of soil microbial activity (Brookes and
McGrath, 1984; Chaudri et al. 1993; McGrath 1993, Akerblom et al. 2007). Oral
intake of heavy metals through contaminated food for long duration is found to
affect human and animal health adversely (ATSDR 2005; USEPA 2005a, b).
Because of the potential threats from different pollution activities, many countries
have set regulatory limits in respect of heavy metals in order to protect agricultural
land; and such limits are based on (1) maximum concentrations in soils that can be
allowed to receive further metal inputs, (2) annual pollutant loading limits into the soil
from all the sources, (3) cumulative pollutant loading limits, (4) maximum allowed
concentration of metals in amendment materials (like composts prepared from MSW
or sewage-sludge) (McGrath et al. 1994). Different approaches of risk assessment are
shown to result in widely differing numerical limits being set for the same constituent,
which creates confusion among the regulatory authorities worldwide.
7.5.1 Heavy Metal Loading Limits in Soil
Different member countries of the European community, as well as the USA, have
implemented laws to limit the load of pollutants via sewage sludge or compost
application onto the soil. These include limit values for heavy metal concentrations
in the soil to which sludge or compost is applied, in the sludge or compost material
itself, and all maximum cumulative and annual quantities of heavy metals added to
agricultural soils. The maximum permitted concentrations in agricultural soils varied
from 1.5 to 20 mg kg�1 for Cd, 50 to 1500 mg kg�1 for Cr, 30 to 750 mg kg�1 for Cu,
7.5 Regulation in Respect of Heavy Metals Entry into the Agricultural Land 173

20 to 210 mg kg�1 for Ni, 20 to 2000 mg kg�1 for Pb, 100 to 1400 mg kg�1 for Zn,
2 to 50 mg kg�1 for As and 1 to 8 mg kg�1 for Hg (Table 7.8). Such wide variations
probably result from different approaches adopted by the countries while setting the
limit values, such as: (i) a comprehensive analysis of the pathways of pollutant
transfer to selected target organisms and an assessment of the likely harmful effects
that metals may have on their targets; (ii) setting limits consistent with the lowest
observed effect concentrations reported in various toxicity studies, and (iii) the metal
balance approach via the adjustment of allowable metal inputs against small losses of
metals due to crop removal, soil erosion, and leaching (McGrath et al. 1994). In
developing countries like India, sufficient information has not been compiled to set
limit values based on the analysis of pollutant transfer pathways. On the other hand,
setting limits based on the metal balance approach does not seem to be a viable
strategy in India because of significant non-point source metal inputs as well as
significant metal content in organic and inorganic fertilizers.
Due to such divergent approaches, wide differences in regulatory limiting values
have been observed among different countries. For example, maximum concentra-
tions of metal allowed in agricultural land treated with sewage-sludge by USA and
EU countries differ by large factors; �40 for Cd, �19 for Cu, �50 for Cr, �14 for
Ni, �13 for Pb, �14 for Zn, �40 for Hg (McGrath et al. 1994).
7.5.2 USEPA Approach of Calculating Loading Limitsof Heavy Metals
In order to appreciate the potential for widely varying estimates of an acceptable
soil loading of heavy metals, it is necessary to look at the various factors that
potentially affect this loading. USEPA calculated the estimated tolerable soil
loading limit for heavy metals through the following steps.
Table 7.8 Maximum allowable concentration of trace elements in soils of various countries
(mg kg�1)
Country Cd Cr Cu Ni Pb Zn As Hg
Austria 5 100 100 100 100 300 50 5
Poland 1–3 50–80 30–70 30–75 70–150 100–300 30 5
Germany 1.5 100 60 50 100 200 20 1
Russia – 0.05
(Cr6+)
23 (soluble
pool)
35 20 110 2 2.1
U.K 3–15 – 50 20 500–2000 130 10 –
U.S 20 1500 750 210 150 1400 – 8
European
Commission
1–3 50–150 50–140 30–75 50–300 150–300 – 1–1.5
Adopted from (Kabata-Pendias 2000)
174 7 Assessment of Heavy Metals Contamination in Soil

Step 1
Total background intake (TBI, mg day�1) of a heavy metal is determined by the
equation:
TBI ¼ DI þ AC� IVð Þ þ WC�WVð Þ
where,
DI¼ daily dietary intake of the metal (mg day�1).
AC¼ concentration of the metal in air (mg m�3).
IV¼ daily inhalation volume (m3 day�1).
WC¼ concentration of the metal in drinking water (mg L�1).
WV¼ daily volume of water consumption (L day�1).
Step 2
Adjusted daily reference intake (RIA, (μg day�1) is determined by the equation:
RIA ¼ RfD� BW
RE
� �� TBI
� 103
Where,
RfD¼ reference dose of the heavy metal, i.e., the daily exposure which over a
lifetime is likely to be without “appreciable” risk.
BW¼ body weight (kg).
RE¼ relative effectiveness of ingestion exposure to the metal (unitless).
Step 3
Reference cumulative soil application rate (RP, kg ha�1) of the heavy metal is
determined by following equation:
RP ¼ RIAPUCi � DCi � FCið Þ
Where,
UCi¼ uptake response slope of crop group ‘i’ for the heavy metal M (μg M g�1
plant dry weight)/ (kg M applied ha�1).
DCi¼ daily dietary consumption of crop group ‘i’ (g dry weight day�1).
FCi¼ fraction of crop group ‘i’ grown on sludge-amended soil (unit-less).
Uncertainties, errors and biases in the estimates of crop uptake coefficients (UC),
vegetable consumption (DC), and other variables in equation above compound the
uncertainty inherent in the final heavy metal loading estimate (RP). Thus, USEPA’s
7.5 Regulation in Respect of Heavy Metals Entry into the Agricultural Land 175

final estimate of acceptable metal loading (RP) has an undefined but presumably
high degree of uncertainty.
Calculating Heavy Metals Update Coefficients for Leafy Vegetables: The
USEPA 503 risk assessment for dietary exposure to heavy metal from leafy
vegetables grown on sewage sludge-amended soil was based on a single uptake
coefficient (UC) averaged from numerous field uptake experiments. The individual
vegetable and soil loading data for Cd are tabulated in the technical support
document (USEPA 1992). In addition, to determine a single UC for experimental
crop uptake data with more than one Cd application rate, USEPA applied a linear
best-fit function to the relationship between crop Cd concentration (y -axis) and Cdloading to the soil (x -axis).
7.5.3 Determination of Maximum Safe Concentration Limitsof Heavy Metals Based on Sensitive Scenario
Risk based approach for regulatory guideline is normally adopted based on suffi-
cient information to assess the risk adequately and establish thresholds below which
it is considered to be negligible or acceptable. In India, requisite research to
establish cumulative loading limit for toxic metals for soils is lacking. Due to
variability in parent materials as well as climatic conditions, wide range of soil
types is found in India and hence, wide variability in their heavy metal
immobilizing capacity is expected owing to differences in their constituents and
properties. Such wide variation in metal immobilizing capacity may lead to wide
variation in protective limits in Indian soils. Saha et al. (2013) determined maximal
protective concentration limits of heavy metals in a soil which was acidic in nature
and contained lower levels of clay, organic matter, oxides of Fe and low CEC. All
of these soil characteristics are associated with a lower metal immobilization
capacity (McBride 1994). Hence, the maximal concentration limits determined
for heavy metals in such a sensitive agro-ecosystem was assumed to protect
agricultural land from heavy metal contamination in all other agro-ecological
situations as well. Three different approaches, namely, ‘phytotoxicity’, ‘food con-
tamination,’ and ‘soil microbial activity diminution’ were used for determination of
these limits.
Phytotoxicity Threshold Concentration of Heavy Metals in Soil: These were
measured in terms of its level in the soil at which a plant experiences 20% growth
retardation (PT20).
Threshold Concentration of Heavy Metals in Soil Based on Food Contamina-tion: These were defined as the maximum amount of heavy metal concentrations
in the soil, which do not increase their concentrations in the edible food crop above
176 7 Assessment of Heavy Metals Contamination in Soil

the background level (i.e., concentration range found in the crop grown in
uncontaminated area). The upper limit of background metal concentration (Cul)
was calculated as:
Cul ¼ �xþ 3σ
Where, �x is the mean value of metal concentration in spinach leaf in control
(no metal) treatment of the experiment and 3σ is standard deviation of the metal
concentrations in spinach leaf from farmers’ fields.
Maximum safe concentration level of metal in soil ¼ Cul
UR
Uptake response slope (UR) was calculated for the best fit regression line (passing
through origin) obtained for soil-metal level (‘x’ axis) and leaf metal level (‘y’ axis).
Threshold Concentration of Heavy Metals in Soil Based on Impact on MicrobialActivity: It is the heavy metal concentration in soil (ED20), where the microbial
mediated processes are inhibited by 20% (Doelman and Haanstra 1989; Kostov and
Van 2001). All the biochemical reactions are catalyzed by enzymes (Tabatabai
1982), and depending on their nature and level of contamination, many heavy
metals have been found to impede soil enzyme activities to different extents
(Tyler 1981; Kuperman and Carreiro 1997; Yang et al. 2006). Assays of enzyme
activities are considered to be important in assessing the impact of metal pollution
on the soil environment (Tyler 1981; Kuperman and Carreiro 1997). From best-fit
lines plotted for enzymatic activity vs. soil metal concentrations, soil heavy metal
level with respect to 20% inhibition of enzyme activity is computed.
The levels of all the heavy metals in soil, corresponding to 20% decrease in
biomass growth were found higher than the limiting levels calculated with the help
of biochemical and food chain contamination approaches (Table 7.9). Thus, adverse
effects on microbial activity and contamination of the food chain by heavy metals
occurredmuch earlier than their adverse effects on plant growth. As the lowest among
these maximal concentration limits determined by using the above three different
approaches can protect all target organisms, 0.33 mg kg�1 Cd, 31 mg kg�1 Cr,
179 mg kg�1 Cu, 30.7 mg kg�1 Ni, 81 mg kg�1Pb, and 392 mg kg�1 Zn
Table 7.9 Maximum safe
concentration limits of heavy
metals in soil determined by
various methods
Metal PT20 Food contamination ED20
Cd 17.8 0.33 9.5
Cr 176.4 82.5 31.0
Cu 409 189.3 179
Ni 153 29.5 51.1
Pb – 73.7 81.0
Zn 852 32.3 392
Saha et al. (2013)
7.5 Regulation in Respect of Heavy Metals Entry into the Agricultural Land 177

was considered to be maximal safe concentration limits for these heavy metals
in soil.
Maximum concentration limits determined in the above study for Zn and Cu in
the soil were comparable to the limits set by France, Italy, and the UK, but were
about four fold higher than the limits set by Sweden and Denmark. Limit values
determined for Pb and Ni in this study were comparable to those set by many EU
countries. The maximal concentration limit of Cr in the soil was almost similar to
the limits set by Denmark and Sweden and was much lower than the limits set by
other EU countries. In Sweden, the soil management policy of ‘no accumulation of
possibly hazardous elements in soil’ has led to very low values of ‘maximal
allowable metal concentration’ levels. Maximal soil concentration limits for Cd
set by all the EU countries (0.5–3 mg kg�1 Cd) were higher than the value
determined in this study. The limit values determined for all the heavy metals in
this study were found to be considerably lower than the corresponding limit values
set by the USA. Due to the variability in parent materials and climatic conditions, a
wide range of soil types is found in India, and hence, wide variations in their heavy
metal-immobilizing capacity are expected due to the differences in their constitu-
ents and properties. Although considerable information is available for the physical
and chemical characteristics of different soil series/types (Bhattacharyya et al.
2013), information in respect to safe concentration limits of metals are absent in
other soil types of India.
7.6 Soil Testing for Heavy Metal Contaminated Land
While soil analysis for total heavy metal content may indicate their accumulation or
contamination, it does not indicate whether their levels can pose any risk to
different components of the ecosystem. Toxicity of any metal in the soil essentially
depends upon the readiness with which it is transferred to the targeted organisms.
Such ease of transferability of metals normally depends upon the constituents and
chemical environment of the soil, besides the total content. With increasing evi-
dence of heavy metal pollution in soils worldwide, there is growing demand for
methods to assess metal toxicity for the purpose of risk assessment before taking
corrective measures if required. In most countries, risks to human health from the
soil contamination are based on total concentrations of metals in soil and on the data
obtained from exposure pathway (Chaney and Ryan 1994).
7.6.1 Factors Influencing Phytoavailability of Heavy Metals
While many researchers have tried to develop relationships between concentrations
of metals in soils /plants and effects on plants or organisms or human, it is perhaps
important to first characterize the major risk pathways for the metals of concern.
178 7 Assessment of Heavy Metals Contamination in Soil

7.6.1.1 Absorption of Heavy Metals by Plant Roots
Like toxic heavy metals and trace elements, essential micronutrients are also
present in very low concentration in soil. Using phytochelates, plant-induced pH
changes and redox changes in rhizosphere, roots are able to solubilize and take up
micronutrients from nearly insoluble precipitates. Plant absorbs these essential
nutrients through ion channel or active transport systems. On the other hand,
non-essential trace metals are either transported across the root membrane as
substitute for nutrients through the same transport mechanisms or through breaks
in the endodermal barrier at sites of lateral root initiation/ apices (McLaughlin et al.
1998). Roots mostly take up heavy metal from soil via soil solution. Further
absorption of heavy metal by plant roots are highly related to their free ion activity
in the soil solution (Parker and Pedler 1997). Also complexation of metals with
inorganic ligands in soil can increase plant uptake of metals. For example, uptake of
Cd is enhanced in soil by Cl salinity through the formation of CdCln2� n complexes
(Smolders and Mc Laughlin 1996). Thus Cl concentration in soil solution (hence
salinity) affects the interpretation of soil solution Cd concentration results for
predicting its phytoavailability.
7.6.1.2 Soil and Plant Factors Influencing Phytoavailability of Heavy
Metals
Soil constituents provide binding sites for heavy metals present in the soil which
maintains equilibrium with soil solution. Solubility of different heavy metals
depends on their affinity to:
(a) Complex with soluble humic substances.
(b) Chemisorb on soil minerals (e.g. Clays, oxides)
(c) Precipitate as insoluble sulfides, carbonates, phosphates or oxides.
(d) Co-precipitate in other minerals.
Owing to the variation in above chemicals properties among different soil types,
concentrations of different heavy metals in soil solution vary widely at similar
contamination levels.
Soil pH has tremendous influence on trace elements concentration in soil
solution through quantity of variable charge sites available for sorption of metals.
Generally metal sorption to soil particles is low at low pH and increases as soil pH
increases due to increase in negatively charged sites. However, sorption of some
metalloids for oxyanion (e.g. CrO4�2 and AsO4
�3) is high at low soil pH and
therefore their concentration in soil solution decreases with reduction in pH
(i.e. in acidic soil) (McLaughlin et al. 1998).
Expression of toxicity to plant and contamination of food-chain due to heavy
metals depend on their nature, mobility, levels as well as properties of soil. While
Cd, Cr(VI) and Cu are relatively more phytotoxic, Cd and Zn are mobile and have
7.6 Soil Testing for Heavy Metal Contaminated Land 179

potential to contaminate food chain due to higher bioaccumulation factor
(Zn contamination is many a times preferred in underdeveloped and developing
countries due to its essentiality in human/animal physiology). Soils have varying
capacity to immobilize metals (through sorption, transformation, precipitation) due
to variable types and contents of clay, organic matter, oxides, carbonates, phos-
phates, sulphides etc. along with chemical conditions (pH and Eh) prevailing in it
and therefore, tolerable level for metals depends considerably on soil properties
(Fig. 7.3).
Beside pH, following soil properties also influence sorption of metals and hence,
their concentration in soil solution:
• Soluble organic and inorganic ligands: changes metal speciation and their
charge.
• Ionic strength of soil solution: enhances competition for sorption sites.
• Redox potential: Controls reactivity of Fe and Mn oxides, chemical speciation of
As, Cr and Se.
Growing plant can also influence heavy metal solubility (hence
phytoavailablity). About 70% of C transferred from shoots to roots is estimated
to be exerted as exudates in the soil. Such exudates influence soil solution compo-
sition by increasing solubility of minerals, modifying sorption sites (for metals),
changing speciation of metals (Mc Laughlin et al. 1998), and changing solution pH.
0
0.5
1
1.5
2
2.5
3
3.5
4
10% 30% 10% 30% Clay
5 7
Cd (m
g/kg
soi
l)
pH and clay content in soil
Org. Matter: < 1%
Org. Matter: 3%
pH
Fig. 7.3 Tolerable level of Cd as influenced by pH, clay and organic matter contents of soil
(Adapted from Kloke et al. 1984)
180 7 Assessment of Heavy Metals Contamination in Soil

7.6.2 Soil Testing for Heavy Metals
Soil testing methods have traditionally been developed and used for assessing the
status for nutrients available to plants (i.e. soil fertility) for more than 40 years and
for recommending fertilizer application rates for crops and cropping systems.
However, there are several special consideration for assessment of hazards due to
heavy metal contamination (McLaughlin et al. 2000), including the examination of
effects on different components of the environment like humans, animals, plants
and microorganisms. Although extensive researches have been conducted in India
on soil testing for fertilizer recommendation under All India Coordinated Research
Project on Soil Test Crop Response (STCR 2016), practically, no research effort
has been carried out for developing soil testing methods for Indian soils.
7.6.2.1 Desirable Characteristics of Soil Test Methods
McLaughlin et al. (1999) suggested a number of criteria that should be applied to
any soil test to diagnose or predict risks from soil contamination by heavy metals
which are as below:
• Soil test should be simple, inexpensive and robust.
• It should have been developed and calibrated under field conditions across a
wide range of soil types.
• It should have been validated independently at different soil types.
• It should account for the major environmental factors known to affect crop metal
concentrations and toxic response to plants or organisms.
• It should be for prognosis (i.e. truly predictive).
7.6.2.2 Extractants for Soil Testing
There are a number of extractants and methods developed for predicting
phytoavailability of heavy metals. These can be grouped as:
Complexing Extractants
Originally developed for predicting micronutrient deficiency, use of such
extractants has been extended for polluted soils also. Several complexing reagents
have been used to extract phytoavailable metals like diethylene triamine penta
acetic acid (DTPA), ethylene diamine tetra acetic acid (EDTA), sodium pyrophos-
phate (Na4P4O7) by various researchers (Latterell et al. 1978; He and Singh 1993;
Mc Keague 1967). Such complexing extractants tend to extract metals from many
other fractions (reserve pool), besides immediately available pool (soluble and
7.6 Soil Testing for Heavy Metal Contaminated Land 181

exchangeable). For this reason, several researchers have questioned their sustain-
ability as extractants for soil test (McLaughlin et al. 2000; Cook 1998).
Neutral Salt Extractants
Unbuffered solution of neutral salts like CaCl2, NaNO3 and NH4NO3 have been
indicated as best predictors of heavy metals uptake by plants in contaminated soils.
This is because these reagents extract metals from immediately available pool
(i.e. soil solution) as well as from the fraction which quickly replenishes the soil
solution once depleted after absorption by plants roots (i.e. exchangeable fraction).
Alloway and Morgan (1986) and Davies (1992) found that 1.0 M NH4NO3 was
suitable predictor for heavy metals concentration in vegetable crops. Dilute CaCl2(0.01 M ) has also been suggested as the best predictor of phytoavailable metals in
soils by several researchers (Houba et al. 1990; Rayment 1994; Andrews et al.
1996). At equimolar concentrations, this solution may extract more Cd than
NH4NO3 and NaNO3 due to formation of chloro-complexes. Use of 0.1M NaNO3
as extractants has also been recommended for predicting plant uptake of metals and
their microbial toxicity (Gupta and Aten 1993). Major drawback of using
unbuffered salt solutions is their very lower magnitude of extraction demanding
costly and sensitive analytical instruments like Inductively Coupled Plasma -
Optical Emission Spectrometer (ICP-OES), ICP-Mass Spectrometer (ICP-MS),
High Performance Liquid Chromatography (HPLC)-ICP-MS etc.
Ion-exchange Resins
Although ion exchange resins are nowadays being advocated for assessing plant
available macro-nutrients in agricultural soils, their use in soil testing of contam-
inated land is less common. Jing and Logan (1991) used ChelexTM resins beads
(enclosed in dialysis bag to assess phyto-available Cd in sewage sludge amended
soil; but failed to demonstrate any significant advantage of this over other
extractants). However, Lee and Zhang (1993) found such resin a better predictor
than DTPA or 0.01 M CaCl2 for soil Cd phytoavailability.
7.6.2.3 Microbial Biosensor to Indicate Bioavailable Heavy Metal
in Soil and Its Transfer to Plants
Bacterial sensor-reporters, which consist of living micro-organisms genetically
engineered to produce specific output in response to target chemicals, offer an
interesting alternative to monitoring approaches. Bacterial sensor-reporters detect
bioavailable and/or bioaccessible compound fractions in samples. Currently, a
variety of environmental pollutants can be targeted by specific biosensor-reporters.
Although most of such strains are still confined to the lab, several recent reports
have demonstrated utility of bacterial sensing-reporting in the field, with method
detection limits in the nanomolar range (Tecon and van der Meer 2008). Method
detection limits of MBS assays are often in the nanomolar range, thereby competing
182 7 Assessment of Heavy Metals Contamination in Soil

effectively with existing chemical analytics. Despite these aspects, MBS-assays are
still rarely applied outside research laboratories (Harms et al. 2006). Convincing
data have been produced which demonstrate field robustness, good measurement
precision and accuracy of MBS-assays in comparison to chemical analytics, as in
the case of arsenic in groundwater (Trang et al. 2005) or rice (Baumann and van der
Meer 2007). However, due to GMO related issue, regulatory authorities in different
countries do not accept MBS as realistic alternative for a variety of analytical
procedures.
7.6.3 Soil Test Screening Levels of Heavy Metalsfor Assessment of Toxicity in an Agro-ecosystem
Unlike soil tests for nutrient elements, there is a dearth of good data relating soil
tests to environmental endpoints for heavy metal toxicity. Moreover, soil testing
methodology for the identification of heavy metal-contaminated soils is practically
absent in India. A study was conducted India to determine the screening levels of
different heavy metals by using a widely used soil test procedure (extraction with
0.01M CaCl2 as recommended by Houba et al. 1990) for a sensitive agro-ecosystem
in which heavy metals are likely to cause toxicity at an early stage and where
sensitive agro-ecosystem was defined as an edible plant with a high metal uptake
capacity, growing in a soil type having a low metal-fixing capacity (Saha and
Panwar 2014).
The above-ground biomass of spinach was significantly reduced at CaCl2-
extractable levels of and higher than 0.080 mg kg�1 Cd, 0.582 mg kg�1 Cr,
1.581 mg kg�1 Cu, 1.63 mg kg�1 Ni, and 15.258 mg kg�1 Zn (single element
contamination). Doses of Pb did not have any significant effect on the above-ground
biomass of spinach. Soil test levels more than 0.100 mg kg�1 Cd, 0.465 mg kg�1 Cr,
1.357 mg kg�1 Cu, 1.350 mg kg�1 Ni, and 13.987 mg kg�1 Zn reduced biomass
yield by more than 20% (Fig. 7.4).
Soil test screening levels of heavy metals for vegetable growing land were identified
as 0.003 mg kg�1 Cd, 0.176 mg kg�1 Cr, 0.637 mg kg�1 Cu, 0.022 mg kg�1
Ni, 0.008 mg kg�1 Pb, and 0.068 mg kg�1 Zn; beyond which it might contaminate
vegetables. Similarly, increasing levels CaCl2 extractable heavy metals in soil had
significant adverse effect on several soil enzymes which are considered indicator of soil
microbial activities (Fig. 7.5). Soil test levels with more than 0.087 mg kg�1 Cd,
0.052 mg kg�1 Cr, 0.70 mg kg�1 Cu, 0.239 mg kg�1 Ni, 0.008 mg kg�1 Pb, and
3.80 mg kg�1 Zn were found to diminish any of the soil enzymes dehydrogenase,
phosphatase, arylsulfatase, protease, lipase and esterase by more than 20%.
As the lowest among these maximal screening levels of soil test values deter-
mined by using the above three different approaches can protect all target organ-
isms, 0.003 mg kg�1 Cd, 0.052 mg kg�1 Cr, 0.637 mg kg�1 Cu, 0.022 mg kg�1 Ni,
7.6 Soil Testing for Heavy Metal Contaminated Land 183

0.008 mg kg�1 Pb, and 3.800 mg kg�1 Zn were considered to be the screening
levels for assessing heavy metals toxicity in municipal solid waste compost-
amended soil for growing vegetables (Saha and Panwar 2014).
00
20
40
60
80
100
120
0
20
40
60
80
100
120
00.00 5.00 10.00 15.00 20.000 0.01 0.015 0.020.005
20
40
60
80
100
120
140
0
20
40
60
80
100
120
140
00 0.2 0.4 0.6
20
40
60
80
100
120
0.05 0.1 0.15 0.2
y = -878.6x2 - 130.0x +101.8R2 = 0.853
y = -32.74x2 +33.00x +95.52R2 = 0.921 y = -3.800x2 -10.93x +101.8
R2 = 0.907
y = -0.281x2 +2.521x +99.79R2 = 0.944
y = -263.8x2 + 75.38x + 102.0R2 = 0.978R
elat
ive
yiel
d (
%)
Rel
ativ
e yi
eld
(%
)R
elat
ive
yiel
d (
%)
00 1 2 3
20
40
60
80
100
120
Rel
ativ
e yi
eld
(%
)R
elat
ive
yiel
d (
%)
CaCl2 - Cd (mg/kg)
CaCl2 - Cu (mg/kg)
CaCl2 - Pb (mg/kg) CaCl2 - Zn (mg/kg)
CaCl2 - Ni (mg/kg)
CaCl2 - Cr (mg/kg)
Rel
ativ
e yi
eld
(%
)
Error barError bar
Error bar
Error bar
Error bar
Error bar
0 1 20.5 1.5 2.5
Fig. 7.4 Effect of CaCl2-extractable metals in soil on above-ground biomass yield (Expressed as
% yield after control treatment) of spinach. Error bar¼ Least significant difference between means
at 5% probability level (Saha and Panwar 2014)
184 7 Assessment of Heavy Metals Contamination in Soil

00 0.05 0.00
0.00
0.000 0.005 0.010 0.015 0.020
1.00 2.00 3.00
0.20 0.40 0.60 0.800.1 0.20.15
20
40
60
80
100
120
00 1 2 3
20
40
60
80
100
120
0
20
40
60
80
100
120
00 5 15 2010
20
40
60
80
100
120
0
20
40
60
80
100
120
140
0
20
40
60
80
100
120
CaCl2 - Cd (mg/kg)
CaCl2 - Cu (mg/kg)
CaCl2 - Pb (mg/kg) CaCl2 - Zn (mg/kg)
CaCl2 - Ni (mg/kg)
CaCl2 - Cd (mg/kg)
Rel
. En
zym
e ac
tivi
ty (
%)
Rel
. En
zym
e ac
tivi
ty (
%)
Rel
. En
zym
e ac
tivi
ty (
%)
Rel
. En
zym
e ac
tivi
ty (
%)
Rel
. En
zym
e ac
tivi
ty (
%)
Rel
. En
zym
e ac
tivi
ty (
%)
Fluorescein
TPF
PNP-AP
PNP-AS
Fluorescein
TPF
PNP-AP
PNP-AS
Fluorescein
TPF
PNP-AP
PNP-AS
Fluorescein
TPF
PNP-AP
PNP-AS
Fluorescein
TPF
PNP-AP
PNP-AS
Fluorescein
TPF
PNP-AP
PNP-AS
Fig. 7.5 Effects of CaCl2-extractable metals in soil on relative soil enzyme activities (Fractions of
control soil enzyme activities). Fluorescein ¼ activities of esterase þ lipase þ protease; TPF ¼dehydrogenase activity; PNP-AP ¼ acid phosphatase activity; PNP-AS ¼ arylsulfatase activity
(Saha and Panwar 2014)
7.6 Soil Testing for Heavy Metal Contaminated Land 185

References
Akerblom S, Baath E, Bringmark L et al (2007) Experimentally induced effects of heavy metals on
microbial activity and community structure of forest mor layers. Biol Fert Soils 44:79–91
Alfaro MR, Montero A, Ugarte OM et al (2015) Background concentrations and reference values
for heavy metals in soils of Cuba. Environ Monit Assess 187:4198–4207
Alloway BJ, Morgan H (1986) The behavior and availability of Cd, Ni and Pb in polluted soils. In:
Assink JW, van den Brink WJ (eds) Contaminated soil. Martinus Nijhoff Publishers, Dor-
drecht, pp 101–113
Andersen S, Odegard S, Vogt RD, Seip HM (1994) Background levels of heavy-metals in Polish
Forest soils. Ecol Engin 3:245–253
Andrews P, Town RM, Hedley MJ, Loganathan P (1996) Measurement of plant available
cadmium in New Zealand soils. Australian J Soil Res 34:441–452
Angelone M, Bini C (1992) Trace Elements concentrations in soils and plants of Western Europe.
In: Adriano DC (ed) Biogeochemistry of Trace Elements. Lewis Publishers, Boca Raton, pp
10–60
ATSDR (2005) Toxicological profile for nickel. Agency for Toxic Substances and Disease
Registry, U.S. Department of Health And Human Services, Public Health Service, Division
of Toxicology/Toxicology Information Branch, Atlanta
Bachman G, Freier R, Konietzka R (1995) Soil levels based on the German soil Protection Bill. In:
Brink WJ, van der Bosman R, Arendt F (eds) Contaminated soil. Kluwer Academic Publishers,
Dordrecht, pp 711–719
Baltrenaite E, Lietuvninkas A, Baltrenas P (2012) Use of dynamic factors to assess metal uptake
and transfer in plants—example of trees. Water Air Soil Pollut 223:4297–4306
Baumann B, van der Meer JR (2007) Analysis of bioavailable arsenic in rice with whole cell living
bioreporter bacteria. J Agr Food Chem 55:2115–2120
Bech J, Tume P, Longan L et al (2005) Baseline concentrations of trace elements in surface soils of
the Torrelles and Sant Climent municipal districts (Catalonia, Spain). Environ Monit Assess
108:309–322
Bhagure GR, Mirgane SR (2011) Heavy metal concentrations in groundwaters and soils of Thane
Region of Maharashtra, India. Environ Monit Assess 173:643–652
Bhattacharyya T, Pal DK, Mandal C et al (2013) Soils of India: historical perspective, classifica-
tion and recent advances. Curr Sci India 104:1308–1323
Bini C, Dallaglio M, Ferreti O, Gragniani R (1988) Background levels of microelements in soils of
Italy. Environ Chem Health 10:63–69
Blaser P, Zimmermann S, Luster J, Shotyk W (2000) Critical examination of trace element
enrichments and depletions in soils: As, Cr, Cu, Ni, Pb, and Zn in Swiss forest soils. Sci
Total Environ 249:257–280
Bradford GR, Chang AC, Page AL et al (1996) Background concentrations of trace and major
elements in California soils. Karney Foundation Special Report of University of California,
Riverside, Technical Report
Brookes PC, McGrath SP (1984) The effect of metal toxicity on the size of soil microbial biomass.
J Soil Sci 35:341–346
Buat-Menerd P, Chesselt R (1979) Variable influence of the atmospheric flux on the trace metal
chemistry of oceanic suspended matter. Earth Planetary Sci Let 42:398–411
Bunzl K, Albers BP, Schimmack W et al (2000) Examination of a relationship between 137Cs
concentrations in soils and plants from alpine pastures. J Environ Radioact 48:145–158
Campos ML, Pierangeli AP, Guilherme LRG et al (2003) Baseline concentration of heavy metals
in Brazilian latosols. Commun Soil Sci Plant Anal 34:547–557
Chaney RL, Ryan JA (1994) Risk based standards for arsenic, lead and cadmium in urban soils.
DECHEMA, Frankfurt, p 130
186 7 Assessment of Heavy Metals Contamination in Soil

Chaudri AM, McGrath SP, Giller KE et al (1993) Enumeration of indigenous Rhizobiumleguminosarum biovar trifolii in soils previously treated with metal –contaminated sewage-
sludge. Soil Biol Biochem 25:301–309
Chen J, Wei F, Zheng C (1991) Background concentrations of elements in soils of China. Water
Air Soil Pollut 57(58):699–712
Chen M, Ma LQ, Harris WG, Hornesby AG (1999) Background concentrations of trace metals in
Florida surface soils: taxonomic and geographic distributions of total-total and total-
recoverable concentrations of selected trace metals. Florida Center For Solid And Hazardous
Waste Management, Florida
Cheng Q, Agterberg FP, Bonham-Carter GF (1996) A spatial analysis method for geochemical
anomaly separation. J Geochem Explor 56:183–195
Cheng Q, Xu Y, Grunsky E (2000) Integrated spatial and spectrum method for geochemical
anomaly separation. Nat Res Res 9:43–56
Chester R, Kudoja WM, Thomas A, Towner J (1985) Pollution reconnaissance in stream sedi-
ments using non-residual trace metals. Environ Pollut 23:213–238
Cicchella D, De Vivo B, Lima A (2005) Background and baseline concentration values of
elements harmful to human health in the volcanic soil of the metropolitan and provincial
area of Napoli (Italy). Geochem Explor Environ Anal 5:29–40
Cook N (1998) Bioavailability of trace metals in urban contaminated soils. Ph D thesis, McGill
University, Quebec
da Silva FBV, do Nascimento CWA, Araujo PRM et al (2016) Assessing heavy metal sources in
sugarcane Brazilian soils: an approach using multivariate analysis. Environ Monit Assess
188:457. doi:10.1007/s10661-016-5409-x
Dantu S (2009) Heavy metals concentration in soils of south-eastern part of Ranga Reddy district,
Andhra Pradesh, India. Environ Monit Assess 149:213–222
Dantu S (2010) Geochemical patterns in soils in and around Siddipet, Medak District, Andhra
Pradesh, India. Environt Monit Assess 170:681–701
Davies BE (1992) Trace metals in the environment: retrospect and prospect. In: Adriano DC
(ed) Biogeochemistry of trace metals. Lewis Publishers, Boca Raton, pp 1–18
Davis PA, Avadhanula MR, Cancio D et al (1999) BIOMOVS II: an international test of the
performance of environmental transfer models. J Environ Radioact 42:117–130
De Temmerman LO, Hoenig M, Scokart PO (1984) Determination of normal level and upper limit
values of trace elements in soils. Z Pflanz Bodenkunde 147:687–694
Denneman CAJ, Robbersen JG (1993) Target values for soil and groundwater – the Netherlands
integrated soil research programme. In: Eijsackers HJP, Hamers T (eds) Integrated soil and
sediment research: a basis for proper protection: selected proceedings of the first European
Conference on Integrated Research for Soil and Sediment Protection and Remediation
(EUROSOL), Springer Dordrecht. pp 89–90
Dinelli E, Lombini A (1996) Metal distributions in plants growing on copper mine spoils in
Northern Apennines, Italy: the evaluation of seasonal variations. Appl Geochem J 11:375–385
Doelman P, Haanstra L (1989) Short and long-term effects of heavy metals on phosphatase activity
in soils: an ecological dose-response model approach. Biol Fert Soils 8:235–241
Dudka S (1992) Factor analysis of total element concentrations in surface soils in Poland. Sci Total
Environ 121:39–52
Dudka S, Ponce-Hernandez R, Hutchinson TC (1995) Current levels of total element concentra-
tions in the surface laver of Sudbury’s soils. Sci Total Environ 162:161–172
Facchinelli A, Sacchi E, Mallen L (2001) Multivariate statistical and GIS-based approach to
identify heavy metal sources in soils. Environ Pollut 114:313–324
Feller W (1971) An Introduction to Probability Theory and Its Applications, 3rd edn. Wiley,
New York
Fitz WJ, Wenzel WW (2002) Arsenic transformations in the soil-rhizosphere-plant system:
fundamentals and potential application to phytoremediation. J Biotechnol 99(3):259–278
References 187

Forstner U (1990) Contaminated sediments, Lecture Notes in Earth Science, vol 21. Springer,
Berlin
Garcia R, Maize I, Millan E (1996) Heavy metal contamination analysis of roadsoils and grasses
from Gipuzkoa (Spain). Environ Technol 17:763–770
Gough LP, Severson LC, Jackson LL (1994) Baseline element concentration in soils and plants,
Bull Island, Cape Romain, National Wildlife Refuge, South Carolina, USA. Water Air Soil
Pollut 74:1–17
Guan Y, Shao C, Ju M (2014) Heavy Metal Contamination Assessment and Partition for Industrial
and Mining Gathering Areas. Int J Environ Res Public Health 11:7286–7303
Gupta SK, Aten C (1993) Comparison and evaluation of extraction media and their suitability in a
simple model to predict the biological relevance of heavy metal concentrations in contami-
nated soils. Int J Environ Anal Chem 51:25–46
Hakanson L (1980) An ecological risk index for aquatic pollution control. A sedimentological
approach. Water Res 14:975–1001
Hakanson L, Jansson M (1983) Principles of Lake Sedimentology. Springer, Berlin, pp 280–281
Harms H, Wells M, van der Meer JR (2006) Whole-cell living biosensors: are they ready for
environmental application? Appl Microbiol Biotechnol 3:273–280
He QB, Singh BR (1993) Plant availability of cadmium in soils. I. Extractable cadmium in newly
and long-term cultivated soils. Acta Agr Scand Sec B- Soil Plant Sci 43:134–141
Holmgren GGS, Meyer MW, Chaney RL (1993) Cadmiun, Pb, Zn, Cu and Ni in agricultural soils
of the United State of America. J Environ Qual 22:335–348
Hope BK (1995) A review of models for estimating terrestrial ecological receptor exposure to
chemical contaminants. Chemosphere 30:2267–2287
Houba VJG, Novozamsky I, Lexmond TM, Lee JJ (1990) Applicability of 0.01 M CaCl2 as a
single extraction solution for the assessment of the nutrient status of soils and other diagnostic
purposes. Commun Soil Sci Plant Anal 21:2281–2290
Hu Y, Liu X, Bai J et al (2013) Assessing heavy metal pollution in the surface soils of a region that
had undergone three decades of intense industrialization and urbanization. Environ Sci Pollut
Res 20:6150–6159
Huang R (1987) Environmental pedology. Higher Education Press, Beijing
IRIS (2016) Integrated Risk Information System. US Environmental Protection Agency. https://
www.epa.gov/iris. Accessed 16 June 2016
Jie-liang C, Zhou S, You-wei Z (2007) Assessment and mapping of environmental quality in
agricultural soils of Zhejiang Province, China. J Environ Sci 19:50–54
Jing J, Logan TL (1991) Chelating resin method for estimation of sludge-cadmium bioavailability.
Commun Soil Sci Plant Anal J 22:2029–2035
Kabata-Pendias A (2000) Trace Element in Soils and Plants, Third edn. CRC Press, Baton Raton
Kabata-Pendias A (2011) Trace elements in soils and plants. CRC Press/Taylor & Francis Group,
Boca Raton
Kabata-Pendias A, Pendias H (1992) Trace elements in soils and plants. CRC ress, Baton Raton
Karageorgis AP, Katsanevakis S, Kaberi H (2009) Use of enrichment factors for the assessment of
heavy metal contamination in the sediments of Koumoundourou Lake, Greece. Water Air Soil
Pollut 204:243–258
Kloke A, Sauerbeck DR, Vetter H (1984) The contamination of plants and soils with heavy metals
and the transport of metals in terrestrial food chain. In: Nriagu JO (ed) Changing metal cycles
and human health. Springer, Berlin, pp 113–141
Kostov O, Van O (2001) Nitrogen transformation in copper- contaminated soils and effects of line
and compost application on soil resiliency. Biol Fert Soils 33:10–16
Krishna AK, Govil PK (2007) Soil contamination due to heavy metals from an industrial area of
Surat, Gujarat, Western India. Environ Monit Assess 124:263–275
Krishna AK, Govil PK (2008) Assessment of heavy metal contamination in soils around Manali
industrial area, Chennai, Southern India. Environ Geol 54:1465–1472
188 7 Assessment of Heavy Metals Contamination in Soil

Krzysztof L, Wiechula D, Korns I (2004) Metal contamination of farming soils affected by
industry. Environ Int 30:159–165
Kuhad MS, Malik RS, Singh A (1989) Background levels of heavy metals in agricultural soils of
Indo-Gangetic Plains of Haryana. J Indian Soc Soil Sci 37:700–705
Kuperman RG, Carreiro MM (1997) Soil heavy metal concentrations, microbial biomass and
enzyme activities in a contaminated grassland ecosystem. Soil Biol Biochem 29:179–190
Latterel JJ, Dowdy RH, Larso WE (1978) Correlation of extractable metals and metal uptake of
snap beans grown on soil amended with sewage sludge. J Environ Qual 7:435–440
Lee DY, Zheng HC (1993) Chelating resin membrane method for estimation of soil cadmium
phytoavailability. Commun Soil Sci Plant Anal 24:685–700
Lide DR (2005) CRC Handbook of Chemistry and Physics. CRC Press, Boca Raton
Lima A, De Vivo B, Cicchella D et al (2003) Multifractal IDW interpolation and fractal filtering
method in environmental studies: an application on regional stream sediments of Campania
region (Italy). Appl Geochem 18:1853–1865
Liu Q, Diamond ML, Gingrich SE et al (2003) Accumulation of metals, trace elements and
semivolatile organic compounds on exterior window surfaces in Baltimore. Environ Pollut
122(1):51–61
Liu X, Song Q, Tang Y et al (2013) Human health risk assessment of heavy metals in soil-
vegetable system: a multi-medium analysis. Sci Total Environ 463-464:530–540
Loska K, Wiechula D, Korus I (2004) Metal contamination of farming soils affected by industry.
Environ Int 30:159–165
Ma LQ, Tan F, Harris W (1997) Concentrations and distributions of eleven metals in Florida soils.
J Environ Qual 26:769–775
Marandi A, Karro E (2008) Natural background levels and threshold values of monitored param-
eters in the Cambrian–Vendian groundwater body, Estonia. Environ Geol 54:1217–1225
McBride MB (1994) Environmental chemistry of soils. Oxford University Press Inc, New York
McGrath SP (1993) Soil quality in relation to agricultural use. In: Eijsackers HJP, Hamers T (eds)
Integrated soil and sediment research: a basis for proper protection. Springer, Dordrecht, pp
187–200
McGrath SP, Chang AC, Page AL, Witter E (1994) Land application of sewage sludge: scientific
perspectives of heavy metal loading limits in Europe and the United States. Environ Rev
2:108–118
McKeague JA (1967) An evaluation of 0.1 M pyrophosphate and pyrophosphatedithionite in
comparison with oxalate as extractants of the accumulation products in podsols and some
other soils. Canadian J Soil Sci 47:95–99
McLaughlin MJ, Smolders E, Merckx R (1998) Soil root interface: physiochemical processes. In:
Huang PM (ed) Soil Chemistry and Ecosystem Health. Soil Science Society of America,
Wisconsin, pp 233–277
McLaughlin MJ, Parker DR, Clarke JM (1999) Metals and micronutrients – food safety issues.
Field Crops Res 60:143–163
McLaughlin MJ, Zarcinas BA, Stevens DP, Cook N (2000) Soil testing for heavy metals. Commun
Soil Sci Plant Anal 31:1661–1700
Mendez MO, Maier RM (2008) Phytostabilization of Mine Tailings in Arid and Semiarid
Environments—An Emerging Remediation Technology. Environ Health Perspect 116
(3):278–283
Mico C, Peris M, Recatala L, Sanchez J (2007) Baseline values for heavy metals in agricultural
soils in an European Mediterranean region. Sci Total Environ 378:13–17
Mico C, Recatala L, Peris M, Sanchez J (2006) Assessing heavy metal sources in agricultural soils
of an European Mediterranean area by multivariate analysis. Chemosphere 65:863–872
Murthy NN (2008) A case study of soil contamination at Katedan Industrial area, Hyderabad.
NGRI Proc: Contaminated groundwater monitoring and soil assessment, Hyderabad, India, p
1–12
References 189

Namaghi HH, Karami GH, Saadat S (2011) A study on chemical properties of groundwater and
soil in ophiolitic rocks in Firuzabad, east of Shahrood, Iran: with emphasis to heavy metal
contamination. Environ Monit Assess 174(1-4):573–583
Panwar NR, Saha JK, Adhikari T et al (2010) Soil and water pollution in India: some case studies,
IISS technical bulletin. Indian Institute of Soil Science, Bhopal, pp 1–40
Parker DR, Pedler JF (1997) Reevaluating the free-ion activity model of trace metal availability to
higher plants. Plant Soil 196:223–238
Parth V, Murthy NN, Saxena PR (2011) Assessment of heavy metal contamination in soil around
hazardous waste disposal sites in Hyderabad city (India): natural and anthropogenic implica-
tions. J Environ Res Manage 2:27–34
Pierzynski GM, Sims JT, Vance GF (2000) Soils and environmental quality. CRC Press/LLC, NW
Corporate Blvd, Boca Raton
Purushotham D, Lone MA, Rashid M et al (2012) Deciphering heavy metal contamination zones
in soils of a granitic terrain of southern, India using factor analysis and GIS. J Earth Sys Sci 121
(4):1059–1070
Rao AS, Saha JK (2012) Sustaining agricultural productivity through integrated soil management.
Policy paper, National Academy of Agricultural Sciences, New Delhi, pp 24
Ratha DS, Sahu BK (1993) Sources and distribution of metals in urban soils of Bombay, India
using multivariate statistical techniques. Environ Geol 22:276–285
Rayment GE (1994) Cadmium in Queensland vegetables and associated soils. MSc Thesis, School
of Agriculture, University of Queensland, St Lucia, Australia
Reimann C, de Caritat P (2000) Intrinsic flaws of element enrichment factors (Efs) in environ-
mental geochemistry. Environ Sci Technol 34:5084–5091
RocaMC, Vallejo VR (1995) Effect of soil potassium and calcium on cesium and strontium uptake
by plant roots. J Environ Radioact 28:141–159
Rodriguez PB, Tome FV, Lozano JC (2002) About the assumption of linearity in soil-to plant
transfer factors for uranium and thorium isotopes and 226Ra. Sci Total Environ 284:167–175
Rooney CP, Zhao F, McGrath SP (2007) Phytotoxicity of nickel in a range of European soils:
influence of soil properties, Ni solubility and speciation. Environ Pollution 145:596–605
Saha JK, Panwar N (2014) Screening of soil for assessment of toxicity of heavy metals to
organisms. Curr Sci India 106(2):300–304
Saha JK, Panwar N et al (2013) Risk assessment of heavy metals in soil of a susceptible agro-
ecological system amended with municipal solid waste compost. J Indian Soc Soil Sci 61
(1):15–22
Saur E, Juste C (1994) Enrichment of trace elements from long-range aerosol transport in sandy
podozolic soils of southwest France. Water Air Soil Pollut 73:235–246
SEPAC (1995) State Environmental Protection Administration of China, Beijing. Chinese Envi-
ronmental Quality Standard for Soils (GB15618-1995)
Sheppard MI, Sheppard SC (1985) The plant concentration concept as applied to natural uranium.
Health Physics 48:494–500
Smolders E, McLaughlin MJ (1996) Chloride increases cadmium uptake in Swiss chard in resin-
buffered nutrient solution. Soil Sci Soc Am J 60:1443–1447
STCR (2016) Online fertilizer recommendations. All India Coordinated Research Project on Soil
Test Crop Response. http://www.stcr.gov.in/. Accessed 26 July 2016
Sutherland RA (2000) Bed sediment-associated trace metals in an urban stream, Oahu, Hawaii.
Environ Geol 39:611–627
Tabatabai MA (1982) Soil enzymes. In: Page AL, Miller RH, Keeney DR (eds) Methods of soil
analysis, part 2, chemical and microbiological properties, Monograph no, vol 9. ASA-SSSA,
Madison, Wisconsin, pp 903–947
Taylor SR, Mclennan SM (1995) The geochemical evolution of the continental crust. Rev
Geophys 33:241–265
Tecon R, Van der Meer JR (2008) Bacterial biosensors for measuring availability of environmen-
tal pollutants. Sensors 8:4062–4080
190 7 Assessment of Heavy Metals Contamination in Soil

Thomilson DC, Wilson DJ, Harris CR, Jeffrey DW (1980) Problem in heavy metals in estuaries
and the formation of pollution index. Helgolander Meeresunters 33:566–575
Thornton I (1982) Implications of geochemical background data in relation to hazardous waste
management. In: Hemphill DD (ed) Trace substances in environmental health. University of
Missouri, Columbia, pp 57–67
Tome FV, Rodriguez MB, Lozano JC (2003) Soil to plant transfer factors for natural radionuclides
and stable elements in a Mediterranean area. J Environ Radioact 65:161–175
Trang PTK, Berg M, Viet PH, Mui NV, van der Meer JR (2005) Bacterial bioassay for rapid and
accurate analysis of arsenic in highly variable groundwater samples. Environ Sci Technol
39:7625–7630
Tyler G (1981) Heavy metals in soil biology and biochemistry. In: Paul EA, Ladd JN (eds) Soil
biochemistry. Marcel Dekker Inc., New York, pp 371–414
USEPA (1992) United States Environmental Protection Agency. Pesticide industry sales and
usage, 1990 and 1991 market estimates. United States Environmental Protection Agency
Publishing, Washington, DC
USEPA (2005a) Ecological soil screening levels for cadmium. U.S. EPA, Office of Solid Waste
and Emergency Response, Washington, DC
USEPA (2005b) Ecological soil screening levels for chromium. U.S. EPA, Office of Solid Waste
and Emergency Response, Washington, DC
Vencelides Z, Hrkal Z, Prchalova H (2010) Determination of the natural background content of
metals in ground waters of the Czech Republic. Appl Geochem 25:755–762
Yang Z, Liu S, Zheng D, Feng S (2006) Effects of cadmium, zinc, and lead on soil enzyme
activities. J Environ Sci 18:1135–1141
Zhang HH, Li FB, Wu ZF et al (2008) Baseline concentrations and spatial distribution of trace
metals in surface soils of Guangdong province, China. J Environ Qual 37:1752–1760
Zhao FJ, McGrath SP, Merrington G (2007) Estimates of ambient background concentrations of
trace metals in soils for risk assessment. Environ Pollut 148:221–229
References 191

Chapter 8
Urban Activities in India Leading to Soil
Pollution
Abstract Due to rapid growth in industry and service sectors, urbanization has
seen phenomenon increase in many countries across the world with consequent rise
in solid and liquid wastes. Per capita generation and nature of such urban wastes has
been found highly related to level of economic activities of a country. Due to
insufficient treatment facilities for these wastes, urbanization has been found
polluting agricultural land considerably, particularly in lower and middle income
countries. Unscientific processing of solid wastes as well as release of sewage
effluents in environment and their use for benefit to crop production have been
found an important route for contamination of agricultural land with toxic trace
metals and organic pollutants. Safe and beneficial recycling of municipal solid
wastes in agricultural land after appropriate processing and treatment is facing
obstacles due to lack of appropriate quality and hazardousness of the end products.
Widely prevalent marginal quality sewage water use for irrigation in agriculture in
urban and peri-urban areas in developing countries like India has also been
discussed in details through different perspectives like carbon sequestration, crop
productivity, plant nutrient supply as well as risks from various pollutants and
pathogens.
Keywords Urban solid waste • Wastewater • Compost • Sewage sludge • Heavy
metals • Crop • Organic pollutants
Availability of better living amenities and job opportunities in urban areas than in
rural areas attracts more people to settle in urban areas across the world. For
instances, worldwide people living in the urban areas are more than 54% and this
figure may rise to 66% by 2050. Urbanization and its associated processes alter
several natural ecosystem processes in following ways:
• Shift in land utilization towards roadways, housing, drainage systems etc.
• Sealing of land surface leading to cessation of interaction between atmosphere
and lithosphere
• Alteration of rainwater flow pathways and its partitioning between groundwater
and surface water bodies
© Springer Nature Singapore Pte Ltd. 2017
J.K. Saha et al., Soil Pollution - An Emerging Threat to Agriculture, Environmental
Chemistry for a Sustainable World 10, DOI 10.1007/978-981-10-4274-4_8
193

• Enhanced disposal/emission of gaseous, liquid and solid wastes containing
toxicants/xenobiotics and their type & dynamism of interaction with natural
processes
All of these ecosystem alterations in the urban areas have tremendous adverse
impact on biodiversity and quality of life processes. Different anthropogenic
activities cause incremental pollution leading to the accumulation of various toxic
chemicals in the environment. The major urban processes contributing to soil
pollution in India are indiscriminate use of xenobiotic chemicals as well as disposal
of liquid and solid wastes in unsafe manner. This chapter describes treatment and
disposal of urban wastes generated with India in focus.
8.1 Urban Solid Wastes and Their Use in Agriculture
8.1.1 Municipal or Urban Solid Wastes Generation
Worldwide annual municipal or urban solid waste (MSW) generation in 2010 was
about 1.3 billion metric tonnes. It is expected to reach�2.2 billion metric tonnes by
2025 (Daniel and Perinaz 2012). Such increase may not only be due to expansion of
cities and their population, perhaps the per capita waste generation has also
increased from 1.2 to 1.42 kg day�1. Further the high-income countries generate
more total daily per capita MSW when compared to the low-income countries
(Fig. 8.1). Countries under OECD generate on an average maximum per capita
MSW (2.2 kg day�1) which is about five times the amount generated in south Asian
countries (Fig. 8.2). Higher per capita waste generation in high-income countries
has often been linked to increased consumerism and better in lifestyle.
Human population in India is more than 1.2 billion and this constitutes approx-
imately 18% of human population worldwide and ranks second in the world with
respect to total human population. Urban population grew with the pace of 31.8%
and during the last decade, and exceeded 377 million which is accounted as
31% or more of the India’s total population with population density of more than
400 km-2. The total urban solid waste (MSW) generated in India is 68.8 million
metric tonnes per year (TPY) or 1, 88, 500 metric tonnes per day (TPD). The MSW
generation in an area is directly linked to the total population residing. A survey
reflected that the metropolitan cities and bigger towns of the country generate more
MSW than smaller cities. For example, among the metropolitan cities in India,
Kolkata generated maximum MSW of 11,520 TPD or 4.2 million TPY (Annepu
2012). Among different Indian geographical regions, Northern India generated the
highest amount of urban solid wastes (40,500 TPD or 14.8 million TPY) which
accounts 30% of total MSW generated in the country; and Eastern India
(23,500 TPD or 8.6 million TPY) generated the least, i.e. only 17% of MSW
generated. Among states, Maharashtra, West Bengal, Uttar Pradesh, Tamil Nadu
and Andhra Pradesh generated higher scale of MSW i.e. 22,200; 15,500; 13,000;
194 8 Urban Activities in India Leading to Soil Pollution

12,000; and 11,500 TPD or 8.1, 5.7, 4.75, 4.3, and 4.15 million TPY, respectively.
The MSW generation in India is increasing at significant rate and may reach
approximately to 270 million TPY by the year of 2047 (Singhal and Pandey 2001).
In India, waste generation per capita per day varies according to total population
of cities and their lifestyle; but in general it ranges between 200–870 g day�1. The
annual per capita waste generation is increasing at the rate of 1.3% (CPCB 2012).
Moreover per capita waste generation in cities located in the western part of India
was lower at 440 g day�1, followed by 500, 520 and 560 g day�1 for cities located
in Eastern, Northern, and Southern India, respectively. Among the smaller Indian
states, Goa recorded high per capita waste generation (620 g day�1) due to
predominance of tourism industry. Tamil Nadu, Jammu & Kashmir and Andhra
Pradesh stand for larger per capita waste generators among states with 630, 600 and
570 g MSW day�1, respectively. Among Union Territories, Andaman and Nicobar
Islands generated the highest per capita waste of 870 g day�1, probably due to high
tourist influx.
0.205
1.0120.666
1.649
0.60.78
1.16
2.13
Lower income Lower-middleincome
Upper-middleincome Higher income
Total (mT/day) Per capita (kg/day)Fig. 8.1 Average total and
per capita MSW generation
in countries under different
group
0
0.5
1
1.5
2
2.5
SAR AFR EAP ECA LAC MENA OECD
kg/cap
ita/day
Fig. 8.2 Solid waste generation rate of various regions (Adapted from Daniel and Perinaz 2012).
SAR South Asia, AFRAfrica, EAP East Asia and Pacific, ECA Europe and Central Asia, LAC Latin
America and the Caribbean region,MENAMiddle East and North Africa, OECD Organisation for
Economic Co-operation and Development
8.1 Urban Solid Wastes and Their Use in Agriculture 195

8.1.2 Composition of MSW
The solid wastes generated in cities contain biodegradable organic matter,
non-biodegradable organic materials and inorganic substances. Specifically,
MSW originates from home (including kitchen), fruits and vegetable market, hotels
and restaurants, animal carcasses, garden pruning and clippings, street sweepings,
construction debris etc. and consists of decomposable organic matter, papers,
plastics, cloth wastes, rubbers, glass, metals, stones, concretes, soil etc. Average
composition of MSW varies widely in different countries; such as content of
organic matter 4–88%, paper 2–68%, plastics 1–35%, glass 1–13%, metals
1–20%, and other materials 1–63%. Organic fraction of MSW can be beneficially
recycled in agriculture for enhancing soil productivity. In general, MSW generated
from lower income countries contains higher organic fraction as compared middle
income and higher income countries (Fig. 8.3). Paper content is generally maxi-
mum in MSW generated from high income countries (4–68%) and is minimum in
that from lower income countries (2–21%).
Solid wastes from Indian cities are found to contain 30–40% organic fractions,
followed by 30–40% ash and fine earth, 3–6% paper along with less than 1% each
of plastics, glasses and metals. The C/N ratio and the calorific value of these wastes
range between 20–30 and 800–1000 kcal kg�1, respectively (NEERI 1995).
8.1.3 Existing Methods of MSW Management in India
Urban solid wastes are managed and disposed off in various ways/means. Each
method has its own advantages, disadvantages and its implications on environment.
0%
10%
20%
30%
40%
50%
60%
70%
80%
90%
100%
LI LMI UMI HIC
Other (%)
Metal (%)
Glass (%)
Plastic (%)
Paper (%)
Organic (%)
Fig. 8.3 Average composition of MSW generated by countries under different income groups
(Daniel and Perinaz 2012)
196 8 Urban Activities in India Leading to Soil Pollution

Major methods of urban solid wastes management are discusses in the following
Table 8.1.
Methods of treatment and disposal of MSW varies widely with countries. The
most commonly practiced waste disposal methods in high-income countries are
landfilling and waste incineration (Daniel and Perinaz 2012). Whereas low- and
lower middle-income countries generally adopt open dumping (Fig. 8.4). In case of
middle-income countries (including India), landfills are poorly managed; and
therefore such kind of disposal is likely to be classified as controlled dumping.
For appropriate processing and disposal, the Municipal Solid Waste (Manage-
ment and Handling) Rules, 2000 in India recommend collection and transportation
of source-specific wastes. However current MSW disposal and management system
in India is poorly developed, particularly in respect of collection, transportation and
storage of MSW, segregation, processing and disposal of wastes (Sharholy et al.
2008; Kumar et al. 2009). The wastes generated in India are largely (more than
90%) disposed of by unscientific land filling or uncontrolled dumping on outer
reaches of towns and cities. These faulty practices have serious environmental
implications of global warming (act as a source of greenhouse gases emission)
(Sharholy et al. 2008; Narayana 2009). A survey in 59 cities conducted few years
back indicated that almost all the municipalities (58) follow uncontrolled dumping
of MSW, while 34 of them practice composting (Kumar et al. 2009). In Class-l
cities, about 94% of waste is thrown in land-dumping area and 5% of waste is
converted to compost. Incineration and biomethanation methods to generate energy
are followed only in one and three cities, respectively. Composting is considered as
most recommended method of disposal of municipal solid waste (MSW) by Min-
istry of Environment and .Forest, Government of India; as it causes minimum
impact on environment and generates useful product for nutrient deficit agriculture.
8.1.3.1 Solid Waste Collection and Disposal
As per the ideal solid waste management practice, MSW needs to be properly
collected; and biodegradable fraction needs to be properly segregated, composted
and disposed in the agricultural land after decomposition. If left uncollected and
decomposed, they are a cause of several problems such as blockage of drains,
barrier to movement of water, foul smell, generation of methane gas (a green house
gas, GHG), release of heavy metals and many chemicals to pollute the soil and
water flowing on its surface and propagate diseases particularly if contaminated
with hospitals wastes. Majority of Indian cities collect wastes through community
bins and dump in landfill areas; and a small fraction of uncollectable MSW lie on
road-side land areas (Kumar et al. 2009). Although composting remains most
preferred option, this form of waste processing is still very small (about 10% of
the total MSW collected).
In several parts of the world, landfilling is commonly practiced and is considered
as one of the cheapest waste management option. It requires large land space for
disposal and soil quality in the landfilling site is also degraded. Due to unscientific
8.1 Urban Solid Wastes and Their Use in Agriculture 197

Table 8.1 Major methods of urban solid management and associated risks
Methods Advantages Disadvantages
Reuse Resources can be saved due to reuse
of original materials and space for
landfill is also saved.
Adverse public perception; proper
cleaning & decontamination is
required for safe reusability; may
increase health risk to public
Recycling New usable products are produced
by recycling of wastes; saves energy
and resources for disposal; and gen-
erates revenue by selling the recy-
clable material
May require pretreatment to ensure
safe usability; perception of public
to use these products is unfavorable
On-site burial Saves transportation cost; lowers the
chance of pathogens spread; cost
effective; easily adopted; and rapid
method
Continuous environmental risk
assessment and monitoring is
required; major concern on future
land use, requires lot of space,
boundaries on approved sites;
adverse public response; requires
control of vermin and other vectors
Scientific landfill
disposal
Highly suitable and properly orga-
nized with adequate control
measures
Needs extensive transportation;
enhances chance of pathogens
spread from biological wastes;
unhygienic environment and odor
problem; limited capacity of each
landfill
Open burning Saves on-road waste transportation;
more suitable in remote areas and in
cold climatic areas lacking better
disposal options
Prohibited in certain sites as well as
for specific types of wastes; severe
atmospheric pollution and associ-
ated health issue; periodic air mon-
itoring is required; many
municipalities prohibit burning; not
effective in poor weather condi-
tions; poor public feedback; chances
of contamination to other areas
Incineration Toxicity of waste, disease causing
agents and volume of waste is
reduced; electricity is generated from
conversion of heat energy
Requires extensive transporta-
tion and associated costs; residues
still require safe treatment and dis-
posal; may produce undesirable end
products.
Anaerobic diges-
tion
(biomethanation)
Produces manure for agriculture and
methane gas for energy generation
Transportation concerns/costs; lim-
ited waste handling capacity; suit-
able only for segregated
biodegradable wastes; residues
require proper handling and techni-
cal support.
Composting Most environment friendly, eco-
nomically efficient; potentially use-
ful end product; saves space;
destroys human pathogens and mini-
mizes their spread; largely accepted
by municipalities and industry
Needs large separate space; requires
continuous care and periodic moni-
toring during composting; emits
foul smell; requires run-off and pest
control; requires normal ambient
temperature for effective
composting; poor public response
regarding usability of compost
198 8 Urban Activities in India Leading to Soil Pollution

method of waste dumping in most of Indian cities, leachates from landfill sites may
contaminate nearby land area as well as groundwater with heavy metals (Kanmani
and Gandhimathi 2013). According to an estimation by The Energy and Resources
Institute (TERI) report, the storage of solid waste generated in India during post-
Independence until 1997 requires nearly 71,000 football fields stacked with 9 m
high. In another scenario; it was reported that it has occupied 237.4 km2 by 2001
and may increased to 590.1 km2 by 2021 which is greater than the area of
Hyderabad (583 km2), the largest city in India area-wise. Moreover, if municipal
solid wastes are not properly handled, more than 1400 km2 of land would be
required for solid waste disposal by the end of 2047. Majority of Indian cities are
having community bin method of waste collection; and composting is the primary
method of waste processing wherever followed (Fig. 8.5) (Kumar et al. 2009).
Impact of Uncontrolled Dumping of Wastes in Landfill Area: In most of the big
cities, mixed MSW is being dumped over decades on the nearly fixed landfill area.
Due to methane generation in deeper layer of MSW dump and its oxidation in
presence of air, low level burning of wastes is a frequent phenomenon during dry
seasons (Fig. 8.6). Such MSW burning releases huge amount of dioxins in the
environment causing severe impact on human health and contamination of soil in
surrounding area (Minh et al. 2003; Devanathan et al. 2012). High intake of POPs
through contaminated air for respiration is suspected to be one of several causes of
early slow down among men in the metro cities (Subramanian and Tanabe 2007).
Also leaching from the unscientific landfill area causes contamination of surface
and groundwater bodies with toxic heavy metals and organic pollutants, resulting in
further spread of impact zone.
0%
10%
20%
30%
40%
50%
60%
70%
80%
90%
100%
High income Upper middleincome
Lower middleincome Lower income
Other
Incineration
Recycled
Compost
Landfills
Dumps
Fig. 8.4 Method of MSW disposal by countries under different income group
8.1 Urban Solid Wastes and Their Use in Agriculture 199

8.1.4 Composting Methods Followed in Indian Cities
Composting is considered the cheapest method of MSW disposal that diverts the
organic waste materials from landfills to useful manure for agricultural production.
The composting of urban solid waste had been focused, promoted and encouraged
by Government of India (GOI) in the early initiatives of MSW management. For
this activity, Ministry of Food and Agriculture provided several promotional offers
like soft loans to urban local bodies in the 1960s. In continuation of this programme,
loans and grants were also provided to state governments during 1969–1974 for
establishing MSW composting plants. In the later stages (in 1974), the MSW
composting was revived particularly in the cities with large number of population
22
8
13
Composting
Vermi-c
omposting
Was
te-to-energy
Biometh-anati
on
No. of cities
7
36
52
Door-to-door(Fully)
Door-to-door(partially)
Communitybin
No. of cities
Fig. 8.5 Waste collection and processing methods in Indian cities
Fig. 8.6 Toxic smoke generation due to burning of MSW at landfill area dumpsite
200 8 Urban Activities in India Leading to Soil Pollution

(over 0.3 million) through modified scheme introduced by GOI. Further, during
1975–1980, highly sophisticated and mechanized large capacity composting plants
(150–300 T day�1) were set up in the metropolitan and big cities under the central
government scheme of MSW disposal.
In pursuance of the directions of honorable Supreme Court of India, an Inter-
Ministerial Task Force was constituted by Government of India to look into the
possibility of safe use of city compost for integrated plant nutrient management
(IPNM). The report submitted by the Task Force in 2005 suggested that providing
sufficient technical and financial support for setting up of compost plant is a viable
option for promoting IPNM. However, majority of different cities don’t have any
facilities for composting even if, Municipal Solid Wastes (Management and Han-
dling) rules 2000 has been implemented to a certain extent. According to report by
Central Pollution Control Board (CPCB) regarding implementation status of
Schedule-IV, composting facilities existed in 63 cities of fourteen states and were
proposed to start in another 56 cities (CPCB 2015).
Annual composting potential from MSW in India has been estimated to vary,
depending on different composting methods, between 5 and 14 million tonnes of
compost which can provide about 1.2 to 2.5 lakh tonnes of N, P2O5 and K2O for use
in agriculture. Windrow method of composting is followed by majority of the
manufacturers, where mostly non-segregated or partially segregated wastes are
allowed to decompose for several months with or without turning. Composting is
performed in concrete pits in few cities. For proper and speedy decomposition of
biodegradable segment of the waste, microbial inoculants are sprayed in majority of
the composting plants. In 23% manufacturing sites surveyed, vermicomposting is
being adopted for producing good quality composts in shorter time (Saha et al.
2010a).
8.1.5 Quality of MSW Composts Prepared in India
Samples of MSW composts from 34 manufacturers in 29 cities of the country were
characterized for their physico-chemical properties as well as fertilizing potential
and heavy metal contamination potential (Saha et al. 2009). Different types of
preprocessing were adopted during MSW compost preparation. They are (i) Mixed
waste compost (MWC), (ii) Partially segregated waste compost (PSWC), and (iii)
Biowaste compost (BWC). In MWC method, non-segregated wastes are dumped as
such in heaps for several months for decomposition with or without turning.
Pre-processing is either followed poorly or not followed at all. This type of
composting process was predominantly adopted in many cities. In case of PSWC
method, large sized plastics, rubber, metals, etc. particularly non-degradable mate-
rials were manually removed prior to composting at composting yard. This is
adopted in several composting plants in the country. In few cities and towns,
8.1 Urban Solid Wastes and Their Use in Agriculture 201

biowaste compost (BWC) is prepared, where the segregation of biodegradable
wastes is done at generator level in two ways. The wastes are collected from either
biodegradable waste generating source like hotels and restaurant, vegetable market,
slaughterhouse etc. or individual households deliver segregated biodegradable
wastes separately to municipal organization during ‘door-to-door’ collection. Thelater method had been followed in few cities/towns such as Namakkal, Suryapet
and Vijaywada. Thereafter these biodegradable wastes are composted in pits or
heaps using earthworms. Compost prepared from biodegradable waste is termed as
‘biowaste compost (BWC)’.A survey indicated that compost prepared in Indian cities had low organic matter
and major nutrients (N and P); and heavy metal contents were quite high (Saha et al.
2010a). Composts prepared from biowastes (as in BWC) were of better quality with
higher amount of plant nutrients and lower degree of heavy metals contamination
when compared to those prepared from mixed wastes. On an average, the former
had 57%, 77% and 78% more organic matter, total N and total P, respectively than
the later. On the other hand, heavy metals content like Zn, Cu, Cd, Pb, Ni and Cr
was lesser in the former to the extent of 63%, 78%, 64%, 84%, 50%, and 63%,
respectively (Saha et al. 2010a). Even the partial manual segregation followed at
composting site did not significantly improve quality of compost. It had low
fertilizing parameters (organic matter, N, P) and high heavy metals. The quality
of compost produced from majority of MSW in Indian cities was below the
standards of guidelines of ‘The Fertilizer (Control) Order 1985’ in respect of total
organic C, total P, total K as well as heavy metals Cu, Pb and Cr. A compost grading
scheme was developed based on fertilizing value (index based on plant nutrients,
organic matter contents and relative importance of these constituents on crop
productivity) and contamination potential (index based on contents and relative
toxicity of different heavy metals). As per the scheme, composts are classified into
‘marketable’ grades (A, B, C and D with decreasing quality in sequence), ‘restricteduse’ grades (RU-1, RU-2 and RU-3; not marketable, but can be used for specific
purposes) and ‘unsuitable’ grade (may be incinerated or landfilled) (Saha et al.
2010a). A user-friendly software ’Compost Quality Evaluator’ can be downloaded
from www.iiss.nic.in/Software.html and used for evaluating the quality of MSW
composts based on this scheme. Quality of ‘biowaste compost’ prepared from
source separated biodegradable wastes was always better than ‘mixed waste com-
post’ and ‘partially segregated waste compost’ due to higher organic matter and
plant nutrient contents, and lower concentrations of heavy metals (Fig. 8.7). About
50% of the composts produced from mixed wastes were not suitable for agricultural
soil application because of very high metals content, 41% belonged to restricted use
(RU) classes (8% in RU-1 and 33% in RU-3) and remaining were classified under
marketable class D. Variability in feedstock mixture and degree of segregation has
caused such a large variation in grades of composts prepared from partially
segregated MSW.
In order to safeguard the land resources from pollution and to ensure minimum
manurial value, Government of India enforced quality control limits for MSW
compost through Fertilizer Control Order (FCO). In order to be eligible for
202 8 Urban Activities in India Leading to Soil Pollution

marketing, MSW compost sample has to comply with all the 21 quality parameters
specified in the FCO. However, none of the compost samples from 29 cities
complied fully with the FCO limits, despite sincere efforts by several
municipalities.
Although information on the total heavy metals concentration in compost is
necessary for quality control purpose, this is insufficient for evaluating exposure
risks and potential toxic effect to environment. Toxic effect of heavy metals present
in MSW composts generally depend on their distribution and extractability in
different fractions (Petruzzelli et al. 1989). Distribution in different size fractions
and their extractability by dilute acid and alkali were investigated on MSW
compost samples prepared in different Indian cities (Saha et al. 2013). Results
indicated that bigger size particles (>0.5 mm) constituted the major size fraction in
all the composts samples and contained relatively less organic carbon and heavy
metals as compared to finer size fractions. Concentration of the heavy metals
increased with decreasing sizes of compost particles and the effect was more
pronounced in mixed wastes and partially segregated wastes composts (Fig. 8.8).
Acid extracted Cd, Zn, Ni and Pb to a greater extent than these extracted by alkali;
and this difference in extraction was wider in high mineral matter containing MWC.
On the contrary, dilute alkali extracted Cu and Cr more, particularly in composts
having relatively higher amount of organic matter (i.e. BWC). Contents of water-
soluble metals (except Cr) were comparatively lower in biowaste compost than
either in mixed waste compost or compost prepared from partially segregated
wastes or both. The major factors that influenced the water-soluble metals in the
composts were total and water-soluble C and pH, rather than the total HM contents
itself. The heavy metals occluded by fine particles present in MWC and PSWC has
the potential to move to the deeper soil profile layers and, thus, can pollute greater
volumes of soil in the rhizosphere.
0.00
1.00
2.00
3.00
4.00
5.00
Fertilizing index Clean index
Mixed waste compostPartially segregated waste compostBiowaste compost
Fig. 8.7 Impact of
segregation of wastes on
fertilizing potential and
heavy metal pollution
potential of MSW
composts. Higher
‘Fertilizing index’ indicatebetter manurial value and
higher ‘Clean index’indicates lower toxicity due
to heavy metals
8.1 Urban Solid Wastes and Their Use in Agriculture 203

8.1.6 Impact of MSW Compost on Soil and Crop Quality
MSW compost may increase soil heavy metal concentrations after its repeated
application in agricultural land as organic fertilizer or as soil amendment. It is
reported that different field and horticultural crops can take up heavy metals from
MSW compost amended soils (Pinamonti et al. 1999). The availability of such trace
heavy metals varies with compost maturity. As compost matures, the availability of
metals decreases as they bind to the humic materials in the compost and binding
strength tend to increase during the maturity of compost. The food chain contam-
ination due to application of MSW compost in soil depends by and large on metal
concentration in the compost and the source of raw-material used for composting.
When compost is prepared from mixed MSW, heavy metals concentration tends to
increase as compared with feedstock. On the other hand, the biowaste compost
i.e. MSW compost prepared from segregation of waste at source contains minimum
metal concentrations. Moreover, the lower heavy metal content in the finished
product is observed when the sorting of waste is done at the earliest possible
stage, such as while during collection of wastes or before initiation of the
composting process. Total heavy metals content in the composts generally is not
thought to be crucial for mobility and bioavailability. The extraction or absorption
experiments can be adopted to assess their contents in mobile and bioavailable
fractions. Bioavailable fractions of heavy metals can be estimated by extracting
composts with water, neutral salt solutions, and chelating reagents like
Ethylenediaminetetraacetic acid (EDTA) and diethylenetriaminepentaacetic acid
(DTPA).
The occurrence of organic toxins in MSW compost has been reported by many
workers and these are highly chlorinated and may persist long time in the
0
10
20
30
40
50
60
MWC PSWC BWC
mM
/ K
g dm
F 0.5
F 0.25
F 0.125
F0.075
F cf
Fig. 8.8 Effect of segregation of waste feedstock on concentration of total heavy metals (Cd, Cr,
Cu, Ni, Pb and Zn) in different size fractions of composts
204 8 Urban Activities in India Leading to Soil Pollution

environment. The sources of organic pollutants in MSW are primarily household
wastes such as solvents and oils, printed paper products, and pesticides. It was
confirmed from the survey made on various municipal and commercial wastes that
phthalate esters were more prevalent among the xenobiotic compounds present in
MSW composts (Düring and Gath 2002). Further, the mixed MSW composts had
higher concentrations of polychlorinated biphenyls (PCB), dioxin/furans (Logan
et al. 1999). On the other hand, risks to ecosystem due to PCBs were estimated to be
small with use of source-segregated biowaste compost in agricultural land. Appli-
cation of waste derived composts contaminated with persistent organic pollutants to
pasture land may pose health risks to grazing animals and subsequently to human
through milk/meat products (Smith et al. 2001).
8.2 Use of Urban Wastewater in Agriculture
Agricultural production and productivity in India largely depends on the availabil-
ity of irrigation water due to unpredictability of monsoon rainfall in large part of the
country. Demand for irrigation water is mostly met from groundwater surface water
bodies like rivers and lakes. Although irrigation with surface water bodies is
cheaper as compared groundwater sources, its availability is major constraints in
most areas. Even if inefficient, groundwater irrigation covers more than half of the
total irrigated area and contributes for 70% of production. However, groundwater
reserve in most of the areas is depleting fast due to its higher withdrawal rate as
against its rate of replenishment. In view of shortage of irrigation water vis-�a-vis itsrequirement, farmers try to exploit whatever water sources available to them at
lower cost. Due to its availability at almost free of cost, irrigation of agricultural
lands with urban wastewater (UWW) is common practices in peri-urban areas
(Sharma and Kansal 1986; Kansal 1992; Ghimire 1994; Dotaniya et al. 2015).
Farmers in peri-urban areas usually grow vegetable crops or other perishable
commodity like fodder throughout all seasons of the year with high cropping
intensity (300–400%) and generate higher (four times more) income from a unit
land than the freshwater irrigated farmers (Minhas and Samra 2004).
Worldwide, more than 800 million farmers are involved in urban agriculture.
Out of which about 200 million farmers use marginal quality water for crop
production due to scarcity and unavailability of good-quality water (Qadir et al.
2010). However, statistics on the extent of irrigation with UWW is lacking and no
clear estimates are available at present on this regard. It is estimated that effluents
generated from large cities have the potential to irrigate 21,000 ha to a depth of
7.5 cm on daily basis or 7.8 million hectares on annual basis (Minhas and Samra
2004). WHO (2006) has estimated that about 1.0–1.5 million hectares of land area
is irrigated annually with sewage waters in India.
8.2 Use of Urban Wastewater in Agriculture 205

8.2.1 Wastewater Generation and Treatment Capacity: AMeta-analysis
Urban wastewater from cities is the highest quantity of waste generated from
human activities. Input into this form of waste occurs from three main sources:
domestic, commercial and runoff/storm water during certain climatic events. Dis-
charge of UWW into surface water bodies, particularly in the middle and low
income countries, has been ascribed as major factors responsible for deterioration
of lakes and rivers water quality due to contamination with above pollutants. Lack
of sewerage connection and sewage treatment facilities has been ascribed as
principal causes for this (Fig. 8.9). According to the 4th World Water Development
Report, only small part (20%) of UWW generated worldwide is properly treated to
remove or reduce pollutants load to an acceptable level (UNESCO 2012). Waste-
water treatment capacity in general depends on the income level of the country with
the figure being 70% of the generated wastewater in high-income countries as
compared to only 8% in low-income countries (Sato et al. 2013).
Major fraction (75–85%) of the water used for domestic purpose comes out as
wastewater which requires appropriate treatment before disposal (Qadir et al.
2010). According to CPCB report, about 38,254 million liter per day (MLD)
sewage water was being generated from Class-I cities and Class-II towns, out of
which only 11,554 MLD (32%) were subjected to treatment before throwing away
(CPCB 2009). The projected UWW generation for the country has been estimated
as 122,000 MLD by 2050 (Bhardwaj 2005). UWW generated by domestic, munic-
ipal and industrial activities finds its way in large numbers of open and covered
channels and finally mixes up with surface water bodies. Cities around Ganga basin
were generating 2637.7 MLD of UWW with treatment capacity of 44.2% only
3.612.7
53.6
86.8
0.02 2
13.8
78.9
LI LMI UMI HI
Sewerage connection Sewerage connection & treatment
Fig. 8.9 The population (in %) under different income group countries having access to sewerage
connection in 2010 (Adapted from Baum et al. 2013)
206 8 Urban Activities in India Leading to Soil Pollution

(CPCB 2009). Therefore, a large fraction of untreated UWW pollutes the river
Ganga. Due to operation and maintenance related problems, existing sewage
treatment plants (STPs) are not being effectively utilized.
8.2.2 Impact of Urban Waste Water on Soil Quality
Urban wastewater is an obvious by-product of urban society and originates mainly
from households (domestic wastewater) and also due to municipal activities. Such
domestic wastewater may often be contaminated with industrial effluent
(depending on the industrial profile in particular area/region) and occasionally
with run-off from rainwater. A number pollutants and contaminants are found in
UWW which can be classified into:
– Nutrient elements for plants and microbes (N, P, K, S, Ca, Mg and other
micronutrients)
– Heavy metals and toxic elements (Cd, Pb, Ni, Cr, Hg, Cu, As etc.)
– Pathogens (viruses, salmonella, coliforms, helminthes and many other bacteria
and protozoa)
– Organic pollutants (pesticides, PCBs, PAHs, detergents, cosmetics, antibiotics
and other pharmaceuticals)
Composition of urban wastewater varies widely depending upon treatment
methods (if any), quality of water supplied in the cities, contamination of industrial
effluents (if any). Typical composition of untreated UWW is given as below in
Table 8.2. In general, untreated UWW contains higher organic substances, N and P
as compared to wastewater from treated textile industry and contaminated ground-
water (Table 8.3).
8.2.3 Carbonaceous Components in UWW and Its Impacton Soil Processes
Urban domestic wastewater (sewage) is mainly composed of carbonaceous organic
materials. High content of carbonaceous organic materials in sewage also indicates
higher concentrations of contaminants. High organic materials leads to development
anaerobic processes in the water body and consequently, emission of offensive odour.
Domestic and/or agro-industrial activities (e.g., food processing) are the main source
of the organic substances detected in the UWW. The estimated contribution of
organic C by domestic use (g�1 capita�1 day�1) is faeces 17, urine 5, dishwashing
and food preparation 8, and laundry 7. The rate of generation of organic N through
faeces, urine, dishwashing, and food preparation is normally 1.5, 1.7, 0.2 and 0.2 g�1
capita�1 day�1 respectively. The organic matter found in sewage effluent is present in
different physical phases. The organic C in the effluent is present as soluble, fine
8.2 Use of Urban Wastewater in Agriculture 207

suspended and coarse suspended forms. The contents of C (as % of total) in soluble,
fine suspended particle and coarse suspended particle were found at 52%, 9% and
39% respectively in the effluent obtained from activated sludge process, and at 69%,
6% and 25% in the effluent obtained from trickling filter plants respectively (Hunter
and Kotalic 1974). Manka et al. (1974) identified different organic constituents of
sewage water as below in Table 8.4.
Soil organic matter plays important role in influencing soil structure and soil
stability as well as in supplying nutrient elements essential for plant growth. The C
cycle in soil consists of various reactions in which microorganisms play significant
roles. Due to its content of considerable carbonaceous material, UWW also adds
Table 8.2 Typical
composition of untreated
UWW of domestic origin in
developing countries
Parameter
Concentration
Range
Total solids (ppm) 700–1350
Suspended 200–450
Dissolved 500–900
Organic load (mg L�1)
Total organic C 80–290
BOD5 250–400
COD 450–800
Total Nitrogen (mg L�1) 35–60
Organic N 15–25
NH4–N 20–35
NO3–N Trace – 2
Total phosphorus (mg L�1) 4–15
Organic P 1–6
Inorganic P 3–9
pH 6.7–8.0
EC (mS cm�1) 0.7–1.2
Heavy metals (μg L�1)
Cd Trace – 4
Cr 10–40
Cu 30–100
Pb 25–80
Hg Trace – 3
Ni 10–40
Ag 3–10
Zn 100–300
Pathogen (cfu mL�1)
Total coliforms 107–1010
E. coli 106–109
Faecal streptococci 104–107
Helminth eggs 1–1000
Sperling (2007) and Henze and Comeau (2008)
208 8 Urban Activities in India Leading to Soil Pollution

significant quantity of organic matter to the soil. However during standard treatment
processes, most of the organic matters get removed from raw UWW. Consequently,
the characteristic chemical oxygen demand (COD), biological oxygen demand
(BOD) and total organic carbon (TOC) levels found in treated effluents are much
lower than in the original UWW. Irrigation with UWW adds considerable but
variable amount of organic matter in agricultural land. The quantities of organic C
added to the soils through treated effluent irrigation are relatively lower compared to
organic C added through manure. For instance, an annual addition of 1000 mm of
typical sewage effluent containing a TOC level of 50 mg L�1 adds only 500 kg ha�1
of organic carbon. Ciaccio (1971) estimated that sewage water contains about 34 mg
L�1 non-volatile (15.2% of total soluble C) and 25 mg L�1 volatile (11.3% of total
soluble C) organic acids, which have significant metal complexing capacity besides
providing C (@ 90 mg L�1) to the soil. The organic acids in UWW include formic
acid, acetic acid, butyric acid, propionic acid, valeric acid, caproic acid, besides
Table 8.3 Average chemical characteristics of contaminated irrigation water from different cities
of Madhya Pradesh
Parameters
Contaminated groundwater near
Ratlam industrial area
Wastewater
from Nagda industrial
area
Urban
wastewater from
Bhopal city
mg L�1
NH4–N Tr. 9.13 19.11
NO3–N 7.34 2.15 5.5
K 3.76 35.9 23.36
P Tr. 1.34 21.6
SO4–S 64.64 534.4 5.59
Organic C 76 105 214
Saha et al. (2014)
Table 8.4 Typical organic constituents of sewage water
Constituents
Stabilization
pond
Domestic sewage water (extended aeration
activated sludge)
COD range (mg L�1) 120–153 106–167
Anionic detergents (% of
COD)
12.2 16.0
Carbohydrates (% of
COD)
7.8 4.6
Tannins (% of COD) 2.1 1.0
Proteins (% of COD) 21.1 23.1
Fulvic acid (% of COD) 26.6 24.0
Humic acid (% of COD) 14.7 6.1
Hymatomelanic (% of
COD)
6.7 4.8
Adapted from Manka et al. (1974)
8.2 Use of Urban Wastewater in Agriculture 209

humic acid and fulvic acid. These organic acids have significant influence on several
soil processes due their high metal complexing ability.
Friedel et al. (2000) studied the effect of long-term sewage water irrigation (upto
80 years) on soil organic matter, soil microbial biomass and biological activities in
agricultural soils of Mexico. Total organic C content increased 2.5 fold from initial
level along with significant increase in potential mineralizable C and dissolved organic
C in Ap horizons of Vertisols. Soil microbial biomass C and their activities increased
with years of irrigation (25–80) and TOC accumulation which consequently increased
potential mineralizable C. However, ratio of potential mineralizable C and total
organic C (Cminp: TOC) didn’t change appreciably with TOC accumulation indicating
that organic matter from UWW is no different from native organic matter in the
surface horizon (Ap). Aapplication of untreated UWW for 5 years leads to significant
and maximum increase in organic C (SOC) in 15–30 cm depth of soil profile (Saha
et al. 2010b). Carbon added through sewage water might have percolated down
through cracks and macropores and accumulated in the subsoil layers. The uppermost
soil layers showed little SOC build-up. This was because of frequent tilling of upper
layers resulting in considerable oxidation and mineralization of the accumulated C. On
the contrary, C entered in the deeper layer are sequestered for longer period since
being less exposed to microbial attack. High metal build-up due to application of
contaminated organic matter in soil has been found to increase accumulation of
organic matter in soil and to decrease soil microbial biomass (Chander and Brooks
1991). While surveying contaminated sites in Italy, Valsechhi et al. (1995) observed
close positive relationship for organic matter with heavy metals content in soil.
Negative relationships were observed for the heavy metals contents with both soil
respiration and specific respiratory activity (ratio between evolved CO2�C and
microbial biomass C per unit time). Therefore sequestration of C applied through
UWW in soil depends on level of heavy metals carried along with it. Friedel et al.
(2000) did not find C sequestration potential of UWW applied C due to lower heavy
metals concentration. Amorphous iron and aluminum oxides usually found in sewage-
sludge also play an important role in soil organic C accumulation.
Sewage irrigation for several decades also increased denitrification capacities,
but decreased adenylate energy charge ratio (AEC) in soils (Friedel et al. 2000).
Measurement of the AEC ratio indicates the growth state of natural microbial
communities and the effect of environmental changes on them. These changes
were ascribed due to the addition of surfactants, particularly alkyl benzene sulfo-
nates (effect on denitrification capacity) and addition of Na and salts (effect on
AEC) through sewage. Denitrification loss of soil/sewage N in the form of N2O has
tremendous global warming potential.
8.2.4 Nutrient Potential of Sewage Water
Untreated UWW has a good nutrient potential in crop husbandry. Typical nutrients
concentrations in sewage water are 20–85 mg N L�1, 4–36 mg P L�1, 7–20 mg K L�1,
10–50 mg S L�1 besides other nutrients. Since the amount of N in sewage effluents
210 8 Urban Activities in India Leading to Soil Pollution

is high, the C/N ratio is low (typical values are 5), and a release of mineral N from
sewage borne organic substances is favoured. Such sewage water, mainly in its raw
(untreated) form in India, is used extensively as source of irrigation water in the
nearby area of sewage creeks mainly for fodder and vegetable production. In
general, yield of most crops were significantly higher in UWW irrigated fields as
compared to those in groundwater irrigated fields; and crops in sewage effluent
treated area respond less to NPK application compared to those in groundwater
treated area. Changes in fertility parameters of Vertisol due to irrigation with
different types of polluted water (contaminated groundwater, treated industrial
wastewater and untreated UWW) was compared (Saha et al. 2014). Long-term
use of different types of polluted irrigation water increased soil organic C (SOC)
contents considerably; the maximum average magnitude of increase was recorded
with UWW (125%). Irrigation with UWW also increased available P and K content
in soil to a maximum level, followed by industrial wastewater (Table 8.5).
Although concentrations of K in both UWW and industrial wastewater (IWW)
were almost similar, the high available of K in UWW irrigated soil may be due to its
exhaustive use in crop production.
Table 8.5 Influence of different types of wastewaters on soil chemical properties
Unpolluted area Polluted area
Mean Range Mean Range
Industrial waste water
Organic C (%) *0.5a 0.3–0.8 0.7b 0.3–1.0
Available-P (μg g�1) 11.3a 5.9–22.3 18.5b 14.9–23.0
Available-K (μg g�1) 177a 110–300 270b 145–454
Available S (μg g�1) 16a 8–19 659b 372–1104
Conductivity (mS/m) 0.74a 0.32–1.24 4.03b 0.35–12.9
ESP 1.51a 1.1–1.9 31.18b 2.2–46.1
Polluted groundwater
Organic C (%) 0.5a 0.1–0.9 0.7b 0.4–1.0
Available-P (μg g�1) 16.6a 11.5–43.7 18.7a 16.0–22.4
Available-K (μg g�1) 189a 128–293 230b 171–332
Available-S (μg g�1) 15.1a 3.2–22.1 28.2b 16.8–57.3
Conductivity (mS/m) 0.32a 0.22–0.99 1.83b 0.49–5.01
ESP 2.71a 1.2–4.3 6.96b 1.3–24.2
Untreated urban wastewater
Organic C (%) 0.50a 0.30–0.77 1.13b 0.45–1.8
Available-P (μg g�1) 9.75a 4.6–19.3 26.5b 5.1–140.9
Available-K (μg g�1) 144a 73–219 669b 375–821
Available-S (μg g�1) 21a 7–40 31b 5–59
Conductivity (mS/m) 0.17a 0.12–0.21 0.31a 0.13–0.52
ESP 1.3a 0.90–1.9 1.6a 1.2–2.6
*The same letter in a row indicated on the mean values are not statistically different among them at
5% probability level
8.2 Use of Urban Wastewater in Agriculture 211

Several on-farm experiments have shown considerable enhancement of crop
yields due to use of treated or untreated UWW vis-�a-vis use of groundwater,
indicating considerable nutrient supplying potential of the former. In a field exper-
iment at Bhopal, untreated UWW irrigation (containing on an average, 214, 27, 22
and 23 mg L�1 of total organic C, N, P and K respectively) of about 150 cm over a
period of 5 years on pristine agricultural land (having no history of sewage
irrigation) didn’t affect any major soil chemical parameters adversely, except for
a slight increase in salinity (Saha et al. 2010b). Sewage water irrigation for 5 years
to wheat crop added about 321 kg N, 262 kg P and 282 kg K ha�1 to the soil. This
increased the available N, P and K contents by 11.4%, 44% and 17% respectively,
in UWW irrigated root zone soils as compared to ground water irrigated soils.
While fertilizer P application didn’t enhance its content in sub-surface layer,
continuous irrigation with UWW showed significant increase in P content in the
below root zone depth, due to its (mainly in organic P form) percolation down the
profile through cracks in soil. Irrigation with UWW also significantly improved
availability of micronutrients like Zn, Fe and Mn in the soil. However, sole
application of sewage water was not sufficient to supply nutrients necessary to
maintain the productivity of wheat that obtained through the recommended level of
fertilizers. An additional N application (50% of recommended level) through
fertilizers was required to obtain higher productivity of wheat under sewage
farming. Irrigation with UWW in wheat crop had significant residual effect on
grain (11% more) and straw (33% more) yields of following soybean crop. Recov-
eries of N, P and K by the aboveground biomass of the cropping system were
considerably more from the nutrients supplied by UWW than those supplied by
fertilizers and manures (Saha et al. 2016). In another study, UWW increased
population of nitrogen fixing bacteria, P solubilising organisms and pH in rhizo-
sphere of peas in Hill soil, West Bengal (Saha and Tarafdar 1996). The long-term
effects of waste water irrigation on soil fertility and nutrient supply to lucerne
(Medicago sativa) was investigated near Mexico City (Siebe 1998). Wastewater
irrigation increased total N and available P but diminished the Ca saturation of the
soil by displacing Ca by Na. In consequence, Ca concentration decreased, while P
and Na increased in lucerne tissue after 80 years of WW irrigation. Similar report of
considerable increase in total and available P content has been observed in farmers’field (Vertisol) at Bhopal due to long-term untreated sewage water irrigation (Saha
et al. 2014). Potential impacts of long-term sewage irrigation on soil health were
investigated at peri-urban area of Delhi, where crop fields were being irrigated with
UWW for more than 20 years and results were compared with an adjacent rainfed
Leucaena leucocephala plantation system (Masto et al. 2009). The study revealed
that irrigation with sewage caused substantial build-up of DTPA extractable Zn
(by 314%), Cu (by 102%), Fe (by 715%), Mn (by 197.2%), Cd (by 203%), Ni
(by 1358%) and Pb (by 15.2%). Sewage irrigated soil showed a significant decrease
in microbial biomass carbon (by �78.2%), soil respiration (by �82.3%), phospha-
tase activity (by �59.12%) and dehydrogenase activity (by �59.4%). In the study,
microbial biomass carbon was chosen as the most sensitive indicator for assessing
the effect of UWW irrigation. On the contrary, irrigation with about 150 cm of
212 8 Urban Activities in India Leading to Soil Pollution

untreated UWW over five years caused significant increases in several enzyme
activities as well as population of fungal, and actinomycetes in vertisol (Table 8.6).
8.2.5 Plant Nutrient Recovery from UWW
Recycling of nutrients removed by crops is advocated as a strategy under integrated
nutrient management to mitigate fertilizer demand in agriculture. It has been
estimated that the daily nutrient supplying potential of waste water generated in
Indian cities is about 750, 250 and 760 tonnes of N, P and K, respectively based on
the huge volume of UWW generated and its average nutrient content (CPCB,
2009). This value was corresponding to about 3.6% of the total fertilizer nutrient
(N þ P þ K) consumption during 2007–2008. Therefore recycling and recovering
of nutrients from wastewater can be very useful and additionally, it delivers the dual
benefits of purification of polluted water and reduction in the amount of fertilizers
requirements. Saha et al. (2016) had studied the nutrient recovery from untreated
UWW through a field experiment where, nutrient removal by wheat-soybean
cropping system was estimated. The highest nutrient recoveries from UWW were
observed in crops grown with no additional nutrient application. During the six
years of experiment, about 80%, 40% and 87% of N, P and K supplied through
UWW has been recovered by above-ground biomass of the crops. The highest N
had been recovered by wheat grain, whereas the highest P and K were taken up by
soybean straw. Moreover, the recovery of 31% N, 22% P and 69% K supplied
through UWW was found in the straw portion of the crops, which can be further
recycled back into the agricultural land through different residue recycling tech-
nologies. In addition, available status of these nutrients in soil has increased with
continuous untreated UWW irrigation, extent of their recovery is expected to
Table 8.6 Changes in microbial properties of soil due to sewage irrigation
Parameters
Groundwater irrigated
plots
UWW irrigated
plots
1 Dehydrogenase activity (mg $TPF/g soil/h) #0.133b 0.144a
2 Alkaline phosphatase activity (mg *PNP/ g
soil/h)
9.44a 7.84a
3 Urease activity (μg NH4–N/g soil/2 h) 51.9a 44.9a
4 Microbial biomass C (μg/g) 37.0b 53.9a
5 Basal respiration (g CO2–C /m2/ day) 2.47b 3.01a
6 Fungi population (103 cfu/g) 6.6b 14.8a
7 Bacterial population (1010 cfu/g) 15.9a 23.7a
8 Actinomycetes population (103 cfu/g) 57.2b 100.2a
9 Total coliform (cfu/g) 0.7b 16.0a
Saha et al. (2010b)#The same letter in a row indicates means are not significantly different (@ P � 0.05)$TPF triphenyl formazan*PNP p-nitrophenol
8.2 Use of Urban Wastewater in Agriculture 213

increase with the progress of sewage farming. The study concluded that sewage
farming can be promoted as a way for nutrient recovery through non-vegetable and
non-fodder crops like wheat-soybean cropping system, which is predominantly
followed in central India. Recovered nutrients in the plant biomass can be converted
into organic manure for application in groundwater irrigated agricultural land. In
this way, costly fertilizer inputs in agriculture can be reduced and nutrient enrich-
ment of surface water bodies (eutrophication) due to mixing/accumulation of
polluted sewage effluent in the water bodies can be minimized.
8.2.6 Environmental Concern due to Use of UWWfor Irrigation to Crop
8.2.6.1 Environmental Impact due to High N Content in UWW
Loss of N from agricultural land has severe environmental implications. Nitrous
oxide escaped into atmosphere through denitrification process may contribute
to global warming. Significantly higher loss of N (about 40–55%) has been
observed in UWW irrigated fields (either fertilized or non-fertilized) through
denitrification as compared to fresh water irrigated plots where N loss was in the
range of 10–40% (Dag et al. 1984). Further downward movement of considerable
amount of NO3� in the profile irrigated with sewage water during 7 years of study
has been documented (Feigin et al. 1991).
In agricultural areas near Santiago, about 780 kg N per ha was supplied each year
in vegetables growing fields (principally spinach beet, lettuce and celery) through
irrigation with untreated contaminated sewage water/effluent generated from the
cities (Schalscha and Vergara 1982). Long-term (>25 years) use of such untreated
sewage water exclusively for irrigation led to leaching of about 350 kg nitrate-N ha�1 per year, which contaminated groundwater through downward movement of
percolating water (Schalscha et al. 1979).
The oxygen level in the soil profile is reduced due to use of sewage water/
effluent with a high BOD value, which in the consequence may enhance denitrifi-
cation process in the soil. Denitrification is microbially mediated loss of NO3� as
N2O and N2 gases under anoxic conditions and has considerable agricultural and
environmental implications (N2O is an important greenhouse gas). In a green house
experiment, significant increase in denitrification rate was observed with sewage
effluent irrigation of clay soil (Feigin et al. 1981).
8.2.6.2 Crop Contamination with Pathogens
Choice of crops grown with UWW is very important as there is several human
health issues involved with sewage farming. As the UWW contains various kinds of
pathogenic organisms like bacteria, viruses, protozoa, helminthes, etc., use of such
214 8 Urban Activities in India Leading to Soil Pollution

waters for irrigation may expose the public to the peril of infections. Therefore
microbiological quality of the sewage water governs its suitability for use in
agricultural activities. According to WHO guidelines, no crops which is eaten
raw, should be grown with sewage water if it contains more than 100 coliform
organisms in 100 mL. Transmission of diseases to human being by sewage farming
may occur, directly when the farmers have physical contact with the contaminated
waste water and/or indirectly by consumption of contaminated food materials/
produce grown. The pathogenic microorganisms that reach the soil and the crop
plants through these route may survive for days, weeks and at times for months. For
instances, the presence of significant amount of total coliform population in con-
taminated wastewater treated plots were observed even after harvest of the wheat
crop (Table 8.6) (Saha et al. 2010b). These are a group of pathogenic organisms that
cause acute gastroenteritis in mammals. Analysis of 344 samples of edible portions
of various crops indicated that vegetables and fodder crops cultivated with UWW
over a longer period were severely contaminated with coliforms while the contam-
ination of grains was insignificant (Minhas et al. 2006). Further it has been pointed
out that the plant parts that have direct contact with untreated waste water are
severely loaded with these pathogenic microbes. Sun drying of such produce
(e.g. grain) in the field reduced the contamination level. The microbial loads in
vegetables enhanced considerably due to the storage of vegetables harvested from
sewage irrigated area. Contaminated waste water use for irrigation or its accidental
entry in pasture lands by overflow increases the chances of animal sickness due to
Salmonella aberdeen (Bicknell 1972).
8.2.6.3 Soil Pollution with Heavy Metals due to Urban Waste Water
Several reports have also indicated that heavy metal contents in sewage water are
within the permissible limit (Brar et al. 2000; Rattan et al. 2002; Yadav et al. 2002).
A comparison among polluted irrigation water from different sources indicated that
heavy metals contaminations were generally lower in municipal waste water than
the industrial wastewater and contaminated groundwater near industrial area
(Table 8.7). Though sewage water/effluents contain low concentration of heavy
metals, their accumulation in soils may take place through long term intensive appli-
cation of the contaminated waste waters in land for agricultural purposes. The
degree and amount of metal build-up in the soils irrigated with contaminated waste
water is mainly related to the frequency and period of its application (Bansal et al.
1992; Palaniswami and Sree Ramulu 1994). Number of studies conducted world-
wide demonstrated different level of heavy metal accumulation in waste water
irrigated soils (Nyamanagara and Mzezwa 1999; Cao and Hu 2000; Singh et al.
2004; Mapanda et al. 2005). In India too, several studies have reported buildup of
trace metals in soils at variable degree due to long term application UWW for
irrigation (Brar et al. 2002; Rattan et al. 2005). Several researchers reported
increases in DTPA-extractable trace metal elements in the root zone soil layer to
the range of 30–400% in various cities of India due to several decades of UWW
8.2 Use of Urban Wastewater in Agriculture 215

irrigation (Rattan et al. 2005; Simmons et al. 2006; Dheri et al. 2007; Kharche et al.
2011). Bouwer and Chaney (1974) estimated that at normal application rate, greater
amounts of metal are likely to contaminate the soil in one year through biosolid
(sludge) than the magnitude of contamination expected through a century of
effluent irrigation. There are several reports of heavy metal accretion in soil due
to sewage effluent irrigation over a long period. Friedel et al. (2000) found
significantly high amount of Cd, Cu, Pb and Zn in soils irrigated with wastewater
for 25–80 years as compared to nearby soils under rainfed agriculture in Mexico. In
chile, continuous application of sewage water for long period resulted significant
migration of Cu, Cr, Cd, Co, Zn and Ni downward from upper soil (ploughed) layer
(Schirado et al. 1986); which was supposed to be due to increased mobility through
complexation by dissolved organic C.
8.2.6.4 Irrigation with Municipal Sewage Water and Heavy Metals
Contamination in Crops
Crops grown on the heavy metal contaminated soils can cause health problems to
animals and human beings when the food materials from such area accumulate
these toxic metals in excessive quantities (Tiller 1986; Rattan et al. 2001; Gupta
et al. 2010). Vegetables raised on UWW irrigated soils in various parts of India
have shown significant contamination with many heavy metals (Brar et al. 2000;
Khurana et al. 2004; Ghafoor et al. 2004; Sharma et al. 2007; Gupta et al. 2008;
Gupta et al. 2010; Saha et al. 2015). Accumulation of metals in soil due to
continuous application wastewater in and around Varanasi, India for irrigating
vegetable crops has been studied (Singh and Agarwal 2010). The enrichment factor
(indicates accumulation in reference to pre-contamination era) in soil for Cd, Cr,
Zn, Cu and Pb was 1.9, 2.9, 4.8, 6.5 and 15.5, respectively and the degree of
contamination (indicates accumulation in reference to background level) of these
Table 8.7 Average chemical characteristics of water used for irrigation purposes in Bhopal,
Nagda and Ratlam
Ratlam Nagda Bhopal
Unpolluted
groundwater
Contaminated
groundwater
Unpolluted
groundwater
Industrial
wastewater
Unpolluted
groundwater UWW
Concentrations in mg L�1
Zn 0.02a1 2.66b 0.025a 0.260b 0.015a 0.070a
Cu 0.010a 0.068b 0.014a 0.046b 0.011a 0.035a
Pb 0.003a 0.032b 0.004a 0.007a 0.004a 0.021b
Cd Tracea 0.001a Tracea Tracea Tracea 0.001a
Cr Tracea Tracea Tracea 0.008a 0.005a 0.027b
Ni 0.002a 0.026b 0.002a 0.014a 0.013a 0.015a
Saha et al. (2014)1Means followed by the same letter in a row for a particular location are not statistically different
among each other at p < 0.05 significance level
216 8 Urban Activities in India Leading to Soil Pollution

metals in soil was also found to be 2.9, 2.0, 2.3, 2.7 and 2.2, respectively. High
enrichment factor values (>2) indicates considerable accumulation of heavy metals
(except Cd) in soil due to continuous sewage irrigation (refer Chap. 7 for details on
interpretation). The maximum concentration of Zn, Cu, Cr, Pb and Cd was observed
in Brassica oleracea and the corresponding metal levels in plants were 63.80,
12.25, 10.65, 3.63, and 0.56 mg kg�1, respectively. However leafy vegetable
spinach, grown with untreated sewage water, had high heavy metals uptake and
translocation ratio. Among the metals, maximum uptake was observed for Mn,
followed by Zn, Cu, Pb, Ni Cr and Cd, respectively. In another study from untreated
sewage water irrigated areas of Kolkata city, concentrations of Cd, Pb and Ni in the
most of the commonly grown vegetables and tubers were above the permissible
limit (Saha et al. 2015). Cauliflower had the highest mean transfer coefficients
(TCs) of 0.59 for Zn, Colocasia for Cu (0.67) and Cd (1.02), Amaranthus for Pb
(0.93) and Ni (1.09), respectively. Enrichment factors computed for the area
indicated that soils were highly contaminated with different toxic metals such as
Cd (452.04, indicating extremely high contamination), Pb (17.32, indicating high
contamination), Zn (5.99, indicating significant contamination), Cu (3.14, indicat-
ing significant contamination) and Ni (3.07, indicating moderate contamination
level). This indicates, use of UWW for irrigation for a long period not only
contaminate the soil by significant heavy metals loading, but also resulted in
heavy metal enrichment of crop plants beyond the acceptable critical values of
WHO, which therefore, may not be appropriate for human consumption.
8.2.6.5 Soil Contamination with Organic Pollutants due UWW
Irrigation
The sewage water generated from different domestic and industrial activities often
contains numerous synthetic organic compounds. However, very few studies have
been carried out on characterization of organic pollutants in wastewater. Advance-
ment in analytical science and facilities of sophisticated laboratory equipment
facilitated the quantitative determination extremely low amounts of organic pollut-
ants present in soil and water in recent years. Although domestic and industrial
wastewaters generally undergo various treatments before discharge into sewage
canal, treated effluents however, may still contain organic contaminants several of
which are extremely toxic to human and animals (Tables 8.8 and 8.9). Over
100 such chemicals were identified in sludge and wastewater (Overcash 1983).
Several organic priority pollutants (OPPs) and pesticides were however not
decreased during treatment. Analysis of UWW from New York City during
1989–1993 indicated that commonly identified OPPs included five volatile com-
pounds, one semi-volatile compound, and one pesticide (Gamma BHC). With few
exceptions, volatile and semi-volatile concentrations were <100 ppb, and pesticide
concentrations were <0.2 ppb (Table 8.9). Comparisons of effluent concentrations
to most stringent standards for receiving water showed five compounds to occa-
sionally exceed the limit, with only a single volatile compound, tetrachloroethene,
8.2 Use of Urban Wastewater in Agriculture 217

exceeding them with any regularity (Stubin et al. 1996). Paxeus (1996) detected
wide range of organic compounds in the wastewater discharged from treatment
plants in Sweden, which included aromatic hydrocarbons, solvents, antioxidants,
Table 8.8 Major organic pollutants in the secondary effluents
Chemical group Major compounds with highest concentration Value (μg L�1)
Halogenated aliphatics Methylene chloride 0.16–48
Methyl chloride
Substituted aromatics Toluene 0.21–18
Pentachlorophenol
Phthalate acid esters Bis(2-ethylhexyl) phthalate 0.21–21
Di-n-butil phthalate
Polynuclear aromatics Phenanthrene 0.16–0.68
Anthracene
Adapted from Overcash (1983)
Table 8.9 Concentrations for the most commonly occurring organic priority pollutants and
pesticides in municipal wastewater from 1996
Compounds Influent Effluent
Organic priority pollutants
Highest recorded concentrations
(in ppb)
Highest recorded concentrations
(in ppb)
Chloroform 17 (99)a 45 (86)
Tetrachloroethene 78 (94) 69 (74)
Toluene 47 (87) 110 (24)
Bis(2-ethylhexyl)
phthalat
180 (48) 50 (12)
Methylene chloride 160 (39) 29 (31)
Gamma BHC 0.09 (37) 0.12 (33)
1,1,1 -trichloroethane 72 (33) 57 (17)
Pesticides
Concentration (in ppb) Concentration (in ppb)
Alpha BHC 0.037–0.054 (2) 0.007–0.09 (4)
Gamma BHC
(Lindane
0.012–0.09 (37) 0.013–0.12 (33)
Aldrin 0.024–1.1 (26) 0.008–0.44 (23)
4,4-DDT 0.012–0.053 (5) 0 (0)
Endosulfan sulfate 0 (0) 0.26 (1)
Heptachlor 0.021–0.35 (7) 0.02–0.447 (10)
Endosulfan II 0.22 (1) 0 (0)
Dieldrin 0 (0) 0.012–0.028 (2)
Endrin aldehyde 0.032 (1) 0 (0)
Stubin et al. (1996)aPercent detection in influent/effluent during the current study shown in parentheses
218 8 Urban Activities in India Leading to Soil Pollution

plasticisers, preservatives, food and household related compounds, flame retardants
and washing and cleaning related compounds. The concentrations of individual
compounds in effluents were varying from 0.5 to 50 ppb. Moreover, concern in this
aspect arises when domestic sewage water gets contaminated with industrial water
(Shi 2009). A range of toxic compounds, such as phenols, polynuclear aromatic
hydrocarbons and organic acids and bases were found in industrial wastewater.
But the risks related with use of treated sewage water for irrigation in respect to
trace organics are normally not very high, due to either complete removal or
substantial reduction in their concentration during effluent treatment. Furthermore,
degrading actions by various kinds of soil microorganisms on these compounds and
various physic-chemical reactions with soil particles (similar to the fate of pesti-
cides) can reduce the concentration and impact of organic pollutants in the soil-
water system.
Trace organic pollutants derived from sewage effluent experience adsorption,
volatilization and biodegradation reactions within soil matrix. As a result, the level
of these original contaminants present in the waste water/sewage effluent may
reduce significantly upon entry in the land mass. The isothermal adsorption equa-
tions, such as Freundlich and Langmuir equations describe the adsorption pattern of
the trace organics on soil matrix and explain their fate and bioavailability in
rhizosphere. Soil organic matter content has been considered as best indicator of
degree of adsorption for non-ionic and polar organic species; whereas, pH of soil
solution generally governs the sorption process for ionic or ionizable substances
(Bronner and Goss 2011). Partitioning coefficient (Kw) is adopted as indicative
parameter for volatilization of trace organics from dilute aqueous solutions. Kw is
expressed as the ratio of the equilibrium concentration of volatile organic com-
pounds in the water and in the air at 298�K. Biodegradation is the process of
involvement microbes and organisms present in the soil that reduce the level of
organic pollutants in the soil. The rate of decomposition the organic pollutants in
soils was determined by type of microorganisms and soil properties as well as the
chemical properties of the organic pollutant itself. Degradation of organic pollut-
ants generally follows a first-order reaction at low substrate concentrations (Alex-
ander 1985). The available organic C fraction in the soil from other sources can
enhance the biodegradation of trace pollutants, while their adsorption in soil matrix
reduces its decomposition rate. Bioaccumulation of trace pollutants, (i.e., uptake
through plant roots) has been detected by few researchers (Chang and Page 1985);
however, the significance of this process in soil-plant systems has not been
mentioned.
8.3 Use of Sewage Sludge in Agriculture
The sewage sludge is generated after treatment of effluents from cities and towns
using different technologies. Sewage treatment and consequent production of
sewage sludge compost provides a win-win situation for both urban society and
8.3 Use of Sewage Sludge in Agriculture 219
farming community as it allows beneficial recycling of wastes. Although estimates
of volume of sewage being treated are available, quantitative information on sludge
generation from sewage treatment plants (STPs) in India is not available. The
CPCB evaluated performance of 152 sewage treatment plants located in 15 states
across the country. The total treatment capacity of these plants was reported to be
4716 MLD (CPCB 2013). However actual performance of these plants was only
66% of the total capacity (3126 MLD) as revealed from the study. Moreover BOD
and COD of treated effluents from 49 and 7 STPs respectively exceeded permissible
levels for discharge into the water bodies, indicating inefficiency of several STPs in
the country. Average sewage effluent treatment capacity of different states followed
the order: Tamil Nadu with 16.9% rank top position followed by Uttar Pradesh
(16.4%), Andhra Pradesh (15%), Punjab (14%), West Bengal (10%), Haryana
(7%), Maharashtra (6%), Gujarat (4.9%), Madhya Pradesh (3.6%), Bihar (3.4%),
Uttarakhand (1.1%), Karnataka (0.9%), Delhi (0.4%) and Goa (0.2%) in the order.
The maximum efficiency of BOD removal (90%) was observed in the STPs
designed on Trickling filter and Sequential Batch Reactor (SBR) technologies.
Composition and characteristics of sewage sludge varies widely depending on
UWW quality and its treatment processes (Table 8.10). Organic and inorganic
pollutants (non-essential trace metals, toxic metals), salt ions, microorganisms
and pathogens, beneficial plant macro- and micro-nutrients and some organic
compounds are widely found in sewage sludge during chemical analysis. Composts
prepared from municipal sewage sludge have proved useful in agriculture because
of presence of higher amount of organic carbon and plant nutrients.
8.3.1 Nutrient Potential of Sewage Sludge
Sewage sludge contains considerable amount of organic carbon and plant nutrients
that are essential for crop production. Therefore, application of sewage-sludge in
agricultural land has shown to enhance crop yield considerably (Singh and Agrawal
2010; Ozyazıcı 2013). A recent review has documented the advantages of sludge
application for improving several soil physico-chemical parameters like organic
carbon, bulk density, aggregate stability, infiltration capacity, air recirculation,
porosity, cation exchange capacity and available nutrients (Mtshali et al. 2014).
Urban sewage sludge compost has the potential to correct soil acidity due their high
contents of bases and organic matter. Sludges generally contain higher amount of
salts as compared to soil and therefore, their application may result in development/
enhancement of soil salinity particularly in low rainfall area.
220 8 Urban Activities in India Leading to Soil Pollution

8.3.2 Heavy Metals in Sewage Sludge
Although several benefits can be harvested from use of sewage sludge compost in
crop production, this byproduct from sewage treatment plants are screened and
monitored by government organization before permitting for its safe use in sustain-
able agriculture production. During treatment process, toxic substances in waste
water are concentrated into solid phase, making it riskier to be applied on agricul-
tural lands. The risks due to the presence of undesirable substances such as heavy
metals/trace elements, potentially toxic synthetic organic compounds, pathogenic
organisms; and possible element imbalance in composts have become major appre-
hension for potential compost users including farmers. The heavy metals concen-
trations in sewage sludges are vary widely (Table 8.10). It usually contains 30–50%
higher metals concentrations as compared to mechanically-segregated composts
(Smith 2009). The heavy metal contents in sludge are especially higher if UWW is
contaminated with industrial effluent. Therefore their level depends largely on
industrialization profile of a city. Continuous application of sludge compost in
fields may buildup heavy metals in soils beyond the permissible levels for its safe
use in agriculture. Composting of sewage sludge tends to diminish heavy metals
availability and therefore threat of metals transfer to plants with composted sludge
is generally lower as compared to other forms of stabilized sludge (Smith 2009).
Most of the researchers observed ‘plateau response’ type of heavy metal uptake
with increasing rates of sludge application (hence, increasing contamination) due to
consequent increase in metal fixation capacity (because of high contents of hydrox-
ides of Fe, Mn and Al in the sludge) (Mahler and Ryan 1988). However, few
Table 8.10 Typical
characteristics and
composition of municipal
sewage sludge
Parameters Range
Bulk density (g mL�1) 0.33–0.8
Organic matter (%) 7–80
N (%) 0.48–3.23
P (%) 0.08–2.22
K (%) 0067–1.44
S (%) 0.4–0.88
Ca (%) 0.37–4.9
Mg (%) 0.07–1.1
As (μg g�1) 1.1–87
Pb (μg g�1) 22–335
Cd (μg g�1) 0.5–16
Cr (μg g�1) 14.7–1290
Cu (μg g�1) 150–484
Mn (μg g�1) 32–605
Ni (μg g�1) 5–96
Hg (μg g�1) Tr.–6.5
Zn (μg g�1) 261–1490
Ogilvie (1998)
8.3 Use of Sewage Sludge in Agriculture 221

instances of increasing metal uptake response with repeated additions of compost
were also observed due to mineralization of metal-bound organic matter, thereby
supporting ‘time-bomb model’ proposed by Beckett et al. (1979).
Contamination of soils with potentially toxic elements due to amendment with
sewage sludge and MSW compost is subjected to strict control in several countries
in reference to total permissible metal concentration, soil properties and intended
use. Different countries have set limits for maximummetal concentration in sewage
sludge and compost as well as in agricultural soils for the purpose of minimizing
risks associated with use of such hazardous wastes (Tables 8.11 and 8.12).
8.3.3 Organic Pollutants in Sewage Sludge
Numerous organic pollutants (>500) with different physico-chemical properties
also find their way into waste water drainage systems and subsequently accumulate
in the sludge during wastewater treatment. Several pollutants have the potential to
contaminate the food chain when contaminated sludges are used in agricultural land
as soil amendment. These pollutants can be classified into one or more of the
following groups: aliphatic, chlorobenzene, nitrosamines, organotin, monocyclic
hydrocarbons, POPs, flame retardants, pesticides, phenols, sterols and stanols,
phthalate, triaryl/alkyl phosphate esters polychlorinated biphenyls (PCBs), polycy-
clic aromatic hydrocarbons (PAHs), surfactants, etc. (Harrison et al. 2006). These
pollutants differ widely in expression of toxicity and degradability. Significantly
high concentrations of several organic contaminants like dichloromethane,
toluol and surfactants, as well as their degradation products (linear alkylbenzene
sulfonate) had been reported in sewage sludges of the north-eastern Germany
Table 8.11 Maximum safe allowable concentrations of heavy metals in sewage sludge and
compost to be used soil application (μg g�1 on dry weight basis)
Country Cd Cr Cu Hg Ni Pb Zn
European union 20–40 – 1000–1750 16–25 300–400 750–1200 2500–4000
Germany-sewage
sludge
10 900 800 8 200 900 2500
Germany-composta 1.5 (1) 100 (70) 100 (70) 1 (0.7) 50 (35) 150 (100) 400 (300)
France 20 1000 1000 10 200 800 3000
USA ceiling
concentrations
85 3000 4300 57 420 840 7500
USA pollutant
concentrations
39 1200 1500 17 420 300 2800
Russia 30 1200 1500 15 400 1000 4000
India 5 50 150 2.5 50 300 500
During and Gath (2002) and MOEF (2000)aQuantity of manure �20 tonnes ha�1, and in brackets for 30 tonnes ha�1 in 3 years
222 8 Urban Activities in India Leading to Soil Pollution

(Schnaak et al. 1997). Alcock et al. (1999) identified several hazardous chemicals
like polychlorinated naphthalenes, chlorinated paraffins, brominated diphenyl
ethers, quintozene, chloronitrobenzenes, polydimethylsiloxanes, and a range of
pharmaceutical compounds in sewage sludge. Most these compounds are extremely
resistant to microbial degradation and therefore persistent in soil. Toxicity potential
of the organic pollutants in soil is, however, considered to be low. Because of
hydrophobic nature of toxic organic chemicals, these are adsorbed rapidly with
sludge-soil matrix and as a result availability of these compounds to plants are
reduced (O’Connor 1996). However, these toxic chemicals may enter through
direct ingestion (of contaminated soil) into the body of animals during grazing or
into the body of children while playing on sludge amended land. Application of
sludge in pasture land led to the intake and accumulation of Dibenzofurans (PCDD/
Fs), phenols, some chlorinated benzenes, PCBs and Polychlorinated Dibenzo-p-
Dioxins in livestock (Duarte-Davidson and Jones 1996). For site specific risk
assessment and management at Superfund sites in USA, USEPA determined soil
test screening limits (SSLs) for 16 inorganic and 93 organic pollutants. These limits
are not standards used for regulatory purpose, but can be used as guidelines for the
purpose of determining whether the site is clean after remediation. Harrison et al.
(2006) used these SSL values to evaluate quality of sludge in respect of organic
pollutants concentration through extensive survey of reports and research articles.
Presence of 516 organic compounds in sludge had been reported, of which 90 were
priority pollutants (requiring remediation technology) and 101 were target com-
pounds (requiring monitoring). About 15% of the organic pollutants detected in
sludge had SSL values. On the other hand 86% of the compounds exceeded at least
one SSL. Therefore, repeated application of sewage sludge may raise their concen-
trations in soil.
Table 8.12 Maximum concentrations of metals (in mg kg�1) allowed in agricultural soils through
application of sewage sludge
Country Cd Cu Cr Hg Ni Pb Zn
European Countries 1–3 50–140 100–150 1–1.5 30–75 50–300 150–300
France 2.00 100 150 1.00 50.0 100 300
Germanya 1.50 60.0 100 1.00 50.0 100 300
Italy 3.00 100 150 – 50.0 100 300
Spain 1.00 50.0 100 1.00 30.0 50.0 150
The Netherlands 0.80 36.0 100 0.30 35.0 85.0 140
United Kingdomb 3.00 135 400 1.00 75.0 300 300
Denmark 0.50 40.0 30.0 0.50 15.0 40.0 100
Finland 0.50 100 200 0.20 60.0 60.0 150
Norway 1.00 50.0 100 1.00 30.0 50.0 150
Sweden 0.50 40.0 30.0 0.50 15.0 40.0 100
United States 20.0 750 1500 8.00 210 150 1400
Adapted from McGrath et al. (1994)aData shown for soil pH more than 6 (at pH 5–6, Cd 1.0 ppm and Zn 150 ppm); bData for soil
pH 6–7
8.3 Use of Sewage Sludge in Agriculture 223

References
Alcock RE, Sweetman A, Jones KC (1999) Assessment of organic contaminant fate in waste water
treatment plants. I: Selected compounds and physicochemical properties. Chemosphere
38:2247–2262
Alexander M (1985) Biodegradation of organic chemicals. Environ Sci Technol 19(2):106–111
Annepu RK (2012) Sustainable solid waste management in India. M.Sc. thesis. Columbia Uni-
versity, New York
Bansal RL, Nayyar VK, Takkar PN (1992) Accumulation and bioavailability of Zn, Cu, Mn and Fe
in soils polluted with industrial waste water. J Indian Soc Soil Sci 40:796–799
Baum R, Luh J, Bartram J (2013) Sanitation: a global estimate of sewerage connections without
treatment and the resulting impact on MDG progress. Environ Sci Technol 47:1994–2000
Beckett PHT, Davies RD, Brindley P (1979) The disposal of sewage sludge onto farmland- the
scope of the problems of toxic elements. Water Pollut Control 78:419–445
Bhardwaj RM (2005) Status of wastewater generation and treatment in India. IWG-Env, Interna-
tional Work Session on Water Statistics, Vienna, 20–22 June 2005, p 9. http://unstats.un.org/
unsd/environment/envpdf/pap_wasess3b6india.pdf. Accessed 12 Sept 2013
Bicknell SR (1972) Salmonella aberdeen in cattle associated with human sewage. J Hyg
70:121–126
Bouwer H, Chaney RL (1974) Land treatment of waste water. Adv Agron 26:133–176
Brar MS, Mahli SS, Singh AP et al (2000) Sewer water irrigation effects on some potentially toxic
trace elements in soil and potato plants in north western India. Can J Soil Sci 80:465–471
Brar MS, Khurana MPS, Kansal BD (2002) Effect of irrigation by untreated sewage effluents on
the micro and potentially toxic elements in soils and plants. In: Proceeding of 17th world
congress of soil science held at Bangkok, Thailand from 14–21 August, Symposium no.-24
198, pp 1–6
Bronner G, Goss KU (2011) Sorption of organic chemicals to soil organic matter: influence of soil
variability and pH dependence. Environ Sci Technol 45(4):1307–1312
Cao ZH, Hu ZY (2000) Copper contamination in paddy soils irrigated with wastewater.
Chemosphere 41:3–6
Chander K, Brookes PC (1991) Effects of heavy metals from past applications of sewage sludge on
microbial biomass and organic matter accumulation in a sandy loam and silty loam UK soil.
Soil Biol Biochem 23:927–932
Chang AC, Page AL (1985) Fate of wastewater constituents in soil and groundwater: trace
organics. In: Pettygrove GS, Asano T (eds) Irrigation with reclaimed municipal wastewaster
– a guidance manual. Lewis, Chelsea, pp 15.1–15.20
Chang AC, Granato TC, Page AL (1992) A methodology for establishing phytotoxicity criteria for
chromium, copper, nickel, and zinc in agricultural land application of municipal sewage
sludges. J Environ Qual 21:521–536
Ciaccio LL (1971) Water and water pollution handbook. Marcel Dekker, New York
CPCB (2009) Sewage treatment in India. Central pollution control board, New Delhi
CPCB (2012) Management of municipal solid waste. Central Pollution Control Board, Delhi.
http://www.cpcb.nic.in/divisionsofheadoffice/pcp/management_solidwaste.pdf. Accessed
25 Nov 2012
CPCB (2013) Performance evaluation of sewage treatment plants under NRDC. Central Pollution
Control Board, Delhi. http://cpcb.nic.in/upload/NewItems/NewItem195STPREPORT.pdf.
Accessed 12 Dec 2013
CPCB (2015) Annual review report 2013–14: implementation of municipal solid wastes (man-
agement and handling) rules, 2000, Central Pollution Control Board, Delhi. http://cpcb.nic.in/
upload/Latest/Latest_98_Anual_Rew_Rep_MSW_2013_14.pdf. Accessed 23 Aug 2016
Dag J, Feigin A, Giskin M et al (1984) Response of cotton to effluent irrigation in a grumusol soil
in Yizre’el Valley; 1976–1982 experiments 1: Cotton yield. Agriculture Research Organiza-
tion, Israel. Pamphlogy 228:47–54
224 8 Urban Activities in India Leading to Soil Pollution

Daniel H, Perinaz BT (2012) What a waste: a global review of solid waste management. Urban
development series knowledge papers. World Bank 15:1–98
Devanathan G, Subramanian A, Sudaryanto A et al (2012) Brominated flame retardants and
polychlorinated biphenyls in human breast milk from several locations in India: potential
contaminant sources in a municipal dumping site. Environ Int 39:87–95
Dheri GS, Brar MS, Malhi SS (2007) Heavy metal concentration of sewage contaminated water
and its impact on underground water, soil, and crop plants in alluvial soils of north-western
India. Commun Soil Sci Plant Anal 38:1353–1370
Dotaniya ML, Saha JK, Meena VD (2015) Sewage water irrigation boon or bane for crop
production. Indian Farm 65:24–27
Duarte-Davidson R, Jones KC (1996) Screening the environmental fate of organic contaminants in
sewage sludge applied to agricultural soils: II. The potential for transfers to plants and grazing
animal. Sci Total Environ 185:59–70
Düring R, Gath S (2002) Utilization of municipal organic wastes in agriculture: where do we stand,
where will we go? J Plant Nutr Soil Sci 165:544–556
Feigin A, Feigenbaum S, Limoni H (1981) Utilization efficiency of nitrogen from sewage effluent
and fertilizer applied to corn plants growing in a clayey soil. J Environ Qual 10:284–287
Feigin A, Ravina I, Shalhevet J (1991) Irrigation with treated sewage effluent management for
environmental protection. Adv Ser Agric Sci 17:224
Friedel JK, Langer T, Siebe C, Stahr K (2000) Effects of long-term waste water irrigation on soil
organic matter, soil microbial biomass and its activities in central Mexico. Biol Fertil Soils
31:414–421
Ghafoor A, Qadir M, Sadiq M et al (2004) Lead, copper, zinc and iron contaminations in soils and
vegetables irrigated with city effluent on urban agricultural lands. J Indian Soc Soil Sci
52:114–117
Ghimire SK (1994) Evaluation of industrial effluents toxicity in seed germination and seedling
growth of some vegetables. M.Sc. dissertation, Central Department of Botany, Tribhuvan
University, Kirtipur, Kathmandu, Nepal
Gupta N, Khan DK, Santra SC (2008) An assessment of heavy metal contamination in vegetables
grown in wastewater-irrigated areas of Titagarh, West Bengal, India. Bull Environ Contam
Toxicol 80:115–118
Gupta S, Satpati S, Nayek S, Garai D (2010) Effect of wastewater irrigation on vegetables in
relation to bioaccumulation of heavy metals and biochemical changes. Environ Monit Assess
165:169–177
Harrison EZ, Oakes SR, Hysell M et al (2006) Organic chemicals in sewage sludges. Sci Total
Environ 367:481–497
Henze M, Comeau Y (2008) Wastewater characterization. In: Henze M, van Loosdrecht MCM
et al (eds) Biological wastewater treatment: principles modelling and design. IWA Publishing,
London, pp 33–52
Hunter JV, Kotalik TA (1974) Chemical and biological quality of treated effluents. In: Sopper WE,
Kardos LT (eds) Conference on recycling treated municipal wastewater through forest and
cropland. US Environmental Protection Agency EPA-660/2–74-003, pp 6–27
Kanmani S, Gandhimathi R (2013) Assessment of heavy metal contamination in soil due to
leachate migration from an open dumping site. Appl Water Sci 3:193–205
Kansal BD (1992) Effect of waste disposal on soils and plants. In: Dhaliwal GS, Hansra BS, Jerath
N (eds) Changing scenario of our environment. Punjab Agricultural University, Ludhiana, pp
197–206
Kharche VK, Desai VN, Pharande AL (2011) Effect of sewage irrigation on soil properties,
essential nutrients and pollutant element status of soils and plants in a vegetable growing
area around Ahmednagar city in Maharashtra. J Indian Soc Soil Sci 59:177–184
Khurana MPS, Singh J, Nayar VK (2004) Assessment of heavy metal contamination in soils and
plants irrigated with sewage waters containing industrial effluents in district Amritsar, Punjab.
Indian J Environ Ecoplan 8:221–280
References 225

Kumar S, Bhattacharyya JK, Vaidya AN et al (2009) Assessment of the status of municipal solid
waste management in metro cities, state capitals, class I cities, and class II towns in India: an
insight. Waste Manag 29:883–895
Logan TJ, Henry CL, Schnoor JL et al (1999) An assessment of health and environmental risks of
trace elements and toxic organics in land applied municipal solid waste compost. Compost Sci
Util 7:38–53
Mahler RJ, Ryan JA (1988) Cadmium sulfate application to sludge-amended soils: III. Relation-
ship between treatment and plant available cadmium, zinc, and manganese. Commun Soil Sci
Plant Anal 19:1771–1794
Manka J, Rebhun M, Mandelbaum A, Bortinger A (1974) Characterization of organics in second-
ary effluents. Environ Sci Technol 8:1017–1020
Mapanda F, Mangwayana EN, Nyamangara J, Giller KE (2005) The effect of long-term irrigation
using wastewater on heavy metal contents of soils under vegetables in Harare, Zimbabwe.
Agric Ecosyst Environ 107:151–165
Masto RE, Chhonkar PK, Singh D, Patra AK (2009) Changes in soil quality indicators under long-
term sewage irrigation in a sub-tropical environment. Environ Geol 56:1237–1243
McGrath SP, Chang AC, Page AL et al (1994) Land application of sewage sludge: scientific
perspectives of heavy metal loading limits in Europe and the United States. Environ Rev
2:108–118
Minh NH, Minh TB, Watanabe M et al (2003) Open dumping site in Asian developing countries: a
potential source of polychlorinated dibenzo-p-dioxins and polychlorinated dibenzofurans.
Environ Sci Technol 37:1493–1502
Minhas PS, Samra JS (2004) Wastewater use in peri-urban agriculture impacts and opportunities.
Technical Bulletin 02/2004. Central Soil Salinity Research Institute (CSSRI), Karnal, Haryana,
India
Minhas PS, Sharma N, Yadav RK, Joshi PK (2006) Prevalence and control of pathogenic
contamination in some sewage irrigated vegetable, forage and cereal grain crops. Bioresour
Technol 97:1174–1178
MOEF (2000) Municipal solid wastes (management and handling) rules, 2000. Notification, dated
25th September, 2000. Ministry of Environment and Forests, New Delhi. Available via http://
www.moef.nic.in/legis/hsm/mswmhr.html. Accessed 14 Sept 2016
Mtshali JS, Tiruneh AT, Fadiran AO (2014) Characterization of sewage sludge generated from
wastewater treatment plants in Swaziland in relation to agricultural uses. Resour Environ
4:190–199
Narayana T (2009) Municipal solid waste management in India: from waste disposal to recovery
of resources? Waste Manag 29:1163–1166
NEERI (1995) Strategy paper on SWM in India. National Environmental Engineering Research
Institute, Nagpur
Nyamangara J, Mzezewa J (1999) The effect of long-term sewage sludge application on Zn, Cu, Ni
and Pb levels in a clay loam soil under pasture grass in Zimbabwe. Agric Ecosyst Environ
73:199–204
O’Connor GA (1996) Organic compounds in sludge-amended soils and their potential uptake by
crop plants. Sci Total Environ 185:71–81
Ogilvie D (1998) National study of the composition of sewage sludge. New Zealand Water and
Wastes Association. PO Box 13–880, Onehunga, Auckland
Overcash MR (1983) Land treatment of municipal effluent and sludge: specific organic com-
pounds. In: Page AL et al (eds) Utilization of municipal wastewater and sludge on land.
University of California Press, Riverside, pp 199–231
Ozyazıcı MA (2013) Effects of sewage sludge on the yield of plants in the rotation system of
wheat-white head cabbage-tomato. Eur J Soil Sci 2:35–44
Palaniswami C, Sree Ramulu US (1994) Effects of continuous irrigation with paper factory
effluent on soil properties. J Indian Soc Soil Sci 42:139–140
226 8 Urban Activities in India Leading to Soil Pollution

Paxeus N (1996) Organic pollutants in the effluents of large wastewater treatment plants in
Sweden. Water Res 30:1115–1122
Petruzzelli G, Szymura I, Lubrano L, Pezzarossa B (1989) Chemical speciation of heavy metals in
different size fractions of compost from solid urban wastes. Environ Technol Lett 10:521–526
Pinamonti F, Nicolini G, Dalpiaz A, Stringari G, Zorzi G (1999) Compost use in viticulture: effects
on heavy metal levels in soil and plants. Commun Soil Sci Plant Anal 30:1531–1549
Qadir M, Wichelns D, Raschid-Sally L et al (2010) The challenges of wastewater irrigation in
developing countries. Agric Water Manag 97:561–568
Rattan RK, Datta SP, Chhonkar PK et al (2001) Effect of long term application of sewage effluents
on available water status in soils under Keshopure Effluent Irrigation Scheme in Delhi. Agric
Water Manag 9:21–26
Rattan RK, Dutta SP, Chandra S, Saharaan N (2002) Heavy metals in environments-Indian
scenario. Fertil News 47:21–40
Rattan RK, Datta SP, Chhonkar PK, Suribabu K, Singh AK (2005) Long-term impact of irrigation
with sewage effluents on heavy metal content in soils, crops and groundwater – a case study.
Agric Ecosyst Environ 109:310–322
Saha N, Tarafdar J (1996) Quality of sewage as irrigation water and its effect on beneficial
microbes around pea (Pisum sativum) rhizosphere in hill soil. J Hill Res 9:69–72
Saha JK, Panwar N, Singh MV (2009) Determination of lead and cadmium concentration limits in
agricultural soil and municipal solid waste compost through an approach of zero tolerance to
food contamination. Environ Monit Assess. doi:10.1007/s10661-009-1122-3
Saha JK, Panwar N et al (2010a) An assessment of municipal solid waste compost quality
produced in different cities of India in the perspective of developing quality control indices.
Waste Manag 30:192–201
Saha JK, Panwar N, Srivastava A et al (2010b) Chemical, biochemical, and biological impact of
untreated domestic sewage water use on Vertisol and its consequences on wheat (Triticumaestivum) productivity. Environ Monit Assess 161:403–412
Saha JK, Panwar N, Coumar MV (2013) Effect of methods of preparation on distribution of heavy
metals in different size fractions of municipal solid waste composts. Environ Monit Assess
185:8815–8821
Saha JK, Sharma AK, Srivastava A (2014) Impact of different types of polluted irrigation water on
soil fertility and wheat grain yield in clayey black soils of central India. Environ Monit Assess
186:2349–2356
Saha S, Hazra GC, Saha B et al (2015) Assessment of heavy metals contamination in different
crops grown in long-term sewage-irrigated areas of Kolkata, West Bengal. India Environ
Monit Assess. doi:10.1007/s10661-014-4087-9
Saha JK, Srivastava A, Kundu S, Rao AS (2016) Comparison between fertilizers and untreated
sewage effluent as sources for nutrient recovery by wheat (Triticum aestivum)-soybean (Gly-cine max) cropping system. J Plant Nutr 39:470–478
Sato T, Qadir M, Yamamoto S, Endo T, Zahoor A (2013) Global, regional, a country level need for
data on wastewater generation, treatment, and use. Agric Water Manag 130:1–13
Schalscha BE, Vergara FI (1982) The nitrogen balance of vegetable crops irrigated with untreated
effluent. Plant Soil 67:221–226
Schalscha EB, Vergara I, Schirado T, Morales M (1979) Nitrate movement in a Chilean agricul-
tural area irrigated with untreated sewage water. J Environ Qual 8:27–30
Schirado T, Vegara I, Schalscha EB, Pratt PF (1986) Evidence for movement of heavy metals in a
soil irrigated with untreated wastewater. J Environ Qual 15:9–12
Schnaak W, Kulcher T, Kujawa M et al (1997) Organic contaminants in sewage sludge and their
ecotoxicological significance in the agricultural utilization of sewage sludge. Chemosphere
35:5–11
Sharholy M, Ahmad K, Mahmood G, Trivedi RC (2008) Municipal solid waste management in
Indian cities – a review. Waste Manag 28:459–467
References 227

Sharma VK, Kansal BD (1986) Heavy metals contamination of soils and plants with sewage
irrigation. Policy Res 4:86–91
Sharma RK, Agarwal M, Marshall F (2007) Heavy metal contamination of soil and vegetables in
suburban areas of Varanasi, India. Ecotoxicol Environ Saf 66:258–266
Shi H (2009) Point sources of pollution: local effects and control – volume 1. Industrial
wastewater-types, amounts and effects, pp 191–203. ISBN:978–1–84826-167-9 (eBook)
Siebe C (1998) Nutrient inputs to soils and their uptake by alfalfa through long-term irrigation with
untreated sewage effluent in Mexico. Soil Use Manag 14:119–122
Simmons RW, Blummel M, Reddy R, Khan AA (2006) Impact of wastewater irrigation on Cd and
Pb concentrations in rice straw and paragrass: implications for food safety. A report of
International Water Management Institute (IWMI), Regional Office, South Asia
Singh A, Agrawal M (2010) Effects of municipal waste water irrigation on availability of heavy
metals and morpho-physiological characteristics of Beta vulgaris L. J Environ Biol
31:727–736
Singh KP, Dinesh M, Sinha S, Dalwani R (2004) Impact assessment of treated/untreated waste-
water toxicants discharged by sewage treatment plants on health, agricultural, and environ-
mental quality in the wastewater disposal area. Chemosphere 55:227–255
Singhal S, Pandey S (2001) Solid waste management in India: status and future directions. TERI
Inf Monit Environ Sci 6:1–4
Smith SR (2009) A critical review of the bioavailability and impacts of heavy metals in municipal
solid waste composts compared to sewage sludge. Environ Int 35:142–156
Smith KEC, Green M, Thomas GO, Jones KC (2001) Behavior of sewage sludge-derived PAHs on
pasture. Environ Sci Technol 35:2141–2150
Sperling MV (2007) Wastewater characteristics, treatment and disposal. IWA Publishing, London
Stubin AI, Brosnan TM, Porter KD, Jimenez L, Lochan H (1996) Organic priority pollutants in
New York City municipal wastewaters: 1989–1993. Water Environ Res 68:1037–1044
Subramanian A, Tanabe S (2007) Persistent toxic substances in India. In: Li A, Tanabe S, Jiang G
et al (eds) Developments in environmental science, vol 7. Elsevier Ltd. doi:10.1016/S1474-
8177(07)07009-X
Tiller KG (1986) Essential and toxic heavy metals in soils and their ecological relevance. Trans
XIII Congress. Int Soc Soil Sci 1:29–44
UNESCO (2012) Managing water under uncertainty and risk. The United Nations World Water
Development Report 4. United Nations Educational, Scientific and Cultural Organization,
Paris
Valsecchi G, Gigliotti C, Farini A (1995) Microbial biomass, activity, and organic matter
accumulation in soils contaminated with heavy metals. Biol Fertil Soils 20:253–259
WHO (2006) Guidelines for the safe use of wastewater, excreta and greywater. Policy and
regulatory aspects, vol 1. World Health Organization, 20 Avenue Appia, 1211 Geneva
27, Switzerland
Yadav RK, Goyal B, Sharma RK, Dubey SK, Minhas PS (2002) Post-irrigation impact of domestic
sewage effluent on composition of soils, crops and ground water – a case study. Environ Int
28:481–486
228 8 Urban Activities in India Leading to Soil Pollution

Chapter 9
Industrial Activities in India and Their
Impact on Agroecosystem
Abstract Industrial profile of a city indicate nature of pollution that surrounding
environment is facing or is likely to encounter. Though investigation on land
resources for changes in soil quality due their activity has not been made adequately
in India, an assessment of mining & industrial activities may indicate the potential
threat to surrounding agroecosystem. The country has considerable environmen-
tally destructive mining activities in about 57 million ha land area in several states
altering the land morphology and existing land use and releasing heavy metals in
the environment. About 595 metallic mines along with associated smelters,
145 thermal power plants, quite a large number of large & small scale metallurgical,
chlor-alkali industry and tannery industry are likely to have adverse impact on land
and water bodies through release of metals. More than 70,000 chemical and
petrochemical industries in the country have the potential to contaminate land
and water resources with toxic organic pollutants affecting various life forms.
Considerable number of high volume effluent generating industries like textile,
distillery, tannery, paper mill etc. may increase salinity of soil and groundwater.
This chapter describes extent, distribution and possible impacts of polluting indus-
tries in India indicating potential threat faced by the environment including
agroecosystem.
Keywords Industry • Mining • Waste • Impact • Soil • Environment • India
Industrial activities are mostly responsible for entry of pollutants into agricultural
land in India. Post 1980s, the country saw economic liberalization and achieved a
further impetus since mid 1991. The industrial sector is estimated to account for
around 29.5% of the India’s gross domestic product (GDP) and it employs over
17% of the total workforce in the year 2015–2016. Their growth rate reached to
7.6% in 2015–2016. In that year, the mining and quarrying sector contributed 2.4%,
the manufacturing sector contributed 17.2%, and the water supply, gas, and elec-
tricity sector contributed 2.4%. This shows that Industry Growth Rate in India GDP
has been on the rise over the last few years. This rise in growth in the resource
intensive manufacturing sector is enabled and facilitated by an ever-increasing rate
of material use leading to manifold impacts to the environment. According to the
assessment done by the authors of the report, the annual cost of environmental
degradation in India amounts to about Rs. 3.75 trillion ($80 billion) equivalent to
© Springer Nature Singapore Pte Ltd. 2017
J.K. Saha et al., Soil Pollution - An Emerging Threat to Agriculture, Environmental
Chemistry for a Sustainable World 10, DOI 10.1007/978-981-10-4274-4_9
229

5.7% of GDP (World Bank 2013). Of this total, cost due to croplands degradation
was about 1.07% of GDP. While estimating cost due to croplands degradation, only
salinity, erosion and water-logging were used as degradation criteria. However
degradation of soil quality (hence crop productivity) from build-up of pollutants
and associated damage to the soil ecosystem due to industrial activity was not taken
into account in the above computation. The contribution of the manufacturing
sector to environmental degradation primarily occurs during all the stages: pro-
curement and use of natural resources, industrial processes and activities, product
use and disposal. The Central Pollution Control Board (CPCB) has identified
17 highly polluting industries, the majority of which are manufacturing industries
and the identified industries are: aluminum, cement, chlor-alkali, copper, distillery,
dyes and Intermediates, fertilizers, iron and steel, oil, refineries, pesticides, petro-
chemicals, pharmaceuticals, pulp and paper, sugar, tannery, power plant, zinc.
There were about 36,165 numbers of HW Generating Industries in India. Total
quantity of HW generated is about 6.23 Mt. out of which landfillable HW is about
2.73 Mt. (44%), incinerable HW is about 0.41 Mt. (7%) and recyclable HW is about
3.09 Mt. (49%) (CPCB 2009). State wise hazardous waste generation from indus-
tries is indicated in Table 9.1. The highest hazardous waste generation has been
recorded in Maharashtra state followed by Gujarat and Andhra Pradesh.
Major industrial sectors in the country are not having its appropriate waste
disposal system, effluent treatment plant (ETP) or having ETP with insufficient
capacity. This chapter attempts to assess the status of industrial activities in the
country and associated environmental hazards.
9.1 Mining Industries in India
Mining & quarrying in India is one of the core industrial activities and a main sector
for driving economic growth of the country contributing about 2.39% to our GDP in
2014–2015. Besides its direct contribution to GDP, it also plays a crucial role in
growth of other core industries like power, steel, cement, etc., which, in turn, are
vital for the overall development of the economy. The mineral production in India
is practiced since the ancient times as the mining activities can be traced as far as
6000 years ago or so. These are grouped into fuel and non-fuel minerals. The fuel
minerals are coal, lignite, petroleum and natural gas. Atomic minerals (for nuclear
energy) are also clubbed under this category. Further, the non-fuel minerals are
again divided into metallic and non-metallic minerals including minor minerals.
Metallic minerals are, melted to make new products, iron ore, copper, gold, lead,
zinc, silver, tin, etc. Non-metallic minerals are usually sedimentary rocks like
limestone, mica, gypsum, dolomite, asbestos, etc. Owing to meet the fuel need of
many core industries such as steel, railways and power plants, coal have received
the maximum attention. The public sector is involved in the entire production of
lignite, petroleum and natural gas, copper, lead, zinc ores, gold, silver, diamond,
tungsten concentrates, pyrites, rock phosphate, etc. About 5,70,715 km2 land area in
230 9 Industrial Activities in India and Their Impact on Agroecosystem

India is under mining belt/terrain. Out of 3318 reporting mines during 2014–2015,
498 were located in Rajasthan followed by Andhra Pradesh (444), Gujarat (362),
Madhya Pradesh (326), Tamil Nadu (272), Jharkhand (250), Chhattisgarh (201),
Karnataka (178), Odisha (173), Maharashtra (150), Telangana (145) and West
Bengal (120) (Annual Report 2014-15, Ministry of Mines, Govt. of India). These
12 States together accounted for 94% of total number of mines in the country. It is
reported that India produces 89 minerals in total which includes 4 fuel minerals,
48 non-metallic minerals, 10 metallic minerals, 3 atomic minerals, and 24 minor
minerals. Among the mines reported in 2014–2015, 575 involved in coal & lignite
Table 9.1 State-wise hazardous waste (HW) generating industries and hazardous waste
generation
State
HW generating Industries (No’s) as per HWM
Rules, 2000/2003
Total HW generation
(t a�1)
Andhra Pradesh 1532 507,046
Assam 23 4000
Bihar 31 3182
Chandigarh 271 8425
Delhi 1777 17,000
Goa 49 9932
Gujarat 6052 1,207,000
Haryana 889 14,972
Himachal
Pradesh
575 –
Karnataka 1589 92,013
Kerala 423 83,530
Maharashtra 4355 1,407,480
Madhya
Pradesh
818 182,590
Orissa 257 74,918
Pondicherry 66 30,320
Punjab 1448 15,769
Rajasthan 512 183,737
Tamil Nadu 2177 181,624
Uttar Pradesh 1633 82,375
West Bengal 568 236,449
Chattisgarh 149 40,216
Meghalaya 39 37,412
Daman, Diu &
DNH
598 30,862
Jharkhand 169 –
Uttaranchal 39 7514
Tripura 187 –
Total 26,226 4,458,366
Adopted from CPCB (2009)
9.1 Mining Industries in India 231

mining, 595 involved in metallic minerals mining and 2148 involved in
non-metallic mineral mining. The major metals produced in the country are iron-
ore, copper-ore, manganese ore, chromite, zinc concentrates, lead concentrates,
gold, bauxite, and silver. Among the mineral mines, 560 (19% of total) were coal
mines, 553 (19% of total) were limestone mines and 316 (11% of total) were iron
ore mines. Besides these, significant number of mines are engaged in extraction of
bauxite (189), manganese (141), dolomite (116) and steatite (113) (FICCI 2013).
The statewise distribution of mining area is given in Table 9.2. Maximum area
(as proportion to total geographical area) under mining is in Goa followed by
Andhra Pradesh, Karnataka, Odisha, Chhatisgarh, Rajasthan, Jharkhand-Bihar
(combined) in the decreasing order.
Environmental Threats from Mining Industry The extraction of mineral from
nature often creates imbalances which adversely affect the environment. The key
environmental impacts of mining are on wild life and fishery habitats, the water
balance, local climates, sedimentation, depletion of forests and disruption of ecol-
ogy. Therefore, management of country’s minerals resources must be closely
associated with overall economic development and environmental protection and
preservation strategy.
9.2 Thermal Power Plants
India’s power requirement is largely met through thermal power production. It has
quite a significant number (145) of thermal power plants operating all over the
country and more than 62% of electricity demand is met through the country’s vastcoal reserves. Installed Capacity of Power Station in India is about 200,000 MW.
Fly ash is a by-product material being generated by thermal power plants across
the globe from combustion of pulverized coal. Ash content in Indian coal is found
to be in range of 30–50%. The quantum of fly ash produced depends on the quality
of coal used and the operating conditions of thermal power plants. When pulverized
coal is burnt to generate heat, the residue contains 80% Fly Ash and 20% bottom
ash. Fly ash particles ranging in size from 0.5 to 300 micron in equivalent diameter,
being light weight, have potential to get airborne easily and pollute the environ-
ment. If not managed properly fly ash disposal in sea/rivers/ponds can cause
damage to aquatic life also. Slurry disposal in lagoons/settling tanks can become
breeding grounds for mosquitoes and bacteria. It can also contaminate the under-
ground water resources with traces of toxic metals which may be present in fly ash.
Huge investments/expenditures are made just to get fly ash out from the thermal
power plants and dump it in the ponds. If understood and managed properly, it can
prove to be a valuable resource material. Annual production of fly ash in India was
about 184 Mt. in the year 2014–2015 and is expected to cross 225 Mt. by the year
2017 with more than 90,000 acre of land requirement for ash ponds. Such a huge
quantity of fly ash does pose challenging problems, in the form of land usage, health
232 9 Industrial Activities in India and Their Impact on Agroecosystem

Table
9.2
State-w
iseandmineral-w
isedetailswithin
theobviousgeological
potential
areas
State
OGP
Gold
Diamond&
precious
stones
Base
metal
Pt-
group
Fe-
ore
Mn-
ore
Chro-
mite
Coal
&
lignite
Bauxite
Andhra
Pradesh
1,31,500
3000
1,17,000
33,000
300
400
500
11,000
6000
Rajasthan
1,02000
25,000
85,350
16,000
Karnataka
80,000
35,000
62,000
2000
4000
2130
1360
360
300
Chhattisgarh
57,250
2800
45,000
205
7450
350
Odisha
47,025
8680
29,000
4800
1400
700
1110
1400
1725
19,000
MadhyaPradesh
31,300
5650
18,400
9000
5600
350
Maharashtra
28,100
5500
18,000
5500
1000
430
3100
750
Gujarat
25,100
5500
18,300
5800
1000
Jharkhand&
Bihar
23,550
11,180
12,120
430
300
600
430
3350
250
Tam
ilNadu
17,300
1000
3000
1500
1000
800
500
3300
200
Uttar
Pradesh
9100
4500
5600
4500
Kerala
6000
1000
2000
3000
WestBengal
5240
2580
3330
1940
Meghalaya
2510
760
Goa
1500
1500
600
600
1050
Haryana
1300
Sikkim
1000
1000
Assam
940
750
190
Total
570,715
112,890
300,000
181,150
8130
5135
4600
2690
60,215
32,250
MoM
(2015)
9.2 Thermal Power Plants 233

hazards and other environmental dangers. About 56% of the fly ash generated was
utilized in the year 2014–2015 by different purposes like fly ash based building
products, manufacturing of Portland pozzolana cement, construction of roads/
highways/flyovers, reclamation of low lying areas, back filling and stowing of
mines, waste land development, construction of Roller Compacted concrete
dams etc.
Soil fly-ash mixture tend to have lower bulk density, higher water-holding
capacity and lower hydraulic conductivity than soil alone due to its textural
manipulation through fly-ash mixing. Most of the fly-ash produced in India is
alkaline in nature; hence, its application to agricultural soils could increase the
soil pH and thereby neutralize acidic soils. Under Fly Ash Mission, application of
flyash has been found to increase in yields of different crops on experimental fields
as well as in farmers’ fields at several locations, the magnitude of increase however
depended on crop species (Kumar and Jha 2014). Presently about 1.9% of the totals
ash generated is being utilized in agriculture.
Environmental Threat from Use of Fly Ash In general, the major problems asso-
ciated with the application of flyash for crop production and dumping includes high
electrical conductivity, unfavourable physical properties associated with
pozzolonic nature of the material, boron toxicity and accumulation heavy metal
particularly chromium and arsenic in soil (Yao et al. 2014; Pandey and Singh 2010;
Pandey et al. 2011; Ram et al. 2015). Few investigations involving use of ash in
agriculture showed undesirable effects on crop yield and on development of plants.
The most frequently cited cause of these effects is heavy metals and boron toxicity
(Ferraiolo et al. 1990). In some cases, ash is shown to induce P deficiency, salt
injury, pozzolonic effects and heavy metal toxicity to crops (Shukla and Mishra
1986). Fly ash amendments significantly decreased the root, shoot and panicle
length and augmented sterility in rice. Interestingly, ICP-MS analysis for metal
accumulation revealed that the total accumulation of toxic metals, particularly Cd,
Cr, Pb and As were 14–15 fold higher in roots and shoots and 4–20 fold higher in
grains for the plants grown on fly ash amended soil (Singh et al. 2016).
9.3 Chemical Industries
Chemical industry products include petroleum products, polymers, fertilizers, dyes
and dye intermediates, drugs and pharmaceuticals, pesticides, edible and industrials
oils, synthetic paints, inks and numerous specialty organic and inorganic chemicals.
At present there are about 70,000 chemical manufacturing units located in India
(Draft National Chemical Policy-December 2013 of Department of Chemicals and
Petrochemicals, Government of India), comprising of both small and large-scale
units. Most of the chemical industries are located in seven states viz., Andhra
Pradesh, Gujarat, Kerala, Maharashtra, Orissa, Tamil Nadu and West Bengal.
Maharashtra and Gujarat account for over 84% of the chemical production units.
234 9 Industrial Activities in India and Their Impact on Agroecosystem

Major fraction of the chemical industries is covered under medium & small scale
sector, which are generally responsible for release untreated effluent into environ-
ment. Chemical industries sector has witnessed growth rate of about 14% in the last
5 years while petrochemicals industries have registered 24% growth during this
period (Table 9.3). The reason behind India’s chemical industry growth could be
wide range of products in conjunction with their high domestic demand, and export
potential (Table 9.4).
Environmental Threat from Chemical Industries One of the major problems asso-
ciated with the chemical manufacturing is generation of significant quantities of
hazardous waste. The major generators of hazardous wastes are dyes and dye
intermediates, bulk drugs, pesticides and petrochemicals industries. Electrical
and electrochemical industries generate effluents containing significant quanti-
ties of toxic heavy metals. Treatment and disposal of hazardous waste have
gained momentum in the last decade. However, the issue of hazardous waste
treatment and disposal has been addressed to a reasonable extent, only in the
states of Maharashtra, Gujarat and Andhra Pradesh. Toxic pollutants are released
into the environment via atmosphere, water bodies and land mass as gaseous,
liquid and solid waste form and causes highly adverse effect on environment,
magnitude of which depends on nature of chemicals, their toxicity and quantum
of release.
The two parameters that govern the hazardousness of effluents from sector
specific chemical industries are volume and risk of chemicals released as effluent
(Table 9.5). Generally the risk of a chemical is indicated by its persistency, toxicity,
bioaccumulation/biomagnifications, carcinogenicity/mutagenicity and dispersibility.
Accordingly, oil refinery and petrochemical industries are identified as the sectors
requiring maximum attention due to their threat to the environment. Although,
industries related to production of bulk drugs, synthetic dyes and dye intermediates
generate highly toxic chemicals, the volume of waste generation is considerably low.
9.4 Chlor-Alkali Industries
Chlor-alkali industry is associated with the production of caustic soda, soda ash and
liquid chlorine. Out of a total of 35 caustic soda manufacturing units in India,
21 units employ membrane cell process, 11 units employ mercury based process
and 2 units employ both the processes of manufacturing. Gujarat has the maximum
number of caustic soda manufacturing units followed by Tamil Nadu. Chlor–alkali
production sector is the largest intentional user of Hg in the world. Significant
fraction of Hg used in chlor–alkali production is released into the environment via
atmospheric emission, water discharges, and sodium hydroxide and hydrogen
products.
Environmental Impacts of Chlor-Alkali Industries The direct impacts are due to
discharge of effluent from the Effluent Treatment Plant (ETP) into a river water
9.4 Chlor-Alkali Industries 235

Table
9.3
Productionofmajorchem
icalsandpetrochem
icals(group-w
ise)
during2007–2008to
2014–2015(Figuresin
000’M
T)
2007–2008
2008–2009
2009–2010
2010–2011
2011–2012
2012–2013
2013–2014
2014–2015
A.Majorchemicalindustries
AlkaliChem
icals
5501
5545
5830
6271
6478
6487
6481
6619
Inorganic
Chem
icals
889
782
819
898
881
873
892
922
Organic
Chem
icals
1692
1414
1448
1550
1640
1686
1792
1619
Pesticides
(Tech.)
124
130
135
144
156
155
179
187
Dyes
&Pigments
173
168
220
245
241
240
284
285
Total(A
)8380
8039
8452
9108
9396
9441
9628
9632
B.Basicmajorpetrochem
icalindustries
Synthetic
Fibers
2660
2479
2835
3123
3105
3124
3144
3527
Polymers
5304
5060
4791
5292
6211
6424
6784
6533
Elastomers(S.Rubber)
105
96
106
105
100
96
105
172
Synth.DetergentInterm
ediates
585
552
618
638
623
627
597
596
Perform
ance
Plastics
733
804
990
976
969
945
783
766
Total(B)
9386
8991
9340
10,135
11,008
11,216
11,412
11,594
Source:
Chem
icals&
Petrochem
icalsStatisticsat
aGlance:2015.MinistryOfChem
icals&
Fertilizers,GovernmentofIndia
http://www.chem
icals.gov.in
236 9 Industrial Activities in India and Their Impact on Agroecosystem

causing decline in water quality in terms of high level of mercury, TDS, free
chlorine, alkalinity/acidity and affecting biota in the river. The loss of mercury is
100% during the production of caustic soda, and the magnitude of loss is about
394 g t�1 of caustic soda produced. The indirect impacts are ambient air SO2 rise
due to stack emissions which may deposit on soil and contaminate crops; and
decline in water quality due to rise in temperature of water bodies receiving cooling
water discharge from the nearby industry. In view of high adverse impact on
environment, Government of India has banned the commissioning of new mercury
cell based chlor-alkali plants since 1991 and has made mandatory for new chlor-
alkali plants to install the modern membrane cell based technology.
Table 9.4 Major chemicals produced in India during 2014–2015
Chemicals category
Production
(thousand t)
Pesticides: mancozab, acephate, 2, 4-D, aluminium phosphide, glyphosate,
profenofos, chlorpyriphos, phorate, D.D.V.P, D.D.T, cypermethrin, zinc
phosphide, atrazin, isoproturon, pendimethalin, thiamethoxam, captan &
captafol, permethrin, phenthoate, pretilachlor, triazophos, ethion,
quinalphos, dimethoate, malathion
186.8
Alkali Chemicals: Soda ash, caustic soda, liquid chlorine 6619.5
Inorganic chemicals: carbon black, calcium carbonate, hydrogen peroxide,
calcium carbide, titanium dioxide, aluminium fluoride, red phosphorus,
potassium chlorate
921.6
Organic Chemicals: ethyl acetate, formaldehyde, chloro methanes, meth-
anol, acetic acid, acetic anhydride, nitrobenzene, acetaldehyde, phenol,
aniline, PNCB, acetone, menthol, ONCB, pentaerythritol, ethanolamines,
ortho nitro toluene, isobutylbenzene, maleic anhydride, MEK
1619.1
Dyes and pigments: reactive dyes, organic pigment, disperse dyes, optical
whitening agents, acid direct dyes, inorganic pigments, azo dyes, pigment
emulsion, sulphur dyes, solvent dyes, vat dyes, food colours, ingrain dyes
285.2
Petrochemicals: Synthetic fibres / yarn, polymers, synthetic rubber, syn-
thetic detergent intermediates, performance plastics, fibre intermediates,
olefins, aromatics, vinyl chloride monomer, C4-Raffinate, ethylene
dichloride, phthalic anhydride, isopropanol, di-ethylene glycol
29,347
Note: Chemicals listed in each category are arranged in decreasing order of production
Table 9.5 Priority matrix with respect to risk and volume
Volume
Risk High Medium Low
High Oil refinery,
Petrochemicals
Pesticides Bulk-drugs, dyes & dye
intermediates
Medium Fertilizers, Chlor-alkali – –
Low Soda ash Paints, inks & printing
inks
–
Adopted from www.cpcb.nic.in
9.4 Chlor-Alkali Industries 237

9.5 Tannery Industries
In India, leather and leather products are processed from about 2334 major produc-
tion centers. The main step process with adverse environmental consequences in
these industries is tanning of raw hides by using chromium salts. These industries
are concentrated in a few pockets of Tamil Nadu, West Bengal and Uttar Pradesh
(having 88.5% of the total tanneries in the country) due to the existence of tanning
operations since long and proximity to the port for exporting the products.
Environmental Impacts of Tannery Industries The environmental impacts of tan-
ning industry wastes are contamination of surface water bodies with effluent having
high oxygen demand, and toxic chemical constituents and discoloration of water
bodies (Song et al. 2000). Tannery waste contains both organic (chlorinated phe-
nols) and inorganic (chromium) pollutants (Mwinyihija et al. 2006). Other pollut-
ants of concern with the tanning industry include azodyes, cadmium compounds,
cobalt, copper, antimony, barium, lead, selenium, mercury, zinc, arsenic,
polychlorinated biphyenls (PCB), nickel, formaldehyde resins and pesticides resi-
dues. All these pollutants that released into the environment due to the tanning
process lead to deterioration of air, water and soil quality. According to WHO
report, more than 8000 workers in the tanneries of Hazaribagh, India suffer from
gastrointestinal, dermatological, and other diseases, and they die mostly before the
age of 50 (Maurice 2001). In other separate studies in Kanpur, India, Rastogi et al.
(2008) has also indicated that there is a significantly higher prevalence of morbidity
among tannery industry workers, mostly from respiratory diseases because of
chromium exposure.
9.6 Pesticide Industries
The agro-chemical industries in India contribute significantly to the country’seconomy. The agrochemicals market in the country grew at a rate of 11% from
USD 1.22 billion in 8th five year plan to USD 1.36 billion in 9th five year plan.
India is the fourth largest producer of agro-chemicals globally after US, Japan and
China. However the per hectare consumption of agrochemicals in India is very low
(only 0.58 kg) when compared to US (4.5 kg ha�1) and Japan (11 kg ha�1). Among
the crops, paddy consumes maximum share of pesticide (around 28%), followed by
cotton (20%) in India. There are about 150 industrial units technically involved in
the manufacturing of pesticides and more than 500 units engaged in preparation of
formulations in India. India is the largest producer of pesticides in Asia and ranks
12th in the world in terms of pesticide use. Pesticides are not only used for
agricultural purposes, but also in industries (for wood and carpet, wood preserva-
tion, etc.), public health (malaria, dengue fever and cholera) and domestic purposes
such as fly killer, ant killer, repellants. Rodenticides, fungicides, etc.
238 9 Industrial Activities in India and Their Impact on Agroecosystem

Environmental Impacts of Pesticide Industries The wastewater generated from
pesticide industries consists of reaction water from chemical process, process
solvent water, product wash water, stream water. The waste water contains pollut-
ants like halomethanes, cyanides, haloethers, phenols, heavy metals, pesticides, etc.
However, the BOD, COD and TSS contents are very low. Many of the chemicals
used are persistent in nature (Table 9.6) and severely affects soil ecology and find
its way in food chain through plant food materials and affects the human health.
9.7 Phosphatic Fertilizer Industry
There are about 93 fertilizer plants producing single super phosphate in India with
an installed capacity of 7.7 Mt. per year, which are located in AP (9), Assam (1),
Bihar (1), Chhatisgarh (2), Gujrat (7), Haryana (1), Karnataka (2), MP (16),
Maharashtra (17), Rajasthan (22), TN (3), UP (7), WB (5). Besides these 12 fertil-
izer plants are manufacturing di-ammonium phosphates with an installed capacity
of 8.3 Mt. per year. Phosphoric acid is mainly used for manufacturing DAP and
complex fertilizers. Presently, there are 12 phosphoric acid plants having a com-
bined installed capacity of about 2.0 Mt. per annum as P2O5.
The phosphate fertilizer plant produces large amount of waste in the form of
liquid and solid effluents. Phosphogypsum is generated as a by-product of the
phosphoric acid based fertilizer industry and is well recognized as a source of
sulphur (16%) and calcium (21%), chemically present in the form of
CaSO4.2H2O. It also contains some amount of phosphorus (0.2–1.2% P2O5), almost
half of which is present in water soluble form. Different fertilizer industries
generated around 11 Mt. of phosphogypsum in 2012–2013 (based on the assump-
tion that 5 t of phosphogypsum generated per tonne of phosphoric acid production).
Besides, old stocks of over 12 Mt. (nearly 2.2 Mt. of sulphur and 3.0 Mt. Ca) are
lying indisposed at different plant sites as huge waste piles called “stacks”. The
phosphogypsum, unlike other sulphur sources, offers all the desirable fertilizers
characteristics (besides supplying calcium), i.e., readily available to the growing
plant. The product as soil amendments has already been notified by Bureau of
Indian Standards (BIS) for reclamation of sodic soils.
Table 9.6 Persistence of
pesticides in soilsPesticide and their group Persistence
Organophosphates 7–84 days
DDT 10 years
Carbamates 2–8 weeks
Aliphatic acids 3–10 weeks
Diuron 16 months
BHC 11 years
Toxaphene 6 years
9.7 Phosphatic Fertilizer Industry 239

Environmental Threat from Phosphogymsum One of the main concerns on the use
of phosphogypsum is the higher amounts of the radionuclide. During acidifying
process on rock phosphate to produce phosphoric acid, about 80–90% of 226Ra (due
to similarity with Ca in chemical properties) is concentrated in phosphogypsum
while nearly 86% of U and 70% of Th end up in the phosphoric acid (Poole et al.
1995). Radium226 in phosphogypsum further decays to produce Radon gas (Rn222)
emitting carcinogenic alpha particles. USEPA has classified phosphogypsum and
rock phosphate as “Technologically Enhanced Naturally Occurring Radioactive
Materials” (TENORM) (USEPA 2006) and phosphogypsum exceeding 370 Bq kg�1
of radioactivity has been banned from all uses by the EPA since 1992. Depending
on the quality of the source material (phosphate rock), phosphogypsum can
contain as much as 60 times the levels normally found prior to processing. A
study was carried out in India to investigate concentration of naturally occurring
radionuclides in around a phosphate fertilizer plant (Sahu et al. 2014). 238U, 232
Th, 226Ra and 40K activities in soil samples were 21–674 Bq kg�1, 11–44 Bq kg�1,
22–683 Bq kg�1 and 51–295 Bq kg�1 respectively. The soil from the solid waste
disposal area and phosphate rock storage area showed higher levels of natural
radionuclides than other locations within the plant premises. The 238U levels in
phosphogypsum sample were higher than those compared worldwide. The exter-
nal gamma radiation had increased level only in these areas as compared to
background though such increases were not significantly high. Phosphogypsum
also contains fluoride (0.5–1.5%), which may leach down and contaminate
groundwater. It contains heavy metals (cadmium, chromium, lead etc.), which if
applied in agricultural land, may enter into food chain and damage human and
animal health. Extensive reviews (Alcardo and Rechcigl 1993) on the use of
phosphogypsum in agriculture, have revealed that the radionuclides, heavy metals,
fluorides and other pollutants at concentrations found in phosphogypsum, does not
pose any environmental hazards to surface ground water, soils, crops and the ambient
atmosphere at the rates normally used in agriculture. However, its unregulated use in
agriculture may pose threat to the environment.
9.8 Iron and Steel Industry
India is the world’s third-largest producer of crude steel after China and Japan and
has been a major contributor to India’s manufacturing output. The Government of
India is aiming to scale up steel production in the country to 300 Mt. by 2025 from
about 90 Mt. in 2015–2016. There are about 11 major integrated steel industries
operating in the country in the states of Jharkhand, Odisha, Chattisgarh, West
Bengal, Tamil Nadu, Karnataka, Andhra Pradesh and Maharastra. Besides these,
several mini steel plants (about 650) having electric arc furnaces are using steel
scrap and sponge iron. Most of these industries are located nearby coal mining area.
Slag generated from iron and steel making industries have been found to possess
lime supplying potential in acidic soils. Slag materials have been found to contain
240 9 Industrial Activities in India and Their Impact on Agroecosystem

high amount of Ca (about 30–55% CaO) and Si (12–35% SiO2) which are essential/
beneficial elements for plants. Acid soils of India are deficient in these two
elements, requiring their frequent application in crop production. Considerable
researches have also indicated increases in crop yields with the application of
slag materials due to increased supply of Ca and Si to plants. India has quite a
substantial number of iron and steel industries generating 300 to 500 kg slag per
tonne of hot metal produced from blast furnace (BF), electric arc furnace (EAF) or
basic oxygen furnace (BOF). Considering projected crude steel production of 140 Mt.
(http://steel.gov.in/overview.htm) and average slag generation @ 400 kg t�1 of hot
metal (http://ibm.nic.in/imyb2010_slagironandsteel.pdf), India has the potential of
generating more than 50 Mt. of slag by 2016–2017. Although, a portion of the BF
slag find some alternative use (like cement production, road construction etc.),
considerable portion of these may be available for enhancing productivity in acid
soils. Also, most of the iron & steel industries are located in the acid soil regions, thus
minimizing cost of basic slag transportation to agricultural land.
Environmental Threat from Use of Slag The main problem concerning the utiliza-
tion of steel slags in agriculture consists of the possible leaching of heavy metals.
Among heavy metals, steel making slags contain Vanadium (V) and chromium
(Cr) in significantly high concentration. Analysis of steel slags from US and Canada
indicated that slags generated from BOF and EAF contained very high levels of Cr
(23–56 times the avg. background concentration in soil) and V (6–12 times the avg.
background concentration in soil) (Proctor et al. 2000). On the basis of TCLP test,
however, these materials are not considered hazardous waste and do not likely to
contaminated drinking water resources. However, impact of long-term addition of
slag materials to agricultural land has not been investigated. In Sweden, death of
cattle was reported from vanadium poisoning which occurred due to grazing from
slag (containing 3% V) amended land (Frank et al. 1996).
9.9 Aluminium Industry
India is richly endowed with bauxite resources, which is the basic raw material for
aluminium production. The total domestic production of aluminium metal during
FY 2013-14 was about 1.7 Mt. and in FY14-15, total installed smelting capacity
was about 2.9 Mt. The aluminium smelting industries are located in Renukoot
(U.P.), Korba (Chhattisgarh), Alupuram (Kerala), Mettur (T.N.), Jharsuguda,
Angul, Hirakud (Orissa). Alumina refineries are located in Lanjigarh, Dhamajori
(Orissa), Belgaon (Karnataka), Korba (Chhattisgarh), Mettur (T.N.), Renukoot
(U.P.), Muri (Jharkhand).
Environmental Threat from Alumina Refineries and Smelters Alumina and alu-
minium processing creates a range of waste products, the most significant being
bauxite residues (also known as red mud). Red mud is a by-product of the Bayer
process, the principal means of refining bauxite to produce alumina using NaOH.
9.9 Aluminium Industry 241

Depending on quality bauxite, approximately 1.5 metric tons of bauxite residues is
generated with every metric tonne of alumina produced. Red mud is composed of a
mixture of solid and mud of metallic oxides. Iron oxides comprise up to 60% of the
mass of the red mud. The mud is highly basic with a pH ranging from 10 to 13. In
addition to iron, the other dominant components include silica, residual alumina,
and oxides of Ti, Ca and Na (Table 9.7). Besides these, red mud also contains high
amount of several hazardous trace elements As, Pb, Hg, Cd, Cr, Ni, and these are
present in concentrations several times higher than commonly found in unpolluted
soils (Table 9.8). Radioactive elements like 226Ra and 232Th were also found in red
mud at significantly higher concentrations. These hazardous elements as well as
high pH (10–12.5) are major concern for disposal of red mud wastes.
9.10 Copper Refineries and Smelters
The copper industry in India accounts for 3% of the world copper market at about
500 thousand tonnes by size in terms of annual consumption of refined copper. The
country does not have sizable discovered copper reserves and therefore, mined
copper production accounts for only 0.2% of the world’s global production.
Because of the large waste volumes associated with copper production, the
Table 9.8 Hazardous
elemental concentrations in
bauxite residues from alumina
refinery
Trace elements Concentration (mg kg�1)
As 267.3
Pb 56.6
Hg 67.3
Cd 27.1
Cr 537.8
Ni 984.9
Ba 212.0
Zn 103.2
Cu 78.2
Mn 187.5
Wang and Liu (2012)
Table 9.7 Major constituents
of bauxite residues from
Indian alumina refineries
Major oxides Concentration (%)
Al2O3 17.5–22
SiO2 4.8–16
Fe2O3 35–54
TiO2 2.5–19
CaO 0.8–4.5
Na2O 3.3–6.0
Rai et al. (2012)
242 9 Industrial Activities in India and Their Impact on Agroecosystem

processing facilities are usually located near the mines. Copper smelters are located
at Maubhandar (Jharkhand) and Khetri (Rajasthan). The smelter at Maubhandar
(Ghatshila) receives copper ore from Mosabani, Rakha, Dhobani Rajdah,
Tamapahar and Turamdih of Singbhum districts of Jharkhand. Copper smelter at
Khetri receives copper ore from Khetri, Kolihan, Chandmari and Dariba areas of
Rajasthan as well as from Malanjkhand (Madhya Pradesh). Major fraction of
refined copper ore demand for the smelters is met through imports.
Type and volume of wastes as well as their hazardousness depend on quality of
ore (chemical composition) and method of processing of ores. Higher grade ores are
milled to fine particles and copper minerals are subsequently concentrated by
physical separation. The tailings are pumped to the tailings pile and the copper
concentrate is transported to a nearby smelter.
Environmental Threat from Copper Production Industries All aspects of copper
production—from leaching to milling, smelting, refining and electrowinning—have
potential impacts on surface and groundwater quality. Mill tailings from beneficiation
process may contain toxic heavy metals (mainly As, Pb, and Cd) and radionuclides
due to their natural presence in the ore bodies and thus are a potential source of
“Technologically Enhanced Naturally Occurring Radioactive Materials
(TENORM)”. Mill tailings also contain high amount of pyrite/sulfide minerals
which may oxidize to produce sulfuric acid and consequently solubilise heavy metals
& radionuclides to contaminate land and water bodies. Leakage from heap leaching
with acids may also contaminate environment with heavy metals. Smelting opera-
tions in the copper industry emits considerable heavy metals (As, Cd, Cu) in the
atmosphere which subsequently precipitates on land and water bodies far away.
9.11 Zinc and Lead Smelting Industry
Zinc and lead smelters India are either located near zinc ore mines (in Rajasthan) or
near sea ports (as in Vishakhapatnam and Alwaye, primarily dependent on imported
mineral concentrates). Major zinc and lead smelters and refineries in India are
located in Rajasthan state (Chanderiya, Debari and Dariba) with total metal pro-
duction of 880,000 tonnes in year 2014–2015. The ore for these industry is received
from mines of Rampura Agucha, Sindesar Khurd, Rajpura Dariba, Kayar and
Zawar belonging to the state of Rajasthan. Zinc and lead smelter plant at Visha-
khapatnam (A.P.) has an installed capacity of 3000 t Zn, 22,000 t Pb and 75,000 t
sulphuric acid and the plant is primarily dependent of imported mineral concen-
trate. Zinc smelter plant at Alwaye (Kerala) also uses imported zinc concentrates
for its operation.
Environmental Threats from Zinc and Lead Smelters The major air pollutants
emitted from the smelting processes are particulate matter, and SO2, along with
gaseous forms several metals like As, Hg, F etc. in trace amount. Emitted partic-
ulate matters contain oxides of Zn, Pb, As, Hg, Cd, Cu, Sb. All these air pollutants
9.11 Zinc and Lead Smelting Industry 243

upon settling can contaminate water, soil and food crops. Wastewater effluent from
the industry contains dissolved and suspended solids, heavy metals, and oil and
grease having adverse effects on land and water bodies. The smelting process
typically produces less than 3 tons of solid waste (slag and sludge) per ton of
lead/zinc produced. Slag material from the industry may contain 0.5–0.7% lead &
zinc along with many other toxic heavy metals, particularly Cd.
9.12 Paper Industry
There are about 759 paper mills in India having a total installed capacity of 12.7
Mt. and was anticipated to produce around 14 Mt. paper, paper board and newsprint
per year by the year 2016 according to Govt. of India report. Indian share in total
world production is about 2.6%. Among the total paper mills, about 47% is
produced through 579 small & medium scale recycle fibre based mills; 31% is
produced through 30 wood based large mills; and 22% is produced through
150 medium scale agro-based paper mills. Pulp and paper industry consumes
large quantities of fresh water at the rate of 80-150 m3 per tonne of paper. Generally
agro based mills consume much more water than recycle fibre based mills. Paper &
pulp industries also use significant amount sodium hydroxide, sodium carbonates,
sodium sulfide & bi-sulfites, elemental chlorine & hypochlorite, calcium oxide,
hydrochloric acid, etc. during manufacturing of paper and generate larger quantities
of effluents containing organic and inorganic salts and toxic pollutants.
Paper mills, and integrated pulp and paper mills also generate significant amount
of biodegradable sludge (34 and 105 kg t�1 product in large and small paper mills
respectively) during the treatment of organic substances coming out of the paper-
making and pulp making stages. Sludge is the solid residue formed during waste-
water treatment of paper mill effluents. Land filling, land-spreading, composting
and energy production are the major disposal/treatment methods for these sludges.
Environmental Threat from Paper Mill Sludge Paper mill effluents contain fugitive
fibres, starch, hemi-cellulose and organic acids which cause high COD. High
BOD/COD concentration results in depletion of oxygen available to fauna and
flora in the downstream of effluent discharge, depleting quality and quantity of
aquatic life. A large number of organochlorine compounds, such as, chlorinated
derivatives of phenols, acids, dioxins (dibenzo-p-dioxins), furans (Polychlorinated
dibenzofurans) 1,3,6,8-TCDD, etc. are generated during paper production, many of
which are carcinogens (Thacker et al. 2007). Bleaching process effluents may
contain chloroform and carbon tetrachloride, which are also classified as
carcinogens.
244 9 Industrial Activities in India and Their Impact on Agroecosystem

9.13 Molasses Based Distillery Industry
India is the second largest producer of sugar and fourth largest producer of alcohol
in the world. Molasses is used as a raw material in the distillery industries where
alcohol is produced by fermentation processes. There are about 356 molasses based
distilleries and about 110 grain based distilleries in India with an installed capacity
of 4.3 billion liters of alcohol. About 40% of the molasses based distilleries are
attached to the sugar industries. About 64% of these industries are located in five
states only, viz., Andhra Pradesh, Karnataka, Maharashtra, Tamil Nadu, Uttar
Pradesh. Consequently, the wastewater generation from distilleries has gone up to
40 billion liters annually. The effluent generated from distilleries is called raw
spent-wash (RSW). Depending upon the technology and quality of molasses, the
spent wash generation rate can vary from 7.0 to 15.0 liters per liter of alcohol
produced. Spent wash generated in the distilleries is subjected to anaerobic diges-
tion (biomethanation) in many industries for methane recovery and effluent gener-
ated after this process is called post-methanation effluent (PME).
The chemical analysis of RSW and PME clearly showed their high manurial
potential (Table 9.9). Even application of 1 ha-cm effluent to the soil can meet
the N, P, K and S requirements of most of the agricultural crops.
Environmental Threats from Distillery Effluents Distilleries are classified as “Red
Category” among the 17 categories of highly polluting industries by CPCB. Dis-
posal of spent wash, a distillery waste, has long been a problem for the industry.
Seepage of effluent from storage lagoon pond to contaminate groundwater has been
reported at several places which resulted increase in salinity and coloration making
Table 9.9 Chemical
composition of untreated
spent wash (SW) and treated
spent wash (PME)
Parameter SW PME
pH 4.2 7.4
EC (dS m�1) 25.30 25.06
Total solid (g L�1) 98.0 43.0
Organic C (g L�1) 37.5 13.5
Total N (g L�1) 2.02 1.310
Ammoniacal-N (g L�1) 1.254 0.675
Nitrate-N (g L�1) Trace 0.013
Total P (g L�1) 0.24 0.132
Organic P (g L�1) 0.139 0.068
Total K (g L�1) 13.0 11.50
Water soluble K (g L�1) 7.9 8.90
Total S (g L�1) 2.82 0.852
Sulphate-S (g L�1) 1.31 Trace
Chloride (g L�1) 4.05 3.49
BOD (mg L�1) 36,000 3960
COD (mg L�1) 113,240 39,252
Adopted from Biswas et al. (2011)
9.13 Molasses Based Distillery Industry 245

it unsuitable for drinking purposes. Release of distillery effluent may cause rise in
salinity, biological oxygen demand, chemical oxygen demand in surface water
bodies deteriorating water quality for aquatic life. Although the effluent may
facilitate better crop yields at the beginning due to its richness in nutrients (N, P,
K, Ca, S, micronutrients), its continuous or indiscriminate/heavy use may cause
accumulation of salts endangering the soil productivity and quality.
9.14 Leather Industry
There are more than 2000 tannery industry existing in the country, of which about
70% are present in Tamil Nadu andWest Bengal. Leather industry in India is spread
over both organized as well as unorganized sector in India. Unorganized small scale
leather industry is dominated by the presence of family units, which accounts for
over 90% of the total production. The major production centers for leather and
leather products are located in the states of Tamil Nadu, West Bengal and Uttar
Pradesh. Tanning is an important leather processing step and tanning industry has
grown in clusters of Tamil Nadu, West Bengal, Uttar Pradesh and Punjab. Mineral
tanning usually uses chromium in the form of basic chromium sulfate and produces
stretchable leather which is excellent for use in handbags and garments. The leather
processing requires large quantities of chemicals like sodium chloride, chromium
sulphate, calcium and ammonium salts and organic dyes. Wastes and chemicals
produced during washing, dehairing and tanning of the leather are released to water
system causing pollution concerns for the leather industry.
Environmental Threats from Tannery Industry Effluents The effluents generated
from tannery and textile industries are characterized by high value of BOD, COD,
Na and dissolved solids (Table 9.10). The tannery effluents are also ranked as the
highest polluting waste amongst all industrial waters. The effluent from chrome
tannery generally contains much higher suspended solids, dissolved salts, and
several heavy metals particularly Cr compared to those generated from vegetable
tanning. Use of tannery effluents in crop land increases several plant nutrient
contents like N, P and K levels in soil. However it has adverse effect on soil
physical properties as well as builds up heavy metals, particularly Cr in soil.
9.15 Textile Industry
Textile sector is one of the oldest industries in India dating back several centuries.
This sector is one of the largest contributors (approximately 11% of total) to India’stotal exports. The organized textile sector has more than 3400 textile mills both in
small scale industry (SSI) and the non-SSI sectors, producing about 2500 million m2 of cloth apart from 2500 million kg of man-made fibres & filament yarns. Most of
the medium to large cotton textile industries are located in Maharastra, Gujarat and
246 9 Industrial Activities in India and Their Impact on Agroecosystem

Tamil Nadu; while jute mills and woolen industries are concentrated in West
Bengal and Punjab respectively. The textile industry uses high volumes of water
throughout its operations, from the washing of fibres to bleaching, dyeing and
washing of finished products. On average, approximately 200 L of water are
required to produce l kg of textiles.
Environmental Threats from Textile Industry Effluents Colour, high contents
suspended and dissolved solids, residual chlorine, toxic metals (like Cr, As, Cu)
and organic pollutants (mainly dyes) are the major pollutants present in textile mill
effluent. All of these have adverse effect on soil physical properties (due to salts),
plant growth (due to residual chlorine and Na, sulphate), microbial biodiversity
(due to dye compounds and heavy metals) and food quality (due to salts and toxic
elements) when used as irrigation. Many of the textile dyestuffs are resistant to
aerobic degradation and carcinogenic. Textile mill effluent constituents also have
adverse impact on aquatic life when released in surface water bodies.
9.16 Mercury Emission/Discharge in India
Now a days scientific attention on mercury distribution in the environment is being
seriously focused; because this element’s exposure poses a potential health risks to
human and animal. Methyl mercury (CH3Hg), which is the most toxic organic form
of mercury, bioaccumulates in the biota and subsequently gets biomagnified in the
aquatic food chain, especially in fish. Chakraborty et al. (2013) quantified the
anthropogenic emission and major transfer pathways of mercury to the environment
(air, water, soil) in India in the period 2001–2020. Total mercury emissions in India
were approximately 415 t in 2001, 310 ts in 2010, and are projected to rise to 540 t
in 2020. About 76% of these emissions in 2010 went to the atmosphere. The
Table 9.10 Average total pollution load in tannery industry effluent
Parameter Average total pollution load
Typical limits for surface water
disposal
BOD5 (mg O2 L�1) 2000 30–40
COD (mg O2 L�1) 4000 125–250
Suspended solids (mg L�1) 2000 35–100
Cr3+ (mg Cr L�1) 150 1.5–2.0
S2� (mg S L�1) 160 1.0–2.0
Total N (mg N L�1) 160 100
Cl�1 (mg Cl L�1) 5000 Locally specific
SO42� (mg SO4 L
�1) 1400 Locally specific
Oil & grease (mg L�1) 130 Locally specific
TDS (mg L�1) 10,000 Locally specific
pH 6–9 5.5–9.5
UNIDO (2011)
9.16 Mercury Emission/Discharge in India 247

chlor-alkali industry is the major consumer as well as emitter of mercury and
account for 74% of the basic chemicals production in India. The mercury consump-
tion in Indian caustic-chlorine companies is at least 50 times higher than the global
best companies. They alone contribute to about 40% of the total mercury pollution
in the country. On an average, 47 g mercury is lost in the production of 1 t of caustic
soda in the Indian caustic- chlorine industry. This estimate of mercury loss is
however, based on the total caustic soda production, irrespective of the production
process. The average specific mercury loss from mercury cell plants in India is
about 142 g per tonne NaOH produced (http://www.cseindia.org/dte-supplement/
who-responsible.htm). Other industries, which release mercury in atmosphere and
surface water in India, are coal based industries like thermal power plants, steel
industries and cement industries.
Coal, containing about 0.04–0.7 mg kg�1 Hg, is consumed as a source of energy
in various thermal power plants, steel industries etc. India has consumed about
644 Mt. of coal in 2014 through these industries which might have resulted
significant quantity of mercury emission. The total mercury pollution potential
from coal in India is estimated to be 77.91 t a�1, considering average concentration
of mercury in coal as 0.272 ppm (Rai et al. 2013). About 59.29 t a�1 mercury is
mobilized from coal-fired thermal power plants alone.
The iron and steel industry was reported to release as high as 56 mg kg�1 Hg
through dust fall out. The fallout of elemental mercury over the soil-horizon in the
vicinity of a steel plant was reported to be in the range of 60.36 to 836.18 g km�2
month�1 (http://www.cseindia.org/dte-supplement/mercury-menace.htm).
References
Alcaordo LIS, Rechcigl JE (1993) Phosphogypsum in agriculture: a review. Adv Argon 49:55–118
Biswas AK, Ramana S, Singh AB et al (2011) Safe use of distillery effluents in agriculture. IISS
Research Bulletin No. 2, Indian Institute of Soil Science (ICAR), Bhopal
Chakraborty LB, Qureshi A, Vadenbo C et al (2013) Anthropogenic mercury flows in India and
impacts of emission controls. Environ Sci Technol 47:8105–8113
CPCB (2009) Comprehensive environmental assessment of industrial clusters (Ecological impact
assessment Series: EIAS/5/2009-10). Central Pollution Control Board, Delhi. http://cpcb.nic.
in/divisionsofheadoffice/ess/NewItem_152_Final-Book_2.pdf. Accessed 3 Oct 2016
Ferraiolo G, Zilli M, Converti A (1990) Fly ash disposal and utilisation. Chem Biotechnol
47:281–305
FICCI (2013) Development of Indian mining industry – the way forward: non-fuel minerals.
Mines and Metals Division, Federation of Indian Chamber of Commerce and Industry, New
Delhi. http://www.ficci.com/spdocument/20317/Mining-Industry.pdf
Frank A, Madej A, Galgan V et al (1996) Vanadium poisoning of cattle with basic slag.
Concentrations in tissues from poisoned animals and from a reference, slaughter-house mate-
rial. Sci Total Environ 181(1):73–92
Kumar V, Jha GK (2014) Use of fly ash in agriculture: Indian scenario. International Workshop on
Agricultural Coal Ash Uses, 27–29 May 2014. Agricultural Center, Bet Dagan, Israel
Maurice J (2001) Tannery pollution threatens health of half-million Bangladesh residents. Bull
World Health Organ 79(1), Genebra. DOI: 10.1590/S0042-96862001000100018
248 9 Industrial Activities in India and Their Impact on Agroecosystem

MoM (2015) Exploration and mining opportunities in India: an investor guide. Ministry of Mines,
Government of India, New Delhi
Mwinyihija M, Strachan NJC, Dawson J et al (2006) An ecotoxicological approach to assessing
the impact of tanning industry effluent on river health. Arch Environ Contam Toxicol
50:316–324
Pandey VC, Singh N (2010) Impact of fly ash incorporation in soil systems. Agric Ecosyst Environ
136(1–2):16–27
Pandey VC, Singh JS, Singh RP et al (2011) Arsenic hazards in coal fly ash and its fate in Indian
scenario. Resour Conserv Recycl 55(9):819–835
Poole AJ, Allington DJ, Baxter AJ et al (1995) The natural radioactivity of phosphate ore and
associated waste products discharged into the eastern Irish Sea from a phosphoric acid
production plant. Sci Total Environ 173(174):137–149
Proctor DM, Fehling KA, Shay EC et al (2000) Physical and chemical characteristics of blast
furnace, basic oxygen furnace, and electric arc furnace steel industry slags. Environ Sci
Technol 34:1576–1582
Rai S, Wasewar KL, Mukhopadhyay J et al (2012) Neutralization and utilization of red mud for its
better waste management. Arch Environ Sci 6:13–33
Rai VK, Raman NS, Choudhary SK (2013) Mercury in thermal power plants – a case study. Int J
Pure Appl Biosci 1(2):31–37
Ram LC, Masto RE, Srivastava NK et al (2015) Potentially toxic elements in lignite and its
combustion residues from a power plant. Environ Monit Assess 187:4148. doi:10.1007/
s10661-014-4148-0
Rastogi SK, Pandey A, Tripathi S (2008) Occupational health risks among the workers employed
in leather tanneries at Kanpur. Indian J Occup Med 12:132–135
Sahu SK, Ajmal PY, Bhangare RC et al (2014) Natural radioactivity assessment of a phosphate
fertilizer plant area. J Radiation Res Appl Sci 7:123–128
Shukla KN, Mishra LC (1986) Effect of fly ash extract on growth and development of corn and
soyabean seedling. Water Air Soil Pollut 27:155–167
Singh PK, Tripathi P, Dwivedi S et al (2016) Fly-ash augumented soil enhances heavy metal
accumulation and phytotoxicity in rice (Oryza sativa L.); A concern for fly-ash amendments in
agriculture sector. Plant Growth Regul 78(1):21–30
Song Z, Williams CJ, Edyvean RJ (2000) Sedimentation of tannery wastewater. Water Res
34:2171–2176
Thacker NP, Nitnaware VC, Das SK et al (2007) Dioxin formation in pulp and paper mills of India.
Environ Sci Pollut Res Int 14(4):225–226
UNIDO (2011) Introduction to treatment of tannery effluents. United Nations Industrial Develop-
ment Organization. Austria, Vienna
USEPA (2006) Technical report on technologically enhanced naturally occurring radioactive
materials from Uranium mining. Vol 1: Mining and reclamation background.
U.S. Environmental Protection Agency, Washington, DC
Wang P, Liu DY (2012) Physical and chemical properties of Sintering red mud and Bayer red mud
and the implications for beneficial utilization. Materials 5:1800–1810
World Bank (2013) India- diagnostic assessment of select environmental challenges: an analysis
of physical and monetary losses of environmental halth and natural resources (Report
No. 70004-IN). Disaster Management and Climate Change Unit, Sustainable Development
Department, South Asia Region, Washington, DC
Yao ZT, Xia MS, Sarker PK et al (2014) A review of the alumina recovery from coal fly ash, with a
focus in China. Fuel 120:74–85
References 249

Chapter 10
Impact of Different Developmental Projects
on Soil Fertility
Abstract Soil fertility is highly important for countries where economy is depen-
dent considerably on agriculture and animal husbandry. With the ambition of
boosting economic growth many countries like India tap their vast mineral and
human resources and expand industrial sector which also have considerable impact
on soil fertility and agriculture. In order to have sustainable economy of a country, a
harmony between industry and agriculture is highly essential. Though the cost
involving protective and remedial measures appears to cut away the profit of
industrial sector, these are extremely essential for shielding non-renewable soil
resources which anchor the food producing agriculture sector. In order to formulate
effective policies on protective and remedial measures, knowledge on the impact of
different industries is required. This chapter reviews the research carried out
worldwide to study the impact of major industries on soil quality and its conse-
quences on quality of life including human. While some of the industries like
thermal power plants, mining and associated ore beneficiation processes have direct
impact on soil resources, other industries like textiles, paper & pulp, chemical &
petrochemical, distillery etc. affect soil quality via polluted water used for
irrigation.
Keywords Soil • Pollution • Mining • Smelting • Industry • Environmental
impact • Wastes
10.1 Impact of Mining Activities
Impact of mining projects on environment begins from initiation phase, because it
may involve cleaning of wide areas of vegetation to allow entry of machineries for
drilling. In the exploratory phase, feasibility of mining project is explored. If
feasibility is ascertained, subsequent activities like construction of access roads,
cleaning of land, construction of housing facilities for personals and equipment,
active mining are undertaken. All of these are associated with huge adverse impact
on environment; and the severity of impacts varies depending on whether the mine
is operational and abandoned, mining methods used, land topography and the
geological conditions (Bell et al. 2001). The Environmental Impact Assessment
© Springer Nature Singapore Pte Ltd. 2017
J.K. Saha et al., Soil Pollution - An Emerging Threat to Agriculture, Environmental
Chemistry for a Sustainable World 10, DOI 10.1007/978-981-10-4274-4_10
251

(EIA) must assess separately, the impacts associated with all these phases of mining
operations.
In India, every one million ton of coal extracted by surface mining methods
damages a surface area of about 4 ha (Ghosh 1990). Likewise many other mines are
excavating other major and minor metallic and non-metallic minerals having severe
environmental implications. Many workers around the world have reported various
effects of mining which cause massive damage to landscapes and biological
communities on the earth (Banerjee et al. 2004; Dutta and Agrawal 2002; Ekka
and Behera 2011; Ghose 1996; Singh and Singh 2006). The unscientific mining of
minerals poses a serious threat to environment, resulting in the reduction of forest
cover, erosion of soil, pollution of air, water and land and reduction in biodiversity.
Surface mines produce dust from blasting operations and haul roads; many coal
mines produce methane, a greenhouse gas. If mining area is situated near to
agricultural land, wind-blown dust generated from different mining activities
(blasting, excavation, transportation) is likely to get deposited on the surface of
the fertile land (Adewole and Adesina 2011). Such dust particles from excavated
mine pits generally contain high amount of heavy metals (Fig. 10.1).
Therefore, high metal contamination in the soils of surrounding agricultural land
is frequently observed. Erosion of exposed soils, extracted mineral ores, tailings
and fine material in waste rock piles can result in substantial sediment loading to
surface waters which may be deposited on the agricultural land of flood plain area.
Sediments deposited in layers in flood plains/agricultural lands normally contain
sulfide minerals which upon oxidation may reduce pH, mobilize heavy metals,
infiltrate subsoil layer and contaminate food chain (Gitt and Dollhopf 1991; Gould
et al. 1996). Reduction in soil pH can also alter soil biodiversity and reduce soil
fertility. Toxic trace elements, once entered into the soil, remain there for a long
time (several thousands of years). Therefore it is not cheap and easy to rehabilitate
Fig. 10.1 Open-cast copper mine at Malanjkhand, Madhya Pradesh emits contaminated dusts
during blasting
252 10 Impact of Different Developmental Projects on Soil Fertility

the contaminated land near mining site. Extent and severity of soil contamination
depend on the distance and geographical position of the land with respect to mining
area. In the middle and lower reaches of the Mashavera valley in SE Georgia
(USA), most of the irrigated soils under different agricultural land use displayed
a strong enrichment of heavy metals that could be traced back to irrigation with
water polluted by mining wastes (from copper and precious metals mines) over a
period of several decades (Henningsen et al. 2010). The concentrations of total
amounts of Cu, Zn and Cd increased with intensity of land use and amount of
irrigation. There are four major types of mining impacts on water and soil quality.
10.1.1 Acid Mine Drainage (AMD) and Its Impact on Soil
During the mining process, if rocks containing large quantities sulfide minerals are
excavated and exposed to open air, it reacts with water and oxygen to produce
sulphuric acid. This reaction is mediated and further aggravated by a naturally
occurring bacterium called Thiobacillus ferroxidans which survives under acidic
condition. When water is acidified, these organisms get involved and accelerate the
oxidation and acidification processes that result in leaching of even more trace
metals from the mine wastes. Such leaching process continues as long as sulfides in
the rock are exposed to air and water and/or until all sulfides are leached out. This
may last hundreds, even thousands of years according to type of source rock and
local conditions. Acid is carried off the mine site by rainwater or surface drainage
and deposited into nearby streams, rivers, lakes and groundwater. Acid mine
drainage severely degrades water quality, and can kill aquatic life and can make
water virtually unusable.
In coal mining districts, AMD is generally caused by the oxidation and hydro-
lysis of pyrites (FeS2), an accessory mineral occurring in coal and associated strata
(Gray 1996). Coal mining exposes pyrites to atmosphere which subsequently
enhances dissolution of pyrites. This appears to be the main mechanism for the
occurrence of AMD exacerbating the problem of acid rock drainage (Blahwar et al.
2012). According to an estimate, about 19,300 km of streams and rivers, and about
720 km2 of lakes and reservoirs worldwide are adversely affected by mine effluents
(Johnson and Hallberg 2005). The problem of AMD is reported in India as well,
especially in the coalfields of India; however, quantitative estimate about the extent
of impact of AMD on water bodies is not available.
10.1.2 Heavy Metal Contamination and Leaching
Metals in the underground bed rocks are exposed to air and water by mining
activities. When these rocks and minerals are exposed in the aerobic environment,
associated heavy metals are released upon weathering, which contaminate the
10.1 Impact of Mining Activities 253

surrounding ecosystem. The major heavy metals and metalloid introduced through
mining activities are As, Co, Cu, Cd, Pb, Cr, Hg and Zn. After mineralization, these
are leached out and are carried downstream by water. Although these metals are
immobile under neutral pH conditions, low pH of the water due to acid mine
drainage, accelerates the leaching of these metals. In BacKan province of North
Vietnam, mining activities has been found to contaminate soil, water bodies and
plants with heavy metals (Bui et al. 2016). Soils from vegetable fields in the mining
areas were contaminated with Cd, Pb and As; while irrigation water was contam-
inated with Pb. About 71% and 44% of the vegetable samples grown in the area
contained Pb and As respectively more than the safe limits.
10.1.3 Pollution due to Processing Chemicals
The mining companies use large quantity of chemical agents such as cyanide or
sulphuric acid to remove the waste and separate the target mineral from the ore
during beneficiation/ enrichment process. During this process, these chemicals
spill, leak, or leach from the mine site and carry metals to contaminate the nearby
water bodies causing pollution. Most of these chemicals/metals are highly toxic to
humans and wildlife.
10.1.4 Erosion and Sedimentation
Construction and maintenance of roads, open pits, and waste impoundments during
mine development disturbs soil and rock. Due to poor management, prevention and
control strategies, the incidence of soil and sediment erosion is a major problem in
the mine area. The erosion of the exposed earth may carry substantial amounts of
sediment into streams, rivers and lakes. These sediments can clog riverbeds and
dams, smother watershed vegetation, wildlife habitat and aquatic organisms.
Pandey et al. (2014) studied the impact of dumping of mine overburden near the
banks of perennial Damodar River. They claimed that it caused positive topo-
graphic changes (up to 20 m) indicating adverse effects on its hydrological regime.
Due to the extraction of coal, the negative relief change in the form of deep
depression of up to 66 m was created within coal mines. These depression areas
within the abandon mines became the water accumulation zones and caused
pollution of surface and ground water resources.
254 10 Impact of Different Developmental Projects on Soil Fertility

10.2 Impacts due to Smelting Industry
Smelting is the process of separating a metal from the other impurities generally by
heating processed ore concentrates in the presence of added reducing chemical
compounds. The smelting operation produces metal and generates slag, a solid
waste product. Air pollution is the major impact of smelting industry as it emits
sulphur dioxide (SO2) and toxic trace elements into the atmosphere. Emitted SO2
into atmosphere acidifies soil through acid rain. Acidification of soil near smelting
industries is commonly observed and this increases availability of heavy metals to
contaminate food chain (Gunn 1996; Dudka and Adriano 1997; Hamilton et al.
2016). Easily vaporized trace elements (As, Cd, Hg) are also released from the
smelters and get deposited in terrestrial ecosystem to contaminate agricultural land.
Smelters of different metals emit about 77%, 76%, 74%, 71% of total atmospheric
emission of Zn, As, Cd, Cu respectively through anthropogenic activities (Pacyna
and Pacyna 2001) (Table 10.1). Copper smelting results maximum As and Cu
emission into the atmosphere. After being emitted to the atmosphere, trace metals
are subject to transport within air masses and a large part of this gets deposited on
the land mass not only around the source but also in area far away, even crossing
boundaries of the country/ continent (Pacyna and Pacyna 2001). The elemental
contamination and acidification lower soil fertility and reduce soil biodiversity
(Maxwell 1991). Contribution of copper smelting on SO2 emission and conse-
quently to acid rain is higher as compared to other metal smelting due to having
higher sulfide: metal ratio in the ore. Although smelting industries also produce
solid and liquid wastes, their extent of impact on land is smaller as compared to air
emission. Installation of electrostatic precipitator technology in modern smelters
has reduced gaseous emission of metals through capturing of dust particles.
10.3 Impacts due to Textile Industries
The textile industries are classified on the basis of the types of textile fiber they use,
viz., cellulose fibres, protein fibres and synthetic fibres. The type of dyes and
chemicals used to dye different types of fabrics are as below (Ghaly et al. 2014):
• For dyeing cellulose fibres: Reactive dyes (remazol, procion MX and cibacron
F), direct dyes (congo red, direct yellow 50 and direct brown 116), naphthol dyes
(fast yellow GC, fast scarlet R and fast blue B) and indigo dyes (indigo white,
tyrian purple and indigo carmine).
• For dyeing Protein fibres: Acid dyes (azo dyes, triarylmethane dyes and anthra-
quinone dyes) and lanaset dyes (Blue 5G and Bordeaux B).
• For dyeing synthetic fibres: Dispersed dyes (Disperse yellow 218 and disperse
navy 35), basic dyes (basic orange 37 and basic red 1) and direct dyes.
10.3 Impacts due to Textile Industries 255

Table
10.1
Anassessmentofglobal
emissionsoftracemetals(%
oftotal)to
theatmospherefrom
differentanthropogenic
activitiesworldwide
Metal
Combustionof
fuelsin
stationer
sources
Vehicular
traffic
Copper
production
Lead
production
Zinc
production
Pig
iron&
steel
production
Cem
ent
production
Munic
waste
incineration
Sew
age
sludge
incineration
Gold
production
As
16
064
05
75
21
0
Cd
23
044
127
21
10
0
Cr
69
00
00
19
90
30
Cu
27
069
01
10
20
0
Hg
66
03
04
16
50
15
Pb
10
75
55
22
00
00
Ni
90
09
00
00
00
0
Zn
17
07
066
45
10
0
V100
00
00
00
00
0
Se
89
07
12
00
00
0
PacynaandPacyna(2001)
256 10 Impact of Different Developmental Projects on Soil Fertility

Textile industry requires large volume water as well as uses a wide variety of
chemicals during various processes. On an average, 200 L of water are required to
produce 1 kg of textiles. Quite a large fraction of these chemicals and water are
discharged as wastewater causing severe damage to the environment. It is estimated
that about 10% of the dye compounds used in the dying process don’t bind the
fibres/fabrics and are released into the environment through waste water. General
characteristics of untreated wastewater generated from textile industries are
presented in Table 10.2.
Hazardness of the textile industry waste water arises due to presence of signif-
icantly higher concentration of salt, surfactants, ionic metals and their complexes,
toxic organic chemicals and dye chemicals. Many of dyes released and their
breakdown products are toxic, carcinogenic or mutagenic to life forms mainly
because of carcinogens, such as benzidine, naphthalene and other aromatic com-
pounds (Suteu et al. 2009; Zaharia et al. 2009). In absence of adequate treatment,
these dyes can remain in the environment for a long period of time. For instance, the
half-life of hydrolysed Reactive Blue 19 is about 46 years at pH 7 and 25 �C (Hao
et al. 2000). Several heavy metals are constituents of certain group of azo-dyes used
Table 10.2 Characteristics
of typical untreated textile
wastewater
Parameter Range
pH 6–10
EC (mS cm�1) 4.43–8.71
BOD (mg L�1) 80–6000
COD (mg L�1) 150–12,000
Total suspended solids (mg L�1) 15–8000
Total dissolved solids (mg L�1) 2900–3100
Chloride (mg L�1) 1000–6000
Free Chlorine (mg L�1) <10
Sodium (mg L�1) 975–2185
Potassium (mg L�1) 11–19
Fe (mg L�1) 0.017–0.163
Pb (mg L�1) 0.011–0.061
Cu (mg L�1) 0.006–0.311
Cr (mg L�1) 0.015–7.854
F (mg L�1) 0.7–2.2
Ca (mg L�1) 12–28
Mg (mg L�1) 13–29
Mn (mg L�1) 0.001–0.022
Oil & grease (mg L�1) 10–30
NO3-N (mg L�1) <5
SO4 (mg L�1) 600–1000
Total Nitrogen (mg L�1) 70–80
Color (Pt-Co) 50–2500
Hussain et al. (2004) and Eswaramoorthi et al. (2008)
10.3 Impacts due to Textile Industries 257

for coloring which are often highly toxic and carcinogenic. Copper, Cr, Ni and Pb
compounds are common inorganic pigments used.
Appropriate effluent treatment plants effectively remove considerable amount of
organic compounds and most of the heavy metals. However, salts of alkali metals as
well as certain types of azo-dyes (recalcitrant to microbial breakdown) are released
into environment even after wastewater treatment. As a result of irrigation with
effluent from dye and textile industries, considerable accumulation of total organic
dyes in cultivated soil had been observed and such accumulation has also been
transported in plant tissue (Zhou 2001).
Most of the effluents find its way into surface water bodies (rivers, lakes etc.)
which are used in many cases, for irrigation by farmers across the downward
streamline affecting soil quality. Increase in salinity, sodicity, heavy metal contents
are common direct impact on soil fertility. Azo-dyes have been found to affect
adversely the activities of beneficial microorganisms involved in nutrient transfor-
mation, mineralization and cycling processes related to soil fertility. Certain
azo-dye had been found to affect adversely the growth of atmospheric N fixing
cyanobacterium Anabaena sp. (Hu and Wu 2001). Sulfonated azo dye has signif-
icant adverse effect on urease activity, ammonification and nitrification rates in soil
and therefore reduces nitrogen use efficiency in crop production (Khalid et al.
2009). Phytotoxicty of some of the dyes has also been reported by many researchers
(Kalyani et al. 2008; Ayed et al. 2011). Development of soil salinity results in high
demand of irrigation water, poor crop growth (Saha 2005) and crop cover which
indirectly enhances soil erosion during high rainfall events. Increase in sodicity
(due to high Na) results in degradation of soil physical conditions like compaction,
decrease in infiltration rate (causing more soil erosion) besides Na injury to crops.
Such impacts are more severe in areas receiving less rainfall and in soils with high
clay content (i.e. heavy texture).
10.4 Impacts of Paper and Pulp Industry on Soil Quality
Paper and pulp industry is another category of highly polluting industry due to
discharge of high volumes of densely colored toxic waste affluent. Worldwide
paper is mostly produced from cellulose fibres. Less than two third comes from
wood, one third comes from recycled paper and 5% comes from non-wood sources.
Principal industrial processes in the paper production are pulping, bleaching and
paper making.
Some components of the additives used in the paper making process (i.e. acid or
alkali, chlorine, hypochlorite), in maintaining equipment (i.e. PCB in electrical
equipment) or of the raw materials used in the industry (i.e. fuel oil) can pollute the
soil at the plant site and/or at the dump sites used for disposing solid wastes. Waste
water from the industry is rich in dissolved solids such as chloride and sulfate of
258 10 Impact of Different Developmental Projects on Soil Fertility

Na, K, Ca and varying amount of suspended organic materials, including significant
amount of organo-chlorine compounds (Table 10.3). The BOD/COD ratio in paper
industry effluent is normally 1:4 or less, which indicates low biodegradability of the
organic substances. Depending on the type of chemicals used for bleaching, the
waste stream from the bleaching process may contain chlorine compounds and
organics. The mixture of chemicals may result in the formation of a number of toxic
chemicals (such as dioxins, furans, and chlorinated organics). Although the effluent
is generally subjected to a waste water treatment plant, several chemicals simply
“pass through” (i.e. the treatment plant does not significantly reduce the concen-
trations of these pollutants) and accumulate in the rivers and lakes which receive the
treatment plant discharges.
In most of short term research studies, diluted paper mill effluent has been found
beneficial to many crops, as it supplies significant amount of plant nutrients
(Chhonkar et al. 2000). However, it has been found to affect soil health through
development of salinity, alkalinity and degradation of soil physical characteristics
like water holding capacity and bulk density (Giri et al. 2014; Sharma et al. 2014).
Germination of seed and seedling growth have been found adversely affected due to
irrigation with such effluent water (Chhonkar et al. 2000). Magnitude of adverse
impact of paper mill industry effluent on soil depends on climate, soil type as well
as dilution of effluent water in surface water bodies before irrigation. While dry
climatic region promotes accumulation of salts, high rainfall in humid region
facilitates washing of the salts away from the surface layer and improves the soil
health. Similarly, sandy and sandy loam soils with low CEC and high porosity can
be reclaimed easily by soil washing with rain water or good quality irrigation as
compared to heavy textured black soils with less macro porosity.
Table 10.3 Physico
chemical parameters of paper
industry effluent
Parameters Mean valueþSD
Colour Light white
Odor Un pleasant
PH 8.56 þ 0.33
Temp�C 30.33 þ 1.52
Ec(μs) 1300 þ 26.0
TDS(mg/l) 2950 þ 38.0
BOD(mg/l) 380 þ 36.55
COD(mg/l) 1830 þ 81.85
Na(mg/l) 260.99 þ 7.06
Ca(mg/l) 299.66 þ 19.09
Mg(mg/l) 184.2 þ 12.48
Kuzhali et al. (2012)
10.4 Impacts of Paper and Pulp Industry on Soil Quality 259

10.5 Impact of Pesticide Industry on Agroecosystem
Globally, India is the fourth largest producer of agrochemicals, after United States,
Japan and China. More than 60 technical grade pesticides are being manufactured
by more than 125 industries in India. The principal manufacturing steps are
(a) preparation of process intermediates; (b) introduction of functional groups;
(c) coupling and esterification; (d) separation processes, such as washing and
stripping; and (e) purification of the final product. Each of these steps may generate
air emissions, liquid effluents, and solid wastes. The principal air pollutants are
volatile organic compounds (VOCs) and particulate matter (PM). Wastewater from
pesticide manufacturing industries originate from cleaning activities after batch
operation during the synthesis processes. Composition/properties of wastewater
from pesticide industries vary widely: chemical oxygen demand (COD) in the
range of 0.4–73, 000 mg L�1; oil and grease content in the range of 1–13,000 mg L�1; total suspended solids in the range of 4–43,000 mg L�1. They may also contain
toxic organics and pesticide residues which pose threats to the quality of surface
and groundwater. Wastewater from agrochemical/pesticide manufacturing indus-
tries was reported to have pesticide contamination levels as high as 500 mg L�1
(Chiron et al. 2000). Major solid wastes of concern include process and effluent
treatment sludge, spent catalysts, and container residues. Approximately 200 kg of
waste is generated per metric ton of active ingredient manufactured.
Pesticides entering through wastewater are harmful to many organisms includ-
ing microorganisms and consequently, impact on environment in many ways.
• Loss in biodiversity: Continuous pesticides entry into the soil system causes
suppression of sensitive microbes and emergence/promotion of growth of resis-
tant groups. It is known that a range of specific soil microorganisms are playing
an important role in the suppression of soil-borne plant diseases as well as in
plant growth promotion (Kennedy and Smith 1995). Systems with reduced
microbial diversity generally suffer from impaired functioning in respect of
the sustainability of microbial nutrient transformation and plant disease suppres-
sion (Read 1998).
• Impaired nutrient cycling processes: Urea hydrolysis, nitrification, N2 fixation,
organic matter (and associated N, P, S, micronutrients) mineralization processes
in soil are inhibited (Shaw and Robinson 1960; Potera 2007; Lo 2010). As a
result, nutrient use efficiency from manures and fertilizers decreases necessitat-
ing additional application of fertilizer nutrients to maintain higher yields.
• Development of resistance among targeted organisms towards pesticides: Due to
this, many groups of pesticides lose efficacy in controlling diseases/pests,
requiring either higher doses of application and even newer formulation.
260 10 Impact of Different Developmental Projects on Soil Fertility

10.6 Impact of Thermal Power Plants
India’s power requirement is largely met through thermal power production. India
has quite a significant number (>85) of thermal power plants operating all over the
country. Coal based power plants significantly impact the local environment. This
sector uses huge amount of coal as fire. However major problem associated with
Indian coal is its high ash content. Direct impacts resulting from construction and
ongoing operations of thermal power plants include:
• Air Pollution due to thermal power plants occurs due to atmospheric release of
particulates, ozone, sulphur oxides, nitrous oxides, volatile organic compounds
(VOC), toxic metals and other hazardous chemicals. Atmospheric fall-out of
heavy metals originated from these plants into the agricultural land can be
sometimes quite significant. Considering average emission factors proposed by
Pacyna and Pacyna (2001), thermal power plants in India also emit annually
67.8 t of As, 33.9 t of Cd, 576.3 t of Cr, 474.6 t of Cu, 678 t of Ni, 339 t of Pb,
339 t of V and 271.2 t of Se. Ozone, SO2 and NO2 are also known
phytotoxicants. Also, such air pollution, if occurs with severe intensity, may
result in acid rain causing damage to plants and soil.
• Water Pollution occurs due to discharge of effluents in local water streams,
rivers and groundwater and percolation of hazardous materials from the stored
fly ash.
• Land Degradation occurs due to alterations of land used for storing fly ash.
During the power generation huge quantity of ash is disposed and dumped on the
valuable land area. Approximately an acre of land is required per MW of
installed thermal capacity for ash disposal. Many of India’s thermal power plants
are located on non-forest area, and therefore, resettlement and rehabilitation
problems have not occurred much. Even then the adverse impacts of emission
and ash dumping on flora and fauna, wild life and human life have been found
quite significant and sometimes alarming. The most serious land related problem
of thermal power plants is its requirement for ash disposal along with percolation
of hazardous elements to ground water through disposal in ash ponds.
• Soil contamination with heavy metals due to activities of thermal power plant
running on coal has been reported. Ozkul (2016) reported varying degree of
contamination of surface soils with As, Hg, Ni, and Cr around thermal power
plants as evidenced by high geoaccumulation index and enrichment factor.
• Aerial Deposition of emitted trace and toxic metals on agricultural land has been
widely reported causing adverse effect on soil ecology, nature and extent of
which depends on the distance from power plants, duration of deposition and
their concentrations in coal (Pacyna and Pacyna 2001; Rind et al. 2013). Fly-ash
generated from thermal power plants disturbs microbial activities in the soil by
decreasing their population and also by decreasing the enzymatic activities like
phosphatase, sulphatase, dehydrogenase and invertase responsible for several
nutrient transformation processes (Pitchel and Hayes 1990; Wong and Wong
1986). Addition of fly ash particularly to sandy soil greatly inhibited the
10.6 Impact of Thermal Power Plants 261

microbial respiration, enzymatic activity and soil N cycling processes like
nitrification and N mineralization (Garau et al. 1991). Depending on the coal
type, fly ash may contain significant variable concentrations of essential plant
nutrient elements as well as toxic heavy metals (Table 10.4). Fly ash has been
found to contaminate soils with heavy metals (Swamy et al. 2010); however,
their uptake by plants has rarely been observed. In Shaoguan City of Guangdong
Province (China), substantial build-up of As, Cd, Cu, Pb, and Zn in soil had been
recorded in the predominant wind direction of the power plant (Wang et al.
2016). Average Cd (0.69 mg kg�1) and Pb (0.39 mg kg�1) contents in rice grain
grown in the area had exceeded their maximum permissible limits (0.2 mg kg�1
for both the element) in foods of China indicating potential health risk to the
local residents.
• Coal contains a little amount of radioactive elements (on an average about 1 ppm
Uranium and 2 ppm thorium) which gets concentrated in ash and also emitted in
the atmosphere. It has been reported that threat due to radioactivity nearby coal
based thermal power plants is higher than that near pressurized-water or boiling-
water reactors of nuclear power plants (McBride et al. 1978). Levels of radio-
activity (due to naturally occurring radioactive metals 232Th, 228Ra, 238U, 226Ra,
and 210Pb) in the ash were up to five times higher than in normal soil, and up to
10 times higher than in the parent coal itself as combustion concentrates
radioactivity (Lauer et al. 2015). Therefore, concern on build up of naturally
occurring radioactive materials in soil has often been raised with repeated
application of fly ash as soil amendment during crop husbandry. Large number
of demonstration experiments conducted under Fly Ash Mission of Govt. of
India revealed that radioactivity levels in the soils were within the safe limits and
the grains, straws and vegetables produced from fly ash amended soils are safe
for human and animal consumption (Table 10.5). However, information on
impact of repetitive fly ash application on radionuclides accumulation in soils
is practically absent. Such information is required before recommending this
waste as soil amendment in crop production.
10.7 Impact of Nuclear Power Plants
A nuclear power plant starts disturbing the environment during its construction.
New roads, increasing traffic flow in the existing roads, excavations, cutting trees
and other plants, are some of the adverse impacts on land to be expected during the
construction of a power plant. Site selection for nuclear power plants should be
carefully made to avoid, or minimize to the extent possible, most of those impacts.
The environmental impact of nuclear power plants results from the nuclear fuel
cycle, operation, and the effects from nuclear accidents.
262 10 Impact of Different Developmental Projects on Soil Fertility

Radioactive effluents released from nuclear power plants are normally moni-
tored and controlled to minimize exposure of the public to ionizing radiation. The
total amount of radioactivity released through gaseous and liquid radiological
effluents depends on the technologies used during installation of power plant, the
regulatory requirements, and the plant’s performance. As far as contamination
through liquid release is concerned, tritium (3H) is by far the most dominant
Table 10.4 Physical and chemical properties of fly ash
Properties
Contentsa (global
review) Contents in fly ash generated in Indiab
Physical properties
Bulk density (g cm�3) <1.0 0.85–1.2
Water-holding capacity
(%)
35–40 45–60
Porosity (%) 50–60 45–55
Plant nutrients contents (%)
N – –
P 0.004–0.8 –
K 0.15–3.5 0.03–0.7
Ca 0.11–22.2 0.14–5.7
Mg 0.04–7.6 0.006–0.3
S 0.1–1.5
Al 0.1–17.3 14.2–23.3
Na 0.01–2.03 0.05–0.31
Fe 36–1333 3.3–6.4
Si 17.8–29.4
Trace element contents (mg kg�1)
Mn 58–3000 500–750
Zn 10–3500 50–150
Cu 14–2800 40–80
B 10–618 17–38
As 2.3–6300 1.0–4.0
Cd 0.7–130 5–10
Co 7–520 10–50
Cr 10–1000 50–150
Hg 0.02–1.0 BDL
Mo 7–160 2.2–6.7
Ni 6.3–4300 50–150
Pb 3.1–5000 10–70
Se 0.2–134 0.6–2.6
Radioactivity levels in fly ash (Bq kg�1)
226Ra – 30–110228Ac – 30–11040K – 180–500
Source: a Basu et al. (2009); b NTPC (2015)
10.7 Impact of Nuclear Power Plants 263

radionuclide released routinely. In terms of radioactivity, liquid releases of all other
radionuclides combined correspond only about 1% of that released by tritium
discharges. The movement of radionuclides in the environment depends on several
factors, like point of release, rate of release, chemical form, natural constituents of
the surrounding environment, among others. Tritium (half-life of 12.3 years) emits
radioactive beta particles. Once tritium is inhaled or swallowed, its beta particles
can bombard cells. If a particle zaps a DNA molecule in a cell, it can cause genetic
mutation. The primary concern for tritium release is its presence in drinking water,
irrigation water and other aquatic environment. Biological magnification of tritium
in crops and animals consumed for food can occur when such contaminated water is
used for irrigation and drinking.
A nuclear power plant should store gas and liquid radioactive materials gener-
ated during normal operation in tanks for a period of time to allow for the
radioactivity level to decrease before being treated and/or released in a planned,
monitored way. This is required to keep the amount of radioactive material in
releases low and within regulatory limits. However, adverse impact of nuclear
power plants becomes significant under emergency situation where accidental
release of large amount of harmful radionuclides like iodine (131I), and caesium
(134Cs, 137Cs) occur. Radioactive 131I has a half-life of 8 days and decays naturally
within weeks. It may only be present in the environment for several weeks after the
release has occurred. Radioactive caesium (134Cs has a half-life of approximately
2 years and 137Cs has a half-life of approximately 30 years) can persist in the
environment for longer time. For example traces of caesium-137 (137Cs) have been
found in the environment for several years after the accident at the power station at
Chernobyl and Fukushima Daiichi Power Plant.
The radioactive material in the air can settle or deposit on soil and local
vegetation. Cow milk can also get contaminated when contaminated pasture grasses
are fed to cattle population. Therefore, samples of air, soil, food products, milk etc.
from nearby areas of the power plants are required to be analyzed periodically. All
water bodies like lakes, ponds, and streams nearby nuclear power plants are
Table 10.5 Daily intake ratio of radio nuclides through eatables grown with fly ash
Food items
Maximum radionuclide level (Bq kg�1)40K 226Ra 228Ac
Grain 95 0.75 1.0
Vegetable 85 0.50 0.8
Daily intake of radionuclide (Bq kg�1) based on average dietary intake
Grain 38 0.30 0.4
Vegetable 17 0.10 0.16
Total 55 0.40 0.56
Safe limit (Bq kg�1) 173.34 1.00 3.67
Kumar and Jha (2014)
264 10 Impact of Different Developmental Projects on Soil Fertility

required to be inspected periodically for the presence of radioactive material; and
more so is the water samples from the liquid waste stream released from the plant.
10.8 Impact of Hydropower Industry
Hydroelectric power plants include both massive hydroelectric dams and small
run-of-the-river hydroelectric plants. The size of the reservoir created by a hydro-
electric project can vary widely, depending largely on the capacity of the hydro-
electric generators and the topography of the land. Hydroelectric plants in flat areas
require much more land than those in hilly areas or canyons where deeper reservoirs
can hold more volume of water in a smaller space. Flooding land for a hydroelectric
reservoir has an extreme environmental impact as it destroys forest, wildlife and
human habitat, agricultural and other land.
Estimates for life-cycle GHGs emissions from hydroelectric plants built in
tropical areas or temperate peat lands are quite high. After the reservoir is flooded,
the vegetation and soil organic matter in the area decompose and release both
carbon dioxide and methane. The exact amount of emissions depends greatly on
site-specific characteristics. Current estimates suggest that life-cycle emissions can
be over 225 gram of carbon dioxide equivalent per kilowatt-hour (IPCC 2011).
Thus, estimates of life-cycle global warming emissions for natural gas generated
electricity are between 272 and 900 gram of CO2 equivalent per kilowatt-hour and
estimates for coal-generated electricity are between 635 and 1633 gram of CO2
equivalent per kilowatt-hour (IPCC 2011).
10.9 Impact of Distillery Industry
Distillery is the agro-based industry and uses mainly molasses (with few using grain
or fruits) to produce alcohol. However, this industry produces considerable amount
of liquid effluent (called spent wash) which is estimated at the rate 12–15 times of
volume of alcohol produced. It is one of the most complex, troublesome and
strongest organic & acidic (pH 4.3–5.3) industrial effluents, having extremely
high COD, BOD values, total dissolved and suspended solids, high contents of K,
Cl�, and SO4�2. Therefore, such spent wash has significant environmental impact,
particularly on land and water resources. Treatment of spent wash is generally
accomplished by two different routes viz.; (a) concentration in solar ponds followed
by incineration, and (b) anaerobic digestion with biogas recovery (biomethanation)
followed by concentration in solar pond. Even after biomethanation, organic matter
and mineral content in the effluent remains very high and at more than the
permissible limits. Evaporation pond with quite a large area is required for produc-
ing sludge, thereby destroying fertile land. Moreover, in several cases, effluents
10.9 Impact of Distillery Industry 265

percolate to contaminate groundwater with salts and sometimes with organics,
extent of which depends upon nature of geological formation. Light texture of
soil lining the pond and fractured underground rocks facilitate groundwater con-
tamination with distillery effluent from lagoon pond. During rainy season, high
rainfall events can wash out distillery effluents and sludge to contaminate surface
water bodies (thus impacting aquatic life) and land masses. Use of contaminated
water (both surface and groundwater) for irrigation to agricultural land may have
adverse impact on soil quality by increasing salinity and sodicity.
10.10 Impact of Infrastructure Projects
Airports, road, bridges, transportation, communication, sewage treatment and dis-
posal, drinking water and electricity distribution systems are all examples of
infrastructure. These infrastructural projects normally require high-cost invest-
ments; and of course, are vital to a country’s economic development and prosperity.
However, infrastructure projects also have considerable impact on soil resources,
the nature and extent of which depend on the type of projects and associated
activities.
Soil degradation is one of the most significant impacts of highway construction,
which can alter the soil developmental level and soil structure, damage soil texture,
lead to loss of the organic matter and inorganic nutrients in soil, reduce soil fertility
and water holding capacity, deteriorate soil quality, cause soil erosion, and limit soil
productivity (Zhao 2002). Soil is disturbed heavily by highway construction activ-
ity, such as slope fill and slope cut, invasion of a large number of artificial soils, and
destruction of original soil and humus layer (Xu et al. 2006). Studies have shown
that soil pH and bulk density are higher, soil moisture and nutrient levels are lower
near road, and soil layer thickness is altered, which is related to destruction of soil
layer from road construction, dust origin from traffic and destruction of vegetation
(Auerbach et al. 1997). Road construction also causes sheet, rill and gully erosions,
which are mainly related to soil type, slope length and change in the direction of
water flow due to construction. Therefore, soil quality changes significantly near
highway: the contents of clay particles, soil organic matter and nutrient content
declines while pH increases with different degrees and ranges (Zhao et al. 2007).
Parking lots treated with coal tar based seal coat are a major source of cancer
causing contaminants that can pollute air, soil, water and wildlife, posing a signif-
icant health risk to humans who may breathe, drink or consume them through fish
and other foods. Coal-tar based sealants contain high levels of polycyclic aromatic
hydrocarbons (PAHs). The persistent cancer causing PAHs widely pollute the
environment, wildlife and people.
Construction of buildings using bricks also has high impact on precious soil
resources. In India, bricks are prepared from top fertile soils and thereby destroying
soil productivity which has been built-up through millions of years of soil forming
processes. As top soil layers are most fertile, impact of brick-making on loss of soil
266 10 Impact of Different Developmental Projects on Soil Fertility

productivity is huge. Construction of road, buildings, industries make a concrete
sealing of land surface. As land surface facilitates percolation of rainwater through
profile to recharge groundwater and reduces runoff, it’s sealing due to infrastructureand housing projects leads to impeded underground recharge and enhanced
partitioning of rainwater towards surface flow causing floods. Destruction of veg-
etation to facilitate different infrastructure projects leads to clearing of land and
facilitation of soil loss through runoff water during monsoon season.
References
Adewole MB, Adesina MA (2011) Impact of marble mining on soil properties in a part of Guinea
savanna zone of southwestern Nigeria. Ethiopian J Environ Stud Manag 4(2):1–8
Auerbach NA, Walker MD, Walker DA (1997) Effects of roadside disturbance on substrate and
vegetation properties in Arctic Tundra. Ecol Appl 7:218–235
Ayed L, Mahdhi A et al (2011) Decolorization and degradation of azo dye Methyl Red by an
isolated Sphingomonas paucimobilis: biotoxicity and metabolites characterization. Desalina-
tion 274:272–277
Banerjee SK, Mishra TK, Singh AK et al (2004) Impact of plantation on ecosystem development
in disturbed coal mine overburden spoils. J Trop For Sci 16:294–307
Basu M, Pande M, Bhadoria PBS, Mahapatra SC (2009) Potential fly-ash utilization in agriculture:
a global review. Prog Nat Sci 19:1173–1186
Bell FJ, Bullock SET, Halbich TFJ et al (2001) Environmental impacts associated with an
abandoned mine in the Witbank Coalfield, South Africa. Int J Coal Geol 45:195–216
Blahwar B, Srivastav SK, Smeth JB (2012) Use of high resolution satellite imagery for investi-
gating acid mine drainage from artisanal coal mining in North-Eastern India. Geochem Int
27:231–247
Bui ATK, Nguyen HTH, Nguyen MN et al (2016) Accumulation and potential health risks of
cadmium, lead and arsenic in vegetables grown near mining sites in Northern Vietnam.
Environ Monit Assess 188(9):525. doi:10.1007/s10661-016-5535-5
Chhonkar PK, Datta SP, Joshi HC, Pathak H (2000) Impact of industrial effluents on soil health
and agriculture – Indian experience: Part 1 – Distillery and paper mill effluents. J Sci Ind Res
59:350–361
Chiron S, Fernandez-Alba A, Rodriguez A, Garcia-Calv E (2000) Pesticide chemical oxidation:
state-of-the-art. Water Res 34:366–377
Dudka S, Adriano DC (1997) Environmental impacts of metal ore mining and processing: a
review. J Environ Qual 26:590–602
Dutta RK, Agrawal M (2002) Effect of tree plantations on the soil characteristics and microbial
activity of coal mine spoil land. Trop Ecol 43:315–324
Ekka JN, Behera N (2011) Species composition and diversity of vegetation developing on an age
series of coal mine spoil in an open cast coal field in Orissa, India. Trop Ecol 52:337–343
Eswaramoorthi S, Dhanapal K, Chauhan D (2008) Advances in textile waste water treatment: the
case for UV-ozonation and membrane bioreactor for common effluent treatment plants in
Tirupur, Tamil Nadu, India. Environmental technology awareness series 1–17
Garau MA, Dalmau JL, Felipo MT (1991) Nitrogen mineralization in soil amended with sewage
sludge and flyash. Biol Fertil Soils 12:199–201
Ghaly AE, Ananthashankar R, Alhattab et al (2014) Production, characterization and treatment of
textile effluents: a critical review. J Chem Eng Process Technol 5:182. doi:10.4172/2157-7048.
1000182
References 267

Ghose MK (1996) Damage of land due to coal mining and conservation of topsoil for land
reclamation. Environ Ecol 14:466–468
Ghosh AK (1990) Mining in 2000 AD – challenges for India. J Inst Eng (India) 39:1–11
Giri J, Srivastava A, Pachauri SP, Srivastava PC (2014) Effluents from paper and pulp industries
and their impact on soil properties and chemical composition of plants in Uttarakhand, India. J
Environ Waste Manag 1: 26–30
Gitt MJ, Dollhopf DJ (1991) Coal waste reclamation using automated weathering to predict lime
requirement. J Environ Qual 20:285–288
Gould AB, Hendrix JW, Ferriss RS (1996) Relationship of mycorrhizal activity to time following
reclamation of surface mine land in western Kentucky. I Propagule and spore population
densities. Can J Bot 74:247–261
Gray NF (1996) Field assessment of acid mine drainage contamination in surface and ground
water. Environ Geol 27:358–361
Gunn JM (1996) Restoring the smelter-damaged landscape near Sudbury, Canada. Restor Manag
Notes 14:129–136
Hamilton JG, Farrell RE, Chen N et al (2016) Characterizing Zinc speciation in soils from a
smelter-affected boreal forest ecosystem. J Environ Qual. doi:10.2134/jeq2015.03.0145
Hao OJ, Kim H, Chang PC (2000) Decolorization of wastewater. Crit Rev Environ Sci Technol
30:449–505
Henningsen FP, Urushadze TF, Steffens D, Kalandadze BB, Narimanidze EI (2010) Uptake of
heavy metals by food crops from highly-polluted Chernozem-like soils in an irrigation district
south of Tbilisi, eastern Georgia. Agron Res 8:781–795
Hu T, Wu SC (2001) Assessment of the effect of azo dye RP2B on the growth of a nitrogen fixing
cyanobacterium – Anabaena sp. Bioresour Technol 77:93–95
Hussain J, Hussain I, Arif M (2004) Characterization of textile wastewater. J Ind Pollut Control
20:137–144
IPCC (2011) IPCC special report on renewable energy sources and climate change mitigation. In:
Edenhofer O, Pichs-Madruga R et al (eds) Working Group III of the Intergovernmental Panel
on Climate Change. Cambridge University Press, Cambridge/New York, p 1075
Johnson DB, Hallberg KB (2005) Acid mine drainage remediation options: a review. Sci Total
Environ 338:3–14
Kalyani DC, Patil PS et al (2008) Biodegradation of reactive textile dye Red BLI by an isolated
bacterium Pseudomonas sp. SUK1. Bioresour Technol 99:4635–4641
Kennedy AC, Smith KL (1995) Soil microbial diversity and the sustainability of agricultural soils.
Plant Soil 170:75–86
Khalid A, Arshad M, Crowley DE (2009) Biodegradation potential of pure and mixed bacterial
cultures for removal of 4-nitroaniline from textile dye wastewater. Water Res 43:1110–1116
Kumar V, Jha GK (2014) Use of fly ash in agriculture: Indian scenario. International workshop on
agricultural coal ash uses, 27–29 May 2014. Agricultural Center, Bet Dagan, Israel
Kuzhali SS, Manikandan N, Kumuthakalavalli R (2012) Physico chemical and biological param-
eters of paper industry effluent. J Nat Prod Plant Resour 2:445–448
Lauer NE, Hower JC, Hsu-Kim H, Taggart RK, Vengosh A (2015) Naturally occurring radioactive
materials in coals and coal combustion residuals in the United States. Environ Sci Technol
49:11227–11233
Lo CC (2010) Effect of pesticides on soil microbial community. J Environ Sci Health 45:348–359
Maxwell CD (1991) Floristic changes in soil algae and cyanobacteria in reclaimed metal-
contaminated land at Sudbury, Canada. Water Air Soil Pollut 60:381–393
McBride JP, Moore RE, Witherspoon JP, Blanco RE (1978) Radiological impact of airborne
effluents of coal and nuclear plants. Scientia 202:1045–1050
NTPC (2015) Use of ash in agriculture – grey to green revolution, Fly Ash Utilization Programme,
TIFAC, DST. Published by NTPC Limited, New Delhi
Ozkul C (2016) Heavy metal contamination in soils around the Tuncbilek Thermal Power Plant
(Kütahya, Turkey). Environ Monit Assess 188:284
268 10 Impact of Different Developmental Projects on Soil Fertility
Pacyna JM, Pacyna EG (2001) An assessment of global and regional emissions of trace metals to
the atmosphere from anthropogenic sources worldwide. Environ Rev 9:269–298
Pandey B, Agrawal M, Singh S (2014) Coal mining activities change plant community structure
due to air pollution and soil degradation. Ecotoxicology 23:1474–1483
Pitchel JR, Hayes JM (1990) Influence of fly ash on soil microbial activity and population. J
Environ Qual 19:593–597
Potera C (2007) Agriculture: pesticides disrupt nitrogen fixation. Environ Health Perspect 115:
A579
Read DJ (1998) Plants on the web. Nature 396:22–23
Rind AM, Mastoi GM, Hullio AA (2013) Impacts of Jamshoro thermal power station on soil of the
surrounding area. Indian J Sci Res Technol 1:65–71
Saha JK (2005) Changes in salinity and sodicity of soils with continuous application of contam-
inated water near industrial area. J Indian Soc Soil Sci 53:612–617
Sharma V, Garg UK, Arora D (2014) Impact of pulp and paper mill effluent on physico-chemical
properties of soil. Arch Appl Sci Res 6:12–17
Shaw WM, Robinson B (1960) Pesticide effects in soils on nitrification and plant growth. Soil Sci
90:320–323
Singh AN, Singh JS (2006) Experiments on ecological restoration of coal mine spoil using native
trees in a dry tropical environment, India: a synthesis. New For 31:25–39
Suteu D, Zaharia C, Bilba D, Muresan A, Muresan R, Popescu A (2009) Decolorization waste-
waters from the textile industry – physical methods, chemical methods. Ind Text 60:254–263
Swamy N, Dash N, Nahak G et al (2010) Effect of coal fly ash on growth, biochemistry, cytology
and heavy metal content of Allium cepa. NY Sci J 3:10–16
Wang X, Zeng X, Chuanping L et al (2016) Heavy metal contaminations in soil-rice system:
source identification in relation to a sulfur-rich coal burning power plant in Northern Guang-
dong Province, China. Environ Monit Assess 188:460–471
Wong MH, Wong JWC (1986) Effects of flyash on soil microbial activity. Environ Pollut A
40:127–244
Xu X, Zhang K, Kong Y et al (2006) Effectiveness of erosion control measures along the Qinghai–
Tibet highway, Tibetan plateau, China. Transportation Res Part D 11:302–309
Zaharia C, Suteu D, Muresan A, Muresan R, Popescu A (2009) Textile wastewater treatment by
homogenous oxidation with hydrogen peroxide. Environ Eng Manag J 8:1359–1369
Zhao JQ (2002) Highway traffic and environmental protection (in Chinese). China Communica-
tions Press, Beijing, pp 34–39
Zhao SQ, Cui BS, Gao LN, Liu J (2007) Effects of highway construction on soil quality in the
Longitudinal Range-Gorge Region in Yunnan Province. Chin Sci Bull 52:192–202
Zhou Q (2001) Chemical pollution and transport of organic dyes in water soil crop system of the
Chinese Coasts. Bull Environ Contam Toxicol 66:784–793
References 269

Chapter 11
Status of Soil Pollution in India
Abstract Industrial sector in India is witnessing rapid growth since the last decade
of twentieth century with reforms in economic laws and with establishment of
special economic zones (SEZ). Such rapid industrial growth has also increased
threat to the environment. In spite of great difficulty in its remediation in compar-
ison with polluted air and water, soil pollution as a threat to human life is by and
large ignored at national level in India due to lack of comprehensive information on
the subject. Though coordinated effort on assessment of soil pollution is absent at
national level, sporadic information has been generated by several researchers on
various aspects of pollution affecting soil quality. This chapter analyses these
information and attempts to assess the quantum of threat being faced by
agroecosystem in the country. It indicates that soil resources are facing threats
from deliberate use of contaminated organics, amendment materials and irrigation
water or from atmospheric depositions, spillage of effluents etc. Nature pollutants
varies from salts, toxic metals, metalloids, persistent organics with varying degree
of toxicity and may be of both industrial and geogenic origins.
Keywords Soil • Pollution • India • Heavy metals • Groundwater • Organic
pollutants • Salinity
Over the years agriculture has been the major source of livelihood of the Indian
population. During the period from 1940–1970, there was restrictive growth of
private sector and Gross Domestic Product (GDP) grew at a rate of 1.4% per
annum. In 1994–1995 the industrial sector registered remarkable 8.4% growth
and its contribution in GDP increased thereafter. However, rapid industrial growth
was also associated with surge in release of toxic effluents in the environment,
including land and water bodies. Entry of pollutants directly (release of effluents on
land) or indirectly (use of polluted water as irrigation to crops) has been reported to
contaminate vast area of soil resources and groundwater bodies, affecting crop
production as well as human and animal health through food contamination. As per
the latest available estimate, about 33,900 million litres per day (MLD) urban waste
water and 23,500 MLD industrial waste water was generated in our country during
2009, polluting water and soil resources of India. Small scale industries with less or
no effluent treatment plants are considered bigger polluter than big industries. In
another category of soil pollution, pollutant chemicals enter into the soil body
© Springer Nature Singapore Pte Ltd. 2017
J.K. Saha et al., Soil Pollution - An Emerging Threat to Agriculture, Environmental
Chemistry for a Sustainable World 10, DOI 10.1007/978-981-10-4274-4_11
271

through processes uncontrollable by land owners. For example, air borne pollutants
enter the soil body from the emissions from several industries, power plants,
vehicles, radioactive and toxic chemical fallouts during disasters. Gas-dust releases
into the atmosphere under high temperature technological processes (e.g. power
plants, metal smelting, the burning of raw materials for cement, etc.), waste
incineration, vehicular activities and fuel combustion; and get deposited on land
surface far away from source of generation. All these pollutant activities call for a
need to develop a database on pollutant element contamination in soil and water so
that remedial measures can be undertaken to protect our soil resources.
11.1 Land Use Pattern in India
India has a total land area of approximately 328 million hectares. Land utilization
statistics are available for almost 93% of the entire area that is around 306 million
hectares. The land use pattern of India is as below:
Agricultural land : 43.6%
Permanent pastures and meadows : 4.6%
Cultural wastelands : 12.2%
Forests : 10.7%
Barren and uncultivable land : 8.4%
Urban land : 5.3%
No information available : 5.2%
The mounting population and advanced standards of living have resulted in an
ever increasing demand for residential land, both in villages and towns. Land is also
needed to develop industry, commerce, transport and recreational facilities. Area
under non-agricultural use includes all lands occupied by buildings, roads, railways,
industrial establishments or that under water, e.g. rivers and canals etc. The
increasing area under non-agriculture use driven by population growth is of major
concern. Land under non-agricultural uses increased by 11.73 million hectares
during 1950–2000. The increasing population and change in life style would further
aggravate the pressure on agricultural land in the future.
11.2 Soil Degradation in India
Soil degradation is the decline in quantity and quality of soil. It includes:
(a) Erosion by wind and water; (b) Biological degradation (the loss of humus and
plant/animal life); (c) Physical degradation (loss of structure, changes in perme-
ability); and (d) Chemical degradation (acidification, declining fertility, changes in
pH, salinisation and chemical toxicity). Soil degradation encompasses several
issues at various spatial time scale. The major types and underlying causes of soil
272 11 Status of Soil Pollution in India

degradation is presented Table 1.2 in Chap. 1. This indicates that soil degradation
estimates in India is almost entirely focused on loss of soil and its productivity due
to either natural processes or accelerated natural processes of erosion and ionic
movements through faulty soil and water management. There is no denying fact
that arresting soil loss and its productivity through above degrading forces are
extremely important for ensuring food security in the country. Quality of human
health is often linked with soil quality (Parr et al. 2009). Therefore, soils around
cities and industrial areas having high population density play an important role on
human health, as considerable fraction of the food requirement are met from the
agricultural activities surrounding the area. An estimate of area under soil degra-
dation (erosion, inundation, salinity build up, acidity) has been made mostly using
satellite images and remote sensing data as well as through extensive network of
organizations & Institutes like Soil and Land Use Survey of India and ICAR-
National Bureau of Soil Survey and Land Use Planning. However such quantitative
assessment of area under pollution by industrial, urban and mining activities is only
possible through information on geographical locations of such activities as well as
through direct estimation of pollutants accumulation in soil and their transfer to
food and organisms around the intense activity zones. Information generated on the
pollutants accumulation in environmental samples related to agriculture and foods
are described in the following sections.
11.3 Soil Pollution Due to Anthropogenic Activities
Although surge in India’s economic growth aided by higher levels of industriali-
zation has remained a subject of pride, there is also a huge concern for the
environmental degradation that slowly but loudly being voiced out. CPCB identi-
fied critically polluted industrial areas and clusters or potential impact zone based
on its Comprehensive Environmental Pollution Index (CEPI) rating. Forty three
critically polluted zones were reported in the 16 states which have CEPI rating more
than 70 (Table 11.1). Among the 43 sites, 21 sites exist in only four states namely
Gujarat, Uttar Pradesh, Maharashtra and Tamil Nadu.
Information on soil pollution has been generated by research organizations in
several of these critically polluted areas and such information is unevenly distrib-
uted. In some areas having very high CEPI rating like Haldia, Bhiwadi, Chandra-
pur, Singrauli, Bhiwadi, published information on the soil pollution in nearby
agricultural areas is practically absent (Table 11.1). Information on type of pollut-
ants and location of sites covered were highly skewed towards nearness (to the
polluted area), facilities available and mandate of the organizations responsible for
the study.
11.3 Soil Pollution Due to Anthropogenic Activities 273

Table 11.1 Critically polluted industrial areas in India
State
Critically polluted industrial
area
CEPI
rating
Information available on soil
pollutiona
Andhra
Pradesh
Vishakhapatnam 70.82 *
Patancheru – Bollaram 70.07 ***
Chhattisgarh Kobra 83.00 ***
Delhi Nazafgarh drain basin 79.54 **
Gujarat Ankleshwar 88.50 *
Vapi 88.09 *
Ahmedabad 75.28 –
Vatva 74.77 *
Bhavnagar 70.99 –
Junagarh 70.82 –
Haryana Faridabad 77.07 –
Panipat 71.91 –
Jharkhand Dhanbad 78.63 **
Karnataka Mangalore 73.68 –
Bhadravati 72.33 –
Kerala Greater Cochin 75.08 –
Madhya
Pradesh
Indore 71.26 –
Maharashtra Chandrapur 83.38 –
Dombivalli 78.41 –
Aurangabad 77.44 –
Navi Mumbai 73.77 –
Tarapur 72.01 –
Orissa Angul Talcer 82.09 ***
Ib Valley 74.00 –
Jharsuguda 73.34 *
Punjab Ludhiana 81.66 **
Mandi Gobind Garh 75.08 –
Rajasthan Bhiwadi 82.91 –
Jodhpur 75.19 –
Pali 73.73 **
Tamil Nadu Vellore (North Arcot) 81.79 ***
Cuddalore 77.45 *
Manali 76.32 *
Coimbatore 72.38 ***
Uttar Pradesh Ghaziabad 87.37 **
Singrauli 81.73 –
Noida 78.90 –
Kanpur 78.09 ***
Agra 76.48 *
Varansi-Mirzapur 73.79 ***
(continued)
274 11 Status of Soil Pollution in India

11.3.1 Entry of Sodium into Ecosystem and Increase in SoilSalinity and Sodicity
Industries, particularly those associated with chlor-alkali, textiles, glass, rubber
production, animal hide processing and leather tanning, metal processing, pharma-
ceuticals, oil and gas drilling, pigment manufacture, ceramic manufacture, soap &
detergent production are the major consumers of salts (mainly NaCl) produced in
the world today. When released into the environment, salt ions present in the
industrial effluents percolate through the soil profile and contaminate the ground-
water due to their high mobility in the matrix. Most of the effluent treatment plants
don’t remove salts from the effluent water. As a result of this, salinity of ground-
water has been found elevated in and around many industrial clusters of India;
deteriorating drinking and irrigation water quality (Table 11.2). As crop production
in most of the countries rely considerably on groundwater and surface water,
salinity build-up in soil is inevitable around areas of high industrial activity through
‘industry ! effluent ! soil !groundwater ! soil’ route (Fig. 11.1).Soils of agricultural land surrounding industrial areas of several cities recorded
high electrical conductivity (EC) and exchangeable Na indicating considerable
accumulation of salts due to irrigation with contaminated surface and groundwater
(Saha 2005, Panwar et al. 2010).
11.3.2 Entry of Heavy Metals in Soil
Soil health assessment surveys in India have been carried out discretely by several
researchers. These indicate clearly that contamination of soils with heavy metal in
the impact zone is quite prevalent nearby industrial areas. However, such surveys
are highly inadequate keeping in view of the extent of polluting activities going on
in the country and many of the studies had in the past been carried out using less
sensitive instrumental techniques. Inadequate numbers of competent laboratories
with limited organizational strengths have generated some indicative information
only on extent of soil contamination with heavy metals. A study conducted by
ICAR-Indian Institute of Soil Science, Bhopal has indicated built-up of heavy
Table 11.1 (continued)
State
Critically polluted industrial
area
CEPI
rating
Information available on soil
pollutiona
West Bengal Haldia 75.43 –
Howrah 74.84 *
Asansol 70.20 –
CPCB (2009)a‘–’: no information; ‘*’: very few information; ‘**’: few information; ‘***’: moderate information
11.3 Soil Pollution Due to Anthropogenic Activities 275

Table
11.2
Impactofindustries
onelectrical
conductivity(dSm
�1)ofgroundwater
Location
Nature
ofindustries
Pollutedarea
Unpollutedarea
Range
Mean
Reference
Range
Mean
Reference
Gajraula
(district:Jyotiba
Phule
Nagar,UP)
Distillery
0.71–0.88
0.79
Jain
etal.(2005)
0.46–0.48
0.47
Jain
etal.(2005)
Kancheepuram
(district:
Kancheepuram,TN)
Textile
dyeing
1.76–4.21
3.34
Balakrishnan
etal.
(2008)
0.23–3.42
1.28
CGWBa
Mettupalayam
(district:Coim
-
batore,TN)
Textiles,paper
andpulp
0.14–10.38
3.91
Mukherjeeand
Nelliyat
(2007)
0.76–4.15
1.87
Mukherjeeand
Nelliyat
(2007)
Dindigul(district:Dindigul,
TN)
Tanneryindustry
0.52–21.2
3.72
Mondal
etal.(2005)
0.125–6.52
1.9
CGWBa
Chennai
(district:Chennai,
TN)
Tannery,textile
0.48–3.76
2.02
Somasundaram
etal.
(1993)
1.17–1.93
1.75
CGWBa
Tiruppur(district:Tirupur,
TN)
Textile,dye
0.41–15.95
4.02
Sellamuthuet
al.
(2011)
0.66–4.08
1.93
CGWBa
5.9–8.4
6.78
Panwar
etal.(2010)
2.4–2.9
2.62
Panwar
etal.(2010)
Patancheru(district:Medak,
AP)
Miscellaneous
0.70–10.2
2.6
Panwar
etal.(2010)
0.18–4.85
1.78
CGWBa
Ratlam
(district:Ratlam,MP)
Chem
icals,dye,pharmaceu-
ticals,distillery
1.49–4.50
2.84
SahaandSharma
(2006)
0.28–3.08
1.03
CGWBa
Udaipur(district:Udaipur,
Rajasthan)
Znsm
elter
3.14–6.79
5.43
Panwar
etal.(2010)
0.36–6.44
1.33
CGWBa
Pali(district:Pali,Rajasthan)
Textile
5.91–9.54
7.36
Panwar
etal.(2010)
0.35–7.95
2.73
CGWBa
aRangeandmeanvalues
havebeencompiled
forthedistrictin
whichthestudyareasbelong(Source:
CWGB
2013),assumingmost
oftheinform
ation
belonged
tounpollutedarea.
Adoptedfrom
Sahaet
al.(2013b)
276 11 Status of Soil Pollution in India

metals in soils due to industrial activities and nature of contamination varied with
type of industries operating (Table 11.3). The study had also indicated contamina-
tion of groundwater with heavy metals at different locations of India due to
industrial activities (Table 11.4).
11.4 Instances of Pollution from Industrial Effluents
Significant part of the pollutant loaded effluents, generated particularly from small
scale industries are released untreated into land and water bodies. In most of cases,
metals are present in dilute and small quantities in polluted water bodies and may
not cause any harm to plant growth immediately when used for irrigation. However,
their immobility and consequent persistence imply that concentrations may become
elevated in the long run to such an extent that they begin exhibiting toxic effect on
plant, soil microorganisms and food chain. Long-term exposure to heavy metals has
been reported to affect human and animal health adversely (ATSDR 2005). Among
the heavy metals, Ni, Co, Cr and Cu are relatively more toxic to plants and As, Cd,
Pb and Hg are relatively more toxic to higher animals (McBride 1994). Build up of
different pollutants in Indian soils and their impact on soil quality, agricultural
productivity and food quality as well as impact on organisms were investigated by
researchers which are described below.
Fig. 11.1 Salinity build-up due to irrigation with polluted river water at Nagda
11.4 Instances of Pollution from Industrial Effluents 277

11.4.1 Ratlam Industrial Area, Madhya Pradesh
In Ratlam, about 2000 m3 effluent per day generated from industrial area was used
to pour through Dosinala which runs through the city southwards, finally draining
into river Mahi. Majority of the industries were shut down by 1996 due to Supreme
Court order on the Public Interest Litigation (PIL) filed on pollution related issue.
Table 11.3 Heavy metals accumulated in soils around different industrial areas
Location Nature of industries
Heavy metals
accumulated
Pithampur (Dhar),
Madhya Pradesh
Automobile manufacturing, food processing, chemical
processing, distilleries, textile industries and other
manufacturing industries
Cr, Zn, Co
Debari (Udaipur),
Rajasthan
Zinc smelter Zn, Cd, Pb
Korba, Chhattisgarh Thermal power plant, Metallurgical (Al), Textiles,
Engineering workshops, Tyre retreading, and others
Cd, Cr
Coimbatore, Tamil
Nadu
Electroplating, Textile, Dye Ni, Pb, Cd, Cr
Kanpur-Unnao
(UP)
Textile, leather tanning, fertilizer, miscellaneous small
scale chemical factories
Ni, Zn, Cr, Sn
Panwar et al. (2010)
Table 11.4 Impact of industrial activities on soil and groundwater bodies
Industrial area
Soil quality
parameters
affected
Surface water quality
parameters affected
Groundwater
quality parameters
affected
Ratlam industrial Area,
Madhya Pradesh
EC, ESP – TDS, SAR, Colora-
tion, Pb, Cd
Nagda industrial area,
Madhya Pradesh
EC, ESP TDS, high Na, Cl,
SO4�2
Pithampur (Dhar) industrial
area, Madhya Pradesh
EC, SAR, Co,
Cr
EC, SAR, Cr
Patancheru industrial area,
Medak district, Andhra
Pradesh
– EC, As High pH, EC, Ni, As
Zinc smelting area in Udai-
pur, Rajasthan
Zn, Cd Zn, Cd, F Zn, Cd
Textile industries in Pali,
Rajasthan
EC EC, Na, Cu, Pb, Cr,
As
Korba industrial area
(Chhattisgarh)
Acidic pH, EC,
Cr, Cu
Cd, Co, Cr, Ni, Zn
Tiruppur Industrial Area EC, ESP EC Pb, Cr
Coimbatore industrial area,
Coimbatore
Ni, Pb, Cd, Cr EC, Na, Cl, SO4�2
Adopted from Panwar et al. (2010) and Saha and Sharma (2006)
278 11 Status of Soil Pollution in India

As a result of industrial activities, groundwater of nearby villages has turned red
and the impact is still visible even after 20 years (Fig. 11.2).
The groundwater at about 60–80 m depth in several villages had been polluted
with salts due to contamination with percolating industrial effluent and was being
used for irrigation to winter crops (Saha 2005). While mean EC values of ground
water of unaffected villages were in the range of 0.85–0.92 dS m�1, the same in
affected villages ranged from 1.49 to 4.50 dS m�1 with an overall mean of 2.84 dS
m�1. Contents of sodium, sulphate and chloride in groundwater of affected villages
were, respectively, in the range of 14.5–30.9 mM (mean 22.61 mM ), 0.92–3.55 mM(mean 2.02 mM ) and 6.16–35.88 mM (mean 2.83 mM ). These values were,
respectively, 348%, 288% and 364% more than the similar values obtained in
groundwater samples of surrounding unaffected villages. The values of sodium
absorption ratio (SAR), a measure of Na hazard, were considerably higher (range
3.36–12.29; mean 8.52) in ground water of affected villages as compared to the
values (range 2.57–6.19; mean 3.88) obtained for unaffected villages. About 40%
of the water samples in the polluted area were categorized as having very high
salinity (>2.25 dS m�1) and sodium hazard (SAR > 9) and about 71% of the
samples had potential for severe Cl� hazard (>10 meq Cl� L�1) permitting their
use as irrigation only to tolerant crops. Use of such bad quality irrigation water
caused considerable decline in area under vegetable cultivation in the groundwater
pollution area. Groundwater samples of polluted area contained, on an average,
9.1 μg Pb L�1, 4.1 μg Cd L�1 and 18.5 μg Cu L�1; which were more by about
162, 26 and 83%, respectively over those in groundwater samples of unpolluted
area. Considering World Health Organization (WHO) limits for groundwater,
samples from Bhajankheda, Jadwasa khurd and Dosigaon villages of polluted
area contained unsafe levels of Pb and Cd.
There were significant increases in salinity as well as exchangeable sodium
percentage (ESP) levels in soils due to irrigation with polluted water in the affected
villages. Soil samples collected from groundwater polluted villages in the month of
Fig. 11.2 Pollution of groundwater at Ratlam and river water at Nagda due to industrial activity
11.4 Instances of Pollution from Industrial Effluents 279

February had, on an average, higher EC (4.5 times), SAR (4.6 times), organic C (1.5
times) and available K (22% more) as compared to the soils from unpolluted area
(Table 11.5). Significant increases in concentrations of Na+, Cl�, SO4�2 and HCO3
�
and decreases in the concentrations of K+ and NO3� in the soil solution were
observed in the polluted soils of Ratlam, which indicates that salt loaded polluted
groundwater/river water had direct impact on the crop yields as well as soil param-
eters in the polluted area. Monsoon rainfall decreased EC as well as concentrations
of Na+, Cl� and SO4�2 indicating reduction in soil salinity. However, a significant
increase in the soil pH was observed after rainy season, due to washing out of Cl�
and SO4�2 from surface soil layer and their replacement with CO3
�2 and HCO3� in
the soil matrix.
Groundwater pollution had adversely affected the economic condition through
changes in cropping pattern, reduction in crop yield, as well as reduced longevity of
irrigation infrastructure (Saha and Sharma 2006). Area under vegetable and pulse
cultivation was severely reduced and the same under fallow had increased during
rabi season as many farmers preferred to keep their land fallow instead of using
polluted groundwater as irrigation. The yields of the traditional crops such as
soybean, gram wheat, methi and garlic were less on the fields irrigated with polluted
ground water (Table 11.6). Onion grown using polluted groundwater had a short
keeping quality and started rotting within 10–15 days after harvest; thus inflicting
heavy economic losses to the farmers. Poppy (Papaver somniferum) cultivation,previously grown widely in the area, was abandoned because of drastic reduction in
yield and consequently the government denotified the area for its cultivation. The
iron pipes of the tubewell got rusted within 5 years; and therefore, the farmers
incurred losses on account of repair and maintenance of their irrigation infrastruc-
ture. The drinking water source of the eight villages became unfit for human use.
People were either forced to consume polluted drinking water or to spend much
effort and time in fetching potable water from a distance up to 3–4 kms.
Table 11.5 Mean chemical properties of soils of polluted and unpolluted area in Ratlam
Parameter
Polluted area Unpolluted area
Mean Range
Standard
deviation Mean Range
Standard
deviation
pH (1:2 in
water)
7.70 7.11–8.27 0.28 7.83 7.28–8.01 0.14
EC (dS m�1) 1.83 0.49–5.01 1.00 0.41 0.25–0.76 0.21
SAR 3.98 0.69–27.12 4.72 0.86 0.69–2.65 0.86
OC (%) 0.70 0.44 0–0.98 0.15 0.45 0.15–0.89 0.19
Available P
(mg kg�1)
18.70 16.0–22.4 1.65 26.64 11.5–43.7 7.95
Available K
(mg kg�1)
230.38 171.5–332.5 49.30 188.58 128.0–293.5 43.76
Saha (2005)
280 11 Status of Soil Pollution in India

Approximately 300 man-days were used each day for bringing potable water from
distant sources.
11.4.2 Nagda Industrial Area, Madhya Pradesh
In Nagda, a textile industry complex located on the North-West of town manufac-
tures a variety of products including viscous rayon, caustic soda, liquid chlorine,
carbon disulfide, etc. A few other ancillary industrial units have also been
established to make various chlorinated products utilizing the chlorine produced
by the textile industry complex. All these industrial activities result in a high
volume of wastewater generation, which is carried away by a natural surface
drain, leading to river Chambal.
Water of Chambal river became severely polluted with effluents from textile
industry containing salts namely, Na+, Cl� and SO4�2 and was being used for irrigation
to winter crops in nearby areas of several villages (Saha 2005). Irrigation water
(from Chambal river) near affected villages had EC ranging from 2.38 to 4.11 (mean
3.56 dS m�1) and contained 31.6–57.5 mM Na, 0.44 to 1.66 mM K, 3.54–
4.32 mM Ca, 1.07–2.72 mM Mg, 2.93–6.76 mM SO4�2 and 25.6–25.8 mM Cl�,
which were on an average, 4.7, 9.9, 7.7, 5.8, 1.8, 9.0, and 6.9 times more than
the correspondingmean values obtained in irrigation water (groundwater) in unaffected
villages. The mean SAR value in Chambal river water was 5.1 times higher than the
similar value obtained in groundwater of unaffected villages. Long-term applica-
tion of these polluted water to soil resulted significant accumulation of salts in the
root zone layer (Table 11.7). There were significant increases in salinity as well as
ESP levels in soils due to irrigation with polluted water. Magnitude of salinity
development in soil was much more in the soils irrigated with polluted river water
at Nagda as compared to polluted groundwater irrigated lands in Ratlam. Polluted
soils of Nagda recorded much higher concentrations of major cations and anions
(except NO3�) in soil solution. Monsoon rainfall decreased EC, SAR, ESP as well
Table 11.6 Estimation of losses due to reduction of crops yields
Crop
Average yield (q ha�1)
Yield reduction
(q ha�1)
Price (Rs q�1)
Loss (ha�1)
Normal
conditions
Polluted
conditions
Wheat 36 29 7 650 4550
Gram 12.5 9a 3.5 1400 4900
Soybean 15 11.5 3.5 1200 4200
Methi 18 12 6 1500 9000
Garlic 60 45 15 2000 30,000
Saha and Sharma (2006)aWhen irrigation is given at later stages
11.4 Instances of Pollution from Industrial Effluents 281

as concentrations of Na+, Cl� and SO4�2 in solution of soils irrigated with polluted
water. However, the impact on the soil properties lessened considerably during
rainy season, probably due to the presence of appreciable amount of divalent
cations, Ca+2 and Mg+2 in polluted irrigation water. Available Cu contents in
soils of polluted area were higher as compared to the soils of unpolluted area.
Concentrations of Zn and Cu were also considerably more in the in the wheat plant
tissue of polluted area as compared to those of unpolluted area.
11.4.3 Pithampur (Dhar) Industrial Area, Madhya Pradesh
Pithampur is the second largest industrial area in Asia having both large and small
scale industries. Majority of the automobile companies of India have their factories
in Pithampur. Also, this area is housing food processing, chemical processing,
distilleries, manufacturing, and textile industries.
Water of open wells and tube wells in Cheerkhani and Silotia villages near
the industrial area tested high salinity (EC 1.91–4.07 dS m�1) and sodium
hazard (SAR > 10) and about 82% of the samples had potential for severe Cl�
(>10 me L�1) hazard permitting their use as irrigation only in tolerant crops. The
EC of some of the tube well water samples from polluted villages had gone up by
more than 2.5 mS cm�1 indicating that effluents contaminated the ground water.
The ground water samples of polluted area contained, on an average, 84.2 μg Cr L�1, 3.7 μg Pb L�1 and 1.2 μg Cd L�1. Several groundwater samples of polluted area
had Cr concentrations more than the WHO permitted level for drinking water.
Surface soil samples of Cheerkhani and Silotia villages had, on an average, higher
EC (3.4 times) and SAR (3.1 times) due to considerable accumulation of Na+ and Cl�.The soils receiving polluted ground water was higher in Co (7.5 times) and Cr
(1.5 times) contents as compared to soils of unpolluted area (Table 11.8).
Table 11.7 Mean chemical properties of soils of polluted and unpolluted area in Nagda
Parameters
Polluted area Unpolluted area
Mean Maximum
Standard
deviation Mean Maximum
Standard
deviation
pH (1:2 in
water)
7.69 7.10–8.50 0.30 7.96 7.83–8.32 0.20
EC (dS m�1) 4.03 0.35–12.90 3.10 0.44 0.25–1.32 0.52
SAR 19.31 0.45–75.97 20.70 1.57 0.53–2.43 0.69
OC (%) 0.67 0.29–0.99 0.20 0.53 0.33–0.75 0.11
Available P
(mg kg�1)
18.48 14.9–23.0 2.16 11.35 5.9–22.3 4.24
Available K
(mg kg�1)
270.00 145.5–454.0 88.03 177.10 110.0–300.5 45.95
Saha (2005)
282 11 Status of Soil Pollution in India

11.4.4 Patancheru Industrial Area, Medak District, AndhraPradesh
Pattancheru-Bollaram cluster is an agglomeration of different industrial areas.
Production in these areas is dominated by bulk drug manufacturing. It is located
at the north-western outskirts of Hyderabad. Starting with the first pharmaceutical
production facilities in the mid 1970s, it is now one of the biggest pharmaceutical
industrial areas of India, with more than 90 manufacturers (Beijer et al. 2013). Since
1989, wastewater generated from these facilities is being treated in a common
effluent treatment plant (CETP). Until 2009, most of the CETP pretreated effluents
were being drained into rivers and lakes in the Patancheru area (Larsson 2007).
Patancheru-Bollaram cluster was banned for further projects in 2013 by Ministry of
Forests and Environment (MoEF) due to investigations conducted by the Central
Pollution Control Board (CPCB).
Arsenic levels were found to be high in effluent water from the industrial area. In
effluent water, Ni concentration varied from 4.7 to 57.4 μg L�1 (average of 23.4 μgL�1), Pb varied from 0.3 to 14.2 μg L�1 (average of 2.0 μg L�1) and Zn varied from
32.9 to 293.9 μg L�1 (average of 81 μg L�1) (Panwar et al. 2010). Some samples
showed high values of Fe, Ni, Pb and Zn, which are near the vicinity of industrial
areas. The groundwater in some places near the study area has also been found
contaminated with salts (high pH and EC) and some metals like As, Ni, Cr and Zn
(Table 11.9).
11.4.5 Zinc Smelting Area in Udaipur, Rajasthan
The zinc smelter plant near Udaipur has smelting capacity of about 49,000 tonne
per annum (TPA). With the expansion of the smelter plant, a number of other
production units was commissioned which includes production units for sulphuric
acid (87,000 TPA), cadmium metal (190 TPA), phosphoric acid (26,000 TPA),
single superphosphate (72,000 TPA) and zinc dust (36,000 TPA). Since its
Table 11.8 Impact of industrial activity in Pithampur on total heavy metal contents in soil
Heavy metal (mg kg�1)
Unpolluted area Polluted area
Range Mean Median Range Mean Median
Cd 0.05–0.1 0.1 0.1 0.05–0.1 0.1 0.1
Co 5.2–6.7 5.9 5.9 26.8–63.9 49.9 51.5
Cr 18.4–47.1 34.6 35.5 68.1–252.0 87.3 96.9
Cu 382.4–445.3 417.5 424.9 82.4–252.4 179.4 170.3
Ni 32.1–38.1 35.3 34.5 21.4–39.2 37.8 37.1
Pb 5.2–6.1 5.7 5.7 1.1–21.0 7.6 6.2
Zn 27.2–29.4 28.5 28.9 76.6–763.0 145.2 96.3
Panwar et al. (2010)
11.4 Instances of Pollution from Industrial Effluents 283

inception the effluent from the plant was being discharged into a stream which
flowed through 3 kms to the east and merged into Berach river. The effluent of zinc
smelter was being discharged in a stream, employed for irrigating the crops in the
vicinity of the smelter plant (Fig. 11.3).
The concentrations of zinc and fluoride in the groundwater were higher than
permissible limit of 5 and 2 mg L�1, respectively (BIS 2012). Well water samples
had high concentrations of Zn (2.2–9.7 mg L�1) and Cd (0.004–0.081 mg L�1)
which indicates contamination of groundwater due to industrial activity. The
concentrations of these (Zn and Cd) heavy metals were high in effluent irrigated
soils nearer to the discharge point (Gorla and Bichhari village) and decreased with
the distance from the effluent discharge point. A large variation in the content of
total zinc (65–1860 mg kg�1), total cadmium (0.07–10.4 mg kg�1) and total lead
Table 11.9 Descriptive data
on groundwater analysis
(μg L�1) from Pattancheru
industrial area, Medak
district
Parameter Mean Median Minimum Maximum
pH 8.1 8.0 6.9 9.4
EC (dS m�1) 2.6 1.7 0.7 10.2
Cr (μg L�1) 13.3 6.9 2.0 69.7
Mn (μg L�1) 75.8 75.6 2.4 11,384
Fe (μg L�1) 106.7 87.3 34.6 497.2
Ni (μg L�1) 69.0 43.0 3.9 264.8
Zn (μg L�1) 89.4 57.8 21.4 310.8
As (μg L�1) 129.4 119.3 4.2 1139.0
Pb (μg L�1) 2.10 0.95 0.30 7.20
Sr (μg L�1) 1079 875 134 2681
Panwar et al. (2010)
Fig. 11.3 Accumulation of pollutants on soil surface receiving Zn-smelter industrial effluent from
Udaipur industrial area
284 11 Status of Soil Pollution in India

(27.5–180 mg kg�1) was recorded in the soils of the area (Table 11.10). While
comparing with the safe concentration limits determined for soils (Saha et al.
2010b; Saha et al. 2013a), most of the soils nearby Zn smelting area accumulated
toxic levels of Zn and Cd. With few exceptions, total Zn, Cd and available Zn
content of the soil decreases with an increase in the lateral distance from the stream
and river.
11.4.6 Soil and Water Pollution by Textile Industries in Pali,Rajasthan
Industrial area at Pali is having more than 800 textile units and is indicated as one of
the critically polluted area by Central Pollution Control Board (CPCB). The textile
printing and dyeing industries were discharging industrial effluents into the river
Bandi, a non-perennial river with no flow in the lean season, thus severely contam-
inating both the river as well as the groundwater. The industries discharged a
variety of chemicals, dyes, acids and alkalis besides heavy metals and other toxic
compounds. The effluents were multi-colored and highly acidic and/or alkaline.
Groundwater from downstream villages was highly saline with salts of Na as
compared to upstream villages. Copper concentration was more than drinking
water standards in all the wells in downstream villages; while Pb was high in
Kerla, Sukarlai and Nehada; Cr level is high in Kerla, Sukarlai, Gadhwara and
Phikaria; As is high in Jewadiya, Kerla and Phikaria (Table 11.11).
The well water was not suitable for irrigation due to high salinity (>4 dS m�1).
The Nahada dam built for storing water, has become a industrial storage tank and
thus led to groundwater contamination. The soils under cultivation using contam-
inated well waters also showed high salinity due to high salt content of irrigation
water (Fig. 11.4).
Table 11.10 Chemical
parameters and total heavy
metals content (mg kg�1) in
soil of agricultural land
irrigated with effluent water
from smelter industries in
Udaipur
Parameter Range Mean Median
pH 7.2–10.4 8.2 8.3
EC (dS m�1) 0.2–6.5 1.0 0.6
Zn 65–1860 619 590
Pb 27.5–180.0 51.4 38.0
Cu 21.2–70.0 36.0 34.9
Cd 0.07–10.37 1.56 0.86
Co 7.6–18.5 11.9 11.8
Ni 19.8–50.2 34.9 34.3
Panwar et al. (2010)
11.4 Instances of Pollution from Industrial Effluents 285

11.4.7 Korba (Chhattisgarh) Industrial Area
Korba city is the power capital of central India with the National Thermal Power
Corporation Limited’s (NTPC) super thermal power plant working at 90% plant
load factor. Korba is also having aluminium industry Bharat Aluminum Company
Limited (BALCO), textiles, engineering workshops, hardware (aluminum & iron),
detergents, plastic toys, PVC cable pipes, cement products, electricity transformer,
bakelite, distemper, clay insulator manufacturing units and other small industries,
generating large quantity of acidic effluents which contaminated surrounding land
areas (Fig. 11.5).
Groundwater samples collected from villages nearby industrial area contained
high levels of heavy metals Cd, Co, Cr, Ni, and Zn; mean values of which were
considerably higher (Cd: 19 times, Co: 67 times, Cr: 6 times, Ni: 5 times, and Zn:
10 times) as compared to those collected from far away villages. Majority of the
groundwater samples from polluted area had heavy metals more than the levels
Table 11.11 Average heavy metal (μg mL�1) contents in groundwater in selected villages
towards upstream and downstream side of effluent discharge point in Bandi river of Pali
Village Cu Zn Pb Ni Cr As
Downstream Jewadiya 0.17 0.07 0.03 0.25 0.04 0.28
Kerla 0.52 0.12 0.56 1.42 0.11 0.49
Sukarlai 0.05 12.16 0.08 0.78 0.27 0.03
Nehada 0.07 0.06 0.08 0.16 0.05 0.02
Phikaria 0.13 0.03 0.02 0.22 0.05 0.13
Gadhwara 0.16 0.09 0.04 0.26 0.06 0.07
Upstream Iycea 0.03 0.04 0.03 0.08 0.03 0.01
Hemavas 0.02 0.03 0.01 0.11 0.01 NDa
aND not detected
Panwar et al. (2010)
Fig. 11.4 Soils of land receiving unpolluted groundwater and polluted industrial effluent
286 11 Status of Soil Pollution in India

permitted for drinking purpose. Soil irrigated with industrial effluent turned highly
acidic (Table 11.12). Contents of soluble salts, soil organic carbon, DTPA extract-
able heavy metals and total heavy metals contents increased due to use of industrial
waste/effluent or contaminated water as compared to the non-polluted soils. The
total as well as DTPA extractable heavy metals particularly, Cr and Cd were in
toxic range in most of the polluted soils (Table 11.12).
11.4.8 Tiruppur Industrial Area, Tamil Nadu
Tiruppur has been identified as one of the critically polluted area by CPCB.
Industrial area discharges more than 90 MLD into Noyyal river (tributary of
Cauvery river). Industrial effluent passes through Tiruppur and is stored up in the
Orathapalayam Dam to be used in agriculture and drinking purposes for the
downstream villages in the Tiruppur and Erode district. The Industrial area is
having 729 bleaching and dyeing units. Due to pollution, drinking water, fisheries
and the agriculture in Tiruppur area and downstream villages of Noyyal river has
been affected.
The river water was injurious (EC >3 dS m�1) to agriculture in an area of
about 146.3 km�2 and critical (EC 1.1 to 3 dS m�1) in about 218.3 km�2. The
groundwater in some villages was having high values of Pb and Cr which may be
attributed to the industrial activities (Panwar et al. 2010). Majority of the samples
were not suitable for domestic purposes and were far from drinking water standards.
Irrigation of cropping land with polluted water transformed the productive soils into
saline soil (>4 dS m�1); the dominant cations and anions being Na+ and Cl� and
SO4�2, respectively. Irrigation with polluted Noyyal river water resulted build-up
of salinity (EC > 4 dS m�1) in soils of agricultural land (Table 11.13).
Fig. 11.5 Same agricultural land near Korba industrial area before (year 2008) and after (year
2010) contamination with industrial effluent
11.4 Instances of Pollution from Industrial Effluents 287

11.4.9 Coimbatore Industrial Area, Tamil Nadu
Coimbatore industrial area is the 2nd largest industrial area in Tamil Nadu. The
industrial area is having about 500 textile industry, 200 electroplating industry,
100 foundries and 300 dyeing industries. All the industrial effluent/sewage finds its
way to Ukkadam river, which is source of irrigation in nearby area. Heavy metal
contents in the city sewage water were quite high and varied widely with season.
ICAR-Indian Institute of Soil Science, Bhopal investigated changes in soil proper-
ties in agricultural land nearby different industrial clusters; namely electroplating
industry, textile industry, dye industry and city sewage irrigated areas (Panwar et al.
2010). Groundwater near industrial area has developed salinity due to contamina-
tion mainly with salts of Na+ and Cl�; magnitude of contamination was more near
Table 11.12 Soil physico-
chemical properties and
heavy metal status of soils
irrigated with industrial
effluent in Korba
Parameter Mean STDEV
pH 4.61 �0.093
EC (dS m�1) 2.21 �0.196
OC (%) 0.46 �0.062
DTPA extractable heavy metals (mg kg�1)
Cd 0.056 �0.009
Co 1.726 �0.029
Cr 0.096 �0.006
Cu 2.356 �0.038
Ni 1.828 �0.028
Pb 5.944 �0.042
Zn 1.350 �0.062
Total heavy metals (mg kg�1)
Cd 8.10 �0.031
Co 25.1 �0.42
Cr 172.3 �6.41
Cu 40.5 �3.86
Ni 14.1 �0.86
Pb 15.3 �2.16
Zn 29.4 �2.31
Panwar et al. (2010)
Table 11.13 Soil properties in selected villages around Noyyal river in Tiruppur district
Parameters
Downstream villages Upstream villages
pH EC (dS m�1) OC (%) pH EC (dS m�1) OC (%)
Minimum 7.24 4.29 0.19 7.27 1.86 0.21
Maximum 8.37 8.31 0.57 8.34 3.62 0.69
Mean 8.07 6.59 0.39 7.52 2.39 0.34
Median 7.92 6.47 0.36 7.63 2.53 0.47
Panwar et al. (2010)
288 11 Status of Soil Pollution in India

textile and dye industries. Sulphate contamination was the highest in the ground-
water near electroplating industries.
Soils of agricultural land near textile and dye industries have developed severe
salinity (EC > 6 dS m�1) and slight alkalinity (pH >8.0). Soils of agricultural land
near industrial areas contained 47–178 mg Ni kg�1, 47–214 mg Pb kg�1,
0.5–4.2 mg Cd kg�1 and 43–241 mg Cr kg�1 (Table 11.14).
Most of the soils had all the heavy metals more than the safe concentration limits
determined by Saha et al. (2013a), which indicate that these soils may pose threat to
the environment. Nickel and Pb concentrations were high in soils near the
electroplating and sewage from industrial area; Cd concentration was higher in
soils irrigated with mixed effluents, and sewage; Cr concentration was higher in
soils irrigated with textile, dye and sewage effluent. DTPA extractable heavy metal
contents were also very high as compared to those normally observed in unpolluted
soils, which indicates soils of agricultural land near industrial area of Coimbatore
are likely to impart considerable threat to living organisms (Table 11.15).
11.4.10 Katedan Industrial Development Area in Southof Hyderabad, Andhra Pradesh
Katedan industrial area of Hyderabad is hosting more than 300 industries which are
involved in dyeing, edible oil production, battery manufacturing, metal plating,
chemicals production etc. Dumping of the waste materials around this area is
commonly observed and is a major cause of soil pollution which occurs due to
spreading hazardous material through rainwater and wind. Govil et al. (2008)
reported the prevalence of very high concentrations of Pb, Cr, Ni, Zn, As and Cd
throughout the industrial area. Hazardous metals like As and Cr, Cu, Pb and Zn had
also been observed in some of the residential area nearby industrial complex.
The wastes and effluents generated from different industrial activities in and
around this area are discharged into the ponds without adequate treatment. It
resulted in contamination of groundwater in and around Katedan area with salts
and several heavy metals (Cd, Cr, Ni and Cu). All these heavy metals exceeded the
permissible limits in the groundwater, except Pb. Continuous use of the contami-
nated groundwater for agricultural production increased the contents of Pb, Ni and
Cr in the soil (Bhupal Raj et al. 2009).
11.4.11 Industrial Area at Thane Region of Maharashtra
There are about 5449 industries in Thane region, which includes textile industries,
dye manufacturing industries, match box factories, canning factories of various
food stuff, pharmaceutical and chemical industries, paper mill, paint industry,
11.4 Instances of Pollution from Industrial Effluents 289

Table
11.14
Totalheavymetal
contents(m
gkg�1)in
soilsofagriculturallandnearbydifferentindustrial
clustersat
Coim
batore
Sourceofcontamination
Ni
Pb
Cd
Cr
Range
Median
Range
Median
Range
Median
Range
Median
Sew
age
78–140
107
116–214
158
1.2–4.2
2.17
75–176
124
Electroplating
84–178
122
74–167
136
1.1–2.7
1.63
48–152
109
Textile
47–126
72
52–159
114
0.6–3.1
1.28
86–241
168
Dye
62–111
89
58–147
82
0.5–2.4
1.34
79–187
127
Mixed
effluents
58–132
96
47–171
92
1.3–3.8
2.39
43–158
96
290 11 Status of Soil Pollution in India

Table
11.15
DTPA-extractable
heavymetal
contents(m
gkg�1)in
soilsofagriculturallandnearbydifferentindustrial
clustersat
Coim
batore
Sourceofcontamination
Ni
Pb
Cd
Cr
Range
Median
Range
Median
Range
Median
Range
Median
Sew
age
0.9–9.7
5.34
1.6–9.6
5.26
0.5–1.7
0.79
0.2–4.6
2.69
Electroplating
1.0–8.8
4.71
0.8–3.4
2.81
0.1–0.8
0.34
1.2–4.7
3.92
Textile
0.3–1.2
0.79
1.3–2.6
2.31
0.1–0.4
0.18
2.4–6.8
4.61
Dyeing
0.5–3.6
2.26
1.4–2.3
1.79
0.05–0.3
0.09
1.9–4.2
2.87
Mixed
effluents
1.5–4.9
2.14
1.8–4.3
2.74
0.1–0.5
0.19
0.6–4.3
1.81
11.4 Instances of Pollution from Industrial Effluents 291

insecticide industries, etc. Waste effluents from the industrial area contaminated
surface water and groundwater bodies. The random dumping of hazardous waste
was the cause of contamination (Bhagure and Mirgane 2011). Ground water in this
region contained very high concentration of total dissolved solids, total hardness,
total alkalinity, chemical oxygen demand, chloride, as well as heavy metals like As
(12–500 μg L�1), Cd (4–21 μg L�1), Hg (1–12 μg L�1), and Ni (5–38 μg L�1), most
of which were more than WHO limits for drinking water (10, 3, 1 and 20 μg L�1
respectively). Similarly, the soils samples collected from residential, commercial
and industrial areas were heavily contaminated by As, Cd, Hg, and Ni (as per the
Swedish soil guideline values for polluted soil), mainly because of local dumping of
hazardous wastes.
11.4.12 Manali Industrial Area in Chennai, Tamil Nadu
The Central Pollution Control Board (CPCB) has identified Manali industrial area as
one of the critically polluted areas in the country. The industrial town is situated to the
north of Chennai near the Buckingham canal. It encompasses all types of processing
industries, including chemical, plastic, petrochemicals, refineries, and fertilizers
industries. The industrial area houses about 300 industries generating hazardous
wastes. Soils in the industrial area of Manali had very high concentrations of Cr
(149.8–418.0 mg kg�1), Cu (22.4–372.0 mg kg�1), Ni (11.8–78.8 mg kg�1), Zn
(63.5–213.6 mg kg�1) and Mo (2.3–15.3 mg kg�1) (Krishna and Govil (2008). The
enrichment factors for Cr in soils ranged between 5.88 and 51.85, which categorized
these under the class of extremely high enrichment. The source of Cr appears to be
anthropogenic from some industries producing steel, textiles in the area. The assess-
ment of the overall contamination of soil was based on the degree of contamination
(Cdeg). On the basis of the contamination factor (Cif), the soils were classified as
slightly contaminated with As and Ba, moderately contaminated with Co, V and Zn,
considerably contaminated with Ni, Mo and Pb and highly contaminated with Cr and
Cu. Chromium contributed most (22.38%) to the degree of contamination index
(Cdeg). Copper accounted for 21.6%, Ni-8.57%, Mo and Pb- 7.31%, Zn- 6.33% and
Co- 5.9% (Krishna and Govil 2008).
11.4.13 Kanpur-Unnao Industrial Area of Ganga Plain,Uttar Pradesh
Kanpur-Unnao region is an industrial hub for leather processing and manufacturing
of leather goods and includes several multinational leather industries. The industrial
hub is situated on the bank of Ganges and is considered to be the hot spot region of
pollution in the Gangetic Plain. The outskirts land of both the cities is mainly
292 11 Status of Soil Pollution in India

utilized for agricultural purposes. These land area are flooded with wastewater
either by over flooding of city drains or by sheet flow during heavy monsoon
rainfall. Additionally, farmers utilize the wastewater of the city drains for irrigation,
as they do not have any other option. The studies conducted by Ansari et al. (1999)
registered the elevated contents of Cd, Co, Cr, Cu, Hg, Ni, Pb, Sn, Zn and organic
carbon in sediments and soils of this region. Very high contents of OC (upto 5.9%),
Cr (upto 2.16%), Sn (upto 1.21%), Zn (upto 975 mg kg�1) and Ni (upto 482 mg kg�1)
were found in top 20 cm soils during the pre-monsoon period in 1994. In relation to
the natural background values, the contribution of anthropogenic inputs of the toxic
metals in soils were about 90% of Cr and Sn; about 75% of Cd; and 25% of OC, Cu,
Ni and Zn. The Enrichment Factors were 10.7 for Cr, 9.0 for Sn, 3.6 for Cd, 1.8 for
Ni and 1.5 for Cu and Zn in soils, respectively. The considerable Cr accumulation in
soils and other environmental samples were also reported by other workers from
this area. Concentration of this metal in soils was found quite high (1323 mg kg�1)
in the area having large number of tanneries (Rawat et al. 2009). Analysis of surface
soil samples from Jajmau and Unnao industrial areas using X-ray fluorescence
spectrometer indicated that these were significantly contaminated with heavy
metals such as Cr (161.8–6227.8, average 2652.3 mg/kg) (Gowd et al. 2010).
The plant available Cr in soil (extracted by 0.01 M CaCl2) was not detected at
control (unpolluted) site while its level at wastewater irrigated soils was quite high
(33.26 to114.26 μg g�1 dw) (Sinha et al. 2006).
11.4.14 Chromium Pollution in Soils Around VelloreTannery Industries, Tamil Nadu
Leather industry is among the major sources of pollution in the state of Tamil Nadu.
It has been estimated that more than 50,000 ha of productive agricultural lands in
Vellore district have been contaminated with Cr alone due to the disposal of tannery
wastes, where more than 60% of Indian tanneries are located (Rangasamy et al.
2015). Effluent generated from the tanneries had highly variable characteristics and
had pH 6.17–8.17 and contained very high soluble salts (EC 10.4–23.0 dS m�1;
sodium 2.04–9.0 g L�1) and Cr (0.62–26.2 mg L�1) (Mahimairajah et al. 2000).
Soils surrounding tannery industries were severely contaminated with Cr
(16731–79,865 mg kg�1). More than 90% of the soil samples from agricultural
land in 65 locations of six Taluks (Walajapet, Arcot, Vellore, Thirupattur,
Vaniyambadi, and Gudiyatham) had high concentration of Cr (>200 mg kg�1
and upto 1646 mg kg�1) due to use of tannery wastes (Rangasamy et al. 2015).
Since Cr2(SO4)3 is predominantly used in tanning process, the tannery effluent and
sludge are rich in Cr III. As a result, contaminated soil contained mostly trivalent Cr
(Mahimairajah et al. 2000). Chromium and salts had also leached through soil
profile and contaminated ground water. The Cr concentration in groundwater
ranged from trace to 36.7 mg L�1. About 28% of the samples had relatively higher
11.4 Instances of Pollution from Industrial Effluents 293

concentration of Cr, exceeding the safer limit of drinking water (0.05 mg L�1) and
irrigation water (2 mg L�1), prescribed by the WHO and FAO, respectively.
11.4.15 Mercury Pollution in the Vicinity of Chlor-AlkaliPlant at Ganjam, Orissa
Chlor-alkali plants are major consumer of mercury for its operation; and consider-
able concentration of this extremely toxic metal is found in liquid effluent and in
solid wastes generated from there. Sediments of effluent carrying channel and low
lying area and solid waste deposits had been found to contain high concentration of
Hg (41–2550 mg kg�1) (Lenka et al. 1992). Aquatic plants growing in effluent
carrying channel and low lying area as well as vegetables grown in soils nearby
solid waste dumping site accumulated high levels of Hg. However such impact
(Hg contamination) due to chlor-alkali plant was highly localized as rice crops in
the surrounding agricultural land did not show any Hg accumulation.
11.4.16 Fluoride Contamination in Soil and Plantin the Vicinity of Aluminium Smelter Plant at Angul,Orissa
The Angul Talcher area in Angul district of Orissa has been declared by CPCB as
one of the hot spot of pollution in Orissa with CEPI rating index of 82.09. The
industrial area houses about 184 industries which includes thermal power plant,
aluminium smelters, steel plants as well as coal mines. The activity of aluminum
industry is one of the major environmental concerns in this area. The most
highlighted pollutant from the smelter plant is fluoride. During smelter process, F
is volatilized from molten cryolite at 1000 �C as gaseous fluoride such as HF, SiF4and flurosilicic acid (H2SiF6). Tiny particles in the form of different compounds
such as various aluminum fluoride, apetite, CaF2 and NaF are mechanically blown
out through the stacks. Such particles ultimately settle down on the natural vege-
tation and water bodies. In the effluent treatment plant, most of the fluoride is
caught as sodium fluoro-silicate, cryolite, AIF3 etc., which are again recycled. But
due to poor effluent treatment facilities and lack of efficient techniques to catch the
whole fluoride, it escapes into the environment and create nuisance. Although
fluoride is beneficial for dental health in low dosage, its chronic exposure in large
amounts causes gastro-intestinal problems and interferes with bone formation. A
study was conducted around smelter plant to determine the fluoride content of
water, soil and plant samples (Jena et al. 2003). The fluoride content of soil, water
and leaf samples varied from 0.52 to 5.52 (water soluble fluoride), 0.2 to 3.24 and
25 to 390 mg kg�1, respectively. Similar samples collected from places around
294 11 Status of Soil Pollution in India

Bhubaneshwar (180 km away from Angul) showed fluoride content in the range of
0.36–0.44 mg L�1 (water soluble fluoride), 0.10–0.19 mg L�1 and 10–30 mg L�1,
respectively. The fluoride content of soil, water and soil samples decreased with
increasing distance except in Santiri and Purukia village, which might have con-
taminated due to the inflow of effluent water from aluminum industry.
11.4.17 Lead Pollution in Some Industrial Citiesof Chhattisgarh
Lead pollution has become global health issue due to its toxicity to human and
widespread use and leakage into the environment. In industrial areas, Pb enters the
environment through particles generated by coal burning in power plants and
roasting of minerals in smelters. The elevated levels of Pb in blood of children
and dogs of Indian mega cities have been reported (Kaul et al. 2002;
Balagangatharathilagar et al. 2006). Lead levels in various environmental compart-
ments (air, rain water, runoff water, surface soil, sludge and plant) of different
industrial cities of Chhatisgarh states (viz., Raipur, Bhilai and Korba) was investi-
gated (Patel et al. 2010a). Different medium and large industries are located in
Raipur (cement, steel and ferro-alloy), Bhilai (steel and others) and Korba (thermal
power plants and others). These industrial areas recorded considerably higher levels
of Pb in air as compared to far away small residential cities. Soils of these cities,
particularly from coal burning area of Korba city contained very high amount of
this metal.
11.4.18 Heavy Metal Contamination in Agricultural Soilsand Plants in Peri Urban Areas of Some Citiesin Gujarat
Ankleshwar, Vatva, Nandesari in Gujarat have high industrial activity and is
considered to have significant impact on environment. Patel et al. (2010b)
conducted study to assess impact of the industrial activities on environment. Soil
and sewage effluent samples from peri-urban areas of Ankleshwar (Bharuch),
Vatva (Ahmedabad) and Nandesari (Vadodara) cities were analyzed for different
quality parameters. The effluents were generally alkaline and contained high salts
with EC ranging from 1.90 dS m�1 in Koyali (Vadodara) to 12.0 dS m�1 in
Kasbativad (Ankleshwar). The concentrations of different micronutrients in the
effluents samples from major industrial areas of Gujarat were generally high while
that of pollutant elements were quite low, except for Cd and Co. Among the
pollutant elements, only Co and Cr were above the threshold level in several
11.4 Instances of Pollution from Industrial Effluents 295

areas and contaminations of other heavy metals viz. Cd, Ni and Pb was low in soil
samples from these areas.
11.4.19 Impact of Industrial Effluent Form VisakhapatnamCity on Soil and Plants
Industrial effluent from Visakhapatnam industrial area (having chemical, petro-
chemical, metallurgical industries) contained high soluble salts and heavy metals
(Cu, Pb, Mi, Cr, Zn) (Bhupal Raj et al. 2009). Soils of agricultural land receiving
effluents from different industries developed salinity. All the soil samples collected
from surrounding areas contained high levels of Pb, Zn, Cu, Cd, Ni and Co. About
100%, 96%, 91%, 70%, 65% and 44% of the plant samples from the polluted area
contained high levels of Cr, Zn, Pb, Ni, Co and Cu, respectively.
11.4.20 Effect of Cement Kiln Dust Pollution of Heavy MetalAccumulation in Soils
Cement industry is one of the 17 most polluting industries listed by the CPCB.
Cement dust contains heavy metals like chromium, nickel, cobalt, lead and mer-
cury, which are having impact on vegetation, human health, animal health and
ecosystem. Effect of dust pollution from cement plant in Dindigul district (Tamil
Nadu) on soil with reference to EC, pH, total Pb, Ni and available Zn, Cu, Fe and
Mn content was seen up to 1 km distance and the effect was more pronounced in
soil samples collected at 0.5 km distance. The soil reaction tended towards alka-
linity while no effect was seen on salt concentration. An increase in total Pb and Ni
content was also seen in the samples collected from 0.5 km (Stalin et al. 2010).
11.5 Soil Pollution in Mining Areas
Most of the country’s mining activities (about 92%) are concentrated in the states of
Gujarat, Andhra Pradesh, Jharkhand, Madhya Pradesh, Rajasthan, Karnataka,
Odisha, Tamil Nadu, Maharashtra, Chhattisgarh and West Bengal. Geological
Survey of India (2007–2008) estimated an affected area of 1394 km2 through
large-scale mapping (Ministry of Mines 2008). A number of studies have been
carried out around mining areas in India to evaluate the extent of soil pollution
(Goswami et al. 2008, 2010a, b; Swain et al. 2011). The changes in soil quality were
found to be drastic and continuously deteriorating in and around mining areas.
296 11 Status of Soil Pollution in India

11.5.1 Coal Mines Impact in Eastern India
India is rich in coal mines and excavation processes have devastating impact on
terrestrial ecosystem including nearby agricultural land area. Coal fires are common
in coal mine areas which may start by natural cause like forest fire or by human
activity. In Jharia (Jharkhand), coal in the mines is burning for more than 100 years.
Hazardous effects from coal fires include the emission of noxious gases and
particulate matter into the atmosphere, and their condensation on the land and
water surfaces leading to water and soil pollution (Stracher and Taylor 2004).
Soil samples analyzed from an opencast coal mine (OCM) and a coal fire affected
area (CFA) in Jharia coalfield revealed that Cr and Ni contents were elevated in
soils nearby both CFA and OCM; V and Zn were enriched in soils nearby CFA.
However, the levels of Cr, Ni, and Zn in these soils are below the USEPA soil
screening limits (Masto et al. 2011). Using statistical tools (principal component
analysis combined with multiple linear regression analysis), Pandey et al. (2016)
identified coal mining activities (including mine fires) as major factor for build-up
of Ni, Cu and Cr in soils of the area; while wind-blown dust was the major
contributor Pb and Cd. Chemicals released from the coal mines; overburden and
tailings contained high concentration of metals such as Cu, Cd, Fe, Hg and Zn;
which also affected the organisms adversely.
A core committee (along with its sub-committees) was constituted by National
Green Tribunal (NGT) to quantify industrial pollution and impact assessment of
water, air, soil and health in and around Singrauli. The committee observed
that groundwater in the villages was contaminated with high fluoride and mercury.
The mercury concentration in groundwater was found exceeding the limit of
0.001 mg L�1 in the samples collected from Kirwani, Parasi, Harrahwa, Naktu,
Sirsoti, Chilkadand, Parsavar-raja, Govindpur, Kusmaha, Khairahi, Jayant Colony,
Jaitpur, MPCC colony, and Dibulganj villages around thermal power plants and
mines in Singrauli and Sonebhadra area (Business Standard 2015).
A study was conducted to investigate changes on soil fertility near open cast coal
mining area Godda district of Jharkhand (Ghose 2004). Soils around the area had
lower soil fertility (in terms of available major plant nutrients) and microbial
population as compared to unmined soils. Similarly other workers also reported
that organic matter content and available nutrients like N, P, K in soils were much
lower while heavy metals content were higher in mining areas as compared to
normal soils (Maharia et al. 2010; Yellishetty et al. 2009; Juwarkar et al. 2003).
11.5.2 Copper Mines Impact
Soil samples collected from Khetri copper mine area were found to contain
abnormally high Cu concentration (763 mg kg�1), which was 30-folds higher
(phytotoxic level) than that of uncontaminated soil (26.4 mg kg�1). Also
11.5 Soil Pollution in Mining Areas 297

concentrations of Cr, Fe, Zn and Pb in soil were elevated as compared to unpolluted
soils (Maharia et al. 2010). The abandoned copper mines in Mosaboni (Jharkhand,
India) left huge amount of untreated tailings containing high concentration of toxic,
environmentally available (equal to total metal except silicate matrix bound metal)
Cu (154 mg kg�1), Ni (136 mg kg�1) and Pb (9.9 mg kg�1) which became a source
of metal pollutants. About 12.5%, 0.8% and 8% of environmentally available
fractions of Cu, Ni and Pb were in bio-available forms (DTPA extractable),
respectively (Shyamsundar et al. 2014). In all the samples, concentration of total
Cu and Ni were found exceeding the toxicity threshold limit as indicated by Kabata-
Pendias and Pendias (1984).
11.5.3 Chromite Mining Impact
About 95% of India’s chromite minerals are deposited in the state of Orissa with
approximately 183 million tons of deposits located in the region’s Sukinda and
Baula-Nuasahi mining belts (Ministry of Mines 2010). Sukinda chromite valley in
the district of Jajpur, Orissa has one of the largest chromite deposits of the country
and produces 8% of total chromite, mainly through opencast mining method. High
Cr(VI) concentration in ground and surface water, mine effluents and seepage water
samples in the area was reported (Tiwary et al. 2005). Chromium
(VI) concentration was found to be varying between 0.02 and 0.12 mg L�1 in
mine effluents and 0.03–0.8 mg L�1 in shallow hand pump waters and
0.05–1.22 mg L�1 in quarry seepage. The concentration of Cr(VI) in the surface
water source (Damsal creek) was in the range of 0.03–0.14 mg L�1, which
increased in the downstream due to mining activities.
Dhal et al. (2010) also assessed the environmental impact of chromite mining
belts in Baula-Nuasahi area and they reported hostile conditions for organisms in
the surrounding environment. This study also revealed that most of the water
quality parameters exceeded national/international permissible standards. The
soils in and around the overburden region had low nutrient (N, P and K) and the
microbial population. Also hazardous metals were found to be leached and accu-
mulated in nearby agriculture lands and caused them less fertile for crop produc-
tion. The main source of Cr pollution in this region was found to be overburden
dumps and seepage water.
A case study at South Kaliapani, Chromite Mine Area, Orissa on mine waste
water irrigated rice grown soil indicated that Cr(VI) concentration (0.65 mg L�1) in
the mine wastewater used for irrigation was beyond the toxic limit i.e., > 0.008 mg
L�1 and total Cr content in soil irrigated with mine waste water was very high
(11,170 mg kg�1) compared to normal soil (Mohanty et al. 2011). Soils of agricul-
tural land near abandoned chromite-asbestos mine area of Chaibasa (Jharkhand
state) had accumulated high Cr and Ni as indicated by values of contamination
factor and geoaccumulation index (Kumar and Maiti 2015). Concentrations of Zn,
Mn, Co, Cu, Pb, and Cd were found low and within toxicity limit. Metal grouping
298 11 Status of Soil Pollution in India

and site grouping cluster analysis also revealed that Cr and Ni were closely linked
with each other and chromite-asbestos mine waste was the major source of
contamination.
11.5.4 Arsenic Toxicity Near Gold Mining Areaof Karnataka
Prevalence of arsenicosis and As related cancers among human population had
been reported from several villages of Raichur, Yadgir and Gulbarga districts in
north-eastern Karnataka and a study conducted jointly by Govt. of Karnataka and
UNICEF indicated a unsafe levels (>10 μg L�1 As) of As in drinking water samples
(groundwater) of 69 villages in these districts. A comprehensive study to investi-
gate the cause of As like symptoms among villagers of the area was conducted in
Kiradalli Tanda village of Yadgir district (Chakraborti et al. 2013). The village is
only 4 km away from a gold mine which had been closed for mining operations since
1994. Arsenical skin lesions (as confirmed through histopathological analysis) were
observed among 58.6% of a total 181 screened individuals. Analysis of hair and nail
samples from all of these As affected individuals had elevated As contents. About
79% of the tube-well water samples had As above 10 μg L�1. Top soil samples
from the residential area contained As in the range 99–9136 mg kg�1, which were
very high considering the its commonly reported range of 2.2–25 mg kg�1 for
unpolluted soils (McBride 1994). This indicate that inhalation of soil dust might be
another route of As entry into human being. Arsenic concentrations in the food grains
were however, found considerably low in the area.
11.6 Aerial Deposition of Heavy Metals on Land
The rapid industrialization and urbanization have resulted atmospheric deposition
of heavy metals. Several case studies have indicated that industrial, mining and
urban activities generate considerable dust in the atmosphere and these dust parti-
cles are normally enriched with heavy metals (Patel et al. 2010a; Mishra et al. 2013;
Pal et al. 2014). A study conducted by CPCB (2011) indicated that suspended
particulate matter (SPM) was more in air near industrial areas as compared to that in
city residential areas of both Raipur and Raigarh in Chhatisgarh. SPM of these areas
are loaded with heavy metals (0.43–0.89% in Raigarh and 1.17–1.87% in Raipur).
Moradabad in UP is known as brass city due to large number of brassware
industries. Pal et al. (2014) found that SPM (PM10) was highest in industrial area
followed by commercial area and least in residential area. Metal (Cd, Cr, Cu, Fe,
Ni, Pb and Zn) concentrations in the air due to suspended particles were also
considerably higher near industrial area as compared to commercial and residential
11.6 Aerial Deposition of Heavy Metals on Land 299

areas. Coal mining areas in Jharia also contained high SPM (PM10) in air
(20.8 μg m�3) (Mishra et al. 2013). Mean concentrations of all SPM were around
2 times higher than that of non-mining area. Level of these pollutants for coal
mining areas was found higher than that of most of the cities nearby.
Tiwari et al. (2008) investigated atmospheric deposition of heavy metals in
urban and sub-urban area of Varanasi city. Atmospheric deposition was maximum
for Mn (387.3 g ha�1 year�1) followed by Zn (336.7 g ha�1 year�1), Cr (124.4 g
ha�1 year�1), Pb (71.0 g ha�1 year�1), Ni (51.2 g ha�1 year�1), Cu (39.8 g ha�1
year�1) and Cd (6.9 g ha�1 year�1). Their deposition was the maximum in heavy
traffic zone followed by commercial, residential and sub-urban areas in the
decreasing order. Another study (Sharma et al. 2008) in Varanasi indicated
deposition rate of Cd as 13.8 g ha�1 year�1, Zn as 525 g ha�1 year�1, Cu as
66.8 g ha�1 year�1 and Pb as 9.8 g ha�1 year�1. An earlier study (Tripathi et al.
1993) in Mumbai showed deposition rate for Cd, Zn, Cu, and Pb as 0.4, 371.6,
94.3 and 32.4 g ha�1 year�1, respectively.
11.6.1 Risk to the Peri-Urban Agriculture with AtmosphericDeposition
Most the atmospheric emissions of heavy metals from the centers of anthropogenic
activities are likely to end up as their depositions over nearby agricultural land
directly or through washing-off of the vegetations. If the mean metal concentration in
biomass of rice and wheat grown in uncontaminated soils (Kabata-Pendias and
Pendias 1992) are considered, annual uptake of heavy metals by rice-wheat cropping
system should not be more than 1.3 g Cd ha�1, 2 g Cr ha�1, 65 g Cu ha�1, 6 g Ni ha�1,
5 g Pb ha�1 and 440 g Zn ha�1 under Indian condition (assuming wheat and rice grain
yield of 5 and 4 t ha�1). On the other hand, if means of the annual heavy metal
deposition rates, as found out by different workers above are assumed (7 g Cd ha�1,
124 g Cr ha�1, 67 g Cu ha�1, 51 g Ni ha�1, 38 g Pb ha�1 and 410 g Zn ha�1), the
annual deposition of Cd, Cr, Pb and Ni can be several times higher than their uptake by
above ground biomass (Table 11.16). However, even at this rate of soil contamination
due to atmospheric deposition, heavy metal build-up in the soil would be very slow.
For example, it will take 200 years for Cd, 460 years for Cr, 2900 years for Ni and
1050 years for Pb to get their total contents become double than the present level in
plough layer at Bhopal city as an example.
However, Sharma et al. (2008) have reported that atmospheric deposition had
substantially contributed towards the heavy metals accumulation in vegetables and
consumption of which lead to potential health risks to the consumers. This study
revealed that both Cu and Cd posed health risk to human via all the tested
vegetables consumption, whereas Pb only through cauliflower. Another study in
China revealed that Pb and Cd in the grain grown nearby highway were due to the
foliar uptake from atmosphere which, accounted for about 46% of Pb and 41% of
300 11 Status of Soil Pollution in India

Cd of the total uptake and there was no significant contribution of atmosphere to Cr,
Zn and Cu in grain. The study concluded that atmospheric Pb and Cd around
highway can directly contaminate food (Feng et al. 2011). Smolders (2001) con-
cluded from his research work that in rural areas with low atmospheric Cd depo-
sition, of less than 2 g Cd ha�1 y�1, airborne Cd in the plants has only a marginal
influence on the crop Cd concentrations. On the other hand, when the atmospheric
Cd deposition is well above 10 g Cd ha�1 y�1 can be a major source of crop Cd and
dietary Cd. This kind of conditions may occur in and around the pyrometallurgic
smelters with high Cd emissions.
11.7 Pollution Around Municipal and Hazardous Waste
Dumpsites
Municipal solid wastes (MSW) are considered to be loaded with hazardous material
and have severe environmental consequences if it not properly treated. Unorga-
nized, indiscriminate and unscientific dumping of municipal wastes is very com-
mon disposal method in many Indian cities which causes adverse impacts to the
environment. Environmental impact of unscientific land-filling/dumping of MSW
usually results from the run-off of the toxic compounds into nearby land area,
surface water and groundwater which eventually lead to water pollution as a result
of percolation of leachate. For example, examination of soils in three municipal
waste dumpsites of Allahabad, Uttar Pradesh, showed elevated total metal concen-
trations of Cr, Cu, Fe, Ni, Pb and Zn (32.46–108.85 mg kg�1) (Tripathi and Misra
2012). Among the sites investigated, Daraganj dumpsite was highly contaminated
while Phaphamau dumpsite was least contaminated. The order of metal contami-
nation in dumpsites was Pb > Zn > Fe > Ni > Cu > Cr > Cd. It indicates that the
heavy metal contamination at unscientific dumpsites is higher and of great concern
for their surrounding environment and organisms. The Thane-Belapur industrial
area, in Maharashtra produces 5 tonnes of waste every day, which is co-disposed
with municipal waste in municipal waste dumpsites. The water bodies in the
vicinity of this dumpsite area are polluted and sediment in the Ulhas river has
registered high levels of mercury and arsenic (Vision 2025 of Planning
Table 11.16 Estimation of impact of atmospheric deposition on heavy metal contents in soil
Heavy
metal
Annual mean atmospheric
deposition rate (g ha�1)
Annual mean removal by
rice-wheat system (g ha�1)
Annual increase in total
content in soil (mg kg�1)
Cd 7 1.3 0.003
Cr 124 2 0.061
Cu 67 65 Nil
Ni 51 6 0.022
Pb 38 5 0.016
Zn 410 440 Nil
11.7 Pollution Around Municipal and Hazardous Waste Dumpsites 301

Commission, Government of India). Considerable leachate migration from munic-
ipal dumpsite in Ariyamangalam of Tiruchirappalli district (Tamil Nadu) resulted
heavy metals contamination in soils of nearby area (Kanmani and Gandhimathi
2013).
Hazardous waste disposal sites are one of the major sources of elevated levels of
metals in the soil environment around industrial area. Parth et al. (2011) studied and
reported the degree of contamination of soil in respect of heavy metals accumula-
tion in and around hazardous waste disposal sites located in the north-western part
of Hyderabad, India. It was estimated that annual hazardous/industrial waste of
approximately 50,000 tonnes was abandoned as landfill over 200 acres of area in the
city outskirts. These hazardous wastes were contaminating soil resource. Soils in
the vicinity of dumpsite and the downstream were considerably contaminated with
metals. The heavy metals such as As, Cr, Pb in the soils was found to exceed the
threshold and natural background values. The highest concentrations of Cu, Ni and
Zn exceeded the prescribed threshold limit. The soil pH was acidic to alkaline and
was one of the major factors affecting mobility/solubility of metals in soil environ-
ment. In Kolkata, Adhikari et al. (1993) found significant accumulation of Cr, Pb
and Cd in upland surface soils of agricultural land due to long-term application of
sewage sludge.
11.8 Soil Contamination Due to Agricultural Activities
Although contribution of agriculture to GDP of India has fallen over time, absolute
production has increased almost continuously over the years, mainly due to techno-
logical innovations, and intensive use of agricultural inputs. Many a times, safety of
environment has been compromised with quality of these inputs due to pressure of
enhancing productivity of land. Fertilizers have been considered as an essential
input to agriculture as these play an important role in achieving the total food grain
production worldwide to feed the ever increasing population and to meet their daily
needs of food, fuel and fiber. Consumption of chemical fertilizers and organic
manure bear a direct relationship with food grain production. The total nutrient
consumption (N þ P2O5 þ K2O) was about 24 million tonnes during 2013–2014,
with about 141 kg fertilizer per ha (Annual Report 2014-‘15, Department of
Fertilizers, Govt. of India). Excessive use of fertilizers and pesticides, antibiotics
and hormones in livestock and irrigating farms with contaminated wastewater are
agricultural factors affecting soil pollution. Many of these agricultural inputs have
been reported to be contaminated with heavy metals (Table 11.17).
302 11 Status of Soil Pollution in India

Table
11.17
Agriculturalsources
oftraceelem
entcontaminationin
soils(m
gkg�1)
Element
Sew
agesludge
Phosphatefertilizers
Lim
estone
Nitrogenousfertilizers
Municipal
solidwaste
compost
Manures
Pesticides
As
2–26
2–1200
0.1–24
2–120
–3–150
22–60
Cd
2–1500
0.1–170
0.04–0.1
0.05–8.5
Tr.–8.4
0.3–0.8
–
Cr
20–40,600
66–245
10–15
3–19
14–401
5.2–55
–
Cu
50–3300
1–300
2–125
1–15
25–865
2–60
12–50
Hg
0.1–55
0.01–1.2
0.05
0.3–3
–0.09–26
0.8–42
Mn
60–3900
40–2000
40–1200
––
30–550
–
Ni
16–5300
7–38
10–20
7–38
8.6–190
7.8–30
–
Pb
50–3000
7–225
20–1250
2–1450
11–647
6.6–15
60
Zn
700–49,000
50–1450
10–450
1–42
82–946
15–250
1.3–25
Adoptedfrom
Kabata-Pendias(2000)andSahaet
al.(2010a)
11.8 Soil Contamination Due to Agricultural Activities 303

11.8.1 Impact of Fertilizer Use on Heavy Metal Build-Upin Agricultural Land
Generally fertilizers are manufactured from the raw materials that are collected
from underground through mining like rock phosphate, sulphates etc. Therefore
fertilizers contain highly variable amount of heavy metals as impurities
(Table 11.17). Among the fertilizers, use of rock phosphates and phosphatic
fertilizers in agriculture are considered as environmental concern due to their
potential for enhancing heavy metal levels in soil and contaminating food crops
(Mortvedt 1996; Gupta et al. 2014). For instance, concentrations heavy metals in
phosphate fertilizers were reported as 0.5–20 ppm (mean 11.3) As, 0.1–250 ppm
(mean 65 ppm) Cd, 63–896 ppm (mean 173.2 ppm) Cr, 0.2–1170 ppm (56.6 ppm)
Cu and 0.5–151 ppm (27.5 ppm) Ni (USEPA 1999). Concerns are raised on
accumulation of heavy metals and their contamination to food crops due to contin-
uous application of phosphatic fertilizers in soil. However, long-term experiments
in different countries indicated no significant contamination of food due to contin-
uous P fertilizer application (Smilde and van luit 1983; Rothbaum et al. 1986;
Mortvedt 1987). On the contrary, uptake of Cd by herbage was found higher where
P fertilizer was being applied continuously over several decades under a long-term
experiment (Jones and Jonston 1989).
In India, analysis of soils and plant samples from long term (>39 years) fertil-
izers experiments at Barrackpore, Jabalpur, Bangalore, Ranchi, Palampur,
Pantnagar and New Delhi indicated that application of 150% and/or 100%
recommended doses of NPK for this period resulted build-up of the heavy metals
like Cd, Pb, Co, Cr and Ni. However, contamination level didn’t reach the unsafe
levels. Also, heavy metals in edible plant parts showed that risk to human health is
very little (Adhikari et al. 2012).
11.9 Soil Pollution Through Use of Geogenically
Contaminated Groundwater
11.9.1 Use of Arsenic (As) Contaminated Groundwaterfor Irrigation
The prevalence and consistent increase in evidences of As contamination of
groundwater has been reported from various countries. In India also, its contami-
nation in water and soil have been recognized a serious clinical problem in several
states. In West Bengal, extensive As contamination in groundwater and soil has
been reported from nine districts, particularly in intensive cropping areas within the
upper delta plain along the Bhagirathi and other rivers (CGWB 1999). About 10%
of total human population in the state was exposed to the risk of As toxicity by
304 11 Status of Soil Pollution in India

consuming As contaminated ground water for drinking purpose (Elangovan and
Chalakh 2006). Analysis of 140150 water samples from tube wells in all 19 districts
of West Bengal for arsenic indicated that 48.1% samples had As>10 μg L�1 (WHO
guideline value), 23.8% had>50 μg L�1 (Bureau of Indian Standard) and 3.3% had
>300 μg L�1 (concentration predicting overt arsenical skin lesions) (Chakraborti
et al. 2009). Arsenic contamination of groundwater, soil and food had also been
reported from other regions of India such as Uttar Pradesh, Jharkhand, Bihar,
Madhya Pradesh, Chhattisgarh, Assam, Manipur, Tripura, Arunachal Pradesh,
Punjab and Andhra Pradesh (Chakraborti et al. 1999, 2003; Chetia et al. 2011;
Govil et al. 2001; Mukherjee et al. 2006; Rao et al. 2001; Singh et al. 2011; Sharma
et al. 2016). In a study in the state of Punjab, the concentration of As in 200 ground-
water and surface soil samples were analyzed (Singh et al. 2011). In southern states
of Punjab, As in groundwater varied from 5.33 to 17.27 μg As L�1, and in soil it
varied from 1.09 to 2.48 mg As kg�1. About 40% of ground water samples exceed
the permissible limit (10 μg As L�1).
Reductive dissolution of Fe-hydroxides (FeOOH) stimulated by microbial activ-
ity and organic materials is regarded as the most important mechanism of releasing
As into the aquifer (Mukherjee and Bhattacharya 2001; Ravenscroft et al. 2001;
Smedley et al. 2003; McArthur et al. 2004). Continuous use of As-contaminated
groundwater may elevate the soil arsenic level, thereby increasing the possibility of
arsenic entering into the food chain. Arsenic contamination or build-up in fertile
alluvial soils of Malda, Dinajpur (North and South), Murshidabad, Nadia, Burdwan,
24 Parganas (North and part of South), Hoogly districts has arisen from use of
arsenic loaded ground water as a source of irrigation. Beside underground source of
drinking water, As can also enter into human body through consumption of food
that is grown using contaminated groundwater for irrigation.
Impact of As contaminated groundwater irrigation in different vegetables and
crops (Table 11.18), and their dietary intake was studied (Santra et al. 2013). The
results revealed that tubers accumulated higher amount of arsenic than leafy
vegetables followed by fruit vegetables. The As accumulation was high in potato,
brinjal, arum, amaranthus, radish, lady’s finger and cauliflower; and was at moder-
ate level in beans, green chilli, tomato, bitter guard, lemon and turmeric. Its
accumulation in mustard was in the range 0.339–0.373 mg kg�1. Among the pulses,
pea showed the highest As content (1.30 mg kg�1) and the lowest As concentration
was found in moong bean (0.314 mg kg�1).
In Gangetic West Bengal, huge amount of the groundwater is used as irrigation
for production of winter (boro) and summer (aush) rice during winter and summer
(November to May). In the affected districts, use of As-contaminated groundwater
as irrigation in paddy fields caused accumulation of As in rice irrespective of its
varieties (Halder et al. 2014). As a result, As accumulation was found more in bororice than that grown in rainy-season (aman, grown predominantly with rain water).
Further, high yielding rice varieties accumulated more arsenic than local varieties.
Garari et al. (2000) predicted that the left over roots after harvest of crops have
contributed substantially to the As accumulation in soils. However, the toxicity due
to As to human and crops depends on forms or species of As rather than the total As
11.9 Soil Pollution Through Use of Geogenically Contaminated Groundwater 305

content. Generally As exists in AsO43� and AsO3
3� forms in soil and the later is
considered being more toxic to animal and human. Soil properties like texture,
mineralogy, redox potential (Eh) and pH control the speciation and mobility of As
in soil.
Average daily intakes of As by adult and children through their diet were
computed as 560 μg and 393 μg, respectively, on the basis of average dietary
habit and concentrations of the toxicant in common food items. Further the people
having poor nutrition were found to be more vulnerable to As toxicity than the people
having adequate nutrition (Santra et al. 2013). Contamination of food chain and daily
intake of As by human through food and drinking water was estimated in Nadia
district where unsafe levels of the element in groundwater in widely prevalent
(Samal et al. 2011). Average concentrations of As in drinking water and commonly
grown food in the area were 16 μg L�1 in drinking water, 156–194 μg kg�1 in rice,
69–780 μg kg�1 in vegetables and 24.7 μg kg�1 in pulse (lentil). Total intake of
As through foodstuffs was computed as 560 μg day�1 by adults and 393 μg day�1
by children in the area which were quite alarming. After adjusting the
excretion through urine, investigators indicated considerable potential risk of As
Table 11.18 Arsenic levels in soil, crops and vegetables grown in West Bengal, (India) and
adjoining countries
Country
Arsenic in soil
(mg kg�1)
Arsenic in crops and
vegetable (mg kg�1)
ReferencesRice Vegetables
Bangladesh NA 0.358 0.034 Chowdhury et al.
(2001)
West Bengal,
India
11.35 0.245 <0.0004–0693 Roychowdhury et al.
(2002)
Bangladesh NA NA 0.306–0.489 Alam et al. (2003)
Bangladesh NA NA 0.011–0.103 Farid et al. (2003)
Bangladesh 7.31–27.28 0.04–0.27 0.2–3.99 Das et al. (2004)
West Bengal,
India
7.0–38.0 0.30 NA Norra et al. (2005)
China 6.04 0.117 0.003–0.116 Huang et al. (2006)
Bangladesh 14.5 0.5–0.8 NA Rahman et al. (2007)
Nepal 6.1–16.7 0.180 <0.010–0.550 Dahal et al. (2008)
West Bengal,
India
1.34–14.09 0.16–0.58 NA Bhattacharya et al.
(2009)
West Bengal,
India
5.70–9.71 0.334–0.451 0.030–0.654 Bhattacharya et al.
(2010)
Bihar, India 0.027 0.019 0.011–0.015 Singh et al. (2011)
West Bengal,
India
NA 0.156–0.194 0.069–0.78 Samal et al. (2011)
West Bengal,
India
NA 0.01–0.64 0.03–0.35 Halder et al. (2013)
Santra et al. (2013)
NA not available
306 11 Status of Soil Pollution in India

exposure to local inhabitants through continuous consumption of As-contaminated
foodstuffs and drinking water. Such intake rates of As are alarmingly higher
keeping in view of maximum tolerable daily intake 2.1 μg kg�1 body weight by
humans from all sources (WHO 1988). In Ropar district of Punjab, consumption of
As contaminated wheat grains was found to pose higher risk of cancer and
non-cancer health disorders as compared to intake of As contaminated groundwater
by both adults and children (Sharma et al. 2016).
11.9.2 Use of Selenium Contaminated Ground Waterfor Irrigation
Selenium is an essential element in human and animals; and however, it shows
toxicity symptoms when taken in larger amount. Long-term ingestion of excess Se
may result in chronic disease, called ‘selenosis’ with symptoms of nausea, diarrhea,
joint pain, loss of nail and teeth and skin rashes appearing according to severity of
the disease. Upper intake level of Se is 400 μg d�1 for adult and is 45–280 μg d�1
(varies according to age) for children (ATSDR 2001). Selenium toxicity is also
observed in animals with symptoms of vision loss, random walking, loss of hair,
deformed and sloughing hooves, joint erosion, paralysis etc.
Geology of a region affects or influences the distribution of Se in soils. Soils
containing >0.5 mg Se kg�1 are considered as seleniferous as the forages produced
on such soils absorb Se more than the maximum permissible level for animal
consumption. Pockets of seleniferous soils have been identified in north-eastern
parts (mainly in Hoshiarpur and Nawanshahar districts) of Punjab, India. Dhillon
and Dhillon (2003) examined the Se content of soils, irrigation water, plants and
animal tissues in the region. These seleniferous soils occupied more than 1000 ha,
but toxic sites were reported only in 4–16 ha that were distributed sporadically in
the study area. The Se content in surface (2.12 � 1.13 mg kg�1) and sub surface
(1.16 � 0.51 mg kg�1) soils in the toxic sites was 4–5 times higher than that of
non-seleniferous areas. The development of seleniferous pockets was mainly
because of the deposition of seleniferous materials transported by seasonal rivulets
from higher reaches of the Siwalik hills and use of groundwater for frequently
irrigating crops like lowland rice. Some parts of Rajasthan and Southern parts of the
Haryana also had soils with selenium levels above normal soil. Selenium in
contaminated soil and water exists mainly as highly mobile toxic inorganic species
such as selenate (SeO42�, Se6+) and selenite (SeO3
2�, Se4+). As a result, these
transfer efficiently through the soil-plant-animal- human system. Rice crop grown
on a seleniferous soil (2.85 mg kg�1 Se) from Nawanshahar, Punjab recorded
reduction in growth and delayed flowering. Selenium accumulation increased by
about 3 to 20-folds in leaves and grains of rice grown on seleniferous soil as
compared to normal soil containing 0.135 mg Se kg�1 (Sharma et al. 2014)
(Fig. 11.6).
11.9 Soil Pollution Through Use of Geogenically Contaminated Groundwater 307

11.10 Environmental Risks of Organic Pollutants
in Environmental Samples
11.10.1 Indiscriminate Use of Pesticides and Insecticides
In addition to fertilizers, a large amount of pesticides are used in agriculture to
ensure a good yield of crops. Most part of the applied pesticide, irrespective of
crops, ultimately finds its way into soil. Though a large part of these are degraded
by soil microorganisms or inactivated by soil matrix through absorption, these
affect adversely the functioning of non-target microbes and other soil organisms
before inactivation. Prakash et al. (2004) studied the presence of HCH isomers
residues in 45 surface (0–15 cm) and subsurface (15–30 cm) soils samples from
agricultural sites of Delhi, Haryana, and Uttar Pradesh and around the HCH
manufacturing plant of Indian Pesticide Limited. Thirty nine soil samples contained
residues of b-HCH (2.5–463 mg kg�1) and the remaining six samples showed the
presence of g-HCH (0.08–43.00 mg kg�1). And residues of a-HCH (0.04–98.00 mg
kg�1) and d-HCH (0.07–458.00 mg kg�1) were detected less frequently. Random
monitoring of pesticides in water had also detected residues of persistent organo-
chlorines in many rivers like Ganga, Yamuna, Cooum, Ulsoor, Mandori, Hoogly
inflicting damage to aquatic life and health of fish consuming human population
(UNEP 2002).
In India, several cases of residues like parathion, endosulfan, DDT etc. were
reported in food samples. The presence of pesticide residues in samples of fruits,
vegetables, cereals, pulses, grains, wheat flour, oils, eggs, meat, fish, poultry,
bovine milk, butter and cheese in India was reported by several investigators.
Analysis of 16,948 samples of vegetable, fruits, spices, cereals, pulses, milk, animal
feed, fish/crustacean, tea, honey, meat, egg, soil and ground water by 21 participat-
ing laboratories across the country during the period of April 2011 to March 2012,
for the possible residues of agrochemicals like organo-chlorine, organo-
0
0.5
1
1.5
2
2.5
3
3.5
Pusa Basmati 1121 PR 116
Se in
gra
in (m
g kg
-1)
Rice variety
Normal soil
Seleniferous soil
Fig. 11.6 Selenium
accumulation in rice grain
grown on seleniferous soil
(Adopted from Sharma
et al. 2014)
308 11 Status of Soil Pollution in India

phosphorous, synthetic pyrethroids, carbamates, herbicides etc. revealed that about
290 (1.7%) samples were found to contain these chemicals above maximum residue
limit (MRL) as prescribed under Prevention of Food Adulteration Act (PFA)/Food
Safety Standard Authority of India (FSSAI) (Kulshrestha 2013).
11.10.2 Environmental Risks of Other Organic Pollutantsin Environmental Samples
Though persistent organic pollutants (other than pesticides) are less investigated in
agricultural soils, concerns are expressed on their entry through several inputs.
Devanathan (2012) have studied the contamination status of organo-halogen com-
pounds (OHCs), including polychlorinated biphenyls (PCBs), polybrominated
diphenyl ethers (PBDEs) and hexabromocyclododecanes (HBCDs) in human
milk, fish and dust samples collected from different locations in India. Higher
levels of OHCs were found in the dust samples near e-waste recycling areas and
improper e-waste recycling and dismantling are considered to be the major sources
of these contaminants. Farm-raised fishes contain relatively high levels of PCBs
and PBDEs than wild fishes. However, the concentration of these contaminants and
dietary intake from fish was much lower than the guideline values which indicate
less risk. Municipal dumpsites in India have been found to contain dioxins and
related compounds like PCDD/DFs high amount (Subramanian and Tanabe 2007,
Subramanian et al. 2015). Toxic persistent organic pollutants (PCDD/DFs, PCBs,
and PAH) have also been found in significant amount in composts prepared from
municipal solid wastes which can be a potential medium for entry of these pollut-
ants in agricultural land (Grossi et al. 1998). Fish and human milk samples
particularly from surrounding areas of the municipal waste dumping sites of
Kolkata and Chennai in India contain significantly higher levels of PCBs which
suggest that there is a greater risk for infants living near these sites (Someya et al.
2010). The hazard quotients (HQs) values were above one for PCBs in the infants
and toddlers living near the municipal dumping and e-waste recycling areas and it
indicated high risk with toxic organic pollutants among human population living in
the city and industrial area. Hence regular monitoring is necessary for having a
more real assessment on status of these toxic organic pollutants and taking appro-
priate measures for reducing the pollutants level in the environment.
References
Adhikari S, Gupta SK, Banerjee SK (1993) Heavy metals content of city sewage and sludge. J
Indian Soc Soil Sci 41:170–172
Adhikari T, Wanjari RH, Biswas AK et al (2012) Final Report of the project entitled “Impact
assessment of continuous fertilization on heavy metals and microbial diversity in soils under
References 309

long-term fertilizer experiment” (Submitted to Ministry of Forest and Environment, New
Delhi), p 175
Alam MG, Snow ET, Tanaka A (2003) Arsenic and heavy metal contamination of vegetables
grown in Samta village, Bangladesh. Sci Total Environ 308:83–96
Ansari AA, Singh IB, Tobschall HJ (1999) Status of anthropogenically induced metal pollution in
the Kanpur-Unnao industrial region of the ganga plain, India. Environ Geol 38:25–33
ATSDR (2001) Toxicological profile for selenium. Agency for Toxic Substances and Disease
Registry, U.S. Department of Health And Human Services, Public Health Service, Division of
Toxicology/Toxicology Information Branch, Atlanta, Georgia
ATSDR (2005) Toxicological profile for nickel. Agency for Toxic Substances and Disease
Registry, U.S. Department of Health And Human Services, Public Health Service, Division
of Toxicology/Toxicology Information Branch, Atlanta, Georgia
Balagangatharathilagar M, Swarup D, Patra RC, Dwivedi SK (2006) Blood lead level in dogs from
urban and rural areas of India and its relation to animal and environmental variables. Sci Total
Environ 359:130–134
Balakrishnan M, Antony SA et al (2008) Impact of dyeing industrial effluents on the groundwater
quality in Kancheepuram (India). Indian J Sci Technol 1:1–8
Beijer K, Gao K, Jonsson ME et al (2013) Effluent from drug manufacturing affects cytochrome
P4501 regulation and function in fish. Chemosphere 90:1149–1157
Bhagure GR, Mirgane SR (2011) Heavy metal concentrations in groundwaters and soils of thane
region of Maharashtra, India. Environ Monit Assess 173:643–652
Bhattacharya P, Samal AC, Majumdar J, Santra SC (2009) Transfer of arsenic from groundwater
and Paddy soil to Rice plant (Oryza sativa L.): a micro level study in West Bengal, India.
World J Agric Sci 5:425–431
Bhattacharya P, Samal AC, Majumdar J, Santra SC (2010) Arsenic contamination in rice, wheat,
pulses, and vegetables: a study inan arsenic affected area of West Bengal, India. Water Air Soil
Pollut 213:3–13
Bhupal Raj G, Singh MV, Patnaik MC, Khadke KM (2009) Four decades of research on micro-
and secondary- nutrients and pollutant elements in Andhra Pradesh. Research Bulletin. AICRP
Micro- and Secondary-Nutrients and Pollutant Elements in Soils and Plants, IISS, Bhopal, pp
1–132
BIS (2012) Indian standard: drinking water-specification, 2nd revision, ICS 13.060.20. Bureau of
Indian Standards, New Delhi
Business Standard (2015) NGT flays UP, MP government for pollution in Singrauli. http://www.
business-standard.com/article/pti-stories/ngt-flays-up-mp-government-for-pollution-in-
singrauli-115100600689_1.html#. Accessed 6 Oct 2015
CGWB (1999) High incidence of arsenic in groundwater in West Bengal. Central Ground Water
Board, India, Ministry of Water Resources, Government of India
Chakraborti D, Biswas BK, Chowdhury TR et al (1999) Arsenic groundwater contamination and
sufferings of people in Rajnandgaon, Madhya Pradesh, India. Curr Sci India 77:502–504
Chakraborti D, Mukherjee SC, Pati S et al (2003) Arsenic groundwater contamination in middle
ganga plain, Bihar, India: a future danger? Environ Health Perspect 111:1194–1201
Chakraborti D, Das B, Rahman MM et al (2009) Status of groundwater arsenic contamination in
the state of West Bengal, India: a 20-year study report. Mol Nutr Food Res 53:542–551. doi:10.
1002/mnfr.200700517
Chakraborti D, Rahman MM, Murrill M et al (2013) Environmental arsenic contamination and its
health effects in a historic gold mining area of the Mangalur greenstone belt of northeastern
Karnataka, India. J Hazard Mater 262:1048–1055
Chetia M, Chatterjee S, Banerjee S et al (2011) Groundwater arsenic contamination in
Brahamputra river basin: a water quality assessment in Golaghat (Assam), India. Environ
Monit Assess 173:371–385
Choudhury UK, Rahaman MM, Mondal BKGK et al (2001) Groundwater arsenic contamination
and sufferings of people in West Bengal, India and Bangladesh. Environ Sci 8:393–415
310 11 Status of Soil Pollution in India

CPCB (2009) Comprehensive Environmental Assessment of Industrial Clusters. Ecological
Impact Assessment Series: EIAS/5/2009–2010. Central Pollution Control Board, Ministry of
Environment and Forest, Government of India
CPCB (2011) Report on SPM characterization for heavy metals concentration: Study areas-Raipur
& Raigarh in Chhatisgarh state 2010–2011. Central Pollution Control Board, Bhopal. http://
cpcb.nic.in/SPMCharacterization.pdf Accessed 19 Aug 2016
CWGB (2013) Central Ground Water Board, Govt. of India. http://gis2.nic.in/cgwb/Gemsdata.
aspx. Accessed 16 Jan 2013
Dahal BM, Fuerhacker M, Mentler A (2008) Arsenic contamination of soils and agricultural plants
through irrigation water in Nepal. Environ Pollut 155:157–163
Das HK, Mitra AK, Sengupta PK et al (2004) Arsenic concentrations in rice, vegetables, and fish in
Bangladesh: a preliminary study. Environ Int 30:383–387
Devanathan G, Subramanian A, Sudaryanto A et al (2012) Brominated flame retardants and
polychlorinated biphenyls in human breast milk from several locations in India: potential
contaminant sources in a municipal dumping site. Environ Int 39:87–95
Dhal B, Das NN, Pandey BD, Thatoi HN (2010) Environmental quality of the boula-nuasahi
chromite mine area in India. Mine Water Environ 30:191–196
Dhillon KS, Dhillon SK (2003) Distribution and management of seleniferous soils. Adv Agron
79:120–184
Elangovan D, Chalakh ML (2006) Arsenic Pollution in West Bengal. Technical Digest, National
Bank for Agriculture and Rural Development, Issue 9, pp 31–35. https://www.nabard.org/pdf/
issue9td-8.pdf Accessed 12 Aug 2016
Farid ATM, Roy KC, Hossain KM, Sen R (2003) A study of arsenic contaminated irrigation water
and it’s carried over effect on vegetable. Fate of arsenic in the environment. Bangladesh
University of Engineering and Technology, Dhaka, pp 113–121
Feng J, Wang Y, Zhao J et al (2011) Source attributions of heavy metals in rice plant along
highway in eastern China. J Environ Sci 23:1158–1164
Garari TK, Das DK, Sarkar S (2000) Effect of iron and zinc application on the availability of
native and applied arsenic simulating low land rice condition. Paper presented at the Interna-
tional Conference on managing natural resources for sustainable agricultural production in the
21st Century, held at the New Delhi 14–18 February 2000
Ghose MK (2004) Effect of opencast mining on soil fertility. J Environ Indus Res 63:1006–1009
Goswami S, Das M, Guru BC (2008) Environmental impact of Siljora opencast manganese
mining, Keonjhar: an overview. Vistas Geol Res 7:121–131
Goswami S, Mishra JS, Das M (2010a) Environmental impact of manganese mining: a case study
of Dubna opencast mine, Keonjhar district, Orissa, India. J Ecophysiol Occup Health
9:189–197
Goswami S, Das M, Guru BC (2010b) Environmental degradation due to exploitation of mineral
resources: a scenario in Orissa. The Bioscan 2:295–304
Govil PK, Reddy GL, Krishna AK (2001) Contamination of soil due to heavy metals in the
Patancheru industrial development area, Andhra Pradesh, India. Environ Geol 41:461–469
Govil PK, Sorlie JE, Murthy NN et al (2008) Soil contamination of heavy metals in the Katedan
industrial development area, Hyderabad, India. Environ Monit Assess 140:313–323
Gowd SS, Reddy MR, Govil PK (2010) Assessment of heavy metal contamination in soils at
Jajmau (Kanpur) and Unnao industrial areas of the ganga plain, Uttar Pradesh, India. J Hazard
Mater 174:113–121
Grossi G, Lichtig J, Krauβ P (1998) PCDD/F, PCB and PAH content of Brazilian compost.
Chemosphere 37:2153–2160
Gupta DK, Chatterjee S, Datta S et al (2014) Role of phosphate fertilizers in heavy metal uptake
and detoxification of toxic metals. Chemosphere 108:134–144
Halder D, Bhowmick S, Biswas A et al (2013) Risk of arsenic exposure from drinking water and
dietary components: implications for risk Management in Rural Bengal. Environ Sci Technol
47:1120–1127
References 311

Halder D, Biswas A, Slejkovec Z, Chatterjee D et al (2014) Arsenic species in raw and cooked
rice: implications for human health in rural Bengal. Sci Total Environ 497-498:200–208
Huang RQ, Gao SF, Wang WL (2006) Soil arsenic availability and the transfer of soil arsenic to
crops in suburban areas in Fujian Province, Southeast China. Sci Total Environ 368:531–541
Jain N, Bhatia A et al (2005) Impact of post-Methanation distillery effluent irrigation on ground-
water quality. Environ Monit Assess 110:243–255
Jena D, Nayak MK, Acharya N, Singh MV (2003). Fluoride Distribution in Soil, Water and Plant
in the Vicinity of NALCO Smelter Plnat at Angul in Orissa. In: Environmental Pollution-
Proceedings of the International Conference on Water and Environment (WE-2003) 15–-
18 December 2003, Bhopal, India, pp 188–194
Jones KC, Johnston AE (1989) Cadmium in cereal grain and herbage from long-term experimental
plots at Rothamsted, UK. Environ Pollut 57:199–216
Juwarkar A, Singh SK, Dubay K, Nimje M (2003) Reclamation of Iron Mine Spoil Waste Dumps
Using Integrated Biotechnological Approach. In: Proceedings of national seminar on status of
environmental management in mining industry, Varanasi, January 17–18, pp 197–212
Kabata-Pendias A (2000) Trace element in soils and plants, Third edn. CRC Press, Baton Raton, p
432
Kabata-Pendias A, Pendias K (1984) Trace elements in soils and plants. CRC press, Boca Raton, p
315
Kabata-Pendias A, Pendias H (1992) Trace elements in soils and plants. CRC Press, Baton Raton,
p 365
Kanmani S, Gandhimathi R (2013) Assessment of heavy metal contamination in soil due to
leachate migration from an open dumping site. Appl Water Sci 3:193–205
Kaul PP, Srivastava R, Srivastava SP et al (2002) Relationships of maternal blood lead and
disorders of pregnancy to neonatal birth weight. Vet Human toxicol J 44:321–323
Krishna AK, Govil PK (2008) Assessment of heavy metal contamination in soils around Manali
industrial area, Chennai, southern India. Environ Geol 54:1465–1472
Kulshrestha S (2013) Report of the expert committee to frame a policy for monitoring of pesticide
residues in Fruits & Vegetables. Ministry of Health & family Welfare, Nirman Bhawan
Kumar A, Maiti SK (2015) Assessment of potentially toxic heavy metal contamination in
agricultural fields, sediment, and water from an abandoned chromite-asbestos mine waste of
Roro hill, Chaibasa. India Environ Earth Sci. doi:10.1007/s12665-015-4282-1
Larsson DJG, de-Pedro C, Paxeus N (2007) Effluent from drug manufactures contains extremely
high levels of pharmaceuticals. J Hazard Mater 148:751–755
Lenka M, Panda KK, Panda BB (1992) Monitoring and assessment of mercury pollution in the
vicinity of a chloralkali plant. IV. Bioconcentration of mercury in in-situ aquatic and terrestrial
plants at Ganjam, India. Arch Environ Contam Toxicol 22:195–202
Maharia RS, Dutta RK, Acharya R, Reddy AVR (2010) Heavy metal bioaccumulation in selected
medicinal plants collected from Khetri copper mines and comparison with those collected from
fertile soil in Haridwar, India. J Environ Sci Health, Part B: Pesticides Food Contam Agr
Wastes 45:174–181
Mahimairaja S, Sakthivel S, Divakaran J et al (2000) Extent and severity of contamination around
tanning industries in Vellore district. In: Naidu R, Willett IR, Mahimairajah S, Kookana R,
Ramasamy K (eds) Towards better management of soils contaminated with tannery wastes,
ACIAR publication no 88. Australian Centre for International Agricultural Research, Can-
berra, pp 75–82
Masto RE, Lal CR, Joshy G, Vetrivel AS et al (2011) Impacts of opencast coal mine and mine fire
on the trace elements’ content of the surrounding soil Vis-�a-Vis human health risk. Toxicol
Environ Chem 93:223–237
McArthur JM, Banjeree DM, Hudson-Edwards KA et al (2004) Natural organic matter in
sedimentary basins and its relation to arsenic in anoxic ground water: the example of West
Bengal and its worldwide implications. Appl Geochem 19:1255–1293
McBride MB (1994) Environmental chemistry of soils. Oxford University Press Inc, New York
312 11 Status of Soil Pollution in India
Ministry of Mines (2008) National mineral policy of India. Government of India
Ministry of Mines (2010) National mineral policy of India. Government of India
Mishra AK, Maiti SK, Pal AK (2013) Status of PM10 in bound heavy metals in ambient air in
certain parts of Jharia coal field, Jharkhand, India. Int J Environ Sci 4:141–150
Mohanty M, Pattnaik MM, Mishra AK, Patra HK (2011) Chromium bioaccumulation in rice
grown in contaminated soil and irrigated mine wastewater-a case study at south Kaliapani
chromite mine area, Orissa, India. Int J Phytoremed 13:397–409
Mondal NC, Saxena VK et al (2005) Assessment of groundwater pollution due to tannery
industries in and around Dindigul, Tamilnadu, India. Environ Geol 48:149–157
Mortvedt JJ (1987) Cadmium levels in soils and plants from some long-term soil fertility
experiments in the United States of America. J Environ Qual 16:137–142
Mortvedt JJ (1996) Heavy metal contaminants in inorganic and organic fertilizers. Fert Res
43:55–61
Mukherjee A, Bhattacharya P (2001) Arsenic in groundwater in the Bengal Delta plain: slow
poisoning in Bangladesh. Environ Rev 9:189–220
Mukherjee S, Nelliyat P (2007) Groundwater pollution and emerging environmental challenges of
industrial effluent irrigation in Mettupalayam Taluk, Tamil Nadu. In: Comprehensive Assess-
ment of Water Management in Agriculture Discussion Paper 4, International Water Manage-
ment Institute, Colombo, Sri Lanka, p 51
Mukherjee A, Sengupta MK, Hossain MA et al (2006) Arsenic contamination in groundwater: a
global perspective with emphasis on the Asian scenario. J Health Popul Nutr 24:142–163
Norra S, Berner ZA, Agarwala P et al (2005) Impact of irrigation with arsenic rich groundwater on
soil and crops: a geochemical case study in West Bengal delta plain, India. Appl Geochem
20:1890–1906
Pal R, Mahima A, Tripathi A (2014) Assessment of heavy metals in suspended particulate matter
in Moradabad, India. J Environ Biol 35:357–361
Pandey B, Agrawal M, Singh S (2016) Ecological risk assessment of soil contamination by trace
elements around coal mining area. J Soils Sediments 16:159–168
Panwar NR, Saha JK, Adhikari T et al (2010) Soil and water pollution in India: some case studies,
IISS Technical Bulletin. Indian Institute of Soil Science, Bhopal
Parr JF, Papendick RI, Hornick SB, Meyer RE (2009) Soil quality: attributes and relationship to
alternative and sustainable agriculture. Am J Altern Agric 7:5–11. doi:10.1017/
S0889189300004367
Parth V, Murthy NN, Saxena PR (2011) Assessment of heavy metal contamination in soil around
hazardous waste disposal sites in Hyderabad city (India): natural and anthropogenic implica-
tions. J Environ Res Manage 2:27–34
Patel KS, Ambade B, Sharma S et al (2010a) Lead Environmental Pollution in Central India. In:
Ramov B (ed) New Trends in Technologies, InTech, Available from: http://www.intechopen.
com/books/new-trends-in-technologies/lead-environmental-pollution-in-central-India
Patel KP, Singh MV, George V, Ramani VP (2010b) Four decades of research on management of
micro- and secondary- nutrients and pollutant elements in crops and soils of Gujarat. Indian
Institute of Soil Science, Bhopal
Prakash O, Suar M, Raina V et al (2004) Residues of hexachlorocyclohexane isomers in soil and
water samples from Delhi and adjoining areas. Curr Sci India 87:73–77
Rahman MA, Hasegawa H, Rahman MM (2007) Accumulation of arsenic in tissues of rice plant
(Oryza sativa L.) and its distribution in fractions of rice grain. Chemosphere 69:942–948
Rangasamy S, Purushothaman G, Alagirisamy B, Mahimairaja S (2015) Chromium contamination
in soil and groundwater due to tannery wastes disposals at Vellore district of Tamil Nadu. Int J
Environ Sci 6:114–124
Rao VVSG, Dhar RL, Subrahmanyam K (2001) Assessment of contaminant migration in ground-
water from an industrial development area, Medak district, Andhra Pradesh, India. Water Air
Soil Pollut 128:369–389
References 313

Ravenscroft P, McArthur JM, Hoque BA (2001) Geochemical and palaeohydrological controls on
pollution of groundwater by arsenic. In: Chappel WR, Abernathy CO, Calderon R (eds)
Arsenic exposure and health effects IV. Elsevier Science Ltd, Oxford, pp 53–78
Rawat M, Ramanathan AL, Subramanian V (2009) Quantification and distribution of heavy metals
from small scale industrial areas of Kanpur city, India. J Hazard Mater 172:1145–1149
Rothbaum HP, Goguel RL, Johnston AE, Mattingly GEG (1986) Cadmium accumulation in soils
from long-continued applications of superphosphate. J Soil Sci 37:99–107
Roychowdhury T, Uchino T, Tokunaga H, Ando M (2002) Survey of arsenic in food composites
from an arsenic-affected area of West Bengal, India. Food Chem Toxicol 40:1611–1621
Saha JK (2005) Changes in salinity and sodicity of soils with continuous application of contam-
inated water near industrial area. J Indian Soc Soil Sci 53:612–617
Saha JK, Sharma AK (2006) Impact of the use of polluted irrigation water on soil quality and crop
productivity near Ratlam and Nagda industrial area. Agricultural Bulletin IISS-1. Indian
Institute of Soil Science, Bhopal, India
Saha JK, Panwar N et al (2010a) An assessment of municipal solid waste compost quality
produced in different cities of India in the perspective of developing quality control indices.
Waste Manag 30:192–201
Saha JK, Panwar N, Singh MV (2010b) Determination of lead and cadmium concentration limits
in agricultural soil and municipal solid waste compost through an approach of zero tolerance to
food contamination. Environ Monit Assess 168:397–406
Saha JK, Panwar N et al (2013a) Risk assessment of heavy metals in soil of a susceptible agro-
ecological system amended with municipal solid waste compost. J Indian Soc Soil Sci
61:15–22
Saha JK, Rao AS, Mandal B (2013b) Integrated management of polluted soils for enhancing
productivity and quality of crops. In: Gaur RK, Sharma P (eds) Approaches to plant stress and
their management. Springer, New Delhi, pp 1–21
Samal AC, Kar S, Bhattacharya P, Santra SC (2011) Human exposure to arsenic through foodstuffs
cultivated using arsenic contaminated groundwater in areas of West Bengal, India. J Environ
Sci Health A Tox Hazard Subst Environ Eng 46(11):1259–1265
Santra SC, Samal AC, Bhattacharya P et al (2013) Arsenic in food chain and community health
risk: a study in Gangetic West Bengal. Proc Environ Sci 18:2–13
Sellamuthu KM, Mayilswami C et al (2011) Effect of textile and dye industrial pollution on
irrigation water quality of Noyyal River basin of Tamil Nadu. Madras Agric J 98:129–135
Sharma RK, Agrawal M, Marshall FM (2008) Atmospheric deposition of heavy metal (copper,
zinc, cadmium and lead) in Varanasi city, India. Environ Monit Assess 142:269–278
Sharma S, Goyal R, Sadana US (2014) Selenium accumulation and antioxidant status of rice plants
grown on seleniferous soil from northwestern India. Rice Sci 21:327–334
Sharma S, Kaur J, Nagpal AK, Kaur I (2016) Quantitative assessment of possible human health
risk associated with consumption of arsenic contaminated groundwater and wheat grains from
Ropar Wetand and its environs. Environ Monit Assess. doi:10.1007/s10661-016-5507-9
Shyamsundar PC, Das M, Maiti SK (2014) Phytostabilization of Mosaboni copper mine tailings: a
green step towards waste management. Appl Ecol Environ Res 12:25–32
Singh SK, Ghosh AK (2011) Entry of arsenic into food material – a case study. World Appl Sci J
13:385–390
Singh V, Brar MS, Sharma P, Brar BS (2011) Distribution of arsenic in groundwater and surface
soils in south western districts of Punjab. J Indian Soc Soil Sci 59:376–380
Sinha S, Gupta AK, Bhatt K et al (2006) Distribution of metal in the edible plant grown at Jajmau,
Kanpur (India) receiving treated tannery wastewater: relation with physico-chemical proper-
ties of the soil. Environ Monit Assess 115:1–22
Smedley PL, Zhang M, Zhang G, Luo Z (2003) Mobilisation of arsenic and other trace elements in
fluviolacustrine aquifers of the Huhhot Basin, Inner Mongolia. Appl Geochem 18:1453–1477
Smilde KW, Van Luit B (1983) The effect of phosphate fertilizer on cadmium in soils and crops.
Rapport 6–8, Inst. voor Bodemvruchtbaarheid, Oosterweg, pp 1–17
314 11 Status of Soil Pollution in India

Smolders E (2001) Cadmium uptake by plants. Int J Occup Med Environ Health 14:177–183
Somasundaram MV, Ravindran G et al (1993) Ground-water pollution of the madras urban
aquifer, India. Ground Water 31:4–11
Someya M, Ohtake M, Kunisue T et al (2010) Persistent organic pollutants in breast milk of
mothers residing around an open dumping site in Kolkata, India: specific dioxin-like PCB
levels and fish as a potential source. Environ Int 36:27–35
Stalin P, Singh MV, Muthumanickam D et al (2010) Four decades of research on micro and
secondary nutrients and pollutant elements in crops and soils of Tamil Nadu. Research
Publication No. 8. AICRP Micro- and Secondary- Nutrients and Pollutant Elements in Soils
and Plants, IISS, Bhopal
Stracher GB, Taylor TP (2004) Coal fires burning out of control around the world: thermodynamic
recipe for environmental catastrophe. Int J Coal Geol 59:7–17
Subramanian A, Tanabe S (2007) Persistent Toxic Substances in India. In: Li A, Tanabe S, Jiang G
et al (eds) Developments in environmental science, vol 7. Elsevier Ltd. doi:10.1016/
S1474–8177(07)07009-X
Subramanian A, Kunisue T, Tanabe S (2015) Recent status of organohalogens, heavy metals and
PAHs pollution in specific locations in India. Chemosphere 137:122–134
Swain BK, Goswami S, Das M (2011) Impact of mining on soil quality: a case study from Hingula
open coal mine, Angul district, Orissa. Vistas Geol Res 10:77–81
Tiwari K, Pandey A, Pandey J (2008) Atmospheric deposition of heavy metals in a seasonally dry
tropical urban environment (India). J Environ Res Develop 2:605–611
Tiwary RK, Dhakate R, Rao VA, Singh VS (2005) Assessment and prediction of contaminant
migration in ground water from chromite waste dump. Environ Geol 48:420–429
Tripathi A, Misra DR (2012) A study of physico-chemical properties and heavy metals in
contaminated soils of municipal waste dumpsites at Allahabad, India. Int J Environ Sci
2:2024–2033
Tripathi RM, Ashawa SC, Khandekar RN (1993) Atmospheric depositions of Cd, Pb, Cu and Zn in
Bombay, India. Atmos Environ 27:269–273
UNEP (2002) Environmental data report. United Nations Environmental Programme, Nairobi
USEPA (1999) Background report on fertilizer use, contamination and regulations, EPA-747-R-
98-003. Office of Pollution Prevention and Toxics, Washington, DC
WHO (1988) Toxicological evaluation of certain food additives and contaminants: Arsenic. The
33rd meeting of the Joint FAO/WHO Expert Committee on Food Additives, 26, 155–162,
Geneva
Yellishetty M, Ranjith PG, Kumar DL (2009) Metal concentrations and metal mobility in
unsaturated mine wastes in mining areas of Goa, India. Resour Conserv Recycl 53:379–385
References 315

Chapter 12
Remediation and Management of Polluted
Sites
Abstract Soils perform several important ecosystem functions and therefore pol-
luted land requires remediation and appropriate management for restoration of its
life sustaining functions. Several technologies have been developed for their reme-
diation based on clean-up, detoxification and risk minimization approaches. All of
these technologies have both advantages and disadvantages in respect of the extent
of applicability, side-effects on other components of environment, cost & ease of
adoption, speed & effectiveness of remediation etc. While removal of contaminants
and the risk minimization are the major approaches for heavy metal polluted soil,
degradation to non toxic or less toxic compounds is the most common approach for
soils polluted with organic pollutants. Plants, microorganisms, nanotechnology
have also been used for remediation of polluted sites with varying degree of
success. Waste products from agriculture, industries, city etc. have also exhibited
their potential in minimizing risk from pollutants. Growers may minimize risks
from polluted land through modification of soil, crop and nutrient managements.
This chapter also discusses examples of a remediation approaches followed in case
of different polluted sites worldwide.
Keywords Soil pollution • Decontamination • Heavy metals • Organic pollutants •
Integrated management • Phytoremediation • Nanotechnology
Contamination of soil, water bodies and sediments with toxic trace elements is the
most unfortunate by-product of urbanization, industrialization and mining. The use
of contaminated water enhances the chance of occurrences of diseases in plant,
animal and human and adversely affects the soil health. As described in previous
chapters, occurrence of significant soil and water pollution due to industrial, mining
and urban activities have been reported through several studies in India and other
countries. In order to restore the natural ecosystem functions, to prevent these from
contaminating other components of environment, to improve the quality of human
and animal life dependent on the polluted land area, their remediation has been
advocated by government organizations, environmentalists, policy makers and land
owners. By definition, soil remediation is a set of processes and techniques of
reducing the mobile and in consequence, bioavailable fraction of contaminants in
soils. The sole objective of soil remediation is to minimize transfer of pollutants
into soil organisms, plants, food chains, surface water and groundwater bodies so
© Springer Nature Singapore Pte Ltd. 2017
J.K. Saha et al., Soil Pollution - An Emerging Threat to Agriculture, Environmental
Chemistry for a Sustainable World 10, DOI 10.1007/978-981-10-4274-4_12
317

that expression of toxicity to organisms is either prevented or minimized. Remedi-
ation of large rural areas with marginally polluted soils, and agricultural fields
should be approached differently than the remediation of heavily contaminated
areas such as those around mining and smelting sites. The selection of remediation
technologies depends on:
(a) Size of contaminated area and its topographical location
(b) History of contamination process,
(c) Soil mineralogical, physical and chemical characteristics (e.g., structure, tex-
ture, pH, oxides, carbonates etc.),
(d) Physical and chemical properties of the contaminants,
(e) Degree of pollution (i.e., contaminants concentration and their vertical and
horizontal spread in the profile),
(f) Intended land use after remediation,
(g) Technological options and financial support available,
(h) Possible impact of remediation technologies on environment,
(i) Associated legal and social issues of the region and country.
Objectives of remediation can be achieved either by soil clean-up process through
removal and/or inactivation (of toxic metals and metalloids) and degradation
(of organic pollutants) of contaminants or by preventing their spread to surrounding
soil and groundwater through isolation and/or immobilization. In this section,
different available remediation technologies and their appropriate applicable
areas have been described.
12.1 Engineering Approaches
12.1.1 Isolation and Containment
Under this method, contaminants are isolated and contained to prevent further
movement through reducing their permeability and increasing the strength or
bearing capacity for the contaminants. Physical barriers (made of steel, concrete,
bentonite, clay and tiled-walls) can be used for vertical and horizontal containment
as well as for capping of contaminated zone. Capping with synthetic membranes is
also advocated to reduce water infiltration and contamination of groundwater.
Advantages of containment approach are (i) simple and robust; (ii) generally
economical compared to contaminant removal technologies; (iii) eliminates con-
taminant transport to other areas almost completely. This approach of remediation
has also limitations like (i) it may not reduce mass, concentration, or toxicity;
(ii) slurry/clay walls (if used for containment) are not impermeable and hence
provide containment over a finite period; (iii) long-term monitoring of the contain-
ment system is required to ensure that contaminants are not migrating.
318 12 Remediation and Management of Polluted Sites

12.1.2 Excavation and Landfilling
‘Soil excavation and landfilling’ is the most common remediation method for metal
polluted soils. The process consists of two steps: (i) removal of the contaminated
soil from the contaminated site to a special land-fill and (ii) restoration of the site
which may include backfilling the excavated space by clean soil with subsequent
establishment of vegetation. Soil placed in landfills may also require additional
treatment to stabilize metals against their leaching to groundwater. Hazardous
waste landfills are specially constructed to contain the contaminant metals in
effective manner. However, it is extremely environmentally disruptive to the site
and can often be extremely expensive. ‘Excavation and landfilling’ is simple and is
most widely used technique for small, heavily contaminated sites. Site managers
often prefer this technique because of its low risk of failure, its predictable time
frame for decontamination, and because it leaves the site in a relatively pristine
condition. In case of contamination over a large area, this technique is simply not
feasible due to high costs involved with excavation of large mass of contaminated
soil; its replacement with equal quantity of good quality soil and limited availability
of landfill space to contain high volume of contaminated soil.
12.1.3 Vitrification
During vitrification, contaminated soil mass is treated through the processes involv-
ing melting and refreezing to create a glass-like solid that entraps inorganic
contaminants and thereby isolates these from the environment. It can be applied
both in-situ and elsewhere above ground in a treatment unit (ex-situ). The high
temperature applied during vitrification process also destroys organic contaminants
in soil. Vitrification is thus applicable for treating soil contaminated with both toxic
organic chemicals and trace elements. The process involves introduction of elec-
trodes into the wet soil that is capable of carrying current. Heat generated during
current flow raises temperature of surrounding soil mass to 1100–1450 �C that is
sufficient to liquefy siliceous soil particle. After melting is over, contaminated mass
is solidified upon cooling. Toxic gases can also be produced during vitrification of
soil contaminated with certain contaminants. Full-scale vitrification technologies
exist for soils contaminated with arsenic, lead and chromium. Soil mixed with
various toxic wastes can also be treated in this manner.
Limitations Efficiency of vitrification process is reduced by higher contents of
clay, moisture and debris. Applicability of solidification/stabilization processes is
generally limited to shallow depth and smaller volume of contamination. Vitrifica-
tion can not be used where soil is contaminated with large amounts of flammable or
explosive materials. Heating the soil may cause movement of contaminants into
clean areas in the subsurface region. Also, the solidified material may prevent future
use of the site. Heating process rapidly volatilizes some organic pollutants and
12.1 Engineering Approaches 319

volatile heavy metals including radionuclides (if present). Such vaporized contam-
inants as well as the high voltage applied during the process pose potential health
and safety risks to the human.
12.1.4 In-Place Stabilization/Immobilization
Contaminated soils may be stabilized by mixing with solidifying materials such as
cement or other pozzolanic materials (siliceous or alumino-siliceous material
possessing cementing properties), thermoplastics, or other suitable agents. Stabili-
zation/immobilization techniques may be applied in situ at the site of contamination
or ex situ on excavated soil. The stabilized matrix may be a solid impermeable mass
or a more friable solidified matrix. The solidified soil matrix reduces exposed
surface area, resulting in reduced contaminant contact with the surrounding envi-
ronment and reduced loss by leaching. Cement is the most commonly used solid-
ifying material because of it’s low cost, readily available, and is relatively easy to
handle. Cement has a high pH at which many metals form insoluble compounds;
thereby it also stabilizes the contaminants chemically. The resulting pH of the
matrix stabilized with cement, may be more than ten and therefore, the cement
stabilized soil mass cannot support plant growth. In some cases, the chemical form
of the contaminants, particularly halides and soluble salts, may retard cement
setting time or reduce the strength of the soil-cement mixture. Stabilization/immo-
bilization is most effective in low to moderately contaminated soils, especially
where contamination is near the surface where excavation or in situ mixing is
easiest. However, the site may require periodic inspection as most weathering
processes may lower pH of the stabilized soil-mass and this may cause the
cemented material to break down and liberate the contaminants back into the
surrounding environment. Stabilization techniques may not be suitable for some
forms of trace element contaminants, such as ionic species that exist as oxyanions
(e.g., Cr2O72�, AsO3
�) or metals (e.g., Hg) whose solubility as hydroxides is quite
significant. Stabilization-immobilization technology may not be suitable at sites
contaminated with wastes containing high amount of organic pollutants, especially
volatile organics.
12.1.5 Soil Washing
Contaminated soils can also be remediated by soil washing. Two types of soil
washing are followed:
320 12 Remediation and Management of Polluted Sites

12.1.5.1 Particle Separation Techniques
In this case, soil contaminants are associated with one particular range of size
fractions of the soil which are subsequently segregated out and disposed separately.
Most of the insoluble organic and inorganic toxic contaminants have the affinity to
be attached with clay, silt, and organic soil particles through either chemical
bonding or physical forces. This verity is utilized for reducing soil contamination
through particle size separation. The silt and clay particles are attached to sand and
gravels by physical forces like compaction and adhesion. Contaminated organic
matter particles, fine clay (along with associated humus fraction) and silt particles
are separated from the coarser sand and gravel soil particles by washing processes
and thereby contaminants are concentrated effectively into a smaller soil volume
for subsequent treatment or disposal. This technique is more suitable for removing
high specific gravity particles such as heavy metal-containing compounds (lead,
radium oxide, etc.).
Particle separation technique begins with a coarse separation technique such as
dry sieving to remove large, relatively uncontaminated materials such as stones and
construction material. A variety of engineering methods can subsequently be
employed to segregate particles by their density, size and shape. These methods
include sieving, use of hydrocyclones (which dissociate the larger particles from the
smaller ones via centrifugal force), fluidized-bed separation systems in a vertical
column (that carries aways maller particles at the top along with counter-current
overflow), or gravimetric settling/flotation (based on the differences in surface-
density characteristics of contaminant carrying particles). Addition of certain froth
forming chemicals, flotation reagents along with aeration assists contaminate bear-
ing particles to float and thus enhances efficiency of separation. Such washing
technology is most effective only in soils with higher proportion of sand and silt,
and most of the contaminants being associated with the clay or organic matter
fractions.
12.1.5.2 Leaching Technique
In this case, contaminants are chemically solubilized and removed from the soil
system. Soil washing as a decontamination technique removes contaminants solu-
bilized using chemical extractants and may be conducted in situ or ex-situ on
excavated soil. Chemical extractants used to enhance heavy metal solubility include
inorganic acids (e.g., H2SO4, HCl), organic acids (e.g., acetic acid), complexing
agents (detergents, EDTA), or combinations of these chemicals. During this pro-
cess, suitable extracting solution is percolated through the soil. The solution is
recovered and treated to remove the contaminants; and extractants are often
re-used. This process continues until the remediation goal is achieved or further
solubilization/extraction of contaminants is not possible. Soil washing by extraction
or leaching has several limitations. It is only effective or possible on recently
12.1 Engineering Approaches 321

contaminated soils and where pollutants are relatively soluble. It also requires an
extracting agent that can easily be reconditioned. The use of strong acids requires
extraction reactors, where tubings and containers are constructed with anti-
corrosive material. Furthermore, the chemicals used for extraction may have
significant detrimental impacts on the environment (even though may not be
strongly acidic), necessitating additional steps in soil remediation process. In case
of in-situ soil washing, contaminants solubilized during this process may leach into
underlying soil and groundwater, if carried out without proper precautions. Some
forms of this remediation technique using concentrated acids result in a large
amount of decontaminated soil with extremely low pH, as well as a sizable quantity
of contaminant-containing solution, both of which require additional attention
following remediation. However, this process is only sparingly used due to cost
and engineering constraints.
12.1.6 Thermal Treatment
Thermal treatment is rarely used on soils contaminated with heavy metals. It is
commonly used for removing organic contaminants through chemical degradation
and volatilization by heating the soil to high temperatures. The vaporized contam-
inants are subsequently collected and treated. Different types of soil heating
techniques are available like; electrical resistance heating, radio frequency/electro-
magnetic heating, hot air/steam injection. Theoretically, this process may also be
applied to soil polluted with metals; but it is not usually considered a practical or
effective technique unless it is highly contaminated (5–10%). Efficiency of extrac-
tion for certain contaminants varies and depends on the maximum temperature
achieved in the process selected. Even at temperatures of about 1200 �C the
volatility of most of the metals and metal compounds is too low to remove sufficient
amount of the contaminants. Among the toxic metals, this method is most suitable
for removing mercury, since it is easily transformed to its vapor form (Hg�) at hightemperatures even at low concentration (Smith et al. 1995). The high energy
demand required to volatilize contaminants makes this a costly remediation tech-
nique, and the chance of dispersal of volatilized contaminants to nearby
uncontaminated areas may be a concern. This technique of remediation is less
efficient for soils with reduced permeability to air due to high compactness or due to
high moisture content. Such reduced air permeability hinders the operation of
thermally enhanced soil vapor extraction by enhancing energy requirement for
increased vacuum and temperature.
322 12 Remediation and Management of Polluted Sites

12.1.7 Electro-Reclamation
Electro-reclamation is based on an electrokinetic process which occurs during flow
of direct current between a cathode and an anode inserted in the soil. The electric
current results in the flow of small electrically charged particles and soil-pore water
where cations and anions travel to the cathode and anode respectively. In most soils
with a predominance of negatively charged surfaces, uncharged molecules migrate
with the bulk flow of liquids towards the cathode. The technique is most success-
fully applied in high clay soils containing organic or relatively mobile contaminants
and is applicable to a relatively few metal ions. During the remediation process,
electrodes must be equipped with a purge system that helps to maintain pH around
the electrodes and removes the contaminants. The effectiveness of electro-
reclamation is mostly dependent on the chemical composition of soil pore-water
and groundwater. For example in calcareous soils, the process efficiency depends
largely on the nature of clay minerals and the calcium and magnesium bearing
minerals like calcite, dolomite, gypsum etc. The heavy metal concentration in the
soil after remediation depends on their initial concentrations, the electrokinetic
mobility and the exchangeability with the other metal ions (Lageman et al. 1990).
The efficiency of electroreclamation is less for soils with a high cation ion exchange
capacity (causing stronger retention of metals) and having high acid neutralizing
capacity (like calcareous soil). If resource-support is available, the efficiency of insitu remediation can be increased by irrigating the soil with slightly acidified water
(pH 3–4). The level of acidification for irrigation water in such case depends mainly
on the cation exchange capacity of the soil. Minimum moisture content of the soil
for reclamation should not be less than 10%. Major limitations with
electroreclamation process are high cost of equipment installation, substantial
amounts of electricity requirement, and frequent maintainance of the system. Due
to these constraints and its inability to remove precipitated contaminants, it is not
often applicable at site.
12.2 Chemical Approaches
Due to high cost and limited applicability of above engineering based technologies,
attention has been focused in recent years on the development of in situ contami-
nants immobilization methods that are relatively cost effective and less disruptive
to the surrounding landscape, water bodies, and ecosystems. For severely contam-
inated barren land, immobilization of contaminants with soil application of suitable
amendment materials and subsequent re-vegetation of the area are considered
efficient and less expensive alternative remediation method. In this approach,
soluble and potentially soluble solid phase forms of contaminants are converted
to geochemically more stable solid phases through different soil processes like
sorption, ion exchange, and precipitation. However, metals immobilization within
12.2 Chemical Approaches 323

soil should be significant and long-lasting so that process reduces contamination
potential of the site to plant and water bodies. Subsequently, more vegetation can
develop on the reclaimed site to stabilize the soil further and as a result of greater
vegetative cover, lateral wind erosion is prevented to a larger extent and heavy
metal percolation is greatly minimized. Successful in situ immobilization fulfils
three main objectives of polluted site remediation: (1) to stabilize soil with vege-
tation cover and limit trace element transfer to plant and food chain, (2) to alter the
trace element speciation in the soil and thus minimize their mobility to contaminate
surface and groundwater, and (3) to diminish the direct exposure of soil organisms
to contaminants and enhance biodiversity. Different soil amendments used as
immobilizing agents and their effectiveness are described below:
12.2.1 Red-mud and Steel Shot Waste
Iron oxides may remove several trace elements from soil solution and the reactions
associated have been related to adsorption, coagulation and diffusion of ions into
lattice structure of soil minerals. Iron containing waste materials like red mud
(a byproduct of aluminum industry) and steel shot waste (an industrial material
containing more than 90% iron) has been found effective in decreasing heavy
metals uptake by crops through immobilization action in soil (Mench et al. 1998).
Application of red mud (at 3 or 5%) had been found to increase soil pH and decrease
metal availability in soil (Gray et al. 2006). Perennial grass Festuca rubra failed to
establish in the unamended contaminated plots, but grew and covered the amended
plots almost completely. In another experiment, application of red mud to four
different heavy metal contaminated soils reduced plant uptake of Cd, Pb and Zn in
Festuca rubra and Amaranthus hybrids by 38–87%, 50–81% and 66–87% (Friesl
et al. 2003). Heavy metals uptake by oilseed rape, pea, and wheat was also reduced
with the application of alkaline amendment materials like red mud, lime and
beringite (Lombi et al. 2002). In a field trial, Cd concentration in ryegrass decreased
by amending the soil with steel shot waste (30%) and with sludge from water
treatment plant (20%), Zn concentration fell by about 10% in both cases (Muller
and Pluquet 1998). Red mud was found most efficient in decreasing the “mobile”
fraction of metals and in promoting bacterial population and enhancing soil bio-
chemical activity (Garau et al. 2007).
12.2.2 Clays and Aluminum Pillared Clays
Due to having high cation exchange capacity and large specific surface area, clay
minerals are potential binding agents for various pollutants. Such binding/adsorp-
tion capacity of clay minerals toward cationic heavy metals can be enhanced by the
addition of aluminium. After addition in soil, acidic aluminium is partially neutral-
ized and is precipitated in the form of its hydroxides at the surfaces and in the
324 12 Remediation and Management of Polluted Sites

interstitial space of clay minerals. Heavy metals can be adsorbed on a medium
containing clay and Al-hydroxides present on the surface of clay. Aluminium-
pillared smectites can be prepared by adding in situ aluminum polymers within
clay layers (Bergaya and Barrault 1990). In arsenic contaminated garden soil,
addition of 1% of Al pillared smectite decreased soluble As by about 75% and
plant As by about 50% (Vangronsveld et al. 1994). Aluminum based binding agents
have been recommended for remediation of soils polluted by Ni, Cu, Zn, or Cd
(Lothenbach et al. 1997). Nickel, Cu and Zn were adsorbed specifically on both
Al-montmorillonite (hydroxy-aluminium montmorillonite) and Al13-montmoril-
lonite (montmorillonite intercalated with polynuclear aluminium complex). These
three metals were also incorporated within the interlayers of Al-montmorillonite
and Al13-montmorillonite during the aging processes. While Al13-montmorillonite
is effective in short pH range (6.1–7.5), Al-montmorillonite was most effective in
the wide pH ranges (6–8 for Ni and Zn, 4–6 for Cu, and 7–9 for Cd).
12.2.3 Zeolites
Zeolites may be of both natural and synthetic in origin. These are crystalline,
hydrated alumino-silicates of alkali and alkaline earth cations and possess infinite
3-dimensional crystalline structure having internally a series of interconnecting
channels and cages with specific dimensions. Ion-exchange capacity is the primary
determining factor for the use of zeolites in pollution control. The negative charge
density in zeolite depends primarily on the extent of substitution of Al+3 for Si+4 in
silicate tetrahedra. Heavy metal cations are bonded by these negatively charged
sites at the surfaces and can also be trapped inside the interconnecting channels and
cages. Plethora of research works have dealt with the potential of zeolites to be used
as effective and efficient amendments for soil remediation. The application of
natural zeolite decreased the available fraction of Pb in the garden soil and
restrained the Pb uptake by rape (Li et al. 2009). Application of zeolite @20 g kg�1 reduced the Pb concentration in the edible part (shoots) of rape up to 30% in the
severely polluted soil (2000 mg kg�1). Copper in the presence of zeolite additives
had a much lower availability for leaching out and had lower mobility in the
biogeochemical cycle and the stability constant of copper complexes was higher
in soils with a zeolite additive (Burlakovs et al. 2012).
12.2.4 Coal Ashes
Large amount of coal ashes are generated from thermal power plants as waste
product having tremendous disposal problem. Coal ash is predominantly composed
of ferro-aluminosilicate minerals containing Al, Si, Fe, Ca, K and Na as major
elements in variable proportions. Increases in both alkalinity and salinity are the
12.2 Chemical Approaches 325

most immediate effects of coal ash incorporation into the soil at high dose. Alkaline
property of this industrial waste has been used for neutralizing highly acidic soils.
Addition of coal ash to acid mine spoils may neutralize acidity and consequently,
precipitate soluble heavy metals besides enhancing its physical properties. These
chemical processes have made establishment of vegetation possible on metal
polluted sites. However, coal-ash application may also result in excessive soluble
salt concentrations, excessive boron (B), and in some cases, cause adverse effects
on soil properties (e.g., cementation) and increased concentrations of several
potentially toxic trace elements depending on their concentrations in original coal.
12.2.5 Phosphate Minerals
The apatite group of minerals (phosphate bearing compounds) have been found
effective both in sequestering dissolved metals and in transforming adsorbed metals
(on soil surface) to more insoluble phases. Phosphate minerals may immobilize
trace metals through surface complexation and co-precipitation. Amendment of soil
with apatite diminished availability of Cd and Zn to maize crop at several contam-
inated sites (Chlopecka and Adriano 1997). In comparison to lime, apatite has been
found more effective in decreasing metal content of barley leaves, especially in soil
heavily contaminated with Zn (Chlopecka and Adriano 1996). Both synthetic and
natural hydroxyapatite had been found to reduce mobile forms (soluble and resin-
exchangeable) of Pb in contaminated soils by precipitating soluble Pb as hydroxyl-
pyromorphite [Pb10(PO4)6(OH)2] (Ma et al. 1993). The use of phosphates to
remediate Pb-contaminated soils focuses mainly on in situ precipitation by chang-
ing the existing soil Pb chemistry through formation of Pb phosphates (like pyro-
morphites), with low solubility (Hettiarachchi and Pierzynski 2004).
12.2.6 Alkaline Materials
Liming is thought to be the oldest and probably most commonly adopted
immobilizing technique for heavy metal cations in the soil solution and is specif-
ically suitable in acid soils. Lime decreases readily plant available forms (water-
soluble plus exchangeable fraction) of metals in soils (Saha et al. 1999). Their
repeated application at regular intervals (every 2–5 years; @2–10 tha�1) is neces-
sary to keep metal immobile and therefore, larger quantities of lime are required
compared to other inorganic alkaline amendments (Knox et al. 2001). High Fe and
lime rich composted sludge materials were used successfully in remediation of Zn
and Cd contaminated sites at Palmerton (USA). Lime mixed in compost has been
found more effective in raising soil pH and hence, inactivation of bioavailable
fraction of heavy metals.
326 12 Remediation and Management of Polluted Sites

Liming is however, not recommended for all types of contaminants. The
increase in pH may mobilize toxic anions such as arsenates and chromates
(by displacement with OH�), or organic pollutants by solubilizing humic matter
on which these are normally adsorbed. Lime loses its effectiveness significantly
with time, and therefore metal may remobilize especially at high levels of soil
contamination.
12.2.7 Biochar
In recent years, biochar has been recognized as novel carbonaceous material for
remediation of heavy metals from soil and water system. A group of researchers
found that the soils amended with biochar are having less bioavailable fraction of
toxic metals especially Cd, Cr and Pb (Bolan et al. 2014). It acts as a stabilizing
agent in soil as well as adsorbs the metals from available pool (soil solution) or
from sewage water. Pigeon pea biochar has recently been found to reduce Cd and
Cu bioavailability in soil and their uptake by spinach crop (Coumar et al. 2016a, b).
Characteristics of biochar are determined by several factors, which include feed-
stock type, particle size of the feedstock and temperature and conditions of pyrol-
ysis. Such variation in properties makes a particular biochar more suitable for metal
stabilization in soil over others (Paz-Ferreiro et al. 2014). Large surface area of
biochars is ascribed to be responsible for their higher sorption of heavy metals as
demonstrated by scanning electron microscopy (Lu et al. 2012). Mechanisms for
sorption may be through complexation of trace elements with different functional
groups of biochar, through exchange with cations (such as Ca+2 and Mg+2) or
through physical adsorption. Biochar is generally alkaline in reaction due to
contents of basic oxides. Enhanced pH due to biochar application may result in
heavy metals precipitation in soil. Generally, biochar pH value increases with
temperature of pyrolysis (Jindo et al. 2014). Studies indicated that biochar can be
used along with phytoremediation technology for remediation of trace element
polluted soils, though the mechanisms and strategy for remediation may vary
with type of pollutant and soil type (Paz-Ferreiro et al. 2014).
12.2.8 Organic Matter
Compost is rich in humic matter and acts as a sinks for trace metals due to having
several binding sites. Therefore it has been recommended as soil amendment to
alleviate heavy metal pollution through a low cost approach (Huang et al. 2016).
Compost application can change mobility and bioavailability of heavy metals in
soil environment through various physical and chemical processes namely at
adsorption, complexation, precipitation and redox reactions and as a result can mod-
ify the toxic effects on plants and microorganisms. The consequence of these
12.2 Chemical Approaches 327

processes on mobility depends on nature of the metal/metalloid as well as on the
nature of composts. For example, cationic metals are immobilized but arsenic is
mobilized due to application of compost (Kumpiene et al. 2007; Bissen and
Frimmel 2003). Organic matter has been found to immobilize Cu from active
fractions (water soluble and exchangeable fraction) into inert residual fraction
(Saha et al. 1999). Organic matter added through compost can effectively
reduce (electrochemically) soluble Cr(VI) (anionic form) to Cr(III) (cationic
form) which is strongly absorbed by soil particles, thereby reducing its bioavail-
ability. Unstable or not-fully decomposed compost may increase bioavailability of
heavy metals due to formation of soluble organic complexes (Madrid et al. 2007).
Immobilization of heavy metals by compost is a short duration phenomenon and
such immobilized metals may be remobilized slowly during microbially controlled
C mineralization in the long-run and reach food/fodder parts through plant uptake.
Therefore compost application for remediation may be an appropriate low cost
technology for lowering down the soluble metal levels in the soil immediately after
a pollution/contamination event so that their migration to food and water bodies can
be arrested to an acceptable level.
The major source of compost in India is agricultural wastes and animal manures.
However due to increased mechanization of agriculture, reduced dependency on
livestock population and increased in situ residue burning in field, compost pro-
duction and utilization are becoming less frequent in India. Due to increasing urban
population, potential of preparing composts from municipal solid wastes (MSW)
has increased, which can be used for remediation of heavy metal polluted soils.
However, presence of high amount of heavy metals in the MSW compost is itself an
environmental concern (Saha et al. 2010). Though bioavailability of trace elements
(Cu, Zn, Fe, Mn, Cr, Ni, Pb, Cd) in soils may increase due to application MSW
compost; their contamination in edible part of the plants may not necessarily
increase beyond toxicity thresholds (Papafilippaki et al. 2015). Even then, appro-
priate technology (such as segregation of organic wastes) should be adopted for
preparation of such compost for reducing heavy metals in the final product so that
risks of contamination can be minimized. Similarly, alum [Al2(SO4)3] can be used
to pretreat poultry manure for reducing the water-soluble concentration of As, Zn,
Cu, and Cd (Rai et al. 2004).
12.3 Biological Approaches
12.3.1 Microorganism Based Techniques
Generally, the practical application of microorganisms in remediation technology is
mostly available for soils contaminated with organic components. Microorganism
based remediation techniques for metal-contaminated soils are still developing.
Such techniques function by modifying bioaccumulation, biological oxidation/
328 12 Remediation and Management of Polluted Sites

reduction, and biomethylation of heavy metal contaminants. Presently, these tech-
niques have not been applied so far for on-site remediation.
Heap leaching has been employed in mining processes to obtain economically
desirable metals. Bacteria used to solubilize metals in heap-leaching may include
some members of the genus Thiobacillus, autotrophic anaerobes that thrive at a pHrange of 1–4. These bacteria oxidize reduced form of sulfur compounds (sulfides)
and produce sulfuric acid that lowers pH, thereby enhancing metal solubility.
Solubilized contaminants may be extracted, which may subsequently be treated
by increasing the pH and precipitating these as sulfides under anaerobic conditions.
The performance of the bioleaching process is dependent on the speciation of the
metal contaminants, as well as the presence of sulfide minerals.
The Bio Metal Slurry Reactor (BMSR) is a technique proposed of removal of
heavy metals using microbes from excavated soil (Vangronsveld and Cunningham
1998). This technique operates by accumulating contaminants in bacterial biomass,
and thereafter by removing the contaminated biomass. The BMSR is a stirred tank
reactor which is continuously fed with contaminated soil to which bacteria, water
and nutrients are added. The bacteria, such as the strain of Alcaligenes eutrophusvar. metalloterans, accumulate metals such as Cd or Zn on cell surfaces and
precipitate them. In this process, metals bind to functional groups of the periplasmic
peptidoglycan and to polysaccharides and proteins at the outer cell wall. On the cell
surface, a crystallization process is induced which leads to very high metal to
biomass ratios (between 0.5 to 5.0). Once the bio-precipitation process reaches a
certain level, proteins and polysaccharides bearing precipitates are released from
the cells and new proteins are synthesized. Bioprecipitation continues on both the
released foci and the cell surfaces. In the last stage of the process, the slurry is
sedimented in a settler, and a froth floatation process is used to remove the
contaminant bearing bacterial biomass which remains in the overstanding
suspension.
12.3.2 Phytoremediation of Soils Contaminated with TraceElements
Two possible approaches can be distinguished for phytoremediation of trace
elements-polluted soils, both aiming for a reduction of the bioavailable fraction
of metals in the soil: (a) in situ metal inactivation by means of revegetation (known
as ‘phytostabilization’ or ‘photorestoration’), with or without non-toxic metal-
immobilizing soil amendments, and (b) bioextraction by means of
hyperaccumulating plants (known as ‘phytoextraction’). Different types of
phytoremediation technologies are described as below:
12.3 Biological Approaches 329

12.3.2.1 Phytoextraction
Phytoextraction removes metal contaminants from soil through growing and
harvesting of plants that accumulate metals. This technique exploits plants’ uniqueability to take up, translocate, and accumulate metal ions from the soil. Initially,
researchers used pre-existing plants (not genetically modified) which accumulate
large quantities of metals and are called as hyperaccumulators. When concentration
of metal in the harvestable above ground biomass of the plant reaches 0.1–1% of the
dry weight, the uptake is considered hyperaccumulation. Certain hyperaccumulator
plants like Thlaspi caerulenscens, Haumaniastrum robertii, Ipomoea alpina,Macadamia neurophylla, Psychotria douarret, Thlaspi rotundifolium, Cystusladanifer, Salix sp. etc. are employed to remove heavy metals from soils. Such
plants can tolerate high metal levels in soil and accumulate them at 10 to 500 times
higher levels than other plants and crops. Using modern techniques of biotechnol-
ogy, several high biomass producing phytoaccumulators have been developed by
introducing relevant genes (from hyperaccumulator, bacteria, animals) into
non-accumulator plants (Singh et al. 2003). Some of high biomass
hyperaccumulators for which regeneration protocols have been developed include
Indian mustard (Brassica juncea), sunflower (Helianthus annuus), tomato
(Lycopersicon esculentum) and yellow poplar (Liriodendron tulipifera) (Mello-
Farias et al. 2011).
For phytoextraction to be successful, plants should possess the following char-
acteristics: (a) sufficient accumulation of the metal(s) intended to be extracted,
preferably at >0.1% plant metal concentrations in the above-ground parts, (b) fast
growth with large biomass, (c) suitable plant phenotype for easy harvest, treatment
and disposal, and (d) tolerance to site conditions. The phytoextraction of Pb is
perhaps the most challenging because of its low soil to plant transfer coefficients.
Possible chemical amendments to induce hyperaccumulation include synthetic
organic chelates (e.g., EDTA, DTPA, HEDTA) have been developed for agricul-
tural use. Many of these chelates have great affinity for metals and form strong
chelate-metal complexes, thereby preventing metals from precipitating once they
are taken into plant root, thereby ensuring translocation to the shoots.
Phyto-extraction may not be a practical remediation technique in all sites. Even
in the best case, this technique appears to remove only 100–200 μg metal g–1 soil
year�1 to a depth of about 30 cm. Even at this rate this technique may require
several centuries to decontaminate deep, heavily contaminated areas. Without
multiple cropping, this technique removes at the most 15 μg metal g�1 soil per
year to the same depth. Phytoextraction may not be applicable to all heavy metal-
contaminated sites, particularly those in which contaminants are not located in the
rooting zone, or those which contain high level of extremely biotoxic contaminants
and therefore not effectively hyper-accumulated. In some cases, careful site man-
agement may be necessary to prevent more soluble chelated metals from leaching
and off-site migration.
330 12 Remediation and Management of Polluted Sites

12.3.2.2 Phytovolatilization
During the last decade, research has explored the use of plants to remove metals
from soil by converting them to volatile forms. The volatilization process appears to
involve both plants and plant-microbe associations, and appears to be primarily
associated with the decontamination of mercury and selenium-laden soils. These
plants and plant- microbes associations transform mercury and selenium into a
more volatile and less toxic form, e.g., Hg0 and di-methyl selenide. As selenium is
an essential element for most animal life, the release of selenium into the atmo-
sphere may not cause an environmental problem. This process may not be applied
to other elements such as those which are not readily converted into volatile forms,
or those that have potentially toxic volatile forms. The disadvantage with this
technology is that the mercury released into the atmosphere is likely to be recycled
by precipitation and then re-deposited back into land, lakes and oceans
re-exhibiting its toxicity.
12.3.2.3 Rhizofiltration
Rhizofiltration is generally termed as decontamination of polluted groundwater by
flowing it through the root mass. The contaminants are either adsorbed onto the root
surface or are absorbed within the plant roots and/or transported to stems and
leaves. In this method, plants are hydroponically grown in clean water rather than
on soil until a sufficient root system has developed. Subsequently the clean water
supply is substituted with polluted water supply to acclimatize the plant. After the
plants become acclimatized they are planted in the polluted area where the roots
uptake the polluted water and the contaminants along with it. As the roots become
saturated, these are harvested and disposed of safely. This method has been found
effective and cheap in decontaminating polluted aquous ecosystem. Several hydro-
ponically grown plants like Indian mustard, sunflower and various grasses have
been found to remove toxic metals effectively from water body. In a study,
magnitudes of metals removal by Indian mustard were 131–563 folds as compared
to initial solution concentrations (Dushenkov et al. 1995).
12.3.2.4 Rhizodegradation
Rhizodegradation (also known as enhanced biodegradation at rhizosphere, or
phytostimulation or plant assisted bioremediation) is the break-down of organic
pollutants in the root zone by soil microbes which is enhanced by the
rhizodeposition. Compounds present in plant root exudates such as carbohydrates,
alcohols, and organic acids act as C and energy sources for the soil micro-flora and
enhance microbial growth and activity. The plant roots also make the soil friable
12.3 Biological Approaches 331

and facilitate transport of air and water to the rhizosphere which further enhances
microbial activity and consequent biodegradation of pollutants.
12.3.2.5 Phytostabilisation
Phytostabilisation is the process in which plants are used to immobilize soil and
water contaminants. Unlike phytoextraction, this process mainly focuses on
immobilizing pollutants in soil in the root zone but not sequestration within
above-ground plant tissues. Pollutants become less mobile and hence, their expo-
sure to livestock, wildlife, and human is reduced. The contaminants are absorbed
and accumulated by roots or precipitated in the rhizosphere. This reduces or even
restricts the mobility of the contaminants, preventing their migration into the
groundwater or air, and also reduces their contamination of food chain through
minimized phytoavailibility. This technique has also been found useful in
re-establishing vegetation on sites that have been denuded due to the high levels
of trace element contamination. Once a group of tolerant plant species are
established, magnitude of wind erosion (and hence spread of soil borne pollutant)
and migration of the soil-pollutants to groundwater is reduced. Phytostabilization
involves three processes which include: humification, lignification and irreversible
binding.
12.4 Degradation of Organic Pollutants in Soil
Growing awareness on the harmful effects of hazardous organic chemicals to the
ecosystem and human health has led to a marked increase in framing strategies for
remediation and restoration of polluted sites. Originally, the conventional remedi-
ation techniques involve excavation of contaminated soil and disposal to landfill
(Liedekerke et al. 2014). Though the conventional methods like soil washing,
solvent extraction and oxidation process effectively address the issue of contami-
nants removal from the sites, these have also got a number of limitations such as
high cost and complexity of their application, possibility of secondary contamina-
tion, and lack of public acceptance which have become major drawbacks for
successful implementation of these technologies (Kang 2014; Vidali 2001). Fur-
ther, with the advancement of ex situ and in situ remediation techniques along with
strict regulatory control of landfill operations, the biological treatments of soil have
come into existence as alternative technologies for remediation of contaminated
sites (Liedekerke et al. 2014; Singh and Jain 2003).
Organic pollutants are more likely to ‘attenuate’ and ‘break down’ (degrade)naturally in the soil environment than the inorganic contaminants in soil. Degrada-
tion of such organic contaminants by bacteria and other micro-organisms is well
known and documented (Al-Awadhi et al. 1996) (Table 12.1). In this context, the
capability of biological agents (i.e., bacteria, fungi, and plants) to degrade and
332 12 Remediation and Management of Polluted Sites

Table 12.1 Organic pollutant degradation by soil biota
Organisms Organic pollutant References
Pesticide
Clostridium sp. Dieldrin and Endrin Maule et al. (1987) and
Baczynski et al. (2004)
Bacillus sp.; Micrococcus sp.;Pseudomonas sp.;Trichoderma viride;Trichoderma harzianum
Dieldrin, Endrin Matsumura and Boush
(1967), Patil et al. (1970),
Matsumura et al. (1971) and
Katayama and Matsumura
(1993)
Arthrobacter sp.;Achromobacter; Klebsiellapneumoniae; Pseudomonasspinose; Pseudomonasaeruginosa; Algae
Endosulfan Kwon et al. (2002), Hussain
et al. (2007), Singh and Singh
(2011) and Sethunathan et al.
(2004)
Aspergillus niger; Aspergillussydoni; Fusariumventricosum; Trichodermaharzianum
Endosulfan Katayama and Matsumura
(1993), Siddique et al. (2003)
and Bhalerao and Puranik
(2007)
Alcaligenes sp.; Bacillus sp.;Cyanobacteria; Pseudomonassp.
DDT Katayama et al. (1993),
Megharaj et al. (2002),
Nadeau et al. (1994) and Hay
and Focht (2000)
Agrobacterium radiobacter;Chelatobacterheintzii
Atrazine Struthers et al. (1998) and
Rousseaux et al. (2003)
Ganoderma sp; Mixed Bacte-
rial Consortium
Lindane Rigas et al. (2007) and Bhatt
et al. (2007)
Serratia; Vibrio proteus,Yersinia,
Tetrachlorvinphos Ortiz-Hernandez and
Sanchez-Salinas (2010)
Bacillus sp.; Brucella;Enterobacter Cereus; Klebsi-ella sp.; Pseudomonasaeruginosa; Synechocystis(Cyanobacterium); Serratiamarscecens
Chlorpyrifos Lakshmi et al. (2008, 2009)
and Singh et al. (2004),
(2011)
Burkholderia sp. Fenitrothion Qing et al. (2007)
Sphingomonas sp. 2,4,Dichlorophenoxy acetic
acid
Karin et al. (2010)
PAH
Acinetobacter sp.; Aeromonassp.; A. faecalis;A. denitrificans; A.niger;Arthrobacterpolychromogenes; Agrocybesp.; Bacillus sp.; Beijernickiasp.; C. elegans; Curvulariaturberculata; Curvularialunata; Flavobacteriumgondwanense;Flavobacterium sp.;
Phenanthrene Allen et al. (1999), Aitken
et al. (1998), Moody et al.
(2001), Yamazoe et al.
(2004), Miyata et al. (2004),
Liu et al. (2004), Zhang et al.
(2004a, b), Liu et al. (2004),
Habe and Omori (2003),
Chauhan et al. (2008), Collins
and Dobson (1996), Casillas
et al. (1996), Sutherland et al.
(1993, 1991), Da-Silva et al.
(continued)
12.4 Degradation of Organic Pollutants in Soil 333

Table 12.1 (continued)
Organisms Organic pollutant References
Ganoderma lucidum; Micro-coccus sp.; Mycobacteriumsp.; Microbacterium sp.;
Nocardia sp; Nocardioidessp.; Pseudomonas sp.;P. putida; P. aeruginosa;P. stutzeri; P. chrysosporium;P. sordida; P. ostreatus;Rhodococcus sp.; Rhodotorulaglutinis; Streptomyces sp;S. griseus; Sphingomonas sp.;T. versicolor; Vibrio sp.
(2003), Cerniglia and
Heitkamp (1989) and Wang
et al. (2008)
Aspergillus niger;Acinetobacter calcoaceticus;Bjerkandera adusta;Burkholderia cepacia;Caenorhabditis elegans;Ganoderma lucidum;Gordona sp.; Irpex lacteus;Leclercia adecarboxylata;Mycobacterium sp.; Mycobac-terium gilvum; Mycobacte-rium pyrenivorans;Pseudomonas putida;P. saccharophilia;P. ostreatus; Rhodococcus sp.;Sphingomonas paucimobilis;Stenotrophomonasmaltophilia; Sphingomonassp.
Pyrene Chen and Aitken (1999),
Boldrin et al. (1993), Sharma
et al. (2004), Derz et al.
(2005), Kanaly and
Harayama (2000), Launen
et al. (1995), Bezalel et al.
(1996), Schutzendubel et al.
(1999), Wunder et al. (1997),
Sack and Fritsche (1997),
Boonchan (1998), Boonchan
et al. (2000), Da-Silva et al.
(2003), Vila et al. (2001),
Churchill et al. (1999),
Rehmann et al. (1998), Miller
et al. (2004), Wang et al.
(2008), Byss et al. (2008) and
Valentin et al. (2007)
Bacillus thermoleovorans;Comamonas testosterone;Pseudomonas putida
Naphthalene Habe and Omori (2003);
Chauhan et al. (2008); Musat
et al. (2009); AbuLaban et al.
(2010); Bergmann et al.
(2011); Hoffman et al.
(2005); Annweiler et al.
(2000)
Eisenia fetida Polychlorinated biphenyls;
Phenanthrene, anthracene and
benzo(a)pyrene
Tharakan et al. (2004) and
Contreras-Ramos et al.
(2006)
Dyes
Debaryomyces polymorphus Reactive Black 5 dye Yang et al. (2005)
Trichosporon sp.;Cyberlindera sp.;
Barnettozyma sp.; and
Candida
Reactive Black 5 dye Martorell et al. (2012)
Baker’s yeast Astrazone basic dye Farah et al. (2007)
(continued)
334 12 Remediation and Management of Polluted Sites

detoxify environmental contaminants is considered as a potential alternative tech-
nique for remediation of contaminated soil which is often termed as “Bioremedi-
ation” (Juwarkar et al. 2010; Megharaj et al. 2011). Bioremediation is considered as
a cost-effective remediation approach. Bioremediation process developed from the
emerging concept of green engineering, is defined as the design, commercializa-
tion, and use of biological processes and products that are feasible and economical
while minimizing pollution at the source and risk to human health and the environ-
ment (Kirchhoff 2003). Bioremediation technologies are generally classified as either
in situ or ex situ. In situ technologies involve treating the polluted soil mass at the site,
while ex situ bioremediation involves the excavation of the polluted soil material
followed by its treatment elsewhere. The potential applicable bioremediation
approach/methods are “biostimulation”, “bioaugmentation”, “phytoremediation”
and “rhizoremediation”. The appropriateness of a particular bioremediation technol-
ogy is determined by several factors, such as site characteristics, population of
indigenous microorganism, and charcteristics (type, quantity and toxicity) of pollut-
ant chemical species present.
Biostimulation is the technique applicable to the contaminated sites where the
abundance of intrinsic/native metabolic activity is low due to less favourable
condition and for soils that are not conducive (physical and chemical properties
of soil) for biodegradation. The native microbial metabolic activity and the micro-
bial degradation process may be improved by the biostimulants techniques through
fertilizer nutrients and organic material addition. Since early 1980, compost or
farmyard manure has been applied for remediation of contaminated sites and during
the last few decades, it was found to be very efficient in chlorophenol, triazine
pesticides and PAH contaminated sites (Haggblom and Valo 1985; Valo and
Salkinoja-Salonen 1986; Antizar-Ladislao et al. 2004; Loick et al. 2012; Semple
et al. 2001; Abdelhafid et al. 2000). However in most contaminated soils, the
inherent metabolic potential is too low to be improved by biostimulation alone. In
such scenario, the other bioremediation process “bioaugmentation” plays a major
role in degradation and restoration of organic contaminated soil. Bioaugmentation
is a process to enhance degradation and to facilitate the transformation rate of
xenobiotics through introduction of either native or genetically modified microbes
into soil (Kuiper et al. 2004). Bioaugmentation” has proven capability of degrading
or transforming the chemical pollutants along with amendments, such as activated
Table 12.1 (continued)
Organisms Organic pollutant References
Galactomyces geotrichum Remazol Red, Golden Yellow
HER, Rubine GFL, Scarlet
RR, Methyl Red, Brown
3 REL and Brilliant Blue
Waghmode et al. (2011)
Staphylococcus epidermidis Crystal Violet, Phenol Red,
Malachite Green and Methyl
Green
Ayed et al. (2010)
12.4 Degradation of Organic Pollutants in Soil 335

sludge or compost with the objective to improve degradation and enhance the
transformation rate of organic pollutant in soil (Kuiper et al. 2004).
Bioaugmentation is desirable in those locations that need exogenous microbial
communities or flora to assist degradation of organic contaminants in a polluted
soil (Megharaj et al. 2011). However, the main drawback of bioaugmentation
technique is that the number of exogenous microorganisms decreases shortly with
the passage of time of inoculation on to the site which might be due to contaminants
toxicity, competitiveness and adaptability, relative to the indigenous members of
natural communities (Tomei and Daugulis 2013). Further, the whole live cells,
those have to be introduced for the purpose of bioremediation through
bioaugmentation techniques, needs continuous supply of fresh inoculum, aeration,
and nutritional requirements (Rayu et al. 2012). These limitations have boosted the
use of formulated enzymes rather than whole cells as bioremediation agents, a
process known as “enzymatic bioremediation”. In the literature, several enzymes
have been reported which can potentially degrade wider range of organic contam-
inants (Table.12.2) and found to be a relatively better alternative than the use of live
microbial cell (Torres et al. 2003).
Another technology that provides promising solution for remediation of soil
polluted with organic contaminants is “Phytoremediation”. This is a low cost and
environment friendly technology involving plants which can extract, sequester,
immobilize and/or detoxify contaminants from polluted soil and water (Pilon-
Smits 2005). Phytoremediation works through various mechanisms which include
phytoextraction, phytodegradation, phytovolatilization, phytostabilization and rhi-
zosphere biodegradation. Phytoremediation takes advantages of the specific extrac-
tive and metabolic capabilities of plants (Alagic et al. 2013; van Bohemen and van
de Laak 2003; Caliman et al. 2011; Haritash and Kaushik 2009; Macek et al. 2000;
Prasad 2007). The choice of plant used for phytoremediation of contaminated sites
depends on the physical and chemical characteristics of the contaminants. Several
plants including ryegrass (Ahmad et al. 2012), rice (Tao et al. 2006), zucchini
(Parrish et al. 2006), cauliflower (Tao et al. 2004), poplar (Skaates et al. 2005)
radish (Mikes et al. 2009), pumpkin (Whitfield Åslund et al. 2007), tobacco and
nightshade plants (Vrkoslavova et al. 2010) have been reported to absorb and
accumulate organic pollutants in biomass (Table 12.3). The added advantage of
adopting phytoremediation technology in degraded contaminated sites is increasing
the carbon stocks through plant biomass production and soil carbon sequestration.
Furthermore, this approach is highly acceptable in local community as it causes
minimum site disturbance. However, the technology suffers from some shortcom-
ings/limitations; for example, it may require prolong time (several crop cycles) to
achieve the objective and also may be ineffective in the highly contaminated soil
(high pollutants concentration) due to restrictive crop growth & biomass.
To overcome this limitation, growing plants in conjunction with contaminant
degrading and/or plant growth-promoting rhizobacteria offers much higher poten-
tial for the remediation of contaminated soils (McGuinness and Dowling 2009).
Plant-associated bacteria, such as rhizobacteria (RB) and endophytic bacteria
(EB) have been increasingly investigated for improving remediation of
336 12 Remediation and Management of Polluted Sites

contaminated soil (Germaine et al. 2006; McGuinness and Dowling 2009). Plants
and their associated bacteria interact synergistically with each other, wherein plant
provides carbon source to the bacteria that stimulates their capacity to decompose
organic contaminants in the soil. On the other side, plant root associated-bacteria
can help their host plant to withstand stress related to contaminant-induced phyto-
toxicity (through mineralization of organic pollutants to a less toxic compounds/
element), and thereby support plant growth and development. As different enzymes
are responsible for effective degradation of various organic pollutants (Table 12.2),
consortia of different rhizospheric microorganisms having different enzyme gen-
erating capabilities probably work in a sequential and synergistic order to decom-
pose wide spectrum of contaminants more effectively. This indicates that a
favourable plant–bacteria association can help in reclamation more effectively of
agricultural land contaminated with various types of organic pollutants. Degrada-
tion of several aliphatic hydrocarbons in soil was enhanced with growing of
Table 12.2 Potentially useful enzymes for organic pollutant degradation and their producer
Organisms Enzymes Organic pollutants References
Dehalobacterrestrictus;Desulfitobacteriumhafniense
Perchloroethene (PCE)
reductase
Polychlorinated
biphenyls (PCBs)
Maillard et al. (2003)
Rhizobium tropici;Sphingomonas sp.
Carbazole 1,9a–
dioxygenase 2-Hydroxy-
6-oxo-6-(20-aminophenyl)-
hexadienoate hydrolase
Carbazole, dibenzo-
furan and biphenyl
Saiki et al. (2003)
and Habe et al.
(2002)
Burkholderia sp. Biphenyl dioxygenase Polychlorinated
biphenyls (PCBs)
Zielinski et al. (2003)
Polaromonasvacuolata; Pseudo-monas spp.
Dioxygenase Naphthalene; Jeon et al. 2003
Pseudomonasputida
Monooxygenases;
Dioxygenases
Herbicides triflura-
lin;
Hexachlorobenzene
and
pentachlorobenzene
Singh and Walker
(2006), Scott et al.
(2008) and Riya and
Jagatpati (2012)
Burkholderiaxenovorans
Glutathione-S-transferase Organochloride
pesticide
McGuinness et al.
(2007)
Phanerochaetechrysosporium
laccase, lignin peroxi-
dases and manganese
peroxidases
Phenanthrene,
fluorene,
fluoranthene,
anthracene and
pyrene
Sanglard et al. (1986)
and Gibson and
Subramanian (1984)
Escherichia coli Phosphonatase Organophosphorus
compounds
Singh and Walker
(2006), Scott et al.
(2008) and Riya and
Jagatpati (2012)
12.4 Degradation of Organic Pollutants in Soil 337

ryegrass (Lolium perenne) which had been linked to the increase in microbial
population and their activities in the rhizosphere (Günther et al. 1996).In addition to supply of nutrients (biostimulants), substrates, live cells
(bioaugmentation), enzymes and plants (phyto and rhizoremediation), abiotic
(environmental) factors, including soil physico-chemical properties and seasonal
temperature fluctuations are also important for the degradation of organic contam-
inants in soil. In general, most of the organic contaminants are insoluble in water
and therefore it gets strongly adsorbed to lattice structures in clay or on organic
matrices within the soil particles (Higginson 1993). As a result, degradation process
occurs normally in the organic contaminants-water interface and also with certain
Table 12.3 Potential plant accumulator of organic pollutants
Organic pollutants Plant type References
Phenanthrene, Pyrene Maize Xu et al. (2006)
Pyrene, PAH mixtures Alfalfa Fan et al. (2008) and Pradhan et al. (1998)
Pyrene White Clover Xu et al. (2009)
Phenanthrene, Pyrene Rye grass Goa et al. (2006) and Kang et al. (2010).
Pyrene Anthracene,
Chrysene
Rice Tao et al. (2006)
Phenanthrene, Pyrene Amaranthus Gao and Zhu (2004)
PAH mixtures Cabbage Kipopoulou et al. (1999) and Tao et al. (2004)
PAH mixture Cauliflower Tao et al. (2004)
Atrazine Poplar, Rice,
Salix
Field and Peel (1971a, b, 1972), Nair et al. (1993),
Roche et al. (2009), Shann and Boyle (1994) and
Schnabel and White D. M (2001)
Hexachloro-cyclohex-
ane(HCH)
Oat Pereira et al. (2006)
Chlorpyrifos Ryegrass Ahmad et al. (2012)
Polybrominated
diphenyl ethers
Tobacco Vrkoslavova et al. (2010)
2,4,6 trinitrotoluene,
Phenol
Vetiver grass Makris et al. (2007)
Dibenzofuran Bermuda
grass, White
clover
Wang and Oyaizu (2009)
2,6-dinitrotoluene Arabidopsis
thaliana
Yoon et al. (2007)
POPs Pesticide (DDT
and HCH)
Xanthium
strumarium
Nurzhanova et al. (2010)
Metolachlor Rice Kawahigashi et al. (2006)
2,4-
dichlorophenoxyacetic
Pea Germaine et al. (2006)
Organochlorine pesti-
cide (Dicofol)
Water hyacinth Xia (2008)
Dieldrin; Endrin; Hepta-
chlor; DDT; Chlordane
Cucurbits Otani et al. 2007, Lichtenstein et al. (1965),
Hülster et al. (1994), White et al. (2006), Mattina
et al. (2004) and Lunney et al. (2004)
338 12 Remediation and Management of Polluted Sites

dissolved organic contaminants in water (du Plessis et al. 1994). Contaminant
bioavailability to micro-organisms is one of major factor that determines its per-
sistence or degradation rates in soil. Its bioavailability is governed by both soil
properties (soil pH, cation exchange capacity, organic matter, soil texture, temper-
ature, redox conditions, soil chemical constituents like iron, manganese and alu-
minium oxide content and the presence of other organic compounds) and
contaminant characteristics (chemical structure including size and molecule charge,
vapour pressure, polarity, or hydrophobicity and the age of the contaminants in soil
as well) (Higginson 1993; Reid et al. 2000; Rao et al. 2014; Wen et al. 2012). A
number of studies have indicated that bioavailability for degradation of organic
pollutants, particularly PAHs is reduced due to their adsorption onto soil mineral
particles and organic matter within the micropores and and hence, these are not
readily available for biodegradation. For example, Fu et al. (1994) observed that
30 to 50% of naphthalene, the most water-soluble and bioavailable PAH, resisted
desorption from an Oklahoma soil consisting of 92% sand. Recalcitrance of PAHs
against degradation increases with prolonged aging time, i.e., extended contact time
between the contaminant and the soil particle (Yap et al. 2010). Such aging process
causes the transfer of compounds from accessible fraction of soil to less accessible
ones resulting in reduction of contaminants’ bioavailability for degradation (Reid
et al. 2000). Bioremediation technologies for different groups of organic pollutants
are discussed below.
12.4.1 Degradation of Polycyclic Aromatic Hydrocarbons(PAHs) in Soil
Generally land contaminated with low to moderate level of PAHs does not pose
significant threat to plant. However, direct intake of PAHs may occur through
ingestion (by children), inhalation (of dust), or dermal (skin) exposure to contam-
inated soil/dust during tilling, and grazing (by animals) or through
soil ! water ! animal ! human route causing potential health risk. As PAHs
are highly toxic to human, these require degradation for minimizing the risk of
exposure through above routes. Abiotic degradation of PAHs depends on several
natural factors such as climatic conditions and geographic location as well as
physical and chemical properties of soil. Some of these factors (e.g., temperature,
humidity, pH, organic matter composition) also influence biotic degradation
through their effect on growth of microorganisms (Maliszewska-Kordybach
2009; Smreczak and Maliszewska-Kordybach 2003). Photochemical decomposi-
tion is an important process of the degradation of PAHs in the surface soil layer
(up to 3 mm). Resistance to photochemical decomposition decreases with the
solubility as follows: naphthalene > phenanthrene > chrysene > pyrene > anthra-
cene > benzo[a]pyrene > indeno (1,2,3-cd)pyrene. It was observed that abiotic
decomposition of hydrocarbons increases with increase in intensity of light and
12.4 Degradation of Organic Pollutants in Soil 339

concentration of oxygen (Little et al. 2002). Higher intensity of light may break
aromatic ring structure of PAH compounds and causes further degradation of
formed derivatives.
In the bioremediation process, microbial communities (including bacteria and
fungi) can biologically decompose PAH compounds during metabolic process
using these as substrate for carbon and source of energy or by co-metabolism
while decomposing another organic compound. Individual microorganism isolates
demonstrated a relatively good capacity to degrade PAHs which are more water-
soluble (acenaphthene, fluorene, phenanthrene, fluoranthene). On the other hand,
less water-soluble PAHs (like anthracene and pyrene) were more efficiently
removed by consortia of microbial culture (Pseudomonas putida, Flavobacteriumsp., and Pseudomonas aeruginosa) as compared to isolated cultures (Trzesicka-
Mlynarz and Ward 1995). Biological degradation is dependent upon several abiotic
soil factors, including nutrients, pH, metals, temperature, moisture, salts etc. Deg-
radation of lower molecular weight PAH (upto 3 ring) has been found accelerated
by increasing soil temperature; while level of high molecular weight PAHs were
unaffected by temperature (Coover and Sims 1987). Due to strong interaction with
non-aqueous phases particularly soil organic matter, PAHs become potentially
unavailable for microbial degradation since microorganisms are known to degrade
chemicals mainly in its soluble form. As hydrophobicity of PAHs increases almost
logarithmically with rising molecular mass, biodegradation of high-molecular
weight PAHs having five to seven rings becomes difficult (Johnsena et al. 2005).
The efficiency of PAHs biodegradation is highly related to their solubility in water,
with higher solubility being accounted for their increased accessibility to microor-
ganisms for degradation. Researches have indicated that plants play an important
role in the degradation of hydrocarbon compounds derived from crude oil through
the release of enzymes (dehalogenase, nitroreductase, peroxides, and lactase) from
roots that are able to transform organic pollutants. Several species of grasses such as
Festuca rubra and Lolium planted on soil contaminated with crude oil or diesel oil
had indicated significant degradation of pollutants (Haritash and Kaushik 2009).
While efficiency of degradation in the presence of Festuca rubra and Lolium plants
were more (77% and 92%), the same in absence of these plants ranged between
60% and 74%. Similarly, Liste and Alexander (2000) observed up to 74% removal
of pyrene after 2 months of growing oat, lupin, rape, fennel, parsley, pepper and
pine species on clay soil having 2.5% organic carbon as compared to 40% removal
in the same soil without any plant. From their experiment, Oleszczuk and Baran
(2003) concluded that favourable environment for the growth of microorganisms
(neutral soil pH, optimum soil moisture) and the higher content of nutrient elements
play an important role in the case of degradation of low molecular weight PAHs
(having 3-ring), while the degradation of high molecular weight PAHs (having
higher number of 4 or more rings) is determined by their bioavailability. The high
status of organic matter and clay in soil decline the rate of degradation process. The
goal of biodegradation should be for the process leading to complete mineralization
of PAHs to CO2, water, and other inorganic compounds and C incorporation in
microbial biomass carbon. Unfortunately, biodegradation of PAHs often result in
340 12 Remediation and Management of Polluted Sites

the build-up of metabolites (mainly ketones, quinones, dicarboxylic acid anhy-
drides and coumarins) of the process that can be more toxic and/or more soluble
than the parent compound (Lundstedt 2003). Amending soil with biochar is now-
adays being advocated as a part of strategy to sequester of C in soil (Powlson et al.
2011) in addition to increase in crop yields and to reduce the leaching of nutrients
from soil (Jeffery et al. 2010; Singh et al. 2010). However, as biochar can act both
as source and sink for PAHs, its role in remediation of contaminated soil was also
investigated (Quiliam et al. 2013). Soil amendment with biochar increased the
content of phenanthrene in soil as well as decreased its degradation due to increase
in sorption capacity and consequently reduction in bioavailability. Destruction of
PAH in coal tar contaminated soil was found to be accelarated after pre-treatment
with solvents like acetone and ethanol (Lee et al. 2001).
12.4.2 Degradation of Polychlorinated Biphenyl (PCBs)
Polychlorinated biphenyls are extremely resistant to disintegration because of their
very low solubility in water and the lack of a structural site in these molecules for
enzymatic attack during biodegradation. Studies have demonstrated that PCBs can
be degraded to some extent by augmenting activity of soil microorganisms; how-
ever, biodegradation rate declined with increasing degree of their chlorination
(Correa et al. 2010). Some bacterial groups like β-Proteobacteria and Acidobacteriahave relatively higher capacity for degrading PCBs and these are more abundant in
soil contaminated with PCBs, especially the compounds having higher-chlorinated
congeners (Correa et al. 2010). Root exudates from some photosynthetic plants
species have been found to support the growth of PCB-degrading bacteria in the
rhizosphere (Donnelly et al. 1994; Chekol et al. 2004). This indicates scope of
phyto-remediation as an effective supplementary strategy for their breakdown.
Synergistic interactions between arbuscular mycorrhizal fungus and Rhizobiumimproved phyto-remediation by alfalfa of an agricultural soil contaminated with
PCBs (Teng et al. 2010).
12.4.3 Degradation of Dye Pollutants
Microorganism mediated degradation has been found most promising and low cost
method of remediation of soil contaminated with dye pollutants (McMullan et al.
2001; Keharia and Madamwar 2003; Khehra et al. 2006; Saratale et al. 2010) and
unlike PAHs, their degradation products in most cases has either no or less
phytotoxicity. Polycyclic anthraquinone and triphenylmethane groups of azo-dyes
however, have been found recalcitrant to biodegradation process (Puvaneswari
et al. 2006). Ligninolytic enzymes exuded by white rot fungi have been found to
degrade synthetic dye and other organic pollutants effectively (Pointing 2001). In
12.4 Degradation of Organic Pollutants in Soil 341

an interesting study, a technology was developed for degrading dye-pollutants
while harvesting other benefit to agriculture. Agricultural residues have shown
significant potential for removing dye pollutants from industrial effluent, particu-
larly of textile industry (Adegoke and Bello 2015). These residues may subse-
quently be used as substrate for growing white rot fungi without having any toxicity
effect which consequently degrades the dyes. The spent material can be composted
for using it as soil conditioner for improving soil quality (Nigam et al. 2000).
Carbonaceous adsorbent prepared from carbon slurry waste obtained from fertilizer
industry was found to adsorb dyes more as compared to adsorbents prepared from
steel industry wastes due to higher porosity and appreciable surface area of the
former (Jain et al. 2003).
12.4.4 Degradation of Antibiotics in Soil
Among the abiotic processes of antibiotics degradation, hydrolysis and
photodegradation have been identified as major ways of their disintegration in
soil. However, rate and quantum of degradation depends on the type of antibiotic
compounds as well as on soil chemical condition and management. Hydrolysis
caused degradation of chlortetracycline, but not fenbendazole and sulfapyridine
(Thiele-Bruhn 2003). Numerous antibiotics are susceptible to microbes mediated
(through enzymes) transformation reactions (Thiele-Bruhn 2003; Sarmah et al.
2006). Fixation on the surfaces of soil particles may protect antibiotics from
degradation. Aerobic environment and higher temperature enhance degradation
kinetics in soil (Halling et al. 2003). Photodegradation is limited to surface and
hence, has no significant effect on the overall antibiotics concentration in soils.
However, repeated turning of soil may enhance the photodegradation process.
12.5 Application of Nanotechnology for Remediation
of Polluted Soil
Conventional polluted site remediation technologies are either very costly or very
slow in process which limits the adoptability by their actual users. Recent
researches indicate that nanotechnology can generate effective soil remediation
solution which can save both cost and time of the process involved. Nanotechnol-
ogy has been defined as the use of knowledge on characteristic behaviour and
manipulation of matter at dimensions between approximately 1 and
100 nanometres, where the particles exhibit unique phenomena enabling their
novel applications in different fields. Nanotechnology is being extensively used
by industrial sectors involving semiconductors; computer memory and data storage
technologies; optical and photonic technologies; energy; biotechnology; and health
342 12 Remediation and Management of Polluted Sites

care. There are increasing efforts to use this technology to protect environment
through prevention of pollution, inactivation of pollutants and clean-up of polluted
sites. Remediation methods developed through nanotechnology approach (also
called nanoremediation) involve the use of reactive nanoparticles for conversion,
degradation and detoxification of pollutants. These particles have unique properties
that enable these to reduce electrochemically and transform catalytically to
degrade/convert the pollutants into their non-toxic or less toxic form. There is
substantial reduction in the cost during nanoremediation as this is carried out insitu and hence, there is no need to transport the polluted soil to other places for
treatment and disposal and also there is no need to pump out groundwater for
above-ground treatment.
Several types of nanoscale materials have been explored for remediation, such as
nanoscale zeolites, carbon nanotubes and nanofibers, various bimetallic
nanoparticles (BNPs), and those prepared from metal oxides and titanium dioxide.
Of these, nanoscale zero-valent iron (nZVI) is the most widely used nano-particle
for remediation of polluted water and soil. The nZVI (both in its Fe� form and as Fe2+) is able to reduce chemically the redox sensitive contaminants such as Cr(VI), As
(V), trichloroethane and many other halogenated compounds; and therefore can
immobilise or reduce their availability/mobility (Puls et al. 1999; Kumpiene et al.
2006; Kanel et al. 2006; CLAIRE 2007; Ludwig et al. 2007). These nanoparticles
have also been found to remove chlorine from various organic contaminants at both
laboratory scale and in field tests and reduce their toxicity (Liang et al. 1996; Kim
et al. 2007). In this way, nZVI has been shown to be capable of reducing, transfor-
mation and detoxification of many known pollutants like halogenated methanes,
halogenated ethanes, chlorinated organic solvents and dyes, organochlorine pesti-
cides, and polychlorinated biphenyls (PCBs) etc. at ambient temperatures (Deng
and Hu 2001; Zhang 2003). Due to their smaller size, nanoparticles remain
suspended in solution for longer time. When surface is modified (through coating)
to reduce surface electrostatic forces, mobility of these particles increases consid-
erably within soil matrix (Yirsaw et al. 2016). In this way, surface modified
nanoparticles become a versatile remediation tool suitable for direct injection as a
liquid into the subsurface where contaminants are present. Under laboratory con-
dition, iron oxide nanoparticles (12 nm diameter) removed As almost completely
(99%) through their strong surface binding and subsequent removal using magnetic
field (Rickerby and Morrison 2007). The nZVI has also been found to reduce As
(V) electrochemically to As(III) at quite faster rate at neutral pH (Kanel et al. 2006).
Most of the field application on use of nanoparticles has been demonstrated for
remediation of groundwater contamination with chlorinated organic pollutants. In a
field application, nanoparticles was shown to remain reactive in soil and water for
up to 8 weeks and can flow with the groundwater for >20 m and as a result, these
reduced trichloroethane concentration almost completely within a few days of their
injection (Zhang 2003, 2005). Several remediation technologies make use of the
magnetic properties of certain nanosized iron minerals (e.g. Fe3O4) (Hu et al. 2004).
For example during As decontamination from groundwater, magnetized Fe-oxide
nanoparticles bind As strongly which can subsequently be separated from water by
12.5 Application of Nanotechnology for Remediation of Polluted Soil 343

applying magnetic field (Rickerby and Morrison 2007). Similarly, Cr(VI) was
removed from wastewaters using nanosize magnetite crystals (Hu et al. 2004).
Reports of on-site demonstration of soil remediation are few. This is due to the
fact of limited mobility of nanoparticles with soil matrix. Effectiveness of
nanoparticles in groundwater remediation depends on geologic, hydrogeologic,
and subsurface conditions of the contaminated area. These include chemical and
mineral constituents, macro & micro porosity, hydraulic conductivity of the soil
matrix; groundwater gradient and flow velocity, depth of water table, and geo-
chemical properties of groundwater (e.g., pH, ionic strength, dissolved oxygen,
oxidation-reduction potential, and concentrations of nitrate, nitrite, and sulfate).
Efficiency of nZVI to decrease the mobility and bioavailability of different toxic
elements like Cr, Cu, As and Zn was investigated in a chromated copper arsenate
(CCA)-contaminated soil (Kumpiene et al. 2006). Application of this nanoparticle
decreased mobile/bioavailable As and Cr concentrations considerably, for example,
by 99% and 94% in soil pore water respectively and by 98% and 45%, respectively
in soil leachates. Such drastic reduction in soluble fraction of toxic trace elements
was reflected as decline in their concentration (As by 84% and Cr by 95%) in plant
shoots. This nZVI mediated stabilization technology also reduced microbial toxic-
ity and restored soil enzyme activities. The use of nZVI based soil amendments has
shown encouraging results over relatively long treatment periods and in a different
types of contaminated soils e.g. As-contaminated agricultural soils (Mench et al.
2006) and CCA-contaminated soils (Kumpiene et al. 2006). Use of nZVI and iron
phosphate-based nanomaterials as soil amendments have shown potential to
decrease bioavailability of Cr in soil after electrochemical reduction of Cr(VI) to
Cr(III) and also to decrease bio-accessibility of Cu through strong bonding (Liu and
Zhao 2007; Xu and Zhao 2007). Silicon is known for imparting resistence and for
reducing toxicity of metals in plants (Shi et al. 2005; Tripathi et al. 2015). In a
hydroponic experiment, both Si and Si-nanoparticle have been found to enhance the
As toxicity amelioration in maize by reducing its uptake and oxidative stress
(Tripathi et al. 2016). Effectiveness of Si-nanoparticle (SiO2) was more as com-
pared to Si (applied as Na2SiO2) in reducing uptake of As and in minimizing its
toxicity on growth of maize (Table 12.4).
Nanotechnology application in soil pollution remediation also suffers from
several limitations. Nanoparticles have the tendency to aggregate and settle, or
form mobile nanoclusters within soil matrix, thereby reducing their efficiency of
remediation. Beside self-aggregation, nanoparticles may get attached with
suspended solid depending on the properties of the nanoparticle and chemical
condition of the soil matrix, making them immobile and inactive (Kern et al.
2009). Thus challenge in the successful nanoremediation technology is to maintain
nanoparticles in completely dispersed form within soil pore water.
344 12 Remediation and Management of Polluted Sites

12.6 Integrated management of Polluted Soil
Normally, engineering methods of decontamination and immobilization of pollut-
ants as described above in section 12.1 are recommended for land containing very
high levels of toxic metals, specifically with the immediate objective of preventing
their spread in unpolluted area and in living organisms, and bringing down the threat
within an acceptable level in a short span of time. Further, successful implementa-
tion of these technologies requires involvement/support of government departments
as these involve high cost which may not be affordable by farmers/owners. On the
other hand, agricultural land affected with low to moderate level of pollutants may
require modifications/interventions in the existing soil, crop and input managements
in order to improve and sustain soil quality, crop productivity and produce quality
(Saha et al. 2014). For sustainable agriculture in unpolluted area, agriculturists
advocate combined strategy of managing nutrient, crop, water, soil and land effec-
tively for achieving the objectives of improving soil fertility, water use efficiency,
conservation of soil and water and increasing cropping intensity; and such combined
strategy is commonly termed as ‘Integrated soil management’ (NAAS 2012). In the
context of polluted agricultural land, however, integrated soil management should
additionally address the issues like protection from pollutant build-up, its remedi-
ation and improving soil biological environment. Most often, such management
strategies depend on the following parameters (Saha et al. 2014):
(a) Type of pollutants and their mode of toxicity expression
(b) Contamination level
(c) Purpose of land use during and after remediation process
(d) Soil type (that determine their interaction with pollutants), depth of profile and
topography
(e) Climate of the area
(f) Cropping pattern
(g) Availability of resources
(h) Economics
Inter-relationships among the above soil, crop, and climatic factors as well as
agricultural management technologies are often multifaceted (Fig. 12.1). This
results in complexicity in devising appropriate strategy for combating threats in
polluted soil. The task becomes complicated further because of two reasons: firstly,
ownership of land (and consequently decision making process) lies with farmers’
Table 12.4 Effect of Si-nanoparticle on uptake of As and growth of 15-day old maize seedling
under hydroponic experiment
As level (μM)
As in plant (μg g�1) Growth reduction (%)
Control Si SiNP Control Si SiNP
25 124 110 104 �14 �7 �4
50 272 226 212 �29 �19 �12
Tripathi et al. (2016)
12.6 Integrated management of Polluted Soil 345

and secondly, threat from pollutants is occasionally more to consumers rather than
to the growers of food due to contamination (Saha et al. 2014).
Soils of India vary widely in respect of physical (depth, texture, structure,
compactness etc.), chemical (mineralogical composition, clay type, Fe & Al oxides,
organic matter contents, pH, base-saturation, CEC, soil solution composition,
nutrient availability etc.) and biological properties (microbial population and their
diversity and activity etc.). Such variations in soil properties result in effectiveness
and adoptability of some of the soil management options over others during
remediation process. While in situ soil washing for removal of metal ions may be
expedient in light textured soils (like inceptisol and entisol), these may not be easily
achieved in heavy textured soils (like Vertisol) due to compactness and lower
macroporosity. On the contrary, manipulation of redox potential for reducing
metal toxicity (through precipitation as sulphides) may be easier in latter soil type
due to its slower infiltration capacity. Climatic factors (particularly magnitude and
distribution pattern of rainfall and temperature) also control selection of appropriate
management strategy due to their influence on transformation, mobility and degra-
dation of pollutants in the soil profile. Roles of some of predominant soil and
climatic factors on the processes and management for remediation of polluted soils
are summarized below mentioned in Table 12.5.
12.6.1 Agricultural Operations Influencing Remediationof Polluted Land
Fertilization Fertilizers play two essential role in the management of polluted
agricultural land: (1) enhancing production of food, fodder and other economic
crops, and (2) enhancing removal of metals & metalloids by phytoremediating
Fig. 12.1 Different controllable and uncontrollable factors affecting management of polluted
soils and their inter-relationships (Saha et al. 2014)
346 12 Remediation and Management of Polluted Sites

Table 12.5 Important soil and climatic factors influencing different pedogenic processes and
management strategy for remediation
Properties Process influenced
Effect on pollution process and soil
management
Climate Infiltration and
evapotranspiration
Accumulation of Na, Cl and other mobile
pollutants on the surface. Leaching of salts and
metals down the profile during rainy season.
Available soil moisture Solubility and bioavailability of pollutants and
their uptake by plants
Soil temperature Activity of soil microorganisms, degradation
of organic pollutants, inactivation of inorganic
pollutants (e.g., Cr6+ to Cr3+) (Weber 1972)
Length of growing period of
crops
Phytoremediation potential under rainfed
situations
Geology of
underground
rocks
Groundwater recharge Fractured underground rock formation
enhances rate and magnitude of groundwater
contamination
Land
topography
Runoff, soil erosion Spread of hazards to nearby land and water
bodies
Texture and
structure of soil
Infiltration Contamination of groundwater, removal of
salts from rhizosphere through subsurface
drainage
Aeration Biodegradation of organic pollutants
Compactness Soil pulverization and photochemical degra-
dation of organic pollutants during land
farming.
Depth of soil
profile
Vertical and horizontal
mobility of water
Spread of polluted area due to industrial
effluents
Clay types and
contents
CEC Sink capacity of soils for cationic pollutants,
removal efficiency during decontamination
Organic matter
content
CEC, coordinate complex
formation
Sorption and chelation of heavy metals and
sorption of organic pollutants influencing their
bioavailability
Microbe population and
diversity
Degradation of organic pollutants
Soil reaction Solubility of minerals and
humus, strength of sorption
Expression of heavy metal toxicity, selection
of amendment materials for immobilization
and phytoextraction
Exchangeable
Na
Dispersion of clay, solubili-
zation of humus
Suspended particles carrying contaminated
soil particles during runoff and contaminate
water bodies
Oxides of Fe,
Al
Sorption of anions, soluble
Fe and Al ions,
Sorption and solubility of anionic pollutants
like As, Se, Cr, organic pollutants etc.
Hardness of soil upon dry-
ing (lateritic)
Ease of land farming to degrade organic
pollutants
Saha et al. (2014)
12.6 Integrated management of Polluted Soil 347

crops through higher biomass production. While nutrient management through
fertilizer is desired to enhance mobilization of pollutant elements in case of
phytoremediation, it should not facilitate pollutants transfer to edible part during
growing of food and fodder crops. Application of chloride containing fertilizers like
NH4Cl and muriate of potash (KCl) enhances mobility of the Cd through formation
of soluble CdCln2-n complex and promote crop contamination. Therefore, these
fertilizers should preferably be avoided in Cd contaminated soil for growing food
and fodder crops (Sparrow et al. 1994: Lopez-Chuken et al. 2012). Fertilizers like
ammonium sulfate and monoammonium phosphate lowers the soil pH during their
continuous application and consequently, may increase the availability of metal
pollutants (Levi-Minzi and Petruzzelli 1984; Willaert and Verloo 1992); and hence,
may be avoided in metal/metalloid polluted neutral and calcareous soils for grow-
ing food & fodder crops. Monoammonium phosphate has been found to decrease
soil suspension pH and to increase adsorbed fraction of Cd, while diammonium
phosphate precipitated and fixed the metal particularly in low organic matter
containing soil (Levi-Minzi and Petruzzelli 1984). As adsorbed Cd is considered
more plant available as compared to its precipitated & fixed fractions, the differ-
ential effect of monoammonium phosphate fertilizers on food chain contamination
can be anticipated. Contamination of food crops with arsenic (As) is widely
observed in lower Gangetic plains of India (as discussed elaborately in previous
chapter) and Bangladesh due to irrigation with contaminated groundwater (Meharg
and Rahman 2003, Huq et al. 2006). In such soils, phosphatic fertilizer application
has been found to reduce As contamination in wheat grain (Pigna et al. 2010).
Under puddled cultivation condition, however, P addition suppressed uptake of
arsenate, not arsenite by rice plant which indicate different uptake mechanism
operating for different forms of As species (Abedin et al. 2002). High available
calcium in soils has been found to inhibit accumulation of several heavy metals by
crop (Kurtyka et al. 2008: Suzuki 2005) and hence, frequent application of Ca
containing fertilizers (like SSP, CAN, gypsum) and lime may be advisable for
growng food and fodder crops in non-calcareous soils in high rainfall areas. On the
contrary, acid forming (and Ca lacking) fertilizers application can be an appropriate
strategy during soil clean-up through phytoremediation.
Soil Organic Matter Management Due to its role in maintaining soil fertility and
crop productivity, augmentation and maintenance of organic matter status in
agricultural soil through periodic application of manure is essentially
recommended, particularly in tropical and sub-tropical region of the globe where
rate of C mineralization is quite high (Saha 2002). Application of organic matter
has been recommended for ameliorating polluted soils due to its role in several
chemical, biochemical and biological activities. Availability of heavy metals in
contaminated soil has been found reduced with the application of organic matter
due to their complexation by insoluble humic acids (Walker et al. 2004; Sklodowski
et al. 2006). However, strength of metal complexes with humic acid increases with
increasing pH and decreasing ionic strength (McBride 1994) and therefore, com-
bined application of lime and organic matter may be most effective strategy in
348 12 Remediation and Management of Polluted Sites

reducing/eliminating the adverse impacts (i.e., phytotoxicity and food contamina-
tion) in heavy metal polluted acidic soils. However, in another study, combined
application of organic matter and lime also transformed metals from unavailable to
potentially available pool (organically complexed and amorphous oxides bound);
besides decreasing readily plant available pool (soluble plus exchangeable fraction)
(Saha et al. 1999).
Due to their availability, composts prepared from sewage-sludge and MSW are
widely used as organic matter amendment in agricultural land in nearby areas of
generation. As contents of toxic elements and organic pollutants are generally quite
high in these organic manures, their repeated application is likely to build-up
toxicants in soil beyond permissible levels (Santodonato et al. 1981; Grossi et al.
1998; Saha et al. 2010). However, as contents of Fe-, Al-, Ca-oxides are signifi-
cantly higher in sludge biosolids, expression of toxicity due to their repeated
application may appear later as compared to MSW compost having similar level
of toxic elements (McBride 1995). In order to avoid toxic element build-up in soil
beyond the unsafe level for ecosystem, several countries have put forward regula-
tory guidelines on the use of such contaminated organic amendments in agricultural
land in the form of ‘maximum concentrations of metals allowed in agricultural
soils’, ‘maximum metal concentrations in sewage sludge and MSW compost’,‘annual metal loading limits for agricultural soils’ etc. (McGrath et al. 1994; Düringand Gath 2002). In order to protect agricultural land as well as to harvest benefits
from organic amendment, following scheme has been proposed for utilization of
different quality of MSW composts with variable plant nutrients and heavy metals
contents for different land use systems (Table 12.6).
Organic matter application has also been recommended for amelioration of
agricultural land contaminated with organic pollutants. An integrated soil and
crop management approach involving addition of stable compost, soil pH correc-
tion to near neutral and intensive cropping has been found to enhance the clean-up
of PAH-contaminated soils during in situ remediation (Reilley et al. 1996;
Oleszczuk and Baran 2003; Sayara et al. 2010). Improved biological activity due
to these interventions in the rhizosphere appears to be the reason for such acceler-
ated degradation. High pH and salinity reduces pace of PAHs degradation in saline-
alkali soil and such constraints in amelioration can be reduced by application of
organic matter (Luque~no et al. 2008).
Tillage Operations Methods of tillage (or no tillage) control root proliferation
(hence volume and depth of rhizosphere), aeration, run-off of rainwater and soil
erosion. As all of these processes influence degradation/inactivation of pollutants,
transfer to crop biomass as well as their spread to other areas, type of tillage
practices can be important for the management of polluted soils. Few studies
have indicated role of tillage methods on remediation and management of polluted
soil. Conservation tillage (reduced or no tillage with retention of residue from
previous crop) has been recommended in case of polluted land as it reduces runoff
and soil erosion during high intensity rainfall and thereby, prevents spread of
pollutants to nearby unpolluted area and aquatic life (Holland 2004). Reduced
12.6 Integrated management of Polluted Soil 349
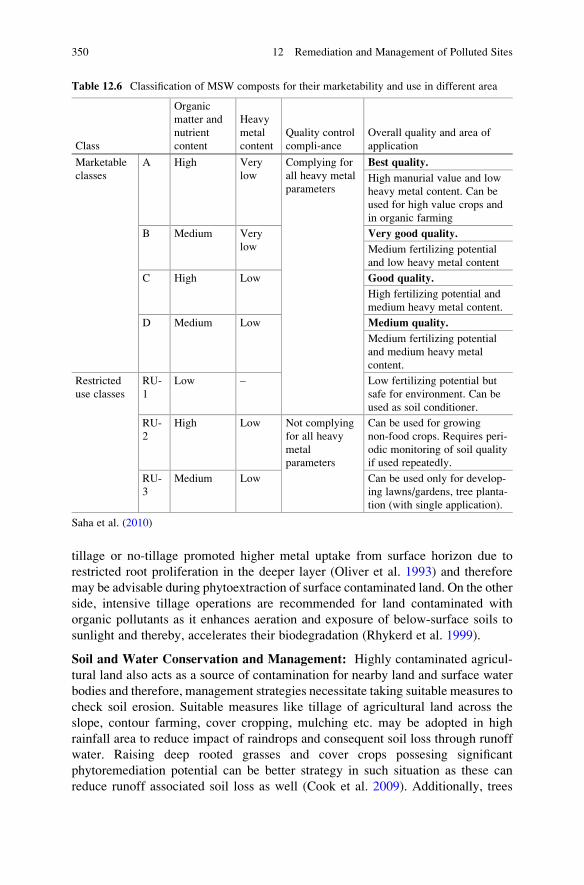
tillage or no-tillage promoted higher metal uptake from surface horizon due to
restricted root proliferation in the deeper layer (Oliver et al. 1993) and therefore
may be advisable during phytoextraction of surface contaminated land. On the other
side, intensive tillage operations are recommended for land contaminated with
organic pollutants as it enhances aeration and exposure of below-surface soils to
sunlight and thereby, accelerates their biodegradation (Rhykerd et al. 1999).
Soil and Water Conservation and Management: Highly contaminated agricul-
tural land also acts as a source of contamination for nearby land and surface water
bodies and therefore, management strategies necessitate taking suitable measures to
check soil erosion. Suitable measures like tillage of agricultural land across the
slope, contour farming, cover cropping, mulching etc. may be adopted in high
rainfall area to reduce impact of raindrops and consequent soil loss through runoff
water. Raising deep rooted grasses and cover crops possesing significant
phytoremediation potential can be better strategy in such situation as these can
reduce runoff associated soil loss as well (Cook et al. 2009). Additionally, trees
Table 12.6 Classification of MSW composts for their marketability and use in different area
Class
Organic
matter and
nutrient
content
Heavy
metal
content
Quality control
compli-ance
Overall quality and area of
application
Marketable
classes
A High Very
low
Complying for
all heavy metal
parameters
Best quality.
High manurial value and low
heavy metal content. Can be
used for high value crops and
in organic farming
B Medium Very
low
Very good quality.
Medium fertilizing potential
and low heavy metal content
C High Low Good quality.
High fertilizing potential and
medium heavy metal content.
D Medium Low Medium quality.
Medium fertilizing potential
and medium heavy metal
content.
Restricted
use classes
RU-
1
Low – Low fertilizing potential but
safe for environment. Can be
used as soil conditioner.
RU-
2
High Low Not complying
for all heavy
metal
parameters
Can be used for growing
non-food crops. Requires peri-
odic monitoring of soil quality
if used repeatedly.
RU-
3
Medium Low Can be used only for develop-
ing lawns/gardens, tree planta-
tion (with single application).
Saha et al. (2010)
350 12 Remediation and Management of Polluted Sites

having phytoremediation potential (like Populus spp. and Salix spp.) may be grown
along with grasses in order to phytostabilize metals in deeper soil layer and prevent
downward metal flux besides preventing soil erosion (Quinn et al. 2001). In arid
region, wind erosion may blow away contaminated soil particles from polluted land
mass and have severe health implications on human and animal populations when
enter the body through respiratory route. Capping of such land with fertile soils and
growing grasses can prevent air pollution with contaminated dust (Vamerali et al.
2010).
Groundwater of the area in and around industrial clusters often records elevated
salinity and use of such water for irrigation is likely to increase osmotic potential in
the rhizosphere causing physiological water stress to crop (Saha 2005; Saha et al.
2014). Moreover, elevated Cl� (normally associated with salinity of the ground-
water) in soil solution due to use of saline water as irrigation may enhance the
mobility and uptake of heavy metals (particularly Cd) in contaminated land (Lo´
pez-Chuken et al. 2012). Therefore, agronomic management approach for culti-
vated lands around the industrial area should stress on enhancing water use effi-
ciency through efficient irrigation methods (like drip, sprinkler) and also on
reducing dependency on groundwater through conservation of rainwater and soil
moisture.
Selection of Crops and Cropping Systems Crops differ widely on their ability to
take up metals and also on ability to combat toxicity from heavy metals &
metalloids through various mechanisms like exclusion, sequestration, metal
homeostasis (Manara 2012). Quantum of threat(s) perceived in the farming of
polluted agricultural land determines the crops species that can be grown. A
relatively lower level of pollution generally poses threat only to the quality of
food and fodder due to contamination with toxic elements/compounds and may not
have adverse impact on crop growth and economic yield (Saha et al. 2013).
Therefore, minimizing their movement to edible part appears to be the appropriate
strategy in such situation. Researches indicate that bio-concentration of toxic
elements is generally the highest in leafy vegetables followed by root vegetables
and minimum in grain crops (Page et al. 1987). Therefore, cultivation of leafy and
root vegetables (like spinach, lettuce, cabbage, potato, radish, beet, coriander etc.)
may not be recommended in soils having elevated levels of metals/metalloids and
cultivation of other crops should only be taken up after ensuring that legislative
requirement for food and fodder quality in respect of toxic elements contents is
complied. In an experiment under controlled condition, various cereals, oilseeds,
sugarcane, and fiber crops showed tolerance to high soil Cd levels (Wang 2002).
While grain of cereal crops got contaminated, edible parts of other crops remained
free from Cd contamination. Even level of metal contamination in grains varied
significantly among crop varieties due to differences in uptake pattern, upward and
basipetal translocation in plant parts (Chan and Hale 2004). This emphasizes the
importance of crop and genotype selection in the contaminated soil and need for
further researches in this direction in view of large pollutants types. Chemical
composition of root exudates and its role on mobilization of nutrients and metals
12.6 Integrated management of Polluted Soil 351

vary widely with crop species (Gleba et al. 1999). As result, crop rotation has also
been found to influence heavy metal mobilization and uptake by plants caused by
residual effect of several organic acids in the root exudates from previous crops
(Nigam et al. 2001). Concentration of Cd in grain was more in wheat grown after
lupins and was the lowest in wheat grown after cereal, particularly under zero-
tillage (Oliver et al. 1993).
Agricultural land severely contaminated with toxic elements requires decontam-
ination as it affects biomass yield of common food crops as well as contaminate the
food-chain. Appropriate cost effective strategy for such land is avoidance of food
and fodder crops cultivation and removal of metals & metalloids by phytoextracting
plants. Several oilseed crops (particularly Brassica sp.), flowering plants, fibre
crops, short duration trees (like eucalyptus, poplar, willow etc.) have exhibited
phyto-remediation potential while generating economic produce during the process
(Broadley et al. 1999; Angelova et al. 2004; Su and Wong 2004; Indoria and Poonia
2006; Lal et al. 2008; Ruttens et al. 2011). Use of metal contaminated land for
growing of crops generating bio-fuel like sugar (sugarcane, sugar beet), starch
(maize, wheat, rice), oil (rapeseed, sunflower, jatropha) can be a feasible option.
Contaminated biomass can be incinerated to reduce the volume for appropriate
disposal or for metal-recovery while generating energy for useful purpose. It has
been estimated that cultivation of maize could produce 33,000–46,000 kWh of
renewable energy (electrical and thermal) per hectare per year (Meers et al. 2010).
Hence this plant can be grown in moderately contaminated soil as its
phytoremediation potential is low. Hemp (Cannabis sativa), flax (Linumusitatissimum) and peanut (Arachis hypogaea) were also found appropriate for
both biodiesel production as well as for phytoextraction of Cd from contaminated
land (Shi and Cai 2009). Biomass residues after biodiesel/bioethanol production
can further be incinerated for energy production with consequent reduction in
volume for disposal of hazardous waste (ash) (Saha et al. 2014).
Management of Soil Contaminated with Organic Pollutants Degradability of
organic pollutants depends primarily on their physical and chemical properties,
concentration level, bioavailability (mostly solubility in aqueous phase) and activ-
ity of microorganisms (both general and specific) in soil. Although cost effective
and environment friendly, degradation technologies of organic pollutants depend
mostly on microorganisms. Indigenous microflora may not be effective for degra-
dation of toxic and recalcitrant types of pollutants. Under such situation,
bio-augmentation with single microorganism or consortia of several microorgan-
isms capable of degrading target pollutant is found more effective (Diez 2010). As
bioavailability of organic pollutants is desirable for their degradation, application of
organic manure may be ineffective during degradation of hydrophobic compounds
due to their sorption on SOM causing diminished solubility (Neumann et al. 2014).
On the other hand, compost or manure application may be a highly effective in soils
with low organic matter contents for degrading relatively soluble simple hydrocar-
bons and 2–3 ring aromatic hydrocarbons as it provides substrate for microbial
proliferation and hence accelerates degradation rate (Bosma et al. 1997). Neutral to
352 12 Remediation and Management of Polluted Sites

slightly alkaline pH, abundance of electron acceptors (like O2, nitrate, Mn and Fe
oxides), optimum level aeration and moisture, and moderate temperature usually
favors microbial growth, and consequently contaminant degradation. An integrated
remediation strategy involving physical (volatilization), photochemical and micro-
bial methods of remediation, along with phyto-remediation has been found superior
in degrading 16 priority PAHs in soil over individual techniques (Huang et al.
2004). The techniques applied in this integrated approach for soil remediation were
land-farming (promoting aeration and exposure to sunlight through repeated till-
age), bioaugmentation (inoculating soil with contaminant degrading bacteria and
plant growth promoting rhizobacteria, PGPR), and growing contaminant tolerant
plant (Festuca arundinacea). The investigators used strains of PGPR to enhance
plant tolerance to contaminants and to accelerate plant growth in heavily contam-
inated soils. Fertilization and clipping of above-ground biomass were also found to
enhance degradation of PAHs due to enhanced root turn-over and rhizosphere
activity (Olson et al. 2008).
12.7 Examples of Major Soil Remediation Projects
12.7.1 Homebush Bay, New South Wales, Australia
Homebush Bay and the adjacent land area were heavily contaminated due to
decades of industrial activity with various organic contaminants, including Persis-
tent Organic Pollutants (POPs), such as DDT and dioxins. Other contaminants
included phthalates, polycyclic aromatic hydrocarbons, and heavy metals. As a
result, fishes from this area were found unsafe for human consumption and subse-
quently fishing was banned. Remediation from 2008–2010 removed about 75% of
the dioxin from the bay. Due to persistent nature of the contaminants and their
capability to transfer in the marine environment by natural pathways, removal of
soil and sediments and their treatment were selected as part of remediation strategy.
The remediation method involved dredging of about upper 50 cm layer of sediment
from the bay and subjecting the removed material to thermal treatment to decom-
pose the POPs entirely. A clean shale cap was then placed into the dredged area.
12.7.2 Zinc Smelter-Contaminated Sites at Palmerton, USA
Zinc smelting operations for about a century dispersed heavy metals throughout the
adjoining area in Palmerton (Pennsylvania). This caused build-up of high metal
concentrations in soil which resulted in ecosystem collapse and prevented any
vegetation to grow across a 3000 acre area. Such loss of vegetation increased
erosion of the contaminated soil particles to further contaminate surface and
12.7 Examples of Major Soil Remediation Projects 353

groundwater bodies (Anderson et al. 1980). Because extensive land area had been
so contaminated, it had become difficult and impossible to approach for removal
and replacement of contaminated soils, especially when high slopes are involved.
Major approach in the remediation process was in situ immobilization of heavy
metals in the soil so that contaminants do not spread in the surrounding land and
water bodies and such heavy metals inactivation/immobilization was done by
adding amendment materials and through phytostabilization. The main objectives
of in situ inactivation and phytostablization were: (a) to transform the trace element
speciation for the purpose of reducing its mobility in soil; (b) to minimize soil
erosion through establishing vegetation cover; and (c) to limit uptake of trace
element by food & fodder crops; (c) to minimize the direct exposure of living
organisms to the contaminated soil; and (d) to improve biodiversity. Biosolid
compost was used as amendment which reduced soluble Zn and Cd concentrations
in soil considerably and ameliorated phytotoxicity. Significant increase pH and
levels of organic matter, Fe-oxides, and phosphate in soil due to application of
biosolid-compost were ascribed as the reasons for decreased bioavailability of
metals which led to the overall success of vegetation establishment, particularly
turf-grasses in the highly contaminated area (Li et al. 2000). The combined strategy
of the metal inactivation and subsequent phytorestoration not only resulted in the
restoring of normal ecosystem functions but also subsequently minimized lateral
spread of trace elements through wind erosion, as well as contamination of surface
and groundwater. Vegetation establishment was not aimed to clean-up of contam-
inated soil, but for stabilizing (inactivating) trace elements which are potentially
toxic. Mushroom compost, agricultural lime, coal fly/bottom ash from thermal
power plant, fertilizers and seed mixtures were the other soil amendments used
for metal immobilization and phytostabilization during reclamation of highly
contaminated land of Palmerton area.
12.7.3 Love Canal at New York, USA
Love Canal is one of the most widely discussed environmental tragedies in Amer-
ican history, where several toxic organic pollutants (dioxin was major compound
identified) released into environment due corrosion of containers containing wastes
from chemical factory buried in the landfill site. After diagnosing the release of
toxic chemicals in the land and air, the area was evacuated for remediation purpose.
The landfill area was covered and fenced; and a leachate treatment plant was
constructed. A system was installed to collect leachate from the site. In order to
contain hazards from landfill site, a barrier drain was constructed; a leachate
collection system was installed and the site was covered with a synthetic material
to prevent rain from coming into contact with the buried wastes. Contaminated
sediments and soils were removed from sewers and creeks and were subjected to
thermal treatment to remove the pollutants. The waste materials and leachates
collected were also subjected to thermal treatment/incineration and
354 12 Remediation and Management of Polluted Sites

non-hazardous residues from the incineration process was subsequently disposed
on-site.
12.7.4 Phytoremediation of Metal Mined Soils
Mining activities generate a large volume of waste rocks and tailings, and result in
huge loss of land area under forest, cultivation and grazing, and induce trace
element pollution of soils. In heavily contaminated soils of a large area, removal
of these elements through phyextraction would require an unrealistic time period.
The recommended practice is to revegetate the land with drought resistant, fast-
growing plants, which can reduce metal bioavailability and mobility so as to protect
food chain and underground water from contamination. Vetiver grass (Vetiveriazizanioides) was successfully used for revegetating tailings from Pb/Zn mine in
South China (Shu et al. 2000). Vetiver grass performed better as compared to other
three grass species, namely Paspalum notatum, Cynodon dactylon and Imperatacyclindrica in terms of biomass production and land coverage. This plant had also
been found suitable for the treatment of landfill leachate as well as for the rehabil-
itation of metal contaminated soils in Queens land, Australia (Truong and Baker
1988). Suitability of vetiver grass for phytoremediation has been due to its several
unique characteristics. It has been found much tolerant to extreme ecological
conditions including prolonged drought, submergence, flood, extreme variations
of atmospheric temperature (�10 to 48 �C) and soil chemical environment (soil
pH 3 to 10.5). Also the plant has massive, finely structured and deep root system
capable of reaching 3–4 m within short time. The plant is also highly tolerant to
heavy metal (such as As, Cd, Cr, Ni, Pb, Zn, Hg, Se and Cu) toxicities in the soil.
Due to such unique morphological and physiological characteristics, it has gener-
ally been known for its effectiveness in erosion and sediment control which is
highly desirable in rehabilitating polluted mining area.
12.7.5 Phytoremediation of Soil Cd Contamination in Japan
A survey conducted by the Ministry of Agriculture, Forestry, and Fisheries of Japan
Government on Cd contamination in rice indicated that 3.3% and 0.3% of rice
cultivated in Japan exceeded the limits of 0.2 mg kg�1 or 0.4 mg kg�1 respectively,
normally identified as international standards for polished rice (MAFF 2002). As
rice is the largest source of dietary intake of Cd for the people in Japan, pressing
need to reduce the Cd concentration in rice was felt through phytoremediation.
Cadmium contamination level were low to moderate in paddy fields of major
targeted areas which were suspected to be producing paddy rice or upland rice
contaminated with Cd. Researchers found that some of the indica-japonica cross
12.7 Examples of Major Soil Remediation Projects 355

varieties cultivated under upland conditions accumulated a substantially high
concentration of Cd in grains and shoots (Ishikawa 2005).
Uptake of Cd by several rice varieties was compared with Brassica juncea as it isthe most popular cultivated plant considered for phytoremediation purpose. Shoot
Cd concentration in rice varieties was 2 to 4 times higher than in B. juncea grown intwo types of Cd-polluted soils; whereas, Cd uptake in the shoots of rice varieties
was approximately 6 times higher than those of B. juncea. A field experiment was
conducted in a paddy field with moderate level of Cd contamination (@2.5 mg kg�1),
the results of which showed high removal efficiency of Cd (about 190 g ha�1) by high
yielding rice cultivar Milyang 23. A notable decrease in Cd content in the rhizosphere
was found after harvesting this high Cd-accumulating rice variety. A computational
analysis indicated that repeated cultivation of ‘Milyang 23’ rice cultivar for 3–4 yearscan reduce Cd concentration of contaminated soil (having 0.7 mg kg�1) to a level of
uncontaminated soil (containing 0.3 mg kg�1).
12.7.6 Phytoremediation of Arsenic (As) ContaminatedPaddy Soils
Accumulation of As in paddy soils is an extensive problem in southeast Asia, most
predominantly in India and Bangladesh due to irrigation of lowland rice field with
As-laden (geogenic source) groundwater. Phytoremediation with Pteris vittata(Chinese brake fern) has been found to markedly reduce (18–83% decrease) As
accumulation in rice (Ye et al. 2011). Total As removal from the soils by this plant
was relatively small (only 3.5–11.4%) as compared to the total amount of As in the
soils. However, highly mobile pools like phosphate-extractable As and soil pore-
water soluble As (mainly as As[V]) decreased considerably by 11–38% and
18–77% respectively. Therefore P. vittata removed mainly bioavailable fraction
of As from the soil, which resulted in considerable decreases in its accumulation by
subsequent rice crop. Phytoremediation with P. vittata also influenced As specia-
tion in rice grain (Ye et al. 2011). Rice grains produced from four of unremediated
soils contained As predominantly as dimethylarsinic acid (DMA), which happened
to be a minor species or undetectable after phytoremediation. Growing P. vittatadecreased inorganic As concentration in the bioavailable pool (in soil solution)
which subsequently decreased methylation of As by soil microbes resulting in
decreased DMA in rice grain. Methylated pentavalent form of arsenic (DMA)
may be reduced to trivalent oxidation state (methyloxoarsine and dimethylarsine)
and such trivalent methylated As species are extremely toxic. Therefore the study
indicated high potential of phytoextraction technology using P. vittata in reducing
both magnitude of contamination and toxicity of As in food chain in affected areas
of southeast Asia.
356 12 Remediation and Management of Polluted Sites

12.7.7 Remediation of Radionuclides Contaminated LandNear Chernobyl, Russia
Chernobyl disaster is considered as worst nuclear power plant disaster in history in
which large amount of radionuclides were released into environment. In the first
weeks after the accident at Chernobyl in erstwhile USSR in April 26, 1986, major
concern was lowering 131I-activity concentrations in milk, or preventing contami-
nated milk entering into the food-chain (IAEA 2005). In this direction, main effort
was to feed animals with “clean” fodder, because this had the potential to reduce 137
Cs in cattle (and hence in milk) to acceptable levels within 1–2 months. Restriction
was imposed on agricultural activity and keeping dairy cattle in the severely
affected regions (Schimmack et al. 1989). Severely contaminated land was banned
for cultivation of food and fodder crops during the growing period in the year 1986.
For less heavily contaminated land, appropriate recommendations on soil and crop
management practices were developed as suitable countermeasures against radio-
nuclide transfer in the food chain through on-going activity (Fesenko et al. 2007).
Harvesting of forage and food crops was delayed in order to lessen the impact of
contamination levels in food chain and human health. During survey on agricultural
products for radionuclides, samples from four provinces of Russia, five provinces of
Ukraine and three provinces of Belarus exceeded action levels for radioactive
caesium by the end of 1986. Further, 101,285 ha of agricultural lands in Ukraine
were also withdrawn from cultivation in the early 1990s as about 30% of this area
showed 137Cs-contamination level more than 555 kBq m�2 (Kimura et al. 2015).
Ex-situ decontamination of the top soil layer was not found feasible for agricul-
tural lands due to high cost of the technology, vast area of contamination, antici-
pated damage to the soil fertility and severe anticipated ecological troubles related
to disposal of the contaminated soil. Therefore, the focus during the first few years
after the accident was on modification in the soil and agronomic management
practices including greatly increased fertilization rates. Generally, high value
legume and cereal grasses were grown on the treated land. As most plant roots
absorb contaminants from upper soil layers along with their nutrients, deep
ploughing was recommended for the purpose of diluting the degree radioactive
contamination in the rhizosphere (IAEA 2005). The use of fertilizers increased crop
biomass production, thereby diluting the radioactivity in the edible part. Further,
the use of fertilizers reduced plant-root uptake of 137Cs by decreasing the Cs:K ratio
in the soil solution (Alexakhin 1993). Acidic soils were limed to reduce
phytoavailability of radioactive metals. Marshy lands were converted into grassland
after draining, deep ploughing, amending the land to improve fertility (IAEA 2005).
Traditional surface improvement involving soil discing, fertilization and surface
liming was however, less effective in this case. During nineties, focus was more on
site-specific technology based on soil characteristics to ascertain that the soil
treatment and management used be the most effective under the prevailing condi-
tions. Several investigations have shown that the reduction factors attained for soil-
plant transfer of radioactive caesium following alteration in soil tillage, liming,
12.7 Examples of Major Soil Remediation Projects 357

fertilization and crop management were in the range of 2–4 for less fertile sandy
soils and 3–6 for more organic soils (IAEA 2005). Despite these countermeasures,
radioactive caesium contamination in 20% of grasses and hay samples from farms
during 1997–2000 exceeded the permissible levels in the highly contaminated
south-western zone. Fodder crops, such as lupine, peas, buckwheat and clover
were completely or partly debarred from cultivation as these crops were found to
accumulate high amounts of radioactive caesium. In Belarus, less radionuclide
accumulating varieties of rape seed were grown with additional fertilizers and
lime in contaminated areas with the aim of producing less contaminated (with
radio-caesium and radio-strontium) edible oil and protein cake (for animal).
References
Abdelhafid R, Houot S, Barriuso E (2000) Dependence of atrazine degradationon C and N
availability in adapted and non-adapted soils. Soil Biol Biochem 32:389–401
Abedin MJ, Feldmann J, Meharg AA (2002) Uptake kinetics of arsenic species in rice plants. Plant
Physiol 128:1120–1128
Abu Laban N, Selesi D, Rattei T, Tischler P, Meckenstock RU (2010) Identification of enzymes
involved in anaerobic benzene degradation by a strictly anaerobic iron-reducing enrichment
culture. Environ Microbiol 12:2783–2796
Adegoke KA, Bello OS (2015) Dye sequestration using agricultural wastes as adsorbents. Water
Resour Ind 12:8–24
Ahmad F, Iqbal S, Anwar S et al (2012) Enhanced remediation of chlorpyrifos from soil using
ryegrass (Lollium multiflorum) and chlorpyrifos-degrading bacterium Bacillus pumilus C2A1.J Hazard Mater 237–238:110–115
Aitken MD, Stringfellow WT, Nagel RD et al (1998) Characteristics of phenanthrene-degrading
bacteria isolated from soils contaminated with polycyclic aromatic hydrocarbons. Can J
Microbiol 44:743–752
Alagic SC, Serbula SS, Tosic SB et al (2013) Bioaccumulation of arsenic and cadmium in birch
and lime from the Bor Region. Arch Environ Contam Toxicol 65(4):671–682
Al-Awadhi N, Al-Daher R, El-Nawawy A, Balba MT (1996) Bioremediation of oil-contaminated
soil in Kuwait. I. Landfarming to remediate oil-contaminated soil. J Soil Contam 5:243–260
Alexakhin RM (1993) Countermeasures in agricultural production as an effective means of
mitigating the radiological consequences of the Chernobyl accident. Sci Total Environ
137:9–20
Allen CCR, Boyd DR, Hempenstall F et al (1999) Contrasting effects of nonionic surfactant on the
biotransformation of polycyclic aromatic hydrocarbons to cis-dihydrodiols by soil bacteria.
Appl Environ Microbiol 65:1335–1339
Anderson AM, Johnson AH, Siccama TG (1980) Levels of lead copper, and zinc in the forest floor
of the northeastern United Stated. J Environ Qual 9:293–296
Angelova V, Ivanova R et al (2004) Bio-accumulation and distribution of heavy metals in fibre
crops (flax, cotton and hemp). Ind Crop Prod 19:197–205
Annweiler E, Richnow HH, Antranikian G et al (2000) Naphthalene degradation and incorporation
of naphthalene-derived carbon into biomass by the thermophile Bacillus thermoleovorans.Appl Environ Microbiol 66:518–523
Antizar-Ladislao B, Lopez-Real JM, Beck AJ (2004) Bioremediation of polycyclic aromatic
hydrocarbons (PAH)-contaminated waste using Composting strategies. Crit Rev Environ Sci
Technol 34:249–289
358 12 Remediation and Management of Polluted Sites

Ayed L, Chaieb K, Cheref A, Bakhrouf A (2010) Biodegradation and decolorization of triphenyl
methane dyes by Staphylococcus epidermidis. Desalination 260:137–146
Baczynski TP, Grotenhuis T, Knipscheer P (2004) The dechlorination of cyclodiene pesticides by
methanogenic granular sludge. Chemosphere 55:653–659
Bergaya F, Barrault J (1990) Mixed Al-Fe pillard laponites preparation, characterization and their
catalytic properties in syngas conversion. In: Mitchell LV (ed) Pillard layered structures.
current trends and applications. Elsevier Applied Science, London, pp 167–184
Bergmann F, Selesi D, Weinmaier T et al (2011) Genomic insights into the metabolic potential of
the polycyclic aromatic hydrocarbon degrading sulfate-reducing Delta proteobacterium N47.
Environ Microbiol 13:1125–1137
Bezalel Y, Hadar P, Fu P et al (1996) Initial oxidation products in the metabolism of pyrene,
anthracene, fluorene, and dibenzothiophene by the white rot fungus Pleurotus ostreatus. ApplEnviron Microbiol 62(7):2554–2559
Bhalerao TS, Puranik PR (2007) Biodegradation of organochlorine pesticide, endosulfan, by a
fungal soil isolate, Aspergillus niger. Int Biodeterior Biodegrad 59:315–321
Bhatt P, Suresh Kumar M, Chakrabarti T (2007) Assessment of bioremediation possibilities of
technical grade hexachlorocyclohexane (tech-HCH) contaminated soils. J Hazard Mat
143:349–353
Bissen M, Frimmel FH (2003) Arsenic – a review. Part I: occurrence, toxicity, speciation,
mobility. Acta Hydrochim Hydrobiol 31(1):9–18
Bolan N, Kunhikrishnan A, Thangarajan R et al (2014) Remediation of heavy metal(loid)s
contaminated soils – to mobilize or to immobilize? J Hazard Mater 266:141–166
Boldrin B, Andreas T, Fritzche C (1993) Degradation of phenanthrene, fluorene, fluoranthene and
pyrene by a Mycobacterium spp. Appl Environ Microbiol 59:1927–1930
Boonchan S (1998) Biodegradation of polycyclic aromatic hydrocarbons: application of fungal–
bacterial coculture sand surfactants. Dissertation, Victoria University of Technology, Mel-
bourne Victoria
Boonchan S, Britz ML, Stanley GA (2000) Degradation and mineralization of high-molecular-
weight polycyclic aromatic hydrocarbons by defined fungal bacterial cocultures. Appl Environ
Microbiol 66:1007–1019
Bosma TNP, Middeldorp PJM, Schraa G et al (1997) Mass transfer limitation of biotransforma-
tion: quantifying bioavailability. Environ Sci Technol 31:248–252
Broadley MR, Willey NJ et al (1999) A method to assess taxonomic variation in shoot caesium
concentration among flowering plants. Environ Pollut 106:341–349
Burlakovs J, Klavins M, Karklina A (2012) Remediation of soil contamination with heavy metals
by using zeolite and humic acid additives. Latv J Chem 4:336–341
Byss M, Elhottov´ac D, Tˇr´ıskab J, Baldriand P (2008) Fungal bioremediation of the creosote-
contaminated soil: Influence of Pleurotus ostreatus and Irpex lacteus on polycyclic aromatic
hydrocarbons removal and soil microbial community composition in the laboratory-scale
study. Chemosphere 73:1518–1523
Caliman FA, Robu BM, Smaranda C et al (2011) Soil and groundwater cleanup: benefits and limits
of emerging technologies. Clean Techn Environ Policy 13:241–268
Casillas RP, Crow SA, Heinze TM et al (1996) Initial oxidation and subsequent conjugative
metabolites produced during the metabolism of phenanthrene by fungi. J Ind Microbiol
16:205–215
Cerniglia CE, Heitkamp MA (1989) Microbial degradation of polycyclic aromatic hydrocarbons
(PAH) in the aquatic environment. In: Varanasi U (ed) Metabolism of polycyclic aromatic
hydrocarbon in aquatic environment. CRC Press Inc., Boca Raton, pp 41–68
Chan DY, Hale BA (2004) Differential accumulation of Cd in durum wheat cultivars: uptake and
retranslocation as sources of variation. J Exp Bot 55:2571–2579
Chauhan A, Fazlurrahman, Oakeshott JG, Jain RK (2008) Bacterial metabolism of polycyclic
aromatic hydrocarbons: strategies for bioremediation. J Ind Microbiol 48:95–113
References 359

Chekol T, Vough LR et al (2004) Phytoremediation of polychlorinated biphenyl-contaminated
soils: the rhizosphere effect. Environ Int 30:799–804
Chen SH, Aitken MD (1999) Salicylate stimulates the degradation of high molecular weight
polycyclic aromatic hydrocarbons by Pseudomonas saccharophila P15. Environ Sci Technol
33:435–439
Chlopecka A, Adriano DC (1996) Mimicked in situ stabilization of metals in a cropped soil:
bioavailability and chemical form of zinc. Environ Sci Technol 30:3294–3303
Chlopecka A, Adriano DC (1997) Inactivation of metals in polluted soils using natural zeolite and
apatite. In: Iskandar IK, Hardy SE, Chang AC, Pierzynski GM (eds) Proceeding of extended
abstracts 4th international conference biogeochemistry of trace elements. Berkeley, USA, pp
415–416
Churchill SA, Harper JP, Churchill PF (1999) Isolation and characterization of a Mycobacteriumspecies capable of degrading three- and four-ring aromatic and aliphatic hydrocarbons. Appl
Environ Microbiol 65:549–552
CLAIRE (2007) Treatment of chromium contamination and chromium ore processing residue.
Technical Bulletin TB14. Available at: http://www.claire.co.uk/component/phocadownload/
category/17-technical-bulletins?download¼55:technicalbulletin14. Accessed 17 Sept 2016
Collins PJ, Dobson ADW (1996) Oxidation of fluorene and phenanthrene by Mn(II) dependent
peroxidase activity in whole cultures of Trametes (coriolus) versicolor. Biotechnol Lett
18:801–804
Contreras-Ramos SM, Alvarez-Bernal D, Dendooven L (2006) Eisenia foetida increased removal
of polycyclic aromatic hydrocarbons (PAHs) from soil. Environ Pollut 141:396–401
Cook LL, Inouye RS et al (2009) Evaluation of four grasses for use in phytoremediation of
Cs-contaminated arid land soil. Plant Soil 324:169–184
Coover MP, Sims RC (1987) The effect of temperature on polycyclic aromatic hydrocarbon
persistence in an unacclimated agricultural soil. J Hazard Mater 4:69–82
Correa PA, Lin L et al (2010) The Effects of Individual PCB Congeners on the soil bacterial
community structure and the abundance of biphenyl dioxygenase genes. Environ Int
36:901–906
Coumar MV, Parihar RS, Dwivedi AK et al (2016a) Pigeon pea biochar as a soil amendment to
repress copper mobility in soil and its uptake by spinach. Bioresources 11:1585–1595
Coumar MV, Parihar RS, Dwivedi AK et al (2016b) Impact of pigeon pea biochar on cadmium
mobility in soil and transfer rate to leafy vegetable spinach. Environ Monit Assess 188:31–31
Da-Silva M, Cerniglia CE, Pothuluri JV et al (2003) Screening filamentous fungi isolated from
estuarine sediments for the ability to oxidise polycyclic aromatic hydrocarbons. World J
Microbiol Biotechnol 19:399–405
Deng B, Hu S (2001) Reductive dechlorination of chlorinated solvents on zerovalent iron surfaces.
In: Smith JA, Burns SE (eds) Physicochemical groundwater remediation. Kluwer Academic,
New York, pp 139–159
Derz K, Klinner U, Schupan I et al (2005) Mycobacterium pyrenivorans sp. nov., a novel
polycyclic-aromatic hydrocarbon-degrading species. Int J Syst Evol Microbiol 54:2313–2317
Diez MC (2010) Biological aspects involved in the degradation of organic pollutants. J Soil Sci
Plant Nutr 10:244–267
Donnelly PK, Hegde RS, Fletcher JS (1994) Growth of PCB-degrading bacteria on compounds
from photosynthetic plants. Chemosphere 28:981–988
du Plessis CA, Senior E, Hughes JC (1994) The physical-chemical approach to organic pollutant
attenuation in soil. In: Hinchee R, Anderson DB, Blaine Metting F Jr., Sayles GD (eds) Applied
biotechnology for site remediation. Second international symposium on In situ and on-site
bioreclamation, San Diego, April 1993
Düring R, Gath S (2002) Utilization of municipal organic wastes in agriculture: where do we stand,
where will we go? J Plant Nutr Soil Sci 165:544–556
Dushenkov V, Kumar PBAN,Motto H, Raskin I (1995) Rhizofiltration: the use of plants to remove
heavy metals from aqueous streams. Environ Sci Technol 29(5):1239–1245
360 12 Remediation and Management of Polluted Sites

Fan S, Li P, Gong Z et al (2008) Promotion of pyrene degradation in rhizosphere of alfalfa
(Medicago sativa L.) Chemosphere 71:1593–1598
Farah JY, El-Gendy NS, Farahat LA (2007) Biosorption of Astrazone Blue basic dye from an
aqueous solution using dried biomass of Baker’s yeast. J Hazard Mater 148:402–408
Fesenko SV, Alexakhin RM, Balonov MI et al (2007) An extended critical review of twenty years
of countermeasures used in agriculture after the Chernobyl accident. Sci Total Environ
383:1–24
Field RJ, Peel AJ (1971a) The metabolism and radial movement of growth regulators and
herbicides in willow stems. New Phytol 70:743–749
Field RJ, Peel AJ (1971b) The movement of growth regulators and herbicides into the sieve
elements of willow. New Phytol 70:997–1003
Field RJ, Peel AJ (1972) The longitudinal mobility of growth regulators and herbicides in sieve
tubes of willow. New Phytol 71:249–254
Friesl W, Lombi E, Horak O, Wenzel WW (2003) Immobilization of heavy metals in soils using
inorganic amendments in a greenhouse study. J Plant Nutr Soil Sci 166:191–196
Fu G, Kan AT, Tomson M (1994) Adsorption and desorption hysteresis of PAHs in surface
sediment. Environ Toxicol Chem 13:1559–1567
Gao Y, Zhu L (2004) Plant uptake, accumulation and translocation of phenanthrene and pyrene in
soils. Chemosphere 55:1169–1178
Gao Y, Ling W, Wong MH (2006) Plant-accelerated dissipation of phenanthrene and pyrene from
water in the presence of a nonionic-surfactant. Chemosphere 63:1560–1567
Garau G, Castaldi P, Santona L et al (2007) Influence of red mud, zeolite and lime on heavy metal
immobilization, culturable heterotrophic microbial populations and enzyme activities in a
contaminated soil. Geoderma 142:47–57
Germaine KJ, Liu X, Cabellos GG et al (2006) Bacterial endophyte-enhanced phytoremediation of
the organochlorine herbicide 2, 4-dichlorophenoxyacetic acid. FEMS Microbiol Ecol
57:302–310
Gibson DT, Subramanian V (1984) Microbial degradation of aromatic hydrocarbons. In: Gibson
DT (ed) Microbial degradation of organic compounds. Marcel Dekker, New York, pp 181–252
Gleba D, Borisjuk NV, Borisjuk LG et al (1999) Use of plant roots for phytoremediation and
molecular farming. PNAS 96:5973–5977
Gray CW, Dunham SJ, Dennis PG et al (2006) Field evaluation of in situ remediation of a heavy
metal contaminated soil using lime and red-mud. Environ Pollut 142:530–539
Grossi G, Lichtig J et al (1998) PCDD/F, PCB, and PAH content of Brazilian compost.
Chemosphere 37:2153–2160
Günther T, Dornberger U, Fritsche W (1996) Effects of ryegrass on biodegradation of hydrocar-
bons in soil. Chemosphere 33:203–215
Habe H, Omori T (2003) Genetics of polycyclic aromatic hydrocarbon degradation by diverse
aerobic bacteria. Biosci Biotechnol Biochem 67:225–243
Habe H, Ashikawa Y, Saiki Y et al (2002) Sphingomonas sp. strain KA1, carrying a carbazole
dioxygenase gene homologue, degrades chlorinated dibenzo-p-dioxins in soil. FEMS
Microbiol Lett 211:43–49
Haggblom M, Valo RJ (1985) Bioremediation of chlorophenol wastes. In: Young LY, Cerniglia
CE (eds) Microbial transformation and degradation of Toxic Organic Chemicals. Wiley,
New York, pp 389–434
Halling SB, Sengelov G, Ingerslev F, Jensen LB (2003) Reduced antimicrobial potencies of
oxytetracycline, tylosin, sulfadiazin, streptomycin, ciprofloxacin, and olaquindox due to envi-
ronmental processes. Arch Environ Contam Toxicol 44:7–16
Haritash AK, Kaushik CP (2009) Biodegradation aspects of polycyclic aromatic hydrocarbons
(PAHs): a review. J Hazard Mater 169:1–15
Hay AG, Focht DD (2000) Transformation of 1,1-dichrolo-2,2-(4-chrolophenyl)ethane (DDD) by
Ralstonia eutropha strain A5. FEMS Microb Ecol 31:249–253
References 361
Hettiarachchi GM, Pierzynski GM (2004) Soil lead bioavailability and in situ remediation of lead-
contaminated soils: a review. Environ Prog 23:78–93
Higginson FR (1993) The composition of mineral soil, physico-chemical and ion exchange
properties. In: Hazelton PA, Koppi AJ (eds) Soil Technology – Applied Soil Science. A course
of lectures. 2nd edition. ASSSI NSW Branch and Dept. Agric. Chem. & Soil Science,
University of Sydney. pp 39–59
Hoffman DR, Okon JL, Sandrin TR (2005) Medium composition affects the degree and pattern of
cadmium inhibition of naphthalene biodegradation. Chemosphere 59:919–927
Holland JM (2004) The environmental consequences of adopting conservation tillage in Europe:
reviewing the evidence. Agric Ecosyst Environ 103:1–25
Hu J, Lo IM, Chen G (2004) Removal of Cr(VI) by magnetite nanoparticle. Water Sci Technol
50:139–146
Huang X, El-Alawi Y et al (2004) A multi-process phytoremediation system for removal of
polycyclic aromatic hydrocarbons from contaminated soils. Environ Pollut 130:465–476
Huang M, Zhu Y, Li Z et al (2016) Compost as a soil amendment to remediate heavy metal-
contaminated agricultural soil: mechanisms, efficacy, problems, and strategies. Water Air Soil
Pollut. doi:10.1007/s11270-016-3068-8
Hülster A, Muller JF, Marschner H (1994) Soil-plant transfer of polychlorinated dibenzo-p-dioxins
and dibenzofurans to vegetables of the cucumber family (Cucurbitaceae). Environ Sci Technol28:1110–1115
Huq SMI, Joardar JC et al (2006) Arsenic contamination in food-chain: transfer of arsenic into
food materials through groundwater irrigation. J Health Popul Nutr 24:305–316
Hussain S, Arshad M, Saleem M, Khalid A (2007) Biodegradation of α- and β-endosulfan by soil
bacteria. Biodegradation 18:731–740
IAEA (2005) Environmental consequences of the Chernobyl accident and their remediation:
twenty years of experience. Report of the UN Chernobyl Forum Expert Group “Environment”
(EGE). International Atomic Energy Agency, Vienna, p 246
Indoria AK, Poonia SR (2006) Phytoextractability of lead from soil by some oilseed crops as
affected by sewage sludge and farmyard manure. Arch Agron Soil Sci 52:667–677
Ishikawa S (2005) Promising technologies for reducing cadmium contamination in rice. In:
Toriyama K, Heong KL, Hardy B (eds) Rice is life: scientific perspectives for the 21st century.
Proceedings of the World Rice Research Conference held in Tokyo and Tsukuba, Japan,
4–7 November 2004. International Rice Research Institute, Los Ba~nos (Philippines) and
Japan International Research Center for Agricultural Sciences, Tsukuba (Japan). pp 381–384
Jain AK, Suhas Jain S, Bhatnagar A (2003) Utilization of industrial wastes for the removal of
anionic dyes. Toxicol Environ Chem 84:41–52
Jeffery S, Verheijen FGA, van der Velde M, Bastos AC (2010) A quantitative review of the effects
of biochar application to soils on crop productivity using meta- analysis. Agric Ecosyst
Environ 144:175–187
Jeon CO, Park W, Padmanabhan P et al (2003) Discovery of a bacterium, with distinctive
dioxygenase, that is responsible for in situ biodegradation in contaminated sediment. Proc
Natl Acad Sci U S A 100:13591–13596
Jindo K, Mizumoto H, Sawada Y et al (2014) Physical and chemical characterization of biochars
derived from different agricultural residues. Biogeosciences 11:6613–6621
Johnsena AR, Wickb LY et al (2005) Principles of microbial PAH-degradation in soil. Environ
Pollut 133:71–84
Juwarkar A, Singh S, Mudhoo A (2010) A comprehensive overview of elements in bioremedia-
tion. Rev Environ Sci Biotechnol 9(3):215–288
Kanaly RA, Harayama S (2000) Biodegradation of high molecular weight polycyclic aromatic
hydrocarbons by bacteria. J Bacteriol 182(8):2059–2067
Kanel SR, Greneche JM, Choi H (2006) Arsenic(V) removal from groundwater using nano scale
zero-valent iron as a colloidal reactive barrier material. Environ Sci Technol 40:2045–2050
362 12 Remediation and Management of Polluted Sites

Kang J (2014) Removing environmental organic pollutants with bioremediation and
phytoremediation. Biotechnol Lett 36(6):1129–1139
Kang F, Chen D, Gao Y, Zhang Y (2010) Distribution of polycyclic aromatic hydrocarbons in
subcellular root tissues of ryegrass (Lolium multiflorum Lam.) BMC Plant Biol 10:210
Karin O, Jonsson A, Stenstro J (2010) A new concept for reduction of diffuse contamination by
simultaneous application of pesticide and pesticide degrading microorganisms. Biodegradation
21:21–29
Karn B, Kuiken T, Otto M (2009) Nanotechnology and in situ remediation: a review of the benefits
and potential risks. Environ Heal Perspect 117:1823–1831
Katayama A, Matsumura F (1993) Degradation of organochlorine pesticides, particularly endo-
sulfan, by Trichoderma harzianum. Environ Toxicol Chem 12:1059–1065
Katayama A, Fujimura Y, Kuwatsuka S (1993) Microbial degradation of DDT at extremely low
concentrations. J Pestic Sci 18:353–359
Kawahigashi H, Hirose S, Ohkawa H, Ohkawa Y (2006) Phytoremediation of the herbicides
atrazine and metalachlor by transgenic rice plants expressing human CYP1A1, CYP2B6 and
CYP2C19. J Agric Food Chem 54:2985–2991
Keharia H, Madamwar D (2003) Bioremediation concepts for treatment of dye containing
wastewater: a review. Indian J Exp Biol 41:1068–1075
Khehra MS, Saini HS et al (2006) Biodegradation of azo dye C.I. Acid Red 88 by an anoxic
aerobic sequential bioreactor. Dyes Pigments 70:1–7
Kim JS, Shea PJ, Yang JE, Kim JE (2007) Halide salts accelerate degradation of high explosives
by zerovalent iron. Environ Pollut 147:634–641
Kimura Y, Okubo Y, Hayashida N et al (2015) Evaluation of the relationship between current
internal 137Cs exposure in residents and soil contamination west of Chernobyl in Northern
Ukraine. PLoS One 10(9):e0139007. doi:10.1371/journal.pone.0139007
Kipopoulou AM, Manoli E, Samara C (1999) Bioconcentration of polycyclic aromatic hydrocar-
bons in vegetables grown in an industrial area. Environ Pollut 106:369–380
Kirchhoff MM (2003) Promoting green engineering through green chemistry. Environ Sci Technol
37(23):5349–5353
Knox AS, Seaman JC, Mench MJ, Vangronsveld J (2001) Remediation of metal and
radionuclides-contaminated soils by in situ stabilization techniques. In: Iskandar IK
(ed) Environmental restauration of metals-contaminated soils. CRC Press LLC, Boca Raton,
pp 21–60
Kuiper EL, Lagendijk GV, Lugtenberg B (2004) Rhizoremediation: A beneficial plant microbe
interaction. Mol Plant-Microbe Interact 17:6–15
Kumpiene J, Ore S, Renella G et al (2006) Assessment of zerovalent iron for stabilization of
chromium, copper, and arsenic in soil. Environ Pollut 144:62–69
Kumpiene J, Montesinos IC, Lagerkvist A, Maurice C (2007) Evaluation of the critical factors
controlling stability of chromium, copper, arsenic and zinc in iron-treated soil. Chemosphere
67(2):410–417
Kurtyka R, Małkowski E et al (2008) Effect of calcium and cadmium on growth and accumulation
of cadmium, calcium, potassium and sodium in maize seedlings. Pol J Environ Stud 17:51–56
Kwon GS, Kim JE, Kim TK et al (2002) Klebsiella pneumoniae KE-1 degrades endosulfan
without formation of the toxic metabolite, endosulfan sulfate. FEMS Microbiol Lett
215:255–259
Lageman R, Pool W, Seffinga G (1990) Electro-reclamation: state-of-the-art and future develop-
ments. In: Arendt F, Hinsenveld M, Van Den Brink WJ (eds) Contaminated soil ’90. Springer,Dordrecht, pp 1071–1078
Lakshmi CV, Kumar M, Khanna S (2008) Biotransformation of chlorpyrifos and bioremediation
of contaminated soil. Int Biodeterior Biodegrad 62(2):204–209
Lakshmi CV, Kumar M, Khanna S (2009) Biodegradation of chlorpyrifos in soil by enriched
cultures. Curr Microbiol 58:35–38
References 363

Lal K, Minhas PS, Shipra et al (2008) Extraction of cadmium and tolerance of three annual cut
flowers on Cd-contaminated soils. Bioresour Technol 99:1006–1011
Launen L, Pinto LJ, Wiebe C et al (1995) The oxidation of pyrene and benzo[a]pyrene by
non-basidiomycete soil fungi. Can J Microbiol 41:477–488
Lee PH, Ong SK et al (2001) Use of solvents to enhance PAH biodegradation of coal tar. Water
Res 35:3941–3949
Levi-Minzi R, Petruzzelli G (1984) The influence of phosphate fertilizers on Cd solubility in soil.
Water Air Soil Pollut 23:423–429
Li YM, Chaney RL, Siebielec G, Kerschner BA (2000) Response of four turfgrass cultivars to
limestone and biosolids-compost amendment of a zinc and cadmium contaminated soil at
Palmerton, Pennsylvania. J Environ Qual 29:1440
Li H, Shi W, Shao H, Shao M (2009) The remediation of the lead-polluted garden soil by natural
zeolite. J Hazard Mater 169:1106–1111
Liang L, Gu B, Yin X (1996) Removal of technetium-99 from contaminated groundwater with
sorbents and reductive materials. Sep Sci Technol 6:111–122
Lichtenstein EP, Schulz KR, Skrentny RF, Stitt PA (1965) Insecticidal residues in cucumbers and
alfalfa grown on aldrin- or heptachlor treated soils. J Econ Entomol 58:742–746
Liedekerke MV, Prokop G, Rabl-Berger S et al (2014) Progress in the management of contami-
nated sites in Europe. EUR 26376 – Joint Research Centre – Institute for Environment and
Sustainability, European Commission. pp 1–68
Liste HH, Alexander M (2000) Plant promoted pyrene degradation in soil. Chemosphere 40:7–10
Little C, Hepher MJ, El-Sharif M (2002) The sono-degradation of phenanthrene in an aqueous
environment. Ultrasonics 40:667–674
Liu RQ, Zhao DY (2007) In situ immobilization of Cu(II) in soils using a new class of iron
phosphate nanoparticles. Chemosphere 68:1867–1876
Liu Y, Zhang J, Zhang Z (2004) Isolation and characterisation of polycyclic aromatic hydrocar-
bons- degrading Sphingomonas sp. Strain ZL5. Biodegradation 15:205–212
Loick N, Hobbs PJ, Hale MCD, Jones DL (2012) Bioremediation of poly-aromatic hyrdocarbon
(PAH)-contaminated soil by composting. Crit Rev Environ Sci Technol 39(4):271–332
Lombi E, Zhao FJ, Wieshammer G, Zhang G, McGrath SP (2002) In situ fixation of metals in soil
using bauxite residue: biological effects. Environ Pollut 118:445–452
Lopez-Chuken UJ, Lopez-Domınguez U et al (2012) Implications of chloride-enhanced cadmium
uptake in saline agriculture: modeling cadmium uptake by maize and tobacco. Int J Environ Sci
Technol 9:69–77
Lothenbach B, Furrer G, Schulin R (1997) Immobilization of heavy metals by polynuclear
aluminium and montmorillonite compounds. Environ Sci Technol 31:1452–1462
Lu H, Zhang YY, Huang X, Wang S, Qiu R (2012) Relative distribution of Pb2+ sorption
mechanisms by sludge-derived biochar. Water Res 46:854–862
Ludwig RD, Su C, Lee TR et al (2007) In situ chemical reduction of Cr(VI) in groundwater using a
combination of ferrous sulphate and sodium dithionite: a field investigation. Int J Environ Sci
Technol 41:5299–5305
Lundstedt S (2003) Analysis of PAHs and their transformation products in contaminated soil and
remedial processes. Dissertation, Umea University, Umea, Sweden
Lunney AI, Zeeb BA, Reimer KJ (2004) Uptake of weathered DDT in vascular plants: potential for
phytoremediation. Environ Sci Technol 38:6147–6154
Luque~no FF, Marsch R et al (2008) Remediation of PAHs in a saline–alkaline soil amended with
wastewater sludge and the effect on dynamics of C and N. Sci Total Environ 402:18–28
Ma QY, Traina SJ, Logan TJ (1993) In situ lead immobilization by apatite. Environ Sci Technol
27:1803–1810
Macek T, Mackova M, Kas J (2000) Exploitation of plants for the removal of organics in
environmental remediation. Biotechnol Adv 18:23–34
364 12 Remediation and Management of Polluted Sites

Madrid F, Lopez R, Cabrera F (2007) Metal accumulation in soil after application of municipal
solid waste compost under intensive farming conditions. Agric Ecosyst Environ 119
(3–4):249–256
MAFF (2002) Survey of the cadmium contained in agricultural products. Ministry of Agriculture,
Forestry, and Fisheries, Gov. of Japan, pp 1–45
Maillard J, Schumacher W, Vazquez F et al (2003) Characterization of the corrinoid iron-sulfur
protein tetrachloroethene reductive dehalogenase of Dehalobacter restrictus. Appl EnvironMicrobiol 69:4628–4638
Makris KC, Shakya KM, Datta R, Sarkar D, Pachanoor D (2007) High uptake of 2, 4,
6-trinitrotoluene by vetiver grass – potential for phytoremediation? Environ Pollut 146:1–4
Maliszewska-Kordybach B (2009) Concentrations, sources and spatial distribution of individual
polycyclic aromatic hydrocarbons (PAHs) in agricultural soils in the Eastern part of the EU:
Poland as a case study. Sci Total Environ 407:3746–3753
Manara A (2012) Plant responses to heavy metal toxicity. In: Furini A (ed) Plants and heavy
metals, briefs in molecular science. Springer, Dordrecht, pp 27–53
Martorell MM, Pajot HF, de Figueroa LIC (2012) Dye-decolourizing yeasts isolated from Las
Yungas rainforest. Dye assimilation and removal used as selection criteria. Int Biodeter
Biodegr 66:25–32
Matsumura F, Boush GM (1967) Dieldrin: degradation by soil microorganisms. Science
156:959–961
Matsumura F, Khanvilkar VG, Patil KC, Boush GM (1971) Metabolism of endrin by certain soil
microorganisms. J Agric Food Chem 19:27–31
Mattina MJI, Eitzer BD, Iannucci-Berger W et al (2004) Plant uptake and translocation of highly
weathered, soil bound technical chlordane residues: data from field and rhizotron studies.
Environ Toxicol Chem 23:2756–2762
Maule A, Plyte S, Quirk AV (1987) Dehalogenation of organochlorine insecticides by mixed
anaerobic microbial populations. Pestic Biochem Physiol 27:229–236
McBride MB (1994) Environmental chemistry of soils. Oxford University Press Inc, New York
McBride MB (1995) Toxic metal accumulation from agricultural use of sludge: are U.S. EPA
regulations protective? J Environ Qual 24:5–18
McGrath SP, Chang AC, Page AL, Witter E (1994) Land application of sewage sludge: scientific
perspectives of heavy metal loading limits in Europe and the United States. Environ Rev
2:108–118
McGuinness M, Dowling D (2009) Plant-associated bacterial degradation of toxic organic com-
pounds in soil. Int J Environ Res Public Health 6:2226–2247
McGuinness M, Mazurkiewicz V, Brennan E, Dowling DN (2007) Dechlorination of pesticides by
a specific bacterial glutathione S-transferase, BphKLB400: Potential for bioremediation. Eng
Life Sci 7:611–615
McMullan G, Meehan C et al (2001) Microbial decolourisation and degradation of textile dyes.
Appl Microbiol Biotechnol 56:81–87
Meers E, Slycken SV et al (2010) The use of bio-energy crops (Zea mays) for ‘phytoattenuation’ ofheavy metals on moderately contaminated soils: a field experiment. Chemosphere 78:35–41
Megharaj M, Kantachote D, Singleton I, Naidu R (2002) Effects of long-term contamination of
DDT on soil microflora with special reference to soil algae and algal transformation of DDT.
Environ Pollut 109:35–42
Megharaj M, Ramakrishnan B, Venkateswarlu K et al (2011) Bioremediation approaches for
organic pollutants: a critical perspective. Environ Int 37(8):1362–1375
Meharg AA, Rahman MM (2003) Arsenic contamination of Bangladesh paddy field soils: impli-
cations for rice contribution to arsenic consumption. Environ Sci Technol 37:229–234
Mello-Farias PC, Chaves ALS, Lencina CL (2011) Transgenic plants for enhanced
phytoremediation – physiological studies, genetic transformation. In: Alvarez M
(ed) InTech. doi:10.5772/24355, 2011. Available at: http://www.intechopen.com/books/
References 365

genetic-transformation/transgenic-plants-for-enhanced-phytoremediation-physiological-stud
ies, Accessed 18 Sept 2016
MenchM, Vangronsveld J, Lepp NW, Edwards R (1998) Physico-chemical aspects and effiency of
trace element immobilization by soil amendments. In: Vangronsveld J, Cunningham SD (eds)
Metal-contaminated soils: In Situ inactivation and phytorestoration. Springer,
Heidelberg/New York
Mench M, Vangronsveld J, Beckx C, Ruttens A (2006) Progress in assisted natural remediation of
an arsenic contaminated agricultural soil. Environ Pollut 144:51–61
Mikes O, Cupr P, Trapp S, Klanova J (2009) Uptake of polychlorinated biphenyls and organo-
chlorine pesticides from soil and air into radishes (Raphanus sativus). Environ Pollut 157
(2):488–496
Miller CD, Hall K, Liang YN et al (2004) Isolation and characterization of polycyclic aromatic
hydrocarbon-degrading Mycobacterium isolates from soil. Microb Ecol 48:230–238
Miyata N, Iwahori K, Foght JM, Gray MR (2004) Saturable, energy dependent uptake of
phenanthrene in aqueous phase by Mycobacterium sp. strain RJGII-135. Appl Environ
Microbiol 70(1):363–369
Moody J, Freeman J, Doerge D, Cerniglia C (2001) Degradation of phenanthrene and anthracene
by cell suspensions of Mycobacterium sp. PYR-1. Appl Environ Microbiol 67(4):1476–1483
Muller I, Pluquet E (1998) Immobilization of heavy metals in sediment dredged from a seaport by
iron bearing materials. Water Sci Technol 37:379–386
Musat F, Galushko A, Jacob J et al (2009) Anaerobic degradation of naphthalene and
2-methylnaphthalene by strains of marine sulfate-reducing bacteria. Environ Microbiol
11:209–219
NAAS (2012) Sustaining agricultural productivity through integrated soil management. Policy
Paper No. 56, National Academy of Agricultural Sciences, New Delhi
Nadeau LJ, Menn FM, Breen A, Sayler GS (1994) Aerobic degradation of 1,1,1-trichloro-2,2-bis
(4-chlorophenyl)ethane (DDT) by Alcaligenes eutrophus A5. Appl Environ Microbiol
60:51–55
Nair DR, Burken JG, Licht LA, Schnoor JL (1993) Mineralization and uptake of triazine pesticide
in soil-plant systems. J Environ Eng 119:842–854
Neumann D, Heuer A, Hemkemeyer M et al (2014) Importance of soil organic matter for the
diversity of microorganisms involved in the degradation of organic pollutants. ISME J
8:1289–1300
Nigam P, Armour G et al (2000) Physical removal of textile dyes from effluents and solid-state
fermentation of dye-adsorbed agricultural residues. Bioresour Technol 72:219–226
Nigam R, Srivastava S et al (2001) Cadmium mobilization and plant availability – the impact of
organic acids commonly exuded from roots. Plant Soil 230:107–113
Nurzhanova A, Kulakow P, Rubin E et al (2010) Obsolete pesticides pollution and
phytoremediation of contaminated soil in Kazakhstan. In: Kulakow PA, Pidlisnyuk VV (eds)
Application of phytotechnologies for cleanup of industrial, agricultural, and wastewater
contamination. Springer, Dordrecht, pp 87–111
Oleszczuk P, Baran S (2003) Degradation of individual polycyclic aromatic hydrocarbons (PAHs)
in soil polluted with aircraft fuel. Pol J Environ Stud 12:431–437
Oliver DP, Schultz JE, Tiller KG, Merry RH (1993) The effect of crop rotations and tillage
practices on cadmium concentration in wheat grain. Aust J Agric Res 44:1221–1234
Olson PE, Castro A et al (2008) Effects of agronomic practices on phytoremediation of an aged
PAH-contaminated soil. J Environ Qual 37:1439–1446
Ortiz-Hernandez ML, Sanchez-Salinas E (2010) Biodegradation of the organophosphate pesticide
tetrachlorvinphos by bacteria isolated from agricultural soils in Mexico. Rev Int Contam
Ambient 26(1):27–38
Otani T, Seike N, Sakata Y (2007) Differential uptake of dieldrin and endrin from soil by several
plant families and Cucurbita genera. Soil Sci Plant Nutr 53:86–94
366 12 Remediation and Management of Polluted Sites

Page AL, Logan TJ et al (1987) Land application of sludge: Food chain implications. Lewis
Publications, Chelsea
Papafilippaki A, Paranychianakis N, Nikolaidis NP (2015) Effects of soil type and municipal solid
waste compost as soil amendment on Cichorium spinosum (spiny chicory) growth. Sci Hortic-
Amsterdam 195:195–205
Parrish Z, White J, Isleyen M et al (2006) Accumulation of weathered polycyclic aromatic
hydrocarbons (PAHs) by plant and earthworm species. Chemosphere 64:609–618
Patil KC, Matsumura F, Boush GM (1970) Degradation of endrin, aldrin, and DDT by soil
microorganisms. Appl Microbiol 19:879–881
Paz-Ferreiro J, Lu H, Fu S et al (2014) Use of phytoremediation and biochar to remediate heavy
metal polluted soils: a review. Solid Earth 5:65–75
Pereira CR, Camps-Arbestain M, Rodrıguez Garrido B et al (2006) Behaviour of a-, b-, c-, and
d-hexachlorocyclohexane in the soil–plant system of a contaminated site. Environ Pollut
144:210–217
Pigna M, Cozzolino V et al (2010) Effects of phosphorus fertilization on arsenic uptake by wheat
grown in polluted soils. J Soil Sci Plant Nutr 10:428–442
Pilon-Smits E (2005) Phytoremediation. Annu Rev Plant Biol 56:15–39
Pointing SB (2001) Feasibility of bioremediation by white rot fungi. Appl Microbiol Biotechnol
57:20–33
Powlson DS, Whitmore AP, Goulding KWT (2011) Soil carbon sequestration to mitigate climate
change: a critical re-examination to identify the true and the false. Eur J Soil Sci 62:42–55
Pradhan SP, Conrad JR, Paterek JR, Srivastava VJ (1998) Potential of phytoremediation for
treatment of PAHs in soil at MGP sites. Soil Sediment Contam 7:467–480
Prasad MNV (2007) Aquatic plants for phytotechnology. In: Singh SN, Tripathi RD (eds)
Environmental bioremediation technologies. Springer, Berlin, pp 259–274
Puls RW, Paul CJ, Powell RM (1999) The application of in situ permeable reactive (zero-valent
iron) barrier technology for the remediation of chromate-contaminated groundwater: a field
test. Appl Geochem 14:989–1000
Puvaneswari N, Muthukrishnan J, Gunasekaran P (2006) Toxicity assessment and microbial
degradation of azo-dyes. Indian J Exp Biol 44:618–626
Qing H, Zhang Z, Hong Y, Li S (2007) A microcosm study on bioremediation of fenitrothion-
contaminated soil using Burkholderia sp. FDS-1. Int Biodeterior Biodegrad 59:55–61
Quilliam RS, Rangecroft S, Emmett BA et al (2013) Is biochar a source or sink for polycyclic
aromatic hydrocarbon (PAH) compounds in agricultural soils? GCB Bioenergy 5:96–103
Quinn JJ, Negri CM et al (2001) Predicting the effect of deep-rooted hybrid poplars on the
groundwater flow system at a large scale phytoremediation site. Int J Phytoremed 3:41–60
Rai UN, Pandey S, Sinha S et al (2004) Revegetating fly ash landfills with Prosopis juliflora L:
impact of different amendments and Rhizobium inoculation. Environ Int 30:293–300
Rao MA, Scelza R, Acevedo F et al (2014) Enzymes as useful tools for environmental purposes.
Chemosphere 107:145–162
Rayu S, Karpouzas D, Singh B (2012) Emerging technologies in bioremediation: constraints and
opportunities. Biodegradation 23(6):917–926
Rehmann K, Noll HP, Steinberg CEW, Kettrup AA (1998) Pyrene Degradation byMycobacteriumSp. Strain KR2. Chemosphere 36:2977–2992
Reid BJ, Jones KC, Semple KT (2000) Bioavailability of persistent organic pollutants in soils
and sediments – a perspective on mechanisms, consequences and assessment. Environ Pollut
108(1):103–112
Reilley KA, Banks MK et al (1996) Dissipation of polycyclic aromatic hydrocarbons in the
rhizosphere. J Environ Qual 25:212–219
Rhykerd RL, Crews B et al (1999) Impact of bulking agents, forced aeration, and tillage on
remediation of oil-contaminated soil. Bioresour Technol 67:279–285
Rickerby DG, Morrison M (2007) Nanotechnology and the environment: a European perspective.
Sci Technol Adv Mater 8:19–24
References 367

Rigas F, Papadopoulou K, Dritsa V, Doulia D (2007) Bioremediation of a soil contaminated by
lindane utilizing the fungus Ganoderma australe via response surface methodology. J Hazard
Mater 140:325–332
Riya P, Jagatpati T (2012) Biodegradation and bioremediation of pesticides in soil: its objectives,
classification of pesticides, factors and recent developments. World J Sci Technol 2:36–41
Roche H, Vollaire Y, Martin E et al (2009) Rice fields regulate organochlorine pesticides and
PCBs in lagoons of the Nature Reserve of Camargue. Chemosphere 75:526–533
Rousseaux S, Hartmann A, Lagacherie B et al (2003) Inoculation of an atrazine-degrading strain,
Chelatobacter heintzii Cit1, in four different soils: effects of different inoculum densities.
Chemosphere 51:569–576
Ruttens A, Boulet J et al (2011) Short rotation coppice culture of willows and poplars as energy
crops on metal contaminated agricultural soils. Int J Phytoremediation 13:194–207
Sack U, Fritsche W (1997) Enhancement of pyrene mineralization in soil by wood-decaying fungi.
FEMS Microbiol Ecol 22(1):77–83
Saha JK (2002) Role of farmyard manure in integrated nutrient management in Indian soils for
sustainable crop production. In: Dris R, Abdelaziz FH, Jain M (eds) Plant nutrition: growth and
diagnosis. Oxford & IBH Publishing Co. Pvt. Ltd, New Delhi, pp 277–288
Saha JK (2005) Changes in salinity and sodicity of soils with continuous application of contam-
inated water near industrial area. J Indian Soc Soil Sci 53(4):612–617
Saha JK, Adhikari T, Mandal B (1999) Effect of lime and organic matter on distribution of zinc,
copper, iron, and manganese in acid soils. Commun Soil Sci Plant Anal 30:1819–1829
Saha JK, Panwar N et al (2010) An assessment of municipal solid waste compost quality produced
in different cities of India in the perspective of developing quality control indices. Waste
Manag 30:192–201
Saha JK, Panwar N et al (2013) Risk assessment of heavy metals in soil of a susceptible agro-
ecological system amended with municipal solid waste compost. J Indian Soc Soil Sci
61:15–22
Saha JK, Sharma AK, Srivastava A (2014) Impact of different types of polluted irrigation water on
soil fertility and wheat grain yield in clayey black soils of central India. Environ Monit Assess
186:2349–2356
Saiki Y, Habe H, Yuuki T et al (2003) Rhizoremediation of dioxin-like compounds by a
recombinant Rhizobium tropici strain expressing carbazole 1,9a- dioxygenase constitutively.
Biosci Biotechnol Biochem 67:1144–1148
Sanglard D, Leisola MSA, Fiechter A (1986) Role of extracellular liginases in biodegradation of
benzo[a]pyrene by Phanerochaete chrysoporium. Enzym Microb Technol 8:209–212
Santodonato J, Howard P et al (1981) Health and ecological assessment of polynuclear aromatic
hydrocarbons. J Environ Pathol Toxicol Oncol 5:1–364
Saratale RG, Saratale GD et al (2010) Decolorization and biodegradation of reactive dyes and dye
wastewater by a developed bacterial consortium. Biodegradation 21:999–1015
Sarmah AK, Meyer MT, Boxall ABA (2006) A global perspective on the use, sales, exposure
pathways, occurrence, fate and effects of veterinary antibiotics (VAs) in the environment.
Chemosphere 65:725–759
Sayara T, Pognani M et al (2010) Anaerobic degradation of PAHs in soil: Impacts of concentration
and amendment stability on the PAHs degradation and biogas production. Int Biodeterior
Biodegrad 64:286–292
Schimmack W, Bunzl K, Zelles L (1989) Initial rates of migration of radionuclides from the
Chernobyl fallout in undisturbed soils. Geoderma 44:211–218
Schnabel WE, White DM (2001) The effect of mycorrhizal fungi on the fate of aldrin:
phytoremediation potential. Int J Phytoremediat 3(2):221–241
Schutzendubel A, Majcherczyk A, Johannes C, Huttermann A (1999) Degradation of fluorene,
anthracene, phenanthrene, fluoranthene and pyrene lacks connection to the production of
extracellular enzymes by Pleurotus ostreatus and Bjerkandera adjusta. Int Biodeter Biodegr43:93–100
368 12 Remediation and Management of Polluted Sites

Scott C, Pandey G, Hartley CJ et al (2008) The enzymatic basis for pesticide bioremediation.
Indian J Microbiol 48:65–79
Semple KT, Reid BJ, Fermor TR (2001) Impact of composting strategies on the treatment of soils
contaminated with organic pollutants. Environ Pollut 112:269–283
Sethunathan N, Megharaj M, Chen ZL et al (2004) Algal degradation of a known endocrine
disrupting insecticide, a-endosulfan, and its metabolite, endosulfan sulfate, in liquid medium
and soil. J Agric Food Chem 52(10):3030–3035
Shann JR, Boyle JJ (1994) Influence of plant species on in situ rhizosphere degradation. In:
Anderson TA, Coats JR (eds) Bioremediation Through Rhizosphere Technology, ACS Sym-
posium Series, American Chemical Society, Washington, DC 563:70–81
Sharma PM, Bhattacharya D, Krishnan S, Lal B (2004) Degradation of polycyclic aromatic
hydrocarbons by a newly discovered enteric bacterium Leclercia adecarboxylata. Appl Envi-ron Microbiol 70(5):3163–3166
Shi G, Cai Q (2009) Cadmium tolerance and accumulation in eight potential energy crops.
Biotechnol Adv 27:555–561
Shi Q, Bao Z, Zhu Z et al (2005) Silicon-mediated alleviation of Mn toxicity in Cucumis sativus inrelation to activities of superoxide dismutase and ascorbate peroxidase. Phytochemistry
66:1551–1559
Shu WS, Lan CY, Zhang ZQ, Wong MH (2000) Use of vetiver and other three grasses for
revegetation of Pb/Zn mine tailings at Lechang, Guangdong Province: field Experiment.
Second international vetiver conference, Bangkok, Thailand
Siddique T, Okeke BC, Arshad M, Frankenberger WT Jr (2003) Enrichment and isolation of
endosulfan-degrading microorganisms. J Environ Qual 32:47–54
Singh OV, Jain RK (2003) Phytoremediation of toxic aromatic pollutants from soil. Appl
Microbiol Biotechnol 63:128–135
Singh NS, Singh DK (2011) Biodegradation of endosulfan and endosulfan sulfate by
Achromobacter xylosoxidans strain C8B in broth medium. Biodegradation 22:845–857
Singh BK, Walker A (2006) Microbial degradation of organophosphorus compounds. FEMS
Microbiol Rev 30:428–471
Singh OV, Labana S et al (2003) Phytoremediation: an overview of metallic ion decontamination
from soil. Appl Microbiol Biotechnol 61:405–412
Singh KP, Dinesh M, Sinha S, Dalwani R (2004) Impact assessment of treated/untreated waste-
water toxicants discharged by sewage treatment plants on health, agricultural, and environ-
mental quality in the wastewater disposal area. Chemosphere 55:227–255
Singh B, Singh BP, Cowie AL (2010) Characterisation and evaluation of biochars for their
applications a soil amendment. Aust J Soil Res 48:516–525
Singh V, Brar MS, Sharma P, Brar BS (2011) Distribution of arsenic in groundwater and surface
soils in south western districts of Punjab. J Indian Soc Soil Sci 59:376–380
Skaates SV, Ramaswami A, Anderson LG (2005) Transport and fate of dieldrin in poplar and
willow trees analyzed by SPME. Chemosphere 61(1):85–91
Skłodowski P, Maciejewska A et al (2006) The effect of organic matter from brown coal on
bioavailability of heavy metals in contaminated soils. In: Twardowska I, Allen HE (eds) Soil
and water pollution monitoring, protection and remediation. Springer, pp 3–23
Smith DJT, Edelhauser EC, Harrison RM (1995) Polycyclic aromatic hydrocarbon concentrations
in road dust and soil samples collected in the United Kingdom and Pakistan. Environ Technol
16:45–53
Smreczak B, Maliszewska-Kordybach B (2003) Primary investigations into determination of
potentially bioavailable fractions of PAHs in soils contaminated with those compounds.
Arch Environ Prot 29(4):41–50
Sparrow LA, Salardini AA et al (1994) Field studies of cadmium in potatoes (Solanumtuberosum L.). III. Response of cv. Russet Burbank to sources of banded potassium. Aust J
Agric Res 45:243–249
References 369

Struthers JK, Jayachandran K, Moorman TB (1998) Biodegradation of atrazine by Agrobacteriumradiobacter J14a and use of this strain in bioremediation of contaminated soil. Appl Environ
Microbiol 64(9):3368–3375
Su DC, Wong JWC (2004) Selection of mustard oilseed rape (Brassica juncea L.) for
phytoremediation of cadmium contaminated soil. Bull Environ Contam Toxicol 72:991–998
Sutherland JB, Selby AL, Freeman JP et al (1991) Metabolism of phenanthrene by Phanerochaetechrysosporium. Appl Environ Microbiol 57:3310–3316
Sutherland JB, Fu PP, Yang SK et al (1993) Enantiomeric composition of the trans-dihydrodiols
produced from phenanthrene by fungi. Appl Environ Microbiol 59:2145–2149
Suzuki N (2005) Alleviation by calcium of cadmium-induced root growth inhibition in
Arabidopsis seedlings. Plant Biotechnol 22:19–25
Tao S, Cui YH, Xu FL et al (2004) Polycyclic aromatic hydrocarbons (PAHs) in agricultural soil
and vegetables from Tianjin. Sci Total Environ 320:11–24
Tao S, Jiao XC, Chen SH et al (2006) Uptake of vapor and particulate polycyclic aromatic
hydrocarbons by cabbage. Environ Pollut 140:13–15
Teng Y, Luo Y et al (2010) Influence of arbuscular mycorrhiza and Rhizobium on
phytoremediation by alfalfa of an agricultural soil contaminated with weathered PCBs: a
field study. Int J Phytoremedition 12:516–533
Tharakan J, Addagada A, Tomlinson D, Shafagati A (2004) Vermicomposting for the bioremedi-
ation of PCB congeners in SUPERFUND site media. In: Waste management and the environ-
ment II: International Conference on Waste Management and the Environment No. 2, Rhodes,
pp 117–124
Thiele-Bruhn S (2003) Pharmaceutical antibiotic compounds in soils-a review. J Plant Nutr Soil
Sci 166:145–167
Tomei MC, Daugulis AJ (2013) Ex situ bioremediation of contaminated soils: an overview of
conventional and innovative technologies. Crit Rev Environ Sci Technol 43(20):2107–2139
Torres E, Bustos-Jaimes I, Le Borgne S (2003) Potential use of oxidative enzymes for the
detoxification of organic pollutants. Appl Catal B-Environ 46(1):1–15
Tripathi DK, Singh VP, Prasad SM et al (2015) Silicon-mediated alleviation of Cr(VI) toxicity in
wheat seedlings as evidenced by chlorophyll florescence, laser induced breakdown spectros-
copy and anatomical changes. Ecotoxicol Environ Saf 113:133–144
Tripathi DK, Singh S, Singh VP (2016) Silicon nanoparticles more efficiently alleviate arsenate
toxicity than silicon in maize cultivar and hybrid differing in arsenate tolerance. Front Environ
Sci 4:46
Truong PN, Baker D (1988) Vetiver grass system for environmental protection. Technol Bull No
1. Pacific Rim Vetiver Network. Office of the Royal Development Projects Board, Bangkok,
Thailand
Trzesicka-Mlynarz D, Ward OP (1995) Degradation of polycyclic aromatic hydrocarbons (PAHs)
by a mixed culture and its component pure cultures, obtained from PAH-contaminated soil.
Can J Microbiol 41:470–476
Valentıın L, Lu-Chau TA, L´opez C et al (2007) Biodegradation of dibenzothiophene,
fluoranthene, pyrene and chrysenein a soil slurry reactor by the white-rot fungus Bjerkanderasp. BOS55. Process Biochem 42:641–648
Valo R, Salkinoja-Salonen M (1986) Bioreclamation of chlorophenol contaminated soil by
composting. Appl Microbiol Biotechnol 25:68–75
Vamerali T, Bandiera M,Mosca G (2010) Field crops for phytoremediation of metal-contaminated
land. A review. Environ Chem Lett 8:1–17
van Bohemen HD, van de LaakWHJ (2003) The influence of road infrastructure and traffic on soil,
water, and air quality. Environ Manag 31(1):50–68
Vangronsveld J, Cunningham SD (1998) Metal contaminated soils: In situ inactivation and
phytorestoration. Springer and R G Landes Company, Georgetown
Vangronsveld J, Carleer R, Clijsters H (1994) Transfer of metals and metalloids from soil to man
through vegetables cultivated in polluted gardens: risk assessment and methods from
370 12 Remediation and Management of Polluted Sites

immobilizations of these elements in soils. In: Varnavas SP (ed) Environmental contamination.
CEP Consultants, Edinburgh, pp 142–145
Vidali M (2001) Bioremediation. An overview. Pure Appl Chem 73:1163–1172
Vila J, Lopez Z, Sabate J et al (2001) Identification of a novel metabolite in the degradation of
pyrene by Mycobacterium sp. strain AP1: actions of the isolate on two- and three-ring
polycyclic aromatic hydrocarbons. Appl Environ Microbiol 67:5497–5505
Vrkoslavova J, Demnerova K, Mackova M et al (2010) Absorption and translocation of
polybrominated diphenyl ethers (PBDEs) by plants from contaminated sewage sludge.
Chemosphere 81:381–386
Waghmode TR, Kurade MB, Govindwar SP (2011) Time dependent degradation of mixture of
structurally different azo and non azo dyes by using Galactomyces geotrichum MTCC 1360.
Int Biodeter Biodegr 65:479–486
Walker DJ, Clemente R et al (2004) Contrasting effects of manure and compost on soil pH, heavy
metal availability and growth of Chenopodium album L. in a soil contaminated by pyritic mine
waste. Chemosphere 57:215–224
Wang KR (2002) Tolerance of cultivated plants to cadmium and their utilization in polluted
farmland soils. Acta Biotechnol 22:189–198
Wang Y, Oyaizu H (2009) Evaluation of the phytoremediation potential of four plant species for
dibenzofuran-contaminated soil. J Hazard Mater 168:760–764
Wang X, Gong Z, Li P, Zhang L, Hu X (2008) Degradation of pyrene and benzo[a]pyrene in
contaminated soil by immobilized fungi. Environ Eng Sci 25:677–684
Weber WJ (1972) Physicochemical processes for water quality control. Wiley, New York, pp
34–36
Wen Y, Ehsan S, Marshall WD (2012) Simultaneous mobilization of macro- and trace elements
(MTEs) and polycyclic aromatic hydrocarbon (PAH) compounds from soil with a non-ionic
surfactant and [S, S]-ethylenediamine-disuccinic acid (EDDS) in admixture: PAH compounds.
J Hazard Mater 199–200:240–246
White JC, Parrish ZD, Isleyen M et al (2006) Influence of citric acid amendments on the
availability of weathered PCBs to plant and earthworm species. Int J Phytorem 8:63–79
Whitfield Aslund ML, Zeeb BA, Rutter A, Reimer KJ (2007) In situ phytoextraction of
polychlorinated biphenyl - (PCB) contaminated soil. Sci Total Environ 374:1–12
Willaert G, Verloo M (1992) Effect of various nitrogen fertilizers on the chemical and biological
activity of major and trace elements in a cadmium contaminated soil. Pedology 43:83–91
Wunder T, Marr J, Kremer S et al (1997) 1-Methoxypyrene and 1,6-dimethoxypyrene: two novel
metabolites in fungal metabolism of polycyclic aromatic hydrocarbons. Arch Microbiol
167:310–316
Xia H (2008) Enhanced disappearance of dicofol by water hyacinth in water. Environ Technol
29:297–302
Xu YH, Zhao DY (2007) Reductive immobilization of chromate in water and soil using stabilized
iron nanoparticles. Water Res 41:2101–2108
Xu SY, Chen YX,WuWX et al (2006) Enhanced dissipation of phenanthrene and pyrene in spiked
soils by combined plants cultivation. Sci Total Environ 363:206–215
Xu SY, Chen YX, Lin KF et al (2009) Removal of pyrene from contaminated soils by white clover.
Pedosphere 19:265–272
Yamazoe A, Yagi O, Oyaizu H (2004) Degradation of polycyclic aromatic hydrocarbon by a
newly isolated dibenzofuran utilizing Janibacter sp strain YY-1. Appl Microbiol Biotechnol
65:211–218
Yang Q, Yediler A, Yang M, Kettrup A (2005) Decolorization of an azo dye, reactive black 5 and
MnP production by yeast isolate: debaryomyces polymorphus. Biochem Eng J 24:249–253
Yap CL, Gan S, Ng HK (2010) Application of vegetable oils in the treatment of polycyclic
aromatic hydrocarbons-contaminated soils. J Hazard Mater 177(1–3):28–41
References 371

YeWL, Khan MA, McGrath SP, Zhao FJ (2011) Phytoremediation of arsenic contaminated paddy
soils with Pteris vittata markedly reduces arsenic uptake by rice. Environ Pollut
159:3739–3743
Yirsaw BD, Megharaj M, Chen Z, Naidu R (2016) Environmental application and ecological
significance of nano-zero valent iron. J Environ Sci 44:88–98
Yoon JM, Oliver DJ, Shanks JV (2007) Phytotoxicity and phytoremediation of 2, 6-dinitrotoluene
using a model plant, Arabidopsis thaliana. Chemosphere 68:1050–1057
Zhang WX (2003) Nanoscale iron particles for environmental remediation: an overview. J
Nanopart Res 5:323–332
Zhang WX (2005) Nanotechnology for water purification and waste treatment. Frontiers in
nanotechnology, U.S. EPA millennium lecture series. Available at http://www.epa.gov/ncer/
nano/lectures/zhang0705.pdf. Accessed 14 Mar 2016
Zhang H, Kallimanis A, Koukkou AI, Drainas C (2004a) Isolation and characterization of novel
bacteria degrading polycyclic aromatic hydrocarbons from polluted Greek soils. Appl
Microbiol Biotechnol 65:124–131
Zhang W, Wang H, Zhang R et al (2004b) Bacterial communities in PAH contaminated soils at an
electronic-waste processing center in China. Ecotoxicology 19:96–104
Zielinski M, Kahl S, Hecht HJ, Hofer B (2003) Pinpointing biphenyl dioxygenase residues that are
crucial for substrate interaction. J Bacteriol 185:6976–6980
372 12 Remediation and Management of Polluted Sites

Chapter 13
Soil Protection Policy
Abstract Since independence, agriculture and food security has received consid-
erable importance in policy documents of Planning Commission of Indian govern-
ment. Although issue of land protection has been raised and addressed in the Five
Yearly Plan documents, focus remained mainly on rational use of land by different
sectors of economic activity and on prevention of soil erosion from agricultural
land. Protection of land from chemicals & radionuclides pollution and prevention of
toxic contaminants entry into soil have received less reference in environmental
acts and rules as compared to that received by air and water pollution. Therefore,
the need for soil protection policy has been felt by environmentalists that can
regulate anthropogenic activities responsible for land pollution and put forward
guidelines on remedial measures of already contaminated land. This chapter iden-
tifies key considerations for soil protection policy after analyzing basic functions of
soil and types of threats perceived from human activities.
Keywords Soil • Protection • Environmental acts • Rules • Policy
Soil an important natural resources, supports several ecosystem services by pro-
viding anchorage for plants; habitat for diverse group of organisms including
human, animals, insects, microorganisms; producing food, fuel and fibre;
maintaining or improving air quality in favour of sustaining life; regulating water
cycling processes for sustaining its quality; sequestering atmospheric carbon and
recycling of nutrient. In this context, soil quality is defined as the capacity of
specific kind of soil to function within natural ecosystem and/or managed land-
use boundaries, to sustain plant and animal productivity, promote air and water
quality, and maintain plant, animal and human health (Karlen et al. 2001). In brief,
soil quality has been related to “fitness of soil for desired use” or “capacity of the
soil to function as desired”. Soil also controls the pattern of human settlement and
land use; determines local characteristics of landscapes, and conserves cultural and
archaeological remnants and other aspects of our geo-diversity heritage.
© Springer Nature Singapore Pte Ltd. 2017
J.K. Saha et al., Soil Pollution - An Emerging Threat to Agriculture, Environmental
Chemistry for a Sustainable World 10, DOI 10.1007/978-981-10-4274-4_13
373

13.1 Land Related National Policies Towards Food
Security
Land is an important source of livelihood for the people in India and State is entitled
to collect and share the income derived from the land. As per the Seventh Schedule
(entry no. 18 and 45 in II-State list) in the Constitution of India, land revenues
including their assessment and collection, maintenance of land records, land man-
agement and alienation of revenue etc. fall within the powers of the State Govern-
ments. As “Land” is a State subject, only state (provincial) legislatures have the
power to enact and implement land-reform laws. Consequently, such laws differ
from State to State as these are formulated and enacted in furtherance to the cause of
people under its jurisdiction. However, the central government as a whole plays an
obligatory advisory and financial role in land related policy as per the provision in
constitution in respect of social and economic planning (a responsibility held
concurrently with the states). To fulfil the role of social and economic planning,
the Government of India established a National Planning Commission immediately
after Independence. The Commission prepared a series of Five-Yearly Plans since
1951 which also stressed upon the action plans on various land related policies
(Table 13.1). In 1976, the National Commission on Agriculture stress upon on
scientific land use planning for attaining food security, self reliance and enhanced
livelihood security for the people of country. The National Policy for Farmers, in
2007 had recommended for reviving the existing Land Use Boards and linking them
to district-level land-use committees, so that they can provide effective and proac-
tive advice to farmers on land use. The committee on “State Agrarian Relations and
the Unfinished Task in Land Reforms” (2009) has also put emphasis on the need for
land use planning in the country.
13.2 Focus of National Policies on Protection of Land
Resources
Department of Land Resources under Ministry of Rural Development (Government
of India) prepared ‘National Land Utilisation Policy: framework for land use
planning and management’ (published in September 18, 2013), which seeks to
order and regulate land use in an efficient and rational way, thus taking care of the
needs of the community (livelihood, food and water security) while safeguarding
natural resources and minimizing land use conflicts or negative environmental
impacts. Following issues have been addressed in the document:
• Unregulated land use shifts
• Reducing per capita land resource
• Meeting the demands of all developmental sectors (agriculture, urban, industrial
and mining)
374 13 Soil Protection Policy

Table 13.1 Land related policy formulation throughout Five yearly Plan period
Plan period Major issues identified Policy thrust
First Plan
(1951–1956)
Huge uncultivated lands sealed under
large size holdings. Need to expand
area under cultivation and community
development (CD) network
Land reforms to bring vast fallow area
under cultivation and to increase land
use efficiency. Abolition of interme-
diaries. Tenant to be given the rights to
cultivate land
Second Plan
(1956–1961)
Concern about vast rainfed agriculture
and low land productivity. Less thrust
on irrigated agriculture. Need for land
related institutional framework
Soil conservation and irrigation infra-
structure development for the rainfed
areas. First phase of land reform
implementation. Training and exten-
sion effort for the technology through
community development
Third Plan
(1961–1966)
Concern for Food security. To bring
cultivable waste land under cultivation
through reclamation. To bring back-
ward regions under mainstream growth
Emphasised on area development
programme and developing integrated
land policy. Soil surveys and Intensive
area development programme (IADP)
adopted for selected districts
Fourth Plan
(1969–1974)
Emphasis on food security to be con-
tinued for meeting minimum dietary
requirements of people. Incentives for
land diversion towards food crops cul-
tivation and enhancing the productivity
of such land. Domination of large
holding sizes and low allocation and
technical efficiency
More thrust on irrigation and soil
conservation in dryland areas. Con-
cern expressed for increasing cropping
intensity. Second phase of land
reforms with land ceiling acts and
consolidation of holding introduced.
Institutional and technological
changes brought in
Fifth Plan
(1974–1979)
Problems of land degradation
highlighted. Drought-prone areas and
land management in irrigated com-
mand areas attracted attention
Soil conservation, Drought-prone area
development and Desert area devel-
opment programmes started and
enhanced further. New impetus to dry
farming
Sixth Plan
(1980–1985)
Under-utilization of land resources and
Drought-prone areas continued to draw
attention. Increased focus felt for green
revolution in economically backward
regions
Land and water management
programme initiated in selected areas
under drought-prone area programme
Seventh
Plan
(1985–1990)
Soil erosion and land degradation,
Diversion of cultivated land to
non-agricultural sector, and Deforesta-
tion and degradation of forest lands
surfaced as major issues
Conservation of soil and water, and
protection of land from degradation
were emphasized. Specific attention to
degraded lands like Wastelands
Development programmes and land
management in long-term perspective
Eighth Plan
(1992–1997)
Degradation of land in irrigated com-
mand areas. Dryland and rainfed areas
needed more attention. Lack of peo-
ples’ participation in land management
at village level surfaced as major issue
Emphasis on land management
through watershed approach. Soil
conservation was brought under
watershed programmes. Agro-climatic
zone based regional planning
approach was introduced
Ninth Plan
(1997–2002)
Considerable increase in area under
land degradation. Integrating Water-
shed Development Programme with
Focus on bringing more under-utilized
land under agriculture. Management
of wastelands. Maintenance of village
(continued)
13.2 Focus of National Policies on Protection of Land Resources 375

• Protecting lands under natural environment and its resources that provides
ecosystem services
• Meeting urbanization demands
• Meeting industrialization demands
• Meeting mining sector demands
• Meeting transport sector demands
• Development vs. sustainable development
• Protecting social interests
• Protecting heritage
• Inadequate land use planning capacities
However, this policy document does not mention about the guiding principles
related to soil protection from polluting activities and remediation of anthropogen-
ically degraded land.
In order to protect environment, India has enacted different laws which provided
the instruments for controlling or regulating the acquisition, use, and conservation
of the natural resources. These aim to facilitate a sustained use of resources and
allow their need-based management. Majority of the laws/rules implemented were
directed towards prevention and control of different environmental components and
pollutants, like, water resources, air, hazardous wastes, biomedical wastes, plastics,
fly ash, municipal solid wastes, batteries etc.; and adequately addressed the issues
on protection of air, water bodies, forests and wild animals, fragile ecosystems.
Although, the land Acquisition Act, 1894 provides greater control of the govern-
ment on lands and subsequently on its planning, development and building of
Table 13.1 (continued)
Plan period Major issues identified Policy thrust
various components of other develop-
mental programmes. Relook on
on-going land reforms. Narrowing gap
between potentials and actual crop
yields. Need for a long-term policy
document
community land. Management of
village community lands through
Panchayat Raj institutions. Decentral-
ization of land management system.
Revisit on existing land legislations
Tenth Plan
(2002–2007)
Degradation of land caused by biotic
and abiotic pressures. Macro environ-
mental contamination of air, land,
water, and food
Bringing wasteland and degraded
lands into productive use. Creation of
comprehensive regional land use
database
Eleventh
Plan
(2007–2012)
Land reforms for promoting agricul-
tural productivity. Measures and
guidelines in respect of land going out
of cultivation. Micronutrient deficien-
cies and depleting C in soil
A major thrust at watershed develop-
ment through expansion of the accel-
erated irrigation benefit programme.
Better water management in rainfed
areas
Twelfth Plan
(2012–2017)
Enhanced soil erosion, soil quality
deterioration from imbalanced use of
fertilizers
Land reform for equitable and rational
use of land. Land records moderniza-
tion programme. Promotion of best
practices of soil fertility management.
Recycling of organic matter in soil
376 13 Soil Protection Policy

housing etc., it does not address the issue of protecting soil and its valuable
functions. Following different statutes/legislations have been enacted for the pur-
pose of protecting environment in India.
• The Water (Prevention and Control of Pollution) Act, 1974
• The Water (Prevention and Control of Pollution) Rules, 1975
• The Water (Prevention and Control of Pollution) Cess Act, 1977
• The Water (Prevention and Control of Pollution) Cess Rules, 1978
• The Air (Prevention and Control of Pollution) Act, 1981
• The Air (Prevention and Control of Pollution) Rules, 1982
• The Environment (Protection) Act, 1986
• The Environment (Protection) Rules, 1986
• Hazardous Wastes (Management and Handling) Rules, 1989
• Manufacture, Storage and Import of Hazardous Chemical Rules, 1989
• The Forest (Conservation) Act, 1980
• The Forest (Conservation) Rules, 1981
• The Wildlife Protection Act, 1972
• The Wildlife (Transactions and Taxidermy) Rules, 1973
• The Wildlife (Stock Declaration) Central Rules, 1973
• The Wildlife (Protection) Licensing (Additional Matters for Consideration)
Rules, 1983
• The Wildlife (Protection) Rules, 1995
• The Wildlife (Specified Plants - Conditions for Possession by Licensee) Rules,
1995
• The Public Liability Insurance Act, 1991
• The Public Liability Insurance Rules, 1991
• The National Environment Tribunal Act, 1995
• The National Environment Appellate Authority Act, 1997
13.3 Environment Protection Acts and Rules
The Government of India enacted Environment Protection Act (EPA) in 1986 with
the objective of providing protection and improvement of the environment. It
empowers the Central Government to set up authorities with the assigned mandate
of preventing environmental pollution in all forms from any source and to combat
specific environment related problems that are unusual to different parts of the
country. The Act was last amended in 1991.
Under ‘The Environment (Protection) Rules, 1986’, following clauses mention
on the protection of natural resources from industrial activities which may also be
applicable on land/soil.
Clause 3. “Standards for emissions or discharge of environmental pollutants”.
Clause 5. “Prohibitions and restrictions on the location of industries and the
carrying on processes and operations in different areas. The Central government
13.3 Environment Protection Acts and Rules 377

may take into consideration the following factors while prohibiting or restricting
the location of industries and carrying on of processes and operations in different
areas.
(i) Standards for quality of environment in its various aspects laid down for an
area;
(ii) The maximum allowable limits of concentration of various environmental
pollutants (including noise) for an area;
(iii) The likely emission or discharge of environmental pollutants from an
industry, process or operation proposed to be prohibited or restricted
(iv) Environmentally compatible land use;
(v) Net adverse environmental impact likely to be caused by an industry,
process or operation proposed to be prohibited or restricted”.
13.4 National Environmental Policy 2006 (NEP 2006)
Our national commitment to a clean environment is mandated in Articles 48 A and
51 of Constitution of India. In response to these Articles, National Environmental
Policy 2006 was framed with objective of maintaining and enhancing the quality of
the environment. The policy also seeks to strengthen the management aspect of
environmental quality through building partnerships linkage among different stake-
holders, like local agencies, public institutions, scientific and academic communi-
ties, and international development partners. Section 5.3.1 of National
Environmental Policy 2006 (approved by the Union Cabinet on 18 May, 2006)
emphasizes the need to lay down different Environmental Standards; wherein
‘Environmental Standards’ refer both to the permissible levels of discharges of
specified waste streams by different classes of activities (“emission standards”), as
well as acceptable levels of particular environmental quality parameters at different
categories of locations (“ambient standards”). It also explicitly indicates that
environmental standards cannot be same and uniformly applicable for all countries;
and therefore, each country should set standards in accordance with national
priorities, objectives of national policies and available resources. In general,
these standards may vary, and become more stringent as country develops with
greater access to technologies and higher fund availability for environmental
management. Environmental standards need to relate with other measures for risk
alleviation in the country, so that a given societal obligation for resource allocation
delivers the maximum aggregate reduction in risk to environment.
In order to control soil pollution, NEP 2006 stressed following in their action
plans:
1. Developing appropriate techniques for treatment of toxic waste and hazardous
material and their safe disposal through secured landfills and incineration.
378 13 Soil Protection Policy

2. Developing a national inventory and setting up an online monitoring system to
keep record of toxic and hazardous waste movements and dumps
3. Addressing emergencies during chemical accidents arising out of transportation,
handling, and disposal of hazardous wastes.
4. Strengthening the capacities of local bodies and outsourcing of services like
waste segregation, recycling, and reuse.
5. Strengthening the waste collection system and recycling of various materials
through institutional finance and scientific technologies.
6. Reclamation of chemical contaminated land and promoting traditional crop
varieties through organic farming.
7. Promoting strategies for recycle and reuse concept through technological
advancement and substituting non-biodegradable materials with environmen-
tally safe biodegradable and recyclable resources
8. Developing and implementing guidelines and strategies for management of
e-waste.
9. Creating awareness and promoting beneficial utilisation of nonhazardous waste
materials such as red mud, fly ash, bottom ash, and slag in different
non-agricultural sectors.
In the action plan, however, nothing has been mentioned on the other important
issues like need for maintaining database on reference soil quality; combating
stresses created on soil through setting-up of industries and Special Economic
Zone (SEZs); policy on remediation of polluted soil etc.
13.5 Need for Soil Protection Policy
Soil, the uppermost layer of the earth crust, evolved through weathering action
during thousands to millions of years and provides basis for life on earth. Existence
and sustenance of quality of life depends on the quality of soil; and hence, there is a
need for a national policy towards protection and improvement of soil quality.
Above list of legislations indicate that no specific rule/policy has been enacted for
the purpose of protecting land/soil from human interferences and use of this
non-renewable resource. This may probably be because soil resources not being
direct major route of toxic pollutants entry into human beings. However, need for
‘Soil protection policy’ is urgently being felt because of two important reasons:
(1) soil is precious non-renewable resources for healthy life on earth and (2) reme-
diation of polluted land/soil (being an immobile matrix) is more difficult as
compared to other natural resources air and water. In order to move forward in
the direction of formulating ‘Soil protection policy’ for the country, there is a needto understand the important ecological functions performed by soil and the major
anthropogenic pressures acting on it.
13.5 Need for Soil Protection Policy 379

13.5.1 Basic Functions of Soil
• Soil is the storehouse of plant macro and micronutrients: Soil serves as
medium for plant growth and also habitat for soil micro flora and macro fauna.
It serves as a store house and moderates the release of nutrients and other
elements through chemical, biochemical and microbial processes. Various nutri-
ent cycling processes have greater impact on plant growth (for food, fodder and
timber production) soil fertility and agricultural sustainability as well as on other
components of environment.
• Soils to perform partitioning, filtering and regulation of water flow: Soil acts
as a filter before water moves into the underground aquifers, and flows into lakes
and streams before eventually ending up in ocean. Therefore, capacity of soil to
filter determines the quality of surface and ground water bodies. With proper
functioning, soil acts as hydrologic buffer and partitions water for groundwater
recharge and for use by plants and soil animals.
• Soil harbours biodiversity: A significant part of valuable soil functions is
carried out by the thousands of millions of organisms that inhabit within
it. These include bacteria, algae, fungi, nematodes, earthworms, insects etc.
Soil micro-organisms play a major role in soil formation; and therefore, soil
performs to sustains biological activity and diversity. Microbial decomposition
of existing soil organic matter or organic residue releases nutrients that are more
available to the plant. Microorganisms are considered a primary decomposer of
soil and perform its greatest functions in the global ecosystem. Microbial
decomposition of dead plants, animals, and organisms by soil biota converts
complex organic form of nutrient to simpler inorganic mineral forms, which are
then easily utilized by other living plants, animals, and microorganisms.
• Soils act as a sink for carbon: Due to burning of fossil fuel, deforestation and
large-scale urbanization, carbon dioxide emission post industrialization has been
constantly increasing and has reached to dangerous mark of imparting serious
environmental problems. Under natural process, carbon cycle is dynamic and
complex where carbon is released to the atmosphere from “carbon sources” and
again stored back in plants, animals, rocks, fossil fuel, soil and water as “carbon
sinks”. During soil carbon sequestration process, CO2 is removed from the
atmosphere and stored in the soil carbon pool. This process is mediated by
natural forest vegetation and agricultural crops that have the ability to fix
atmospheric carbon dioxide in leaves, shoots, and roots using energy from sun
through the process called “photosynthesis”. The carbon in the dead remains of
plant and microbial cells are temporarily locked in the soil profile against their
decay and thereby, help in reducing carbon di-oxide (CO2) concentration in the
atmosphere and global warming. Carbon addition and loss rates from soil depend
on several factors like soil type and condition, landscape topography, rainfall
pattern and temperature.
• Soils of the land also act as a sink for several toxic pollutants generated due
to anthropogenic activities:Metals which play significant role in our daily life,
380 13 Soil Protection Policy

are continuously being mined out from different natural geological deposits in
order to meet human and industrial needs. The wastes arising out from metal
mining and industrial processes are discharged profusely on the land surface in
the form industrial effluents and solid waste. Soil thus acts as a natural sink for
contaminants from various sources. However during their continuous entry over
a period time, the contaminants in soil reach to a level that poses risks to
environment and ecosystem service. Though each soil has a definite tolerable
limit (loading limit) for pollutants, these contaminate food chain and ground
water bodies once these limits are exceeded.
13.5.2 Threats to Soil and Issues of Soil Protection
Soil degradation, a result of natural process or anthropogenic activities is expanding
worldwide. It generally refers to the decline in soil’s inherent capacity to produce
economic goods and perform ecologic functions. Anthropogenic activities have not
only accelerated degradation processes, but also created new types of threats in
addition to natural degrading processes like desertification, erosion and saliniza-
tion. These new threats can be, broadly categorized into four areas:
(a) Land consumption
(i) Removal of upper fertile soil layer for brick making and for utilizing in
other developmental/constructional activities.
(ii) Sealing of land surface during development of infrastructure like housing,
commercial buildings, road and rail networks.
(b) Chemical pressure
(i) Entry of hazardous and toxic contaminants in soil through polluted water,
atmospheric deposition and precipitation.
(ii) Passage of contaminants into soil through amendments, chemical fertil-
izers and waste derived composts.
(iii) Illegal disposal of solid and liquid wastes.
(iv) Entry of contaminants via polluted groundwater like arsenic.
(v) Salinization from canal water seepage.
(vi) Nutrient imbalance in soil caused by mismatch between nutrient removal
from and addition to soil through fertilizers, resulting in loss crop produc-
tivity and produce quality.
(c) Physical pressure
(i) Soil compaction by excessive use of heavy machinery for agricultural
activities.
(ii) Loss of top-soil through erosion as a result improper soil management like
tilling along the slope and excessive tillage operation, faulty land use
13.5 Need for Soil Protection Policy 381

adoption, lack of surface mulching, crop cover and other soil conservation
measures during heavy rainfall etc.
(d) Biological pressure
(i) Introduction of genetically modified pathogenic or alien organisms, which
can adversely affect soil fertility and disrupt the ecosystem.
(ii) Decline in soil biodiversity
13.5.3 Key Considerations in the Formulation of SoilProtection Policy
1. Establishment of framework for monitoring soil quality
Scientific information on parameters representing qualitative state of soil
needs to be made available to create soil protection measures useful and
acceptable to those concerned. Minimum dataset for evaluation and their
quantification to indicate soil quality should be established for different
agroecosystems. Critical level of soil quality index for each agroecosystem
requiring urgent attention should be determined. Establishing a network of
permanent soil quality measuring stations can be helpful for follow-up moni-
toring which will form a basis for timely corrective actions at national or state
level.
2. Creation of reliable database on status of soil quality in different agro-
ecological regions of the country
A mechanism to monitor soil health may be created by constituting a high
power body like National Authority on Soil Health. A national level data
repository may be set up for effective monitoring and initiating protective
measures against degrading forces. Identification of land contaminated with
pollutants due to industrial or other anthropogenic activities is very important
for the policy makers so as to take necessary precautions and control measures
well in advance. Hence there is a need to develop database on background
concentration of pollutants which will help in detecting land in area that has
been contaminated due to the industrial, mining or other anthropogenic
activities.
3. Popularization of soil testing programme for polluted land areas
Although soil testing laboratories, both permanent and mobile type have
been established across the country to cater the need of farmers, the facilities
are grossly unequipped to measure parameters related to soil pollution. There is
need to revamp some of the existing soil test laboratories and/or establish new
soil testing laboratories with appropriately trained staff and modern equipments
for monitoring soil health of the land areas facing pressure from high
non-agricultural anthropogenic activities. Protocols for assessing risks from
polluted soils along with recommendations for farmers on appropriate soil and
382 13 Soil Protection Policy

crop management practices need to be developed for different agroecosystems.
Appropriate soil extractant and critical limits of different pollutants in soil
should be established through network research.
4. Appropriation of prudent steps to shield fertile soil from physical, chem-
ical and biological pressures
Priority objective of efficient soil protection measures should be to act at the
source. So better strategy is to prevent generation of the risks to the soil in the
first place, or at least, to avoid them as far as possible. All the individual,
organization and entrepreneurs associated with an activity that can directly or
indirectly impact soil quality, should be bound by the principle of precaution-
ary soil protection (i.e. exploring alternatives to possibly harmful action). This
policy should specifically be implied to authorities responsible for passing
regulations pertaining to the (i) manufacture or use of processes, materials,
organisms, equipment, machinery and automobiles that can harm the soil
ecosystem functioning; (ii) industries and related professions that produce,
sell or use such substances, organisms or devices; (iii) authorities that set
standards for emissions of particulate matters relevant to the soil quality
(e.g. air pollution control) or that plan, approve and monitor technological
and construction-related interventions affecting soil resource and its quality;
(iv) any individual who cultivates the soil as a farmer, gardener or forester, or
who damages the soil for construction purposes. As adequate soil organic
matter supports soil biodiversity that plays crucial role in combating the
adverse effects of soil pollution, policies need to be oriented towards popular-
izing recycling of aboveground organic wastes in the land. Conservation of
rainwater and soil moisture should be promoted through extension of technol-
ogies and supply of subsidized equipments (wherever required) to reduce
dependency on polluted water bodies for irrigation to crops nearby wastewater
generating activities.
5. Generation of awareness among all sections of society about the vital
functions of soil in the ecosystem and its vulnerability
Institutions and organizations at all levels, especially those imparting train-
ing and education to people in soil-related occupations (for example, farmers,
gardeners, construction managers and workers) may be associated to create
awareness on soil functions, threats perceived and its implications. A national
level nodal organization may be assigned the responsibility for devising a
framework and resource materials for such awareness program.
6. Sustainable, careful and cautious use of soil should only be permitted
Several vital functions are performed in the ecosystem by soil mass that has
been created over centuries of pedogenic processes. This non-renewable
resource is not available at will; and hence, must be used sparingly and
judiciously. Every time a new surface area of soil is sealed (for example during
housing, road construction, etc.), it represents a reduction in the finite resource.
Also, excessive use of agrochemicals (pesticides, herbicides, fungicides etc.),
application of soil amendments containing pollutants (municipal solid waste
composts, sewage-sludge composts, fly ash, basic slag etc.) degrade the
13.5 Need for Soil Protection Policy 383

functional quality of soils. Hence, soil protection policy must address these
issues while formulating rules/acts/guidelines. Maximum concentration limits
for each of such contaminated soil amendments need to be determined through
experiments. A special fund may be created to support research on soil protec-
tion issues with the help of compulsory contributions from industrial and
mining sectors as a part of corporate social responsibility.
7. Conservation of fertile soils during any developmental activities
As a state policy, soil should be declared as precious non-renewable natural
resource. Owner and user of land should have the duty to use and conserve this
precious resource properly. Mining and construction activities remove large
volume of top layer of fertile soil and generally dumped on nearby fertile land
along with stones and gravels dug from bottom layer damaging both productive
land and fertile dug-out soil. Appropriate guidelines are required for sepa-
rately conserving fertile top soil layers removed during mining & construction
activities and use these appropriately for growing vegetation wherever required
and for rehabilitating degraded land.
8. Remediation of contaminated soils must be accomplished to ascertain
whether all risks have been eliminated
Contaminated soils cause dangers to all strata of living beings including
humans, animals and crops and therefore, must not be left untreated. Financial
aspects, particularly high cost of technologies, make it difficult to accomplish
the remediation of soils contaminated with chemicals to the point where soil
multi-functionality is totally restored. Soil remediation therefore must focus on
averting risks and supporting minimum but safe farming operations. Soil
remediation objectives should incorporate changing or limiting farm land use
as well as provide technical support for contaminants removal or soil
replacement.
9. Responsibility soil protection should also lie on the owners of land
Like other natural resources like water, air and forests, soil is a common
national property, which may be utilized but not misused or damaged by its
owner. Farmers should adopt good agricultural practices like adoption of soil
conservation measures, in-situ rainwater harvesting, balanced use of nutrients,
adoption of integrated nutrient management system, incorporating leguminous
crops in the cropping system, improvement and maintenance of soil structure
though application of manures, following appropriate tillage practices etc.
Government and non-government organizations must be involved in creating
awareness among the farmers.
10. Enforcement of legal standards to ensure protection of soil resources in
terms of quantity and quality
A well devised set of legal instruments is needed to implement remedial
measures that are essential but not undertaken intentionally. This applies
especially to the interventions related to soil use methods that can bring
about irremediable harm to the society. Therefore, due consideration must be
given to ensure that soil protection is incorporated in the provisions regulating
permissible levels of emissions/release/addition in the legislation on
384 13 Soil Protection Policy

environmental protection like maximum permissible loading limits of heavy
metals and other pollutants in different soils types, maximum concentration of
heavy metals that can be allowed to receive materials derived from solid
wastes, sewage sludge etc., and also in regulations relating to utilization of
the soil (e.g. agriculture, construction, industry etc.).
11. Institutional framework for soil protection needs to be enhanced and
endowed with more budgetary and human resources
Presently, only a very small fraction of the funding is available for soil
protection as compared to other fields of environmental protection like water,
air, forests and landscapes. Significance of soil protection needs to be recog-
nized and supports from the environmental authorities, research and teaching
societies need to be increased.
12. Cooperation among the departments related to land use planning, agricul-
ture and forestry must be established for protection of soil resources
Without the supports from land use planning and forestry sector, it is
impossible to protect the soil. The agricultural sector on one hand damages
(to a limited extent) the soil ecosystem via its activities; while on the other
hand, it has an interest in ensuring that the soil remains healthy. As a policy,
efforts should be to direct agriculture towards more natural, environmentally
sound farming practices for crop diversification, nutrient, pest and weed man-
agement those support soil protection. Intensive utilization of forest resources
is putting forest soils at risk due to increased physical pressures. Land use
planning is responsible for assigning land to different uses. It should thus be
able, while drawing up structural plans and spatial plans, to promote types of
use that are in line with soil properties and its functional capacities. It should
also develop instruments/mechanisms to ensure more economical and careful
use of the land. A genuinely effective land use policy needs to be evolved
which should earmark areas not suitable for farming on economic grounds, and
therefore can be used for other purposes.
13. Environmental impact assessment of any industrial, infrastructural, min-
ing projects should compulsorily include soil health evaluation
Environmental Impact Assessment is pre-requisite for statutory clearance of
any project related to infrastructure, energy, industry, mining etc. which have
direct impact on environment. Very few experts involved in EIA are presently
having the academic background related to soil science, soil pollution and
remediation. Even NABET accredited training programmes don’t have trainingmodules related soil pollution-protection. Therefore, appropriate emphasis
should be given for involving soil scientists in EIA as well as in training of
experts involved in EIA on the subject of soil science, soil pollution and
remediation.
14. Creation and strengthening of infrastructural facility for soil pollution
assessment
As analysis of pollutants requires sophisticated and costly instruments and
reagents, few laboratories in the country are appropriately equipped with
instruments and soil experts to conduct soil pollution related monitoring and
13.5 Need for Soil Protection Policy 385

research. This is more relevant in case of National Agricultural Research
System of the country where emphasis is more on increasing agricultural
productivity. However, since non-agricultural anthropogenic (urban, industrial,
mining, transportation etc.) activities are increasing exponentially in the quest
of increasing GDP, instances of soil pollution is also expected to increase as a
side effect. This necessitates setting up of more research and monitoring
facilities and laboratories to address abovementioned researchable issues.
A ‘Soil Protection Policy’ if formulated and enacted at national level based
on above considerations, will certainly help to fulfill the objectives of recently
implemented India’s ‘National Mission for Sustainable Agriculture’. For this,consultation process needs to be initiated involving different stakeholders
including concerned research organizations, industry, farmers’, policy makers
as well as various concerned Government departments.
Reference
Karlen DL, Andrews SS, Doran JW (2001) Soil quality: current concepts and applications. Adv
Agron 74:1–40
386 13 Soil Protection Policy