Embed Size (px)
Citation preview

Jason D. Averill
Lori Moore-Merrell
Kathy A. Notarianni
Robert Santos
Doug Wissoker
Moderated by:
Dennis Compton
U.S. Department of CommerceGary Locke, Secretary
National Institute of Standards and TechnologyPatrick D. Gallagher, Director
May 2011 1

2

3
NIST Technical Note 1698
May 2011
National Fire ServiceData Summit
Proceedings
Jason D. Averill
Lori Moore-Merrell
Kathy A. Notarianni
Robert Santos
Doug Wissoker
Moderated by: Dennis Compton
U.S. Department of CommerceGary Locke, Secretary
National Institute of Standards and TechnologyPatrick D. Gallagher, Director

4
Certain commercial entities, equipment, or materials may
be identified in this document in order to describe an
experimental procedure or concept adequately. Such
identification is not intended to imply recommendation or
endorsement by the National Institute of Standards and
Technology, nor is it intended to imply that the entities,
materials, or equipment are necessarily the best available
for the purpose.
National Institute of Standards and Technology
Technical Note 1698
31 pages (May 2011)
CODEN:

5
Funding provided through DHS/FEMA’s Grant Program Directorate for FY 2009 Assistance to Firefighters Grant Program — Fire Prevention and Safety Grants.
This report is an output of the Multiphase Study on Firefighter Safety and Deployment team and reflects a joint effort between NIST, the Commission onFire Accreditation International-RISK, International Association of Fire Chiefs,
International Association of Fire Fighters, Urban Institute, and WorcesterPolytechnic Institute.

6

7
Effectively managing a fire department requires anunderstanding of and an ability to demonstrate howchanges to resources will affect community outcomes. It is
imperative that fire department leaders, as well as politicaldecision makers, know how fire department resource deploymentin their local community affects community outcomes in threeimportant areas: firefighter injury and death; civilian injury anddeath; and economic loss. To facilitate this, fire departmentleaders must have reliable statistical data useful for optimizationof response both prior to and during an incident. However, evenwith recent technological advances and substantial firedepartment efforts in data collection, the fire service is unable toscientifically quantify experiences to determine the relativeeffectiveness of different deployment configurations, including:type of emergency event, staffing levels/crew size, assetconfigurations, response time frames, frequency and manner ofpersonnel training, and fire prevention programs.
To address this situation requires the attention of researchscientists, policy makers and the firefighter community alike.Accordingly, the purpose of this project was to develop a technicalbasis for data collection and reporting to enable leaders to matchresource investments and resources deployed to the risks in thecommunity they serve. Stakeholders from across the fire serviceindustry, including firefighters and chiefs, data entry specialists,data vendors, local union leadership, federal agencies, insuranceindustry, and standards developing organizations, attended thesummit and contributed to the discussion. During the course ofthe summit, participants identified specific data needs fromdiffering stakeholder perspectives, identified data gaps whichhamper efforts to address the identified needs, and identifiedpossible steps to enable a technical basis for capturing data aboutthe resources deployed when firefighters and paramedics respondto fire and EMS events. These steps provide a roadmap to a futurewhere the fire service has performance data which supportscience-based decision-making.
Abstract

8

9
Table of ContentsAbstract ......................................................................................................................................................7
Contents ......................................................................................................................................................9
Background ..............................................................................................................................................11
Objectives ................................................................................................................................................13
Day 1 ..........................................................................................................................................................15
Session 1. Purpose and Goals of the Summit ..................................................................................15
Brainstorming Session: Obstacles to Operational Data Analysis ....................................................15
Brainstorming Session: Fire Department Performance Measures ..................................................15
Brainstroming Session: Data Elements ............................................................................................16
Session 2: Statistical and Experimental Data to Support Resource Deployment Decisions ......18
Background and Overview ..............................................................................................................18
Community Risk Model Elements ....................................................................................................18
Incident Data Collection....................................................................................................................19
Residential Fireground Experiments ................................................................................................19
What Was, What Could Have Been, What May Be ..........................................................................20
Session 3: Existing Gaps or Deficiencies in Data Collection Processes ......................................21
Burden ..............................................................................................................................................21
Usefulness........................................................................................................................................21
Motivation ........................................................................................................................................21
Accuracy ..........................................................................................................................................21
Day 2 ..........................................................................................................................................................22
Session 4: Develop Recommendations for Data Collection ..........................................................22
Group 1: Identify Candidate Data Elements/Metrics ........................................................................22
Group 2: Research Needs................................................................................................................22
Group 3: Recommendations Going Forward....................................................................................22
Summary of Group Discussion ........................................................................................................23
Session 5: The Path Forward ............................................................................................................24
Acknowledgments....................................................................................................................................26
Appendix A: List of Attendees ................................................................................................................27
Appendix B: Charts from Small Working Groups ................................................................................28
References ................................................................................................................................................30

10

11
Many fire departments across the nation are beingchallenged by budget crises, rising call volume, personneland equipment shortages, security issues and the overall
expectation to do more with less. Effectively managing thesechallenges requires a basic understanding of how changes inresources affect community outcomes. Specifically, it isimperative that fire department leaders, as well as politicaldecision makers, know how fire department resource deploymentin their local community affects community outcomes in threeimportant areas; firefighter injury and death, civilian injury anddeath, and property loss. However, even with recent technological advances andsubstantial fire department efforts in data collection, the fireservice is not yet able to scientifically quantify experiences todetermine the relative effectiveness of deployment decisions,including the type of emergency event, staffing levels/crew size,asset configurations, response time frames, frequency and mannerof personnel training, and fire prevention programs. A technical
basis must be developed to gather data that enables leaders tomatch resource investments and resources deployed to the risks inthe community they serve. Data gathered must be easilyaccessible, shared, and must follow necessary policy mandates.This symposium was part of the Multiphase Study on FirefighterSafety and Deployment Project. The study team has beenworking for several years to develop science-based tools for thefire service in order to optimize a fire service leader’s ability tomatch resources to risks. Incident data collection remains on thecritical path towards project success. After significant multi-yeareffort to collect fire and EMS incident data from a statisticalsampling of fire departments across the United States, thissymposium was arranged in order to not only share the projectteam findings with a broad stakeholder group (representative ofthe diverse needs and interests of the modern fire service), butalso document other data collection efforts, in order to identify aviable path to a national fire service data infrastructure.
Background
Participant Disclaimer: This report is a high-level summary of the discussions which occurred at the National Fire Service DataSummit. This report should not imply endorsement or support of the discussion or recommendations by any specific participant ororganization. At no time during the meeting was there a vote or any process which may be interpreted as consensus.

12

13
The objectives of the National Fire Service Data Summit werefour-fold:1. Gather information on data needs from a broad range ofparticipants.
2. Share the research experience of the Multiphase Study onFirefighter Safety and Deployment Project, with particularfocus on availability, collection, and interpretation of basicresource deployment data.
3. Discuss the need for and the potential utility of a national fireservice data collection and reporting system, with focus on thestakeholders.
4. Develop recommendations for data collection processes, aswell as data elements that can be consistently collected andanalyzed by local fire departments to enable measurement ofthe department’s availability, capability and operationaleffectiveness.
To accomplish these objectives, the summit was broken into fivesessions over two half-days. These proceedings follow thechronology of the summit. In Session 1, after a brief welcome andintroduction from Dr. Kathy Notarianni and Chief DennisCompton, the participants introduced themselves. The remainderof the session was dedicated to identifying obstacles to fire servicedata collection, performance measures, and data elements. InSession 2, the Multi-Phase Study team presented the results ofwork completed to-date, including findings from scientificliterature, fireground experiments, and an ongoing survey.Lessons-learned from the survey effort informed discussions forthe rest of the summit. In Session 3, participants discussed gapsand deficiencies in the existing data collection efforts. Thesedeficiencies were associated with an increased the burden to thefire service, the usefulness of the data, the motivation for enteringquality data, and the accuracy of the data. Session 4 started Day 2 of the summit. Participants weredistributed into one of three groups; 1) candidate data elementsor metrics, 2) research needs, and 3) recommendations goingforward. Each group met in parallel and then reported asummary back to the whole summit. The summit concluded witha group discussion of the key steps along the path toward anational fire service data set. Nine key action-oriented steps wereidentified, including which steps could be conducted in paralleland which steps required input from prior actions.
Objectives

14

15
The goal of the summit was to develop recommendations fordata collection processes, as well as a list of data elementsthat can be consistently collected and analyzed by local fire
departments in an effort to measure the department’s availability,capability, and operational effectiveness.Dr. Kathy Notarianni opened the workshop with a welcome tothe participants, a review of the agenda, and key logistical issues.Kathy discussed how each participant was invited specifically toshare their wisdom and their experiences related to fire servicedata. Kathy also spoke on how the group as a whole represented awide range of key stakeholder organizations such as: fire serviceleaders, city managers, the fire data industry, and organizationsthat currently collect fire data such as NFIRS and NFPA. Briefly,each of the participants introduced themselves, demonstrating thediversity of stakeholders present at the meeting. A list ofparticipants is shown in Appendix A. Chief Denny Compton, the moderator for the workshop,reviewed the needs, potential outcomes, challenges, and theoverall workflow for the summit. He began with a review of thecore values for the fire service noting that data collection shouldsupport evaluation and improvement of an individual firedepartment’s ability to deliver on basic core principles. Thesevalues, developed in consultation with fire service leaders during aprevious stage of the MultiPhase Study, include protection oflives, property and the environment, through preparedness,prevention, public education, and emergency response with anemphasis on quality services, efficiency, effectiveness, and safety.These principles framed and focused the subsequent discussion. The remainder of and central theme of Session 1 focused onfacilitated input from the participants as to what information isneeded in order to measure the performance of a fire department.It became clear from this input that there are significant needs inthe fire service community which could be addressed throughdata collection and analysis. These include data associated withcommunity risks and the deployment of fire departmentresources responding to those risks. The participants discussedhow consistent and high-quality data would support analysis toinform and optimize fire service decision-making.
BRAINSTORMING SESSION: DATA ELEMENTS
The participants identified numerous obstacles impeding theability of fire service leadership to analyze data in a way thatinforms deployment and standard-of-cover decisions, maximizesservice delivery to the community, minimizes risks to firefighters,and allows meaningful and informative outcome comparisonsbetween cities with similar demographics and capabilities. Aprimary challenge involves the differing methods for datacollection. Many fire departments collect similar data in differentways which is an obstacle to comparing outcomes between similarcommunities. This is due to the fact that several data collectionsystems serve purposes other than informing the fire service. Theobstacles identified by the group are summarized below.n The National Fire Incident Reporting System (NFIRS) wascreated after the America Burning Report in the 1970’s tocharacterize the incidence of fire in the United States. Limited
fire service response information is collected since theprimary purpose is to characterize the main attributes of thefire incident.
n Each individual fire department collects incident responseinformation for internal use and generally issues an annualreport. There are a variety of software vendors that supportthis enterprise. However, each vendor and each firedepartment, customize their data collection such that itgenerally cannot be easily or reliably compared between firedepartments.
n The Occupational Safety and Health Administration (OSHA)and many insurance companies require standardizedreporting for fire incidents that involve firefighter injuries.However, these reports are generated in varying formats,limited in availability and do not collect information aboutthe responses that do not result in firefighter injuries thuspreventing causal analysis.
n The National Emergency Medical Service Information System(NEMSIS) collects standardized data on pre-hospital EMSresponse and care and may be a role model for how to designand implement a national fire service database; however, thescope of this database currently precludes characterization ofthe typical response to a working fire.
n Although there may be local, regional, or state data reportingsystems which require fire service input, the lack ofstandardization presents a barrier to aggregation at thenational level.
n There is lack of adequate attention to data quality. Fire servicedata entry systems have multiple data entry points, are notconsistent in the quality of reporting and oversight, and havelimited use at the local level.
To address these obstacles, the summit participants focused onthree primary tasks:1. Identify operationally relevant data elements that can becollected by all fire departments.
2. Compile recommendations for data collection at the local firedepartment level and for vendors.
3. Identify pathways to compile quality data for research use atthe national level in an effort to inform policy at the locallevel.
BRAINSTORMING SESSION: FIRE DEPARTMENTPERFORMANCE MEASURES
The remainder of the first session consisted of brainstormingdevoted to identifying performance measures. Prior to startingthe discussion, three basic components of fire departmentperformance were proposed and defined for the participants:n Availability — The degree to which the resources are readyand available to respond.
n Capability — The abilities of deployed resources to managean incident.
n Operational Effectiveness — A product of availability andcapability, it is the outcome achieved by the deployedresources or the ability to match resources deployed to the
Day 1SESSION 1. PURPOSE AND GOALS OF THE SUMMIT

16
risks to which they are responding.For the remainder of the session, participants identifiedimportant characteristics of availability, capability, andoperational effectiveness, as shown below.
AVAILABILITYn Type of system – paid on call, volunteer, and career staffn Number of firefighters and staff employedn Count and consistency of resources available – variable orconstant staffing levels
n Intergovernmental protocols (mutual or automatic aid), priorarrangements, and legally defined agreements
n Time of dayn Ability to effectively communicate the type of event andidentify resource availability
nHow busy the units are – more runs means less availabilityn Define available – What time delay still counts as available?n Crew status questions: where are they, what are they doing,how many people, and are they with the apparatus?
n Number and type of equipment/apparatusn Properly maintained equipment/apparatus
CAPABILITYn Preparedness• Identify risks in the community• Surveillance to ID type of incident in order to define neededresources• Demands of what is being protected and the risk level• Standards to describe what resources are appropriate for agiven incident type• Extent of prevention activities that went into the systemprior to the event• Built-in fire protection systems• Infrastructure – roads and water supply
n Numbers and selected characteristics of people andequipment deployed • Certification and training level of responding personnel • Experience of personnel• How much equipment is deployed initially and in total
nWhat is the capacity of the resources? • Water supply characteristics – hose, tank size• Notification / dispatch system for incidents• Crew size per responding unit• Number/type of units responding
n Service level objectives (expectations) for the community, mayor may not match the risk• Acceptable community risk – tolerance of the community to loss
n Capability may vary throughout the course of the day due tochanging risks and/or resources (due to call volume)
n Other things that impact the ability to deploy – weather,traffic
n The impact of time, if resources cannot be applied in a giventime, may lose the opportunity to control the outcome
n Ability to identify when an incident started as a particularincident type and ended as another (level of escalation)
OPERATIONAL EFFECTIVENESSn Key critical tasks of any event – medical, hazmat, special ops, firen Conceptual model that links resources, incident type, andgoals
n Adequate staffing for critical tasks nMagnitude of incident or injury – sometimes no matter whatwe do or how quickly we get there, we cannot change theoutcome
n Coordination - Ability to properly coordinate the deployedresources
n Definition of effectiveness• What are the outcomes we are looking for?• Better definition or more accurate reporting of property loss• Define the situation at the time the fire department wascalled to measure the fire department impact• What we do versus what was inevitable
nMeasure of the vulnerability of the propertyn Time-to-task completion, defined tasksn Systems solution – our best efforts are impacted by otherpieces of the system — detection, notification, alarm handling— have great capacity for impacting effectiveness
n Recovery and salvage — capture the ability to take somethingat a point and prevent further damage
BRAINSTORMING SESSION: DATA ELEMENTS
Following the brainstorming session, the participants were askedto define specific data elements for each category both on anincident-specific and on a global scale. It can be seen from thedata elements summarized below, that of primary interest at theincident scale is accurate logging of key times of completion oftasks from time of call receipt through the completion of theresponse. At the global scale, the timeline is also of key interestalong with standardizing both terminology used and formats forcollecting data elements.
GLOBALnHow many firefighters and other staff are availablenWhat response agreements are in placen Standardized date/time formatsn Data elements in Commission on Fire AccreditationInternational (CFAI) needs assessment
n Budget of a particular department and how it compares withother departments of similar size and communitydemographics and with their outcomes
n Standardized terminology and data elementsn Standardized responses (resources deployed)n Three timelines, what the fire department is doing, timeline ofthe fire, and people on-site and their actions all intersect andimpact each other
n Cascade of events — NFPA1710, ISO, CFAI — some eventsare well timed through the organizations, need to identifyother things that are important from a research basis andmantain consistency
1 While all suggestions recorded during the workshop are captured in these summaries, the authors have combined redundant concepts or moved elements to theappropriate category in order to improve clarity.

17
n Events happen before fire department arrival that impact theoutcome of the incident; data should start with an idealizedtime line and boil down to those that can be collected orinferred
n Some understanding of the fact that some records should beexcluded due to data errors or outliers
n Need to measure the arrival conditions against the outcomesn Capability to capture modifications to unit capability during theday — (e.g. are they short a person during a patient transport?)
n Availability is hard to identify — it is difficult to capture whatresources were deployed — and difficult to capture the time ofeffective response force assembly
n Can show apparatus capability but harder to capturepersonnel credentialing over time
nWhat is the critical tasking for handling a particular risk inorder to measure effectiveness
n Proxy measures – (e.g. use of time)
INCIDENT SPECIFICn Turnout timen Response timen Comprehensive timeline for an incidentn Standardized benchmarks — such as call ring timen Pre-incident times — time of the event occurred that causedthe incident (e.g. when the pot was placed on the stove, ifpossible)
n Arrival time of the first apparatusn Time of arrival and assembly of effective fire fighting forcen Time of fire attack (water on fire)n At the patient’s bedside nHazmat timeframes (and other high risk, low frequencyevents)
nWhat was going on at the time of notification n Did crew respond from station — with or without AVL(automatic vehicle locator)
nWere all of the first-due units available when dispatched?n Impact of mutual aid – need to know about availability ofthose routinely used resources
nWhat’s happening with the firefighter when dispatched —weather — impacts travel times and personnel effectiveness
nMore detail on the incident (e.g. the condition of theproperty, the injury, severity, and characteristics of the person,the damage, and what it will take to make things right)
nMeasuring the outcomes – matching an injury to an eventnHow do we determine percent property lost or saved?n National EMS Information System (NEMSIS) and othersystem correlation to describe patient injuries and outcomes
n Property loss — insurance industry knows property loss —fire service needs better way to estimate loss

18
Day 1 SESSION 2. STATISTICAL AND EXPERIMENTAL DATA TO SUPPORT RESOURCE DEPLOYMENT DECISIONS
In Session 2, the principal investigators from the FirefighterSafety and Deployment Study presented their primary projectfindings with a focus on those relevant to the establishment ofbest practices for the fire service.
BACKGROUND AND OVERVIEWDr. Lori Moore-Merrell presented the overall chronology of themulti-phase project. The long-term objective of the project is tooptimize a fire service leader’s capability to deploy resources toprevent or mitigate adverse events that occur in a risk/hazardfilled environment. The study has accomplished several keymilestones in support of this objective. These include a
comprehensive literature review, identification of the keyelements of community risk, creation, implementation, andanalysis of a database for incident data collection, and conductand analysis of residential fireground experiments. First, a comprehensive literature review was conducted. Thisreview identified prior studies that have explored the underlyingfactors which ultimately affect three primary communityoutcomes: firefighter injuries and deaths; civilian injuries anddeaths; and property loss. This literature review may bedownloaded from the project website athttp://www.firereporting.org/studyreports.php .
COMMUNITY RISK MODEL ELEMENTSA critical step in this project was to create a community risk model that showed both the key elements of community risk and howthey related to one another. The model shown in Figure 1 and it’s elements are described below.
FIGURE 1: PROPAGATION OF COMMUNITY RISKn Prior Events: • The historical fire loss record and EMS response history for a community are starting points for predicting future outcomes.
n Community Description: • The demographics of a community have a strong correlation to the frequency and type of fires. These factors include populationdensity, median income levels, race, age and type of housing and other structures, road capacity, including natural barriers such asrivers or mountains, and others.• Response capacity of the fire department, including the number and location of stations, equipment and personnel, training,
n Prevention:• Community investments in prevention and inspection programs and mandated fire protection assets (fire hydrants, automaticsprinkler systems, e.g.)
n Event Characteristics• Initial assessment• Notification and dispatch time• Pre-arrival interventions n automatic suppressionnmanual (non-fire department) suppression or emergency aid• Response time and size of initial deployment• Capability of responding personnel• Total deployed assets
n Community Outcomes: Civilian and firefighter injuries and deaths and property losses

19
INCIDENT DATA COLLECTIONFollowing the overview, Dr. Lori Moore-Merrell reviewed thedesign and distribution of a customized incident survey. Theteam first reviewed existing data collection instruments, includingNFIRS and various commercial software packages, to determinehow to best leverage existing resources. Based upon the literaturereview, it was determined that no existing data collectioninstrument contained the breadth of data content that would benecessary to make statistically significant conclusions at thepolicy-level. Thus, the project team developed a comprehensivesurvey that could be posted on the web and accessed byparticipating fire departments around the country. In order to select a representative group of fire departments toparticipate, The Urban Institute designed a generalizablestatistical sample of over 400 fire departments. The sampling planwas designed assuming 75 % departmental participation as wellas the provision of 100 fire (working structure fires only) and 100EMS (ALS cardiac and trauma incidents only) incidents perdepartment (totaling about 33,000 fire and 33,000 EMSincidents). This database then formed the technical foundationfor a community risk-response model applicable to areas coveringover 75 % of the US population. Over a period of three years(which spanned the initiation and deepening of the U.S.economic recession), the recruitment process yielded a responserate of 18 % and produced 7,000 fire incidents and 7,000 EMSincidents. This response level fell short of the number ofincidents necessary to draw statistically valid conclusions aboutthe ability of a fire department to match resources to risks in thecommunity. While the effort to collect the necessary data throughthe custom survey continues, it underscores the need for anational database of science-based measures which are specificallydesigned to inform the U.S. fire service and local communitydecision-makers.
RESIDENTIAL FIREGROUND EXPERIMENTSThe study team designed an experimental program to establish ascientific foundation for the deployment of resources to structurefires, beginning with the most frequent and most deadly structurefire type: a low hazard detached single-family residence. Mr.Jason Averill described the purpose, methods, and findings fromNIST Technical Note 1661: Report on Residential FiregroundExperiments. The full report can be downloaded from the studywebsite at http://www.firereporting.org/studyreports.php. One purpose of the experiments was to validate the findings ofthe incident survey through parametric experimental designmethods. Conducting fire department response experimentscontrols for many of the factors which might otherwise confoundinterpretation of incident data in the real world. The experimentsallowed the same number of firefighters, arriving at the same timeto the same type of fire to be compared to the outcome when onlyone of those variables were changed. This maximizesunderstanding of the relative effects of response time and crewsize to various fire severities and provides validation and insight
into the results of the incident survey. Another purpose of theexperiments was to provide a technical basis for the NFPA1710/1720 standard (the national standards for the deployment offire service). The fire crews were always deployed using a total of fourapparatus: three engines and one truck plus a chief with an aide.The first-due engine arrival time was varied, the separationbetween the subsequent arriving apparatus and the crew size waschanged between experiments (two-, three-, four- andfive-persons per apparatus). Twenty-two tasks were identifiedand measured from time to initiate and complete for allexperiments. For overall scene time (time to complete all 22 fireground tasks),the four-person crews operating on a low-hazard structure firecompleted all the tasks on the fireground (on average) sevenminutes faster — nearly 30 % — than the two-person crews. Thefour-person crews completed the same number of firegroundtasks (on average) 5.1 minutes faster — nearly 25 % — than thethree-person crews. On the low-hazard residential structure fire,adding a fifth person to the crews did not decrease overallfireground task times. However, it should be noted that thebenefit of five-person crews has been documented in otherevaluations to be significant for medium — and high-hazardstructures, particularly in urban settings, and is recognized inindustry standards. There was a nearly 10 % difference in the “water on fire” timebetween the two- and three-person crews and an additional 5 %difference in the “water on fire” time between the three- andfour-person crews (i.e., 15 % difference between the four- andtwo-person crews). There was an additional 5 % difference in the“water on fire’” time between the four- and five-person crews(i.e., 20 % difference between the five- and two-person crews). The four-person crews operating on a low-hazard structure firecompleted laddering and ventilation (for life safety and rescue) 30% faster than the two-person crews and 25 % faster than thethree-person crews. The three-person crews started andcompleted a primary search and rescue 25 % faster than thetwo-person crews. The four- and five-person crews started andcompleted a primary search 6 % faster than the three-personcrews and 30 % faster than the two-person crew. A 10 %difference was equivalent to just over one minute.For occupant rescue, three different “standard” fires weresimulated using the Fire Dynamics Simulator (FDS) model.Characterized in the Handbook of the Society of Fire ProtectionEngineers as slow-, medium-, and fast-growth rate, the fires grewexponentially with time. The rescue scenario was based on anonambulatory occupant in an upstairs bedroom with thebedroom door open. Independent of fire size, there was a significant differencebetween the toxicity, expressed as fractional effective dose (FED),for occupants at the time of rescue depending on arrival times forall crew sizes. Occupants rescued by early-arriving crews had lessexposure to combustion products than occupants rescued by
2 As defined in the handbook, a fast fire grows exponentially to 1.0 MW in 150 seconds. A medium fire grows exponentially to 1 MWin 300 seconds. A slow fire growsexponentially to 1 MW in 600 seconds. A 1 MW fire can be thought-of as a typical upholstered chair burning at its peak. A large sofa might be 2 to 3 MWs.

20
late-arriving crews. The fire modeling showed clearly thattwo-person crews cannot complete essential fireground tasks intime to rescue occupants without subjecting them to anincreasingly toxic atmosphere. For a slow-growth rate fire withtwo-person crews, the FED was approaching the level at whichsensitive populations, such as children and the elderly arethreatened. For a medium-growth rate fire with two-personcrews, the FED was far above that threshold and approached thelevel affecting the general population. For a fast-growth rate firewith two-person crews, the FED was well above the median levelat which 50 % of the general population would be incapacitated.Larger crews can rescue most occupants before the worst effects ofatmospheric toxicity, particularly with slow- and medium-growthrate fires. Statistical averages should not, however, mask the factthat there is no FED level so low that every occupant in everysituation is safe.
WHAT WAS, WHAT COULD HAVEBEEN, WHAT MAY BE
AN ANALYSIS OF INCIDENT DATA
For the final segment of the second session, Mr. Robert Santospresented the preliminary results of a statistical analysis of theavailable incident data. The session was titled “What Was, WhatCould Have Been, and What May Be” to reflect the small numberof incidents available from which to generate statisticallysignificant conclusions. However, the analysis was important inorder to explore the potential for how quantitative analysis mightreveal insights into improved outcomes for service delivery by firedepartments across the country. As noted previously, the customized incident data collectionproduced roughly 7,000 of each incident type (fire and EMS).These data were insufficient as they did not total the number ofincidents required for powerful statistical analysis. Therefore, theresearch team pursued an alternative approach which may yieldthe appropriate number of incidents, albeit with fewer dataelements. In other words, lacking quantity in the comprehensivesurvey, the team used a standard data extract to produce therequisite quantity of data using custom extracts from FireHouseand ZOLL customers. In this way, the research team obtained anumber of 2009/2010 events which met the inclusion criteria witha relatively simple data extraction. However, inspection of theavailable data revealed quality concerns in the 8,000 fire eventsincluded in the data. Therefore, lacking quantity in the firstapproach and quality in the second approach, the findingspresented at the symposium were used for illustrative analysesonly.A statistical model was developed to identify critical factorspredictive of civilian or firefighter injuries or property loss. Theillustrative model controlled for property value, total equipmentdeployed, initially deployed, total deployed (for loss only), travel
time, total staff deployed (for injuries only), structure type, andpopulation density. Before regressing, investigators took thenatural log of dependent variables (loss and number injuries) and“amounts” (initial and total equipment, property value). Finally,the illustrative analysis accounted for department level clustering.While the “findings” are not repeated here (remember that theywere illustrative only and lacked statistical power worthy ofreprint), relationships between key deployment variables andoutcomes seemed plausible and were promising of insight if onlymore event data were available. An environmental limitationlikely to challenge the interpretation of any statistical analysis isthat of “endogeneity.” Endogeneity occurs when environmentalvariables (which are supposed to be independent of theoutcomes) are correlated with the outcomes. For example, agreater total number of apparatus and firefighters would bedeployed to a mature working fire that had spread prior the call todispatchers. The higher deployment numbers do not cause thehigher loss; it is the higher magnitude of the event which isproducing higher deployment values (endogeneity).In conducting the statistical analysis of incident data, severalchallenges were identified which bear further discussion at thesymposium. First, there were many missing key data items.Missing data were found in all data elements and somedepartments had as much as 60 % of their data missing.Additionally, there were unusable/implausible data from 12 of the40 departments, such as property values of zero, crew sizes of oneon engines, trucks, quints, within department deploymentconfigurations, and implausibly low event numbers. Finally, therewere inconsistent data interpretations, including the coding oftimes and structures.The EMS data were unusable based on NFIRS extraction, despitethe availability of 51,000 events. This dilemma was primarily dueto the fact that the “patient status” field, the key outcome dataitem, was optional, and therefore almost entirely missing from thedataset. Missing data for optional fields provides a powerfullesson about the methods of data collection which are likely to besuccessful; in other words, when given an options, mostparticipants opted-out. The research team also learned from the custom incident surveythat “patient improvement” is complicated. Traditional measuressuch as pulse are often dependent on the patient’s overallcondition and are difficult to interpret as a standard (e.g., what isan “optimal pulse”?) and the database was often missing a secondset of vitals from which to measure change in the patientcondition.In summary, a national database for fire service deployment isnot simply an issue of “more data.” We need better data. Datacollection would likely benefit from standardization. Data entryis not uniformly appreciated by participating departments andthis situation should be addressed nationally as a change in theculture of the fire service. Information management systemscould benefit from technical training, quality assurance practices(process control), and higher priority from leadership.
3 Certain commercial entities, equipment, or materials may be identified in this document in order to describe an experimental procedure or concept adequately. Suchidentification is not intended to imply recommendation or endorsement by the National Institute of Standards and Technology, nor is it intended to imply that theentities, materials, or equipment are necessarily the best available for the purpose.
21
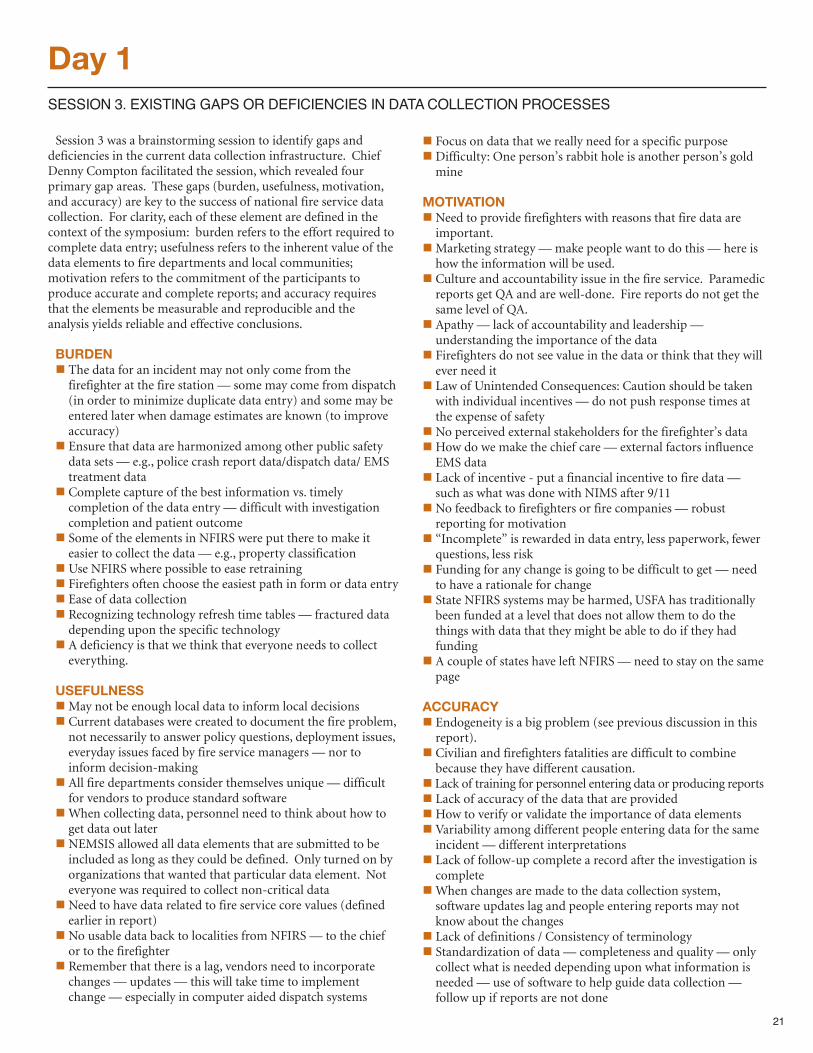
Session 3 was a brainstorming session to identify gaps anddeficiencies in the current data collection infrastructure. ChiefDenny Compton facilitated the session, which revealed fourprimary gap areas. These gaps (burden, usefulness, motivation,and accuracy) are key to the success of national fire service datacollection. For clarity, each of these element are defined in thecontext of the symposium: burden refers to the effort required tocomplete data entry; usefulness refers to the inherent value of thedata elements to fire departments and local communities;motivation refers to the commitment of the participants toproduce accurate and complete reports; and accuracy requiresthat the elements be measurable and reproducible and theanalysis yields reliable and effective conclusions.
BURDENn The data for an incident may not only come from thefirefighter at the fire station — some may come from dispatch(in order to minimize duplicate data entry) and some may beentered later when damage estimates are known (to improveaccuracy)
n Ensure that data are harmonized among other public safetydata sets — e.g., police crash report data/dispatch data/ EMStreatment data
n Complete capture of the best information vs. timelycompletion of the data entry — difficult with investigationcompletion and patient outcome
n Some of the elements in NFIRS were put there to make iteasier to collect the data — e.g., property classification
n Use NFIRS where possible to ease retrainingn Firefighters often choose the easiest path in form or data entry n Ease of data collectionn Recognizing technology refresh time tables — fractured datadepending upon the specific technology
n A deficiency is that we think that everyone needs to collecteverything.
USEFULNESSnMay not be enough local data to inform local decisions n Current databases were created to document the fire problem,not necessarily to answer policy questions, deployment issues,everyday issues faced by fire service managers — nor toinform decision-making
n All fire departments consider themselves unique — difficultfor vendors to produce standard software
nWhen collecting data, personnel need to think about how toget data out later
n NEMSIS allowed all data elements that are submitted to beincluded as long as they could be defined. Only turned on byorganizations that wanted that particular data element. Noteveryone was required to collect non-critical data
n Need to have data related to fire service core values (definedearlier in report)
n No usable data back to localities from NFIRS — to the chiefor to the firefighter
n Remember that there is a lag, vendors need to incorporatechanges — updates — this will take time to implementchange — especially in computer aided dispatch systems
n Focus on data that we really need for a specific purposen Difficulty: One person’s rabbit hole is another person’s goldmine
MOTIVATIONn Need to provide firefighters with reasons that fire data areimportant.
nMarketing strategy — make people want to do this — here ishow the information will be used.
n Culture and accountability issue in the fire service. Paramedicreports get QA and are well-done. Fire reports do not get thesame level of QA.
n Apathy — lack of accountability and leadership —understanding the importance of the data
n Firefighters do not see value in the data or think that they willever need it
n Law of Unintended Consequences: Caution should be takenwith individual incentives — do not push response times atthe expense of safety
n No perceived external stakeholders for the firefighter’s datanHow do we make the chief care — external factors influenceEMS data
n Lack of incentive - put a financial incentive to fire data —such as what was done with NIMS after 9/11
n No feedback to firefighters or fire companies — robustreporting for motivation
n “Incomplete” is rewarded in data entry, less paperwork, fewerquestions, less risk
n Funding for any change is going to be difficult to get — needto have a rationale for change
n State NFIRS systems may be harmed, USFA has traditionallybeen funded at a level that does not allow them to do thethings with data that they might be able to do if they hadfunding
n A couple of states have left NFIRS — need to stay on the samepage
ACCURACYn Endogeneity is a big problem (see previous discussion in thisreport).
n Civilian and firefighters fatalities are difficult to combinebecause they have different causation.
n Lack of training for personnel entering data or producing reportsn Lack of accuracy of the data that are providednHow to verify or validate the importance of data elementsn Variability among different people entering data for the sameincident — different interpretations
n Lack of follow-up complete a record after the investigation iscomplete
nWhen changes are made to the data collection system,software updates lag and people entering reports may notknow about the changes
n Lack of definitions / Consistency of terminologyn Standardization of data — completeness and quality — onlycollect what is needed depending upon what information isneeded — use of software to help guide data collection —follow up if reports are not done
Day 1 SESSION 3. EXISTING GAPS OR DEFICIENCIES IN DATA COLLECTION PROCESSES

22
Day 2SESSION 4. DEvELOP RECOMMENDATIONS FOR DATA COLLECTION
To begin the second and final day of the symposium, theparticipants were divided into three groups for parallel discussionsessions. The first group focused on identification of candidatedata elements and their associated metrics. While identifyingexisting metrics was key, identifying gaps where concepts are notcurrently well-measured is also important in order to initiatemetric development research. The second group was tasked with identifying overall researchneeds. These results may help agencies or researchers prioritize afuture research agenda. Finally, the third group was tasked withidentifying the key steps on the path forward at the conclusion ofthe symposium. At the conclusion of the small group sessions,one representative orally summarized the results for the benefit ofthe entire group. The combination of these three working groupsinformed the final session, in which participants discussed how toachieve the goal of a national fire service data collection andreporting system. The oral summaries are presented here whilethe raw information captured on the easels (notes from eachgroup) is presented in the appendices.
GROUP 1: IDENTIFY CANDIDATE DATAELEMENTS/METRICSThe first group was tasked with identifying critical data elementsand metrics necessary to enable fire service leadership andcommunity leaders to conduct community risk analysis andmatch the necessary resources to those risks. Dr. Clay Mannsummarized the findings of the group by indicating that dataelements and metrics should consider the following desirableattributes:n Collect response times at the unit level separate from theincident
n Better assessment of risks to which firefighters are responding nHarmonization of code sets with other public data sets n Electronic data collection rather than paper-based n Ability to geocode an incident to census tract data to betterdescribe the environment
n Integration of other data sets on an incident that could bemerged with the fire data without the need for reentry
n Capture prior calls to which fire personal responded in orderto account for fatigue
n Condition of the apparatusn Dispatch system n Situation upon arrival — is the fire out?n Description of building, including the degree ofcompartmentation, fire protection systems, etc…
nHow many firefighters are on the scene at any given time(with electronic time stamp)
n Strategy implemented (defensive or offensive fire attack?)n Time stamp with compliance with protocolsSpecific data elements and metrics are shown in the appendix.
GROUP 2: RESEARCH NEEDSThe second group was tasked with identifying key research needsthat relate to data collection and performance measures for thefire service. Chief Randy Bruegman summarized the findings forthe group, which included a list of research priorities:nHow do we benchmark fireground tasks that are completed,capture those benchmarks, and relate them to the outcome ofthe incident?
nHow do we find and integrate pieces of data that happenbefore the incident which impact the incident, such as age ofstructure, occupant characteristics, and buildingmaintenance?
nHow do we best use post-incident analysis to inform futuredeployment decisions?
nWhat fire department activities have the most impact on theoutcome of the incident? What type of fire service investmentin community prevention activities gives the best bang for thebuck? What are proper metrics to evaluate preventioneffectiveness?
nHow do we optimize of the utilization of our resources,including efficient use of firefighter and fire companydown-time or alternative deployment strategies?
nWhat will the demands on the fire service be 20 years fromnow? Can we anticipate them?
n In view of our expanding mission, what are the impacts ofsprinkler mandates and retrofits (or lack there of) ondeployment?
n Does acceptance of risk differ by community and how do wemeasure and what are the right questions?
nHow do we create models of efficiency (consolidation,mergers, redundancy of resources) where it is needed and howdo we assess change?
nHow do you know when you have it right? What does successlook like? Would success differ by community?
nHow do we make a connection between prevention andoperational outcomes (firefighter safety / civilian safety /property loss)?
nHow do we measure the impact of multiple agenciesoperating together?
GROUP 3: RECOMMENDATIONS GOING FORWARDDr. Greg Mears summarized the recommendations from Group 3. Anational database for the primary benefit of fire departments andlocal leadership is needed. The database would be used to drive andoptimize local policy and deployment of resources. The nation needsa system that describes attributes of the fire service, description ofincidents, and community outcomes — in other words, a completedescription of the sandbox where all of this occurs. The nationaldatabase would be developed through a consensus process where allagree on the key data elements and metrics, all can use and analyzethe data, establish quality assurance, and provide for an automatedprocess to move data through the system from local to a nationaldatabase with minimal burden on the participants. The groupdivided the problem into three categories: the front-end (data entryand user interface), the data system (storage and retrieval of data),and the back-end (data analysis and visualization).

23
The front-end issues include the need to develop andcommunicate standard definitions, ensuring that currentstandards for definitions used in other disciplines or standardsdocuments are preserved (when possible). The user interface forsoftware needs to be intuitive and easy-to-use, including businesslogic. Industry should develop a consensus for a minimum dataset (number of elements required in order to submit an incident),but with capability for local preferences and customization to becaptured. When possible, the system should leverage automaticentry — objective information from devices and instruments - inorder to avoid the need to enter the same data more than once.This minimizes burden to the data entrant and minimizes theopportunity for errors. The front-end needs to consider the timeneeded to complete data entry in order to improve timeliness ofentry, and consequently the timeliness of access to information —completeness and consistency checks during data entry can beflagged in real-time to ensure accurate up-front entry.Additionally, a standardized interface should be considered tominimize the difficulty of using new software packages. Finally,the fire service should create a culture of ownership over thequality of the data process. For example, making data entrycompleteness and accuracy a part of employeeevaluation/promotional process would positively affect keyaspects of data entry. The data system should allow for peer review — a qualifiedcritical evaluation of the data. Peer-review protection, similar tothose that exist for medical data entry would protect thepersonnel involved in the process and engender improvement. Anational standard with which vendors could demonstratecompliance (possibly through third-party certification) wouldprovide common functionality and ensured performance to theuser (somewhat like a seal of approval) while allowing foroptional differentiation among the vendor software outside thestandard components. The data system should also have thefollowing attributes: n Ease of configuration and maintenance, n Available on multiple platforms, n Ability to insert business rules in the dataset to assurecompletion,
n Ease of customization beyond standard for local needs (e.g.,keeping track of moose / vehicle incidents in Maine), and the
n Ability to merge and manage multiple data standards (as theychange over time).
The back-end of the national data infrastructure should enabletimely reporting and:n Ensure robustness and flexibility of query, n Ensure knowledge of completeness and quality, n Enable standards for important reports (to ensurecomparative capability across jurisdictions)
n Enable standards for archiving data, n Enable exchanging data across systems, n Provide the ability to move data from the local to regional tostate to national systems, and
n Be automated with intrinsic quality controls.
Ideally, there would also be international harmonization andbenchmarking of performance levels for all departments.
SUMMARY OF GROUP DISCUSSIONWhile the goal of a national database for the fire service wasmuch too complicated and important to finalize within the shortamount of time left in Session 4, a number of important pointswere raised. First, in order to maximize the opportunity for success, thereneeds to be a consensus process that involves the full range ofstakeholders. The fire community needs to develop anatmosphere of ownership and empowerment that includescommunicating that the positives of quality data will outweighnegatives. The process for data collection and exchange must be carefullyconsidered. A working group could identify best technologies andmethods — look at what is there, listen, and pick the best andgravitate towards proven technology. Also, using lessons learnedfrom sectors that have developed national databases (e.g. ERvisits, cancer screening, NEMSIS) can minimize the challengesgoing forward.The process for data collection and exchange must also providebase application on the web or provide a common path for accessin order to maximize participation so that jurisdictions with smallor tight budgets will still have access to the minimum dataelements and functionality. The process for data collection and exchange must find ways todrive adoption through strong leadership. If the stakeholders areunited in message and believe in the value of the effort, theopportunity for success will be improved. Mechanisms toincrease participation should consider the efficacy of both carrots(e.g. federal programs or grants), as well as sticks (e.g. regulationsor losing access to grant programs). For adoption at state or locallevel, model legislation / regulations could be developed to assistwith implementation.Finally, different roles for current stakeholders should beconsidered including a data flow where local departments couldreport directly to the national level, data could flow back to thestates and the national level data center could then coordinatereporting information and recommend data for policy ratherthan having these coordinated at the state level.
24
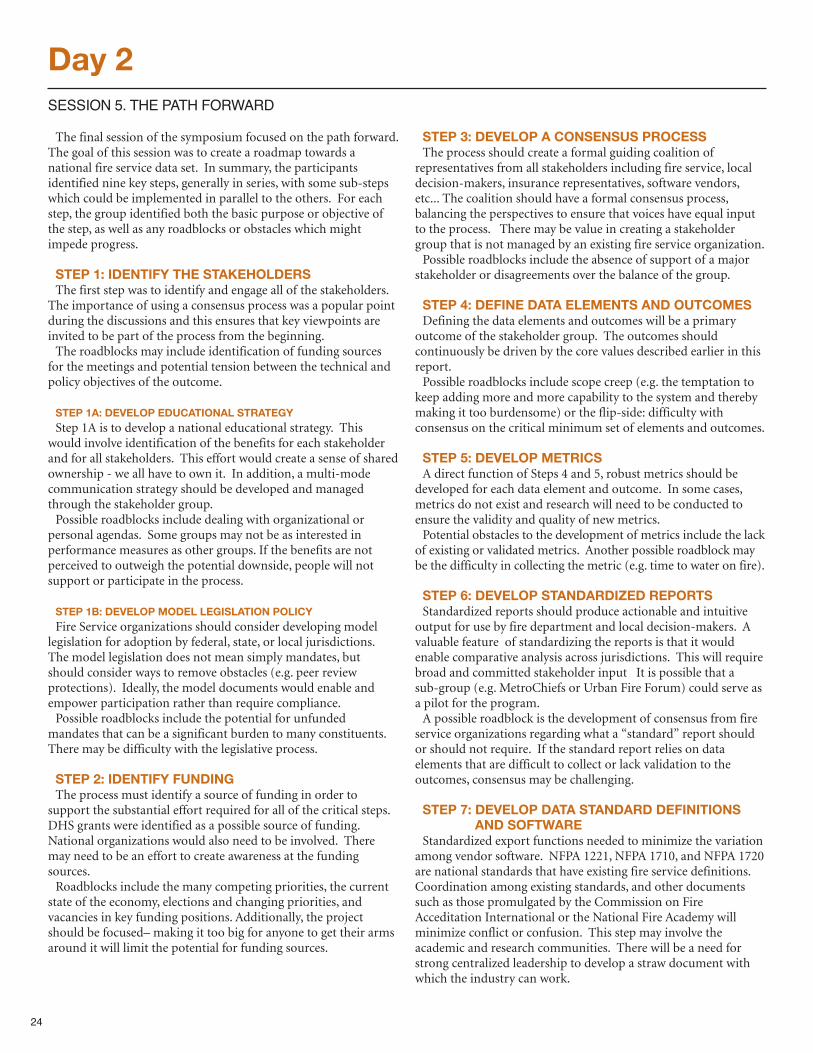
The final session of the symposium focused on the path forward.The goal of this session was to create a roadmap towards anational fire service data set. In summary, the participantsidentified nine key steps, generally in series, with some sub-stepswhich could be implemented in parallel to the others. For eachstep, the group identified both the basic purpose or objective ofthe step, as well as any roadblocks or obstacles which mightimpede progress.
STEP 1: IDENTIFY THE STAKEHOLDERSThe first step was to identify and engage all of the stakeholders.The importance of using a consensus process was a popular pointduring the discussions and this ensures that key viewpoints areinvited to be part of the process from the beginning. The roadblocks may include identification of funding sourcesfor the meetings and potential tension between the technical andpolicy objectives of the outcome.
STEP 1A: DEVELOP EDUCATIONAL STRATEGYStep 1A is to develop a national educational strategy. Thiswould involve identification of the benefits for each stakeholderand for all stakeholders. This effort would create a sense of sharedownership - we all have to own it. In addition, a multi-modecommunication strategy should be developed and managedthrough the stakeholder group. Possible roadblocks include dealing with organizational orpersonal agendas. Some groups may not be as interested inperformance measures as other groups. If the benefits are notperceived to outweigh the potential downside, people will notsupport or participate in the process.
STEP 1B: DEVELOP MODEL LEGISLATION POLICYFire Service organizations should consider developing modellegislation for adoption by federal, state, or local jurisdictions.The model legislation does not mean simply mandates, butshould consider ways to remove obstacles (e.g. peer reviewprotections). Ideally, the model documents would enable andempower participation rather than require compliance. Possible roadblocks include the potential for unfundedmandates that can be a significant burden to many constituents.There may be difficulty with the legislative process.
STEP 2: IDENTIFY FUNDINGThe process must identify a source of funding in order tosupport the substantial effort required for all of the critical steps.DHS grants were identified as a possible source of funding.National organizations would also need to be involved. Theremay need to be an effort to create awareness at the fundingsources.Roadblocks include the many competing priorities, the currentstate of the economy, elections and changing priorities, andvacancies in key funding positions. Additionally, the projectshould be focused– making it too big for anyone to get their armsaround it will limit the potential for funding sources.
STEP 3: DEVELOP A CONSENSUS PROCESSThe process should create a formal guiding coalition ofrepresentatives from all stakeholders including fire service, localdecision-makers, insurance representatives, software vendors,etc... The coalition should have a formal consensus process,balancing the perspectives to ensure that voices have equal inputto the process. There may be value in creating a stakeholdergroup that is not managed by an existing fire service organization.Possible roadblocks include the absence of support of a majorstakeholder or disagreements over the balance of the group.
STEP 4: DEFINE DATA ELEMENTS AND OUTCOMESDefining the data elements and outcomes will be a primaryoutcome of the stakeholder group. The outcomes shouldcontinuously be driven by the core values described earlier in thisreport. Possible roadblocks include scope creep (e.g. the temptation tokeep adding more and more capability to the system and therebymaking it too burdensome) or the flip-side: difficulty withconsensus on the critical minimum set of elements and outcomes.
STEP 5: DEVELOP METRICSA direct function of Steps 4 and 5, robust metrics should bedeveloped for each data element and outcome. In some cases,metrics do not exist and research will need to be conducted toensure the validity and quality of new metrics.Potential obstacles to the development of metrics include the lackof existing or validated metrics. Another possible roadblock maybe the difficulty in collecting the metric (e.g. time to water on fire).
STEP 6: DEVELOP STANDARDIZED REPORTSStandardized reports should produce actionable and intuitiveoutput for use by fire department and local decision-makers. Avaluable feature of standardizing the reports is that it wouldenable comparative analysis across jurisdictions. This will requirebroad and committed stakeholder input It is possible that asub-group (e.g. MetroChiefs or Urban Fire Forum) could serve asa pilot for the program.A possible roadblock is the development of consensus from fireservice organizations regarding what a “standard” report shouldor should not require. If the standard report relies on dataelements that are difficult to collect or lack validation to theoutcomes, consensus may be challenging.
STEP 7: DEVELOP DATA STANDARD DEFINITIONSAND SOFTWARE
Standardized export functions needed to minimize the variationamong vendor software. NFPA 1221, NFPA 1710, and NFPA 1720are national standards that have existing fire service definitions.Coordination among existing standards, and other documentssuch as those promulgated by the Commission on FireAcceditation International or the National Fire Academy willminimize conflict or confusion. This step may involve theacademic and research communities. There will be a need forstrong centralized leadership to develop a straw document withwhich the industry can work.
Day 2SESSION 5. THE PATH FORWARD

25
Possible roadblocks include the time that might be required toproduce the standard reports or the difficulty in reconcilingalready conflicting definitions in the fire service community.
STEP 8: EXPLORE OTHER DATA SYSTEMS ANDTECHNOLOGIES
All available data systems and technologies should beconsidered. Major vendors should be a key component inidentifying the strengths and weaknesses of alternativeapproaches. At this stage, having enough resources in a centralplace and identifying where the data is and how it can coexist withother data systems will be critical to success.Possible roadblocks include the constraints imposed bynecessary integration with other data systems, scalability, cost,robustness, and security. Some data systems are local or state (e.g.realtors, property managers) and will require a high degree ofcoordination. Some external data systems may be in conflict withprogram goals.
STEP 8A: LINK AND EXTRACT FROM OTHERNATIONAL DATABASES
Ensure that programming allows for the seamless import andexport of data. Move in the direction of making key fields morecompatible with existing software. Identify who does what andwho gets access to data at various steps.Roadblocks include methodology of data exchange, that mayinfluence the path that data take to the central database, security(authentication and verification), the need to stay current asexternal systems evolve, and possible battles among serviceproviders.
STEP 9: DEVELOP NATIONAL FIRE SERVICE DATA SYSTEM
Finally, the national database will need to develop a significantinfrastructure – possibly requiring two-way state support andtechnical assistance center responsive to all stakeholders. Roadblocks may include maintenance of effort to get to the finalgoal, ownership and maintenance costs required to sustaincontinued operations, and buy-in from all of the stakeholders.

26
Acknowledgments
Kevin Roche — Phoenix Fire Department (official scribe at the summit)
Kristin Davis — IAFF (Slide template agenda layout and Proceedings Report layout)
Sandy Henderson — IAFF (slide content and video set up)
Hongxia Ma — IAFF (video splicing/audio files)
Ray Ranellone —WPI (meeting coordination assistant)
Stephanie Rennane — UI (research assistant)

27
Appendix A: List of Attendees
Marty AhrensManager, Fire Analysis ServicesNational Fire Protection Association
Jason D. AverillLeader, Engineered Fire Safety Group National Institute of Standards andTechnology
Rick BlackProgram ManagerCenter for Public Safety Excellence
Kurt BressnerCity ManagerCity of Boynton Beach
Paul D. BrooksExecutive DirectorCFAI-Risk, Inc.
Chief Randy BruegmanFire ChiefAnaheim Fire Department
Christian Callsen Jr.Chief Operating OfficerThe Optima Corporation
Teri CaswellManagement Analyst IIFairfax County Fire and RescueDepartment
Robert W. CobbNational Director, Risk Decision ServicesISO
Chief Dennis ComptonChairmanNational Fallen Firefighters Foundation
Richard K. FaganTechnical Advisor Program ManagerCenter for Public Safety Excellence
Traci FrazerComputer Support SpecialistITS
Dan GreensweigAssociate AdministratorNational League of Cities
Peter L. GormanChief of StaffInternational Association of Fire Fighters
Jay GunsaulsDirector of TrainingEmergency Reporting
John R. Hall, Jr., Ph.D.Division Director, Fire Analysis andResearchNational Fire Protection Association
Elizabeth HarmanAsst. Administrator, Grant ProgramsDirectorateU.S. Department of HomelandSecurity/FEMA
Sanjay S. KalasaVice PresidentFIREHOUSE Solutions
Shawn S. KelleyDirector Strategic ServicesInternational Association of Fire Chiefs
Dennis B. LightAssistant Fire ChiefYuma Fire Department
N. Clay Mann, Ph.D., MSAssociate Director of ResearchProfessor, Department of PediatricsNational EMS Information SystemTechnical Assistance Center
Greg Mears, MDAssociate Professor & North Carolina EMSMedical DirectorUniversity of North Carolina-Chapel Hill
Chief William MetcalfTreasurerInternational Association of Fire Chiefs
Bruce J. Moeller, Ph.D.City ManagerInternational City/County ManagementAssociation
Lori Moore-Merrell, DrPH, MPHAssistant to the General PresidentInternational Association of Fire Fighters
Raj Nagaraj, Ph.D.Vice President of EngineeringDeccan International
Jim NarvaExecutive DirectorNational Association of State Fire Marshals
Kathy A. Notarianni, Ph.D., P.E.Head, Dept. of Fire Protection EngineeringWorcester Polytechnic Institute
Brad PabodyChief, National Fire Data CenterU. S. Fire Administration
Raymond Ranellone Jr.Worcester Polytechnic Institute
Kevin RocheAssistant to the Fire ChiefPhoenix Fire Department
Paul RottenbergFireStats
Robert SantosSenior Institute MethodologistThe Urban Institute
Stewart SmithProduct ManagerZoll
Debbie SobotkaDeputy DirectorCenter for Public Safety Excellence
Todd TuttleGreensboro Fire Department
Doug WissokerSenior Research AssociateThe Urban Institute

28
Appendix B: Charts from Small Working Groups
CHART NOTES FROM GROUP 1: IDENTIFYCANDIDATE DATA ELEMENTS AND METRICSA — Initial Deployment MeasuresB — At SceneC — OutcomesFramework — Context — 1) What we do, 2) When done, 3) Whatoutcome
• NFPA 1221• Turnout time by units• Travel time by/unit• Effective response force • Define risk of response• Population density of response• ICD9 codes• ICD10 codes• SnoMed codes• Rx codes• Staffing total number• Training - type/amount of time — structural, EMS, Hazmat• Age, years of experience• Census block• Topography, physical access• Demographics• Certifications• Crew size• Environmental factors• Unit level specifics• Initial response force• Outcomes• Census tract• Geocode data• Response time• PSAP challenge• Call processing tracking and pickup• Standards/Policy Compliance• Time Stamp/Outcomes — what, when, effect• Condition of apparatus• Condition of firefighters• Dispatch method• Location of apparatus• Census block data• Situation upon arrival• Compartmentation• Change in flame spread• Threshold• Defensive• Firefighter injuries - lost time
CHART NOTES FROM GROUP 2: RESEARCH NEEDS• Capture expansion of tasks on deployment model• Comparison of crew size, i.e. 2 person crew with quickresponse, or 5 person crew with slow response• How to create environment where all personality types canwork together successfully• Adjust for new culture• Fire staffing based in individual community size and growth• Establish continuing forum
• ** Benchmarks for fireground tasks (time stamps)• Adjust for environmental conditions• Data for setting standards• Determine critical tasks — outcomes• Reliable data• How do we mine date from existing databases with increasedaccuracy• What FD activities can positively impact fire prevention• ** Research into in-field electronic data capture thatincorporatesn Pre-incidentn Incidentn Post-incident data• Create palette that is populated by in-field data• Ways to increase accuracy and reliability of firefighter input• Incentive pathways to encourage better data• Show clear impact to community• Assess community view on loss/needs• Impact of sprinklers on risk and deployment• Research of increased demands on the individual firefighter• Optimum usage of firefighters• Change of fire service in next generation• Study/apply similar changes as seen in police department• How to get fire service to engage community.
CHART NOTES FROM GROUP 3: THE PATH FORWARDFront End
• * Standard definitions• Knowledge of definitions• * Usability (business, logic driven/protected)• Easy to use user interface, complete data, valid, pertinent tothe event at entry• * Industry consensus for a minimum data set (#,requirement, min, max)• * Bigger than NFIRS or any other existing data system,maybe modular• * Ability for local preference/customization — what’simportant locally• Automatic entry — objective info from devices andinstruments — avoid need to enter the same data over andover• * Timeliness of entry• * Reality (volume, time needed to complete data entry —balance on time demands for user)• * Timeliness of access to information — completeness andconsistence checks while incident can be recalled ifcorrections are needed• Ownership (entry) — making data part of employeeevaluation/promotional process• Completeness of entry• * Customized when needed• Multiple software should be avoided — one entry for thereport … for singe entry — common user interface• Standard operations for entry

29
Appendix B: Charts from Small Working Groups
Data System• Peer review/protection — look critically at the info and besure that info will not end up in the paper, allows forimprovement• Compliant software testing/approval — does not need to bethe same package but common functionality to the user —seal of approval• Multiple software solutions - Maybe web based or buy asoftware package• Ease of configuration/maintenance• Multiple platforms• Business logic/validation — ability to insert — rules in thedataset to assure completion• Ease of customization beyond standard• Timeliness of QM• Merge/manage multiple data standards — standards alsochange over time• Performance measurement (ISO, etc.)• Define incident or topic — inclusion criteria — how oftenwill a report be prepared• Admin functions
Back End• Reporting• Timeliness• Robust (needs to be)• Ease of Use• Knowledge of completeness/quality• Education of Admin level to use-apply• Standardized reports• Archive• Automated data exchange• Local �region�state region�national• International harmonization• Linear data submission• Benchmarking
Use the data — needs to be timely and needs to be accessible —across jurisdictions
Think about what reports will look like and make sure that thedata is there
Understanding what the quality and completeness of the data set is
Ability to archive information, ability to run reports for specifictime periods
Automation on the data exchange — local collection needs tomove to the national database seamlessly — should be automatic
Look internationally — how can the datasets work together
Logical path for the data to travel to the national data set
None of this will work unless we have the capability to work withone another
Recommendations• National databasen Policy driven (state and national)• User attributes• Firefighter injury• Incidentn Propertyn Operationsn Patient• Demographic• Consensus Standardn Definitionsn Reportsn Exchange

30
Referencesi. Averill, J., Moore-Merrell, L., Barowy, A., Santos, R., Peacock, R.,Notarianni, K., Wissoker, D. NIST TN 1661: Report onResidential Fireground Field Experiments. National Institute ofStandards and Technology, Gaithersburg, MD. 2010.
ii. Backoff, R. W.; et al. (1980). Firefighter Effectiveness – APreliminary Report. Columbus Fire Division, The Ohio StateUniversity.
iii. Cushman, J. (1982). Report to Executive Board, MinimumManning as Health & Safety Issue. Seattle, WA FireDepartment, Seattle, WA.
iv. McManis Associates and John T. O’Hagan and Associates(1984). “Dallas Fire Department Staffing Level Study,” June1984; pp. I-2 & II-1 through II-7.
v. NFPA (2004). NFPA 1710: Standard for the Organization andDeployment of Fire Suppression Operations, EmergencyMedical Operations, and Special Operations to the Public byCareer Fire Departments. National Fire Protection Association,Quincy, MA
vi. McGrattan, K. B. (2006). Fire Dynamics Simulator (Version 4):Technical Reference Guide. NIST Gaithersburg, MD. NIST SP1018; NIST Special Publication 1018; 109 p. March 2006.
vii. The SFPE Handbook of Fire Protection Engineering, 3rdEdition. DiNenno (Editor). National Fire ProtectionAssociation, Quincy, MA.

31