Embed Size (px)
Citation preview

Japan Update:
Japan’s Vision in Asia
Wednesday, February 11, 2015, 4 pm
Funded By:
Sponsored By:
Japan America Society of St. Louis
Saint Louis University Center for International Studies Saint Louis University Department of Sociology & Anthropology
Special Thanks To Our Partners
St. Louis Regional Chamber Missouri International Trade &
Investment Office U.S. Department of Commerce World Trade Center Saint Louis
World Affairs Council International Institute of St. Louis Transportation Club of St. Louis
St. Louis Mosaic Project
Japan Update:
Japan’s Vision in Asia
Wednesday, February 11, 2015, 4 pm
The Economic and Geo-political Importance of Trans-Pacific Partnership Negotiation
by Ambassador Ira Shapiro

Japan Update:
Japan’s Vision in Asia
Wednesday, February 11, 2015, 4 pm
The Role of the Japanese Economy in the World of Asia
by Masami Doi
The Role of Japanese Economy
in Asia and World
Masami Doi
Partner, KREAB Japan
(Senior Fellow Professor, Yamagata University)

History of Japan’s Economy

History of Japan’s Economy and Toyota
Year Japan Economy Toyota / Auto Industry
1945 End of WW2 Toyota starts to produce passenger
vehicles
1958 Toyota begins export of passenger
vehicles ‘Crown’ to the US (unsuccessful)
1965 Tokyo Olympics
(Symbol of Rapid Growth)
Highways and Bullet Train developed
1970s Environmental Problems Toyota develops efficient and low emission
technologies
1985 Plaza Accord
(Yen value jumps, Globalization
Begins)
Toyota starts production in Kentucky,
Toyota’s first factory in the US
1992 UN Earth Summit in Brazil Challenges for greater balance between
economic growth and environmental
issues
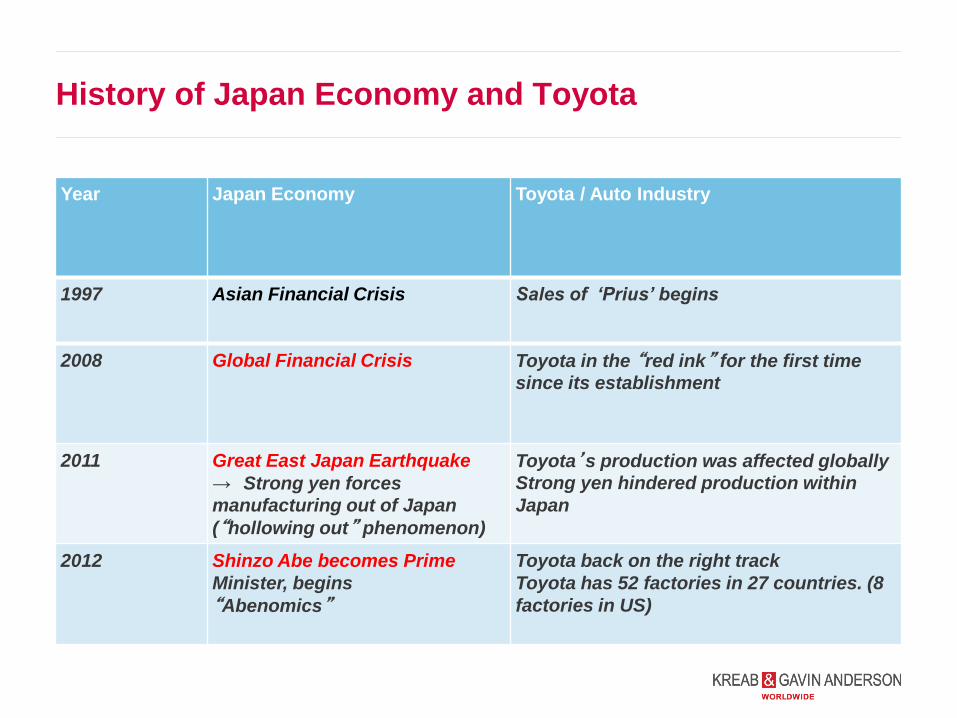
History of Japan Economy and Toyota
Year Japan Economy Toyota / Auto Industry
1997 Asian Financial Crisis Sales of ‘Prius’ begins
2008 Global Financial Crisis Toyota in the “red ink” for the first time
since its establishment
2011 Great East Japan Earthquake
→ Strong yen forces
manufacturing out of Japan
(“hollowing out” phenomenon)
Toyota’s production was affected globally
Strong yen hindered production within
Japan
2012 Shinzo Abe becomes Prime
Minister, begins
“Abenomics”
Toyota back on the right track
Toyota has 52 factories in 27 countries. (8
factories in US)

Current Challenges in Japan Economy
Current Challenges of Japanese Economy
1. Prolonged deflation (falling CPI) for 20 years
2. Rapid ageing and shrinking population
(Working age population decreasing by 800k people annually)
3. Budget deficit reached 230% of GDP
Mr. Abe’s Effort to overcome these challenges
“Abenomics”
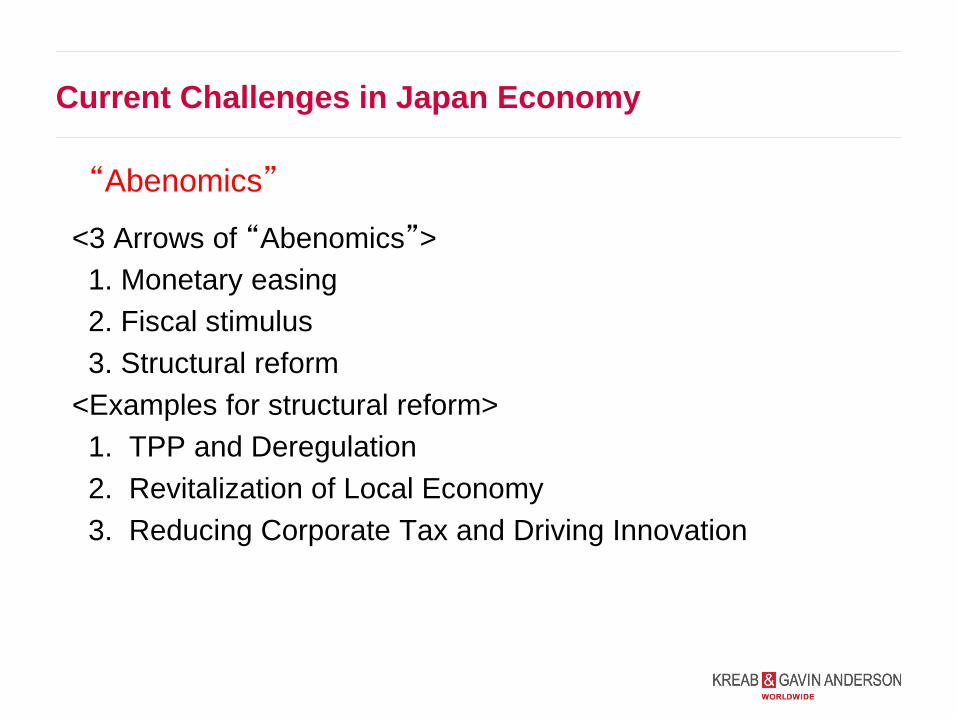
Current Challenges in Japan Economy
<3 Arrows of “Abenomics”>
1. Monetary easing
2. Fiscal stimulus
3. Structural reform
<Examples for structural reform>
1. TPP and Deregulation
2. Revitalization of Local Economy
3. Reducing Corporate Tax and Driving Innovation
“Abenomics”
Japan and The Asian Economy
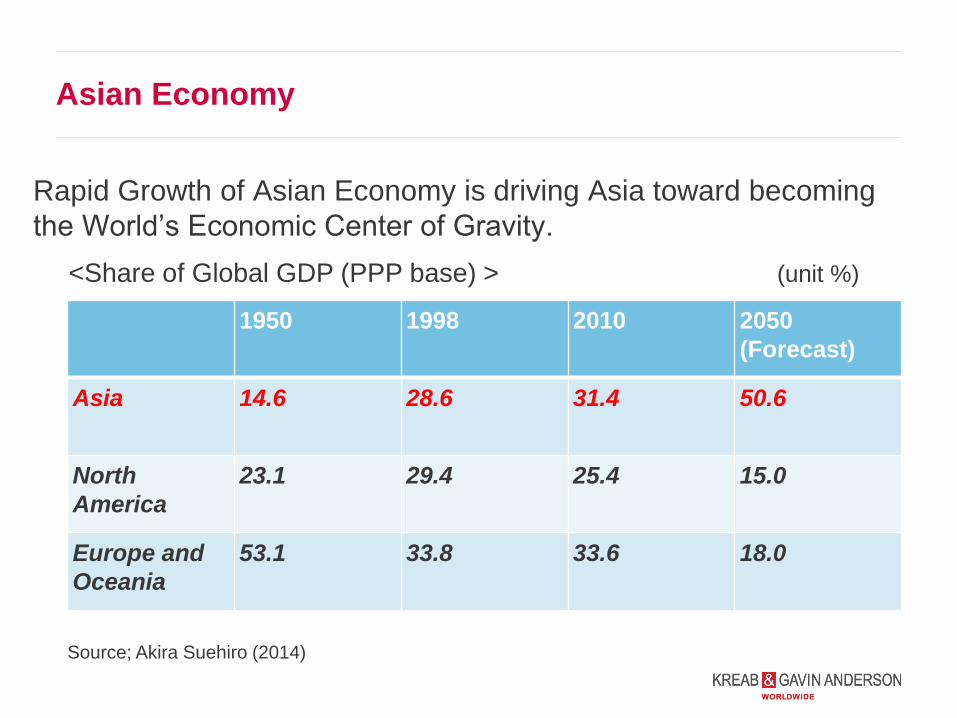
Asian Economy
Rapid Growth of Asian Economy is driving Asia toward becoming
the World’s Economic Center of Gravity.
1950 1998 2010 2050
(Forecast)
Asia 14.6 28.6 31.4 50.6
North
America
23.1 29.4 25.4 15.0
Europe and
Oceania
53.1 33.8 33.6 18.0
<Share of Global GDP (PPP base) > (unit %)
Source; Akira Suehiro (2014)
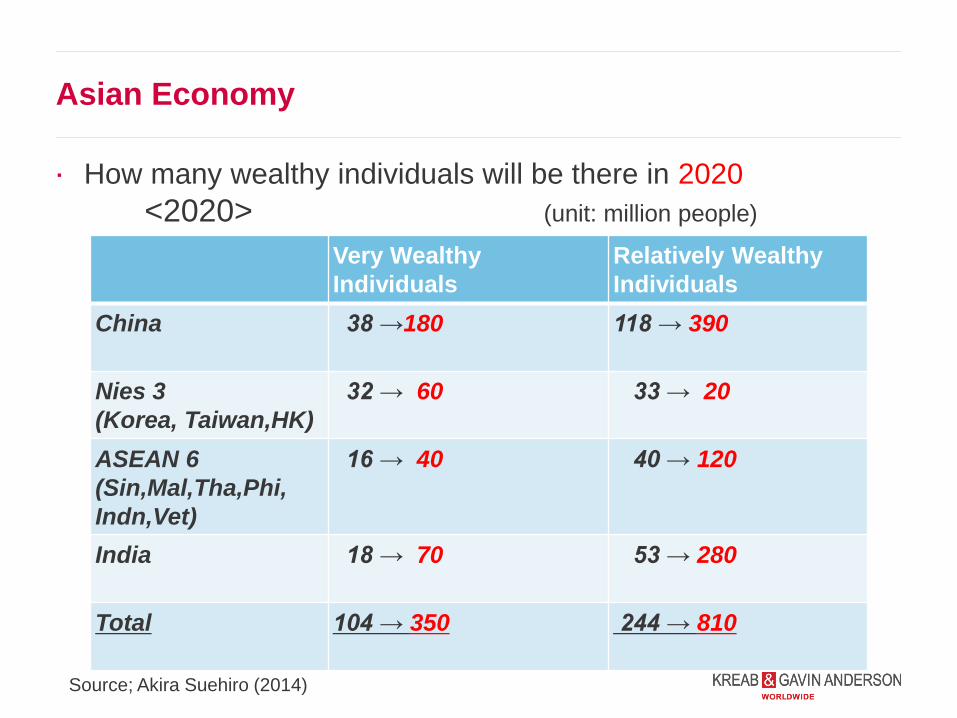
Asian Economy
How many wealthy individuals will be there in 2020
Very Wealthy
Individuals
Relatively Wealthy
Individuals
China 38 →180 118 → 390
Nies 3
(Korea, Taiwan,HK)
32 → 60 33 → 20
ASEAN 6
(Sin,Mal,Tha,Phi,
Indn,Vet)
16 → 40 40 → 120
India 18 → 70 53 → 280
Total 104 → 350 244 → 810
<2020> (unit: million people)
Source; Akira Suehiro (2014)

Japan and Asian Economy
1945 – 2000 : Japan was the front runner, other countries tried
to catch up with it.
2000 – 2015 : Japan remains one of the front runners. To some
extent, the Asian economy is becoming “flatter”.
Japan
Japan
1945-2000 2000-2015
Asia Asia
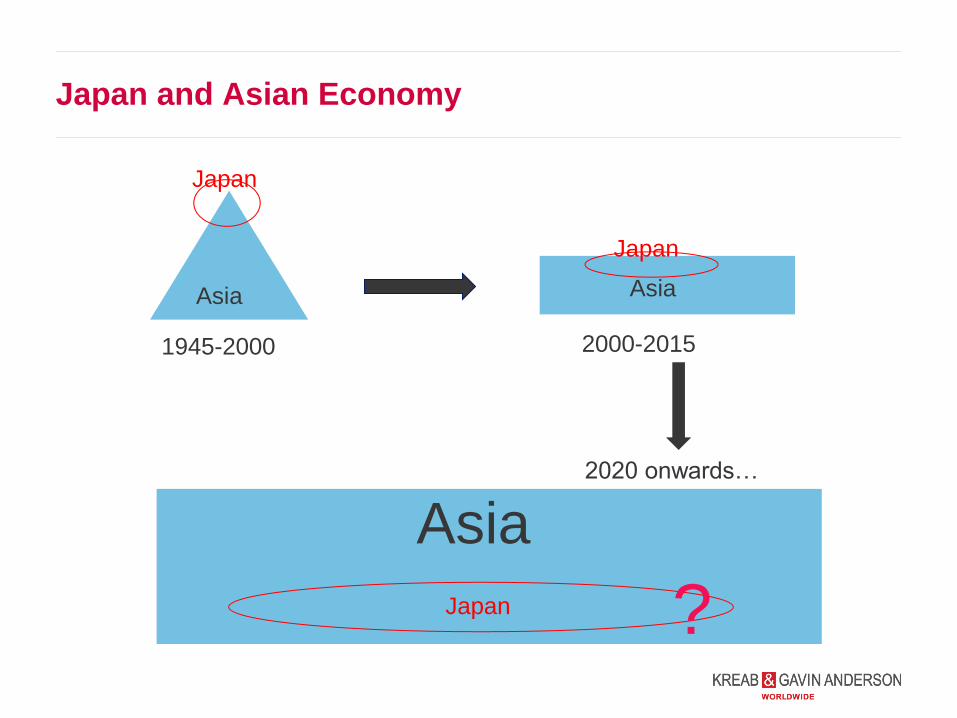
Japan and Asian Economy
Japan
Japan
Japan
1945-2000 2000-2015
2020 onwards…
Asia
Asia Asia
?

Japan and Asia: Future Relationship
<Opportunity>
Asia, Japan’s neighbor, will become the biggest market.
The number of tourists to Japan from Asia is rapidly increasing.
Labour costs in the region are increasing. As a result,
Japanese manufacturers can become competitive again.
Asian countries are adopting Japanese and Western lifestyle,
culture and consumer choices.

Asian Life Style
Japan and Asia, Future Relationship
China
Singapore

Japan and Asia: Future Relationship
<Risk>
Competition between Japanese and mainland Asian
companies will be more severe.
Asia will face urbanization problems. (Air Pollution, Water
Pollution, Traffic Jam, Unemployment Poverty, etc )
Nationalism could become stronger
Japan and Asia: Future Relationship
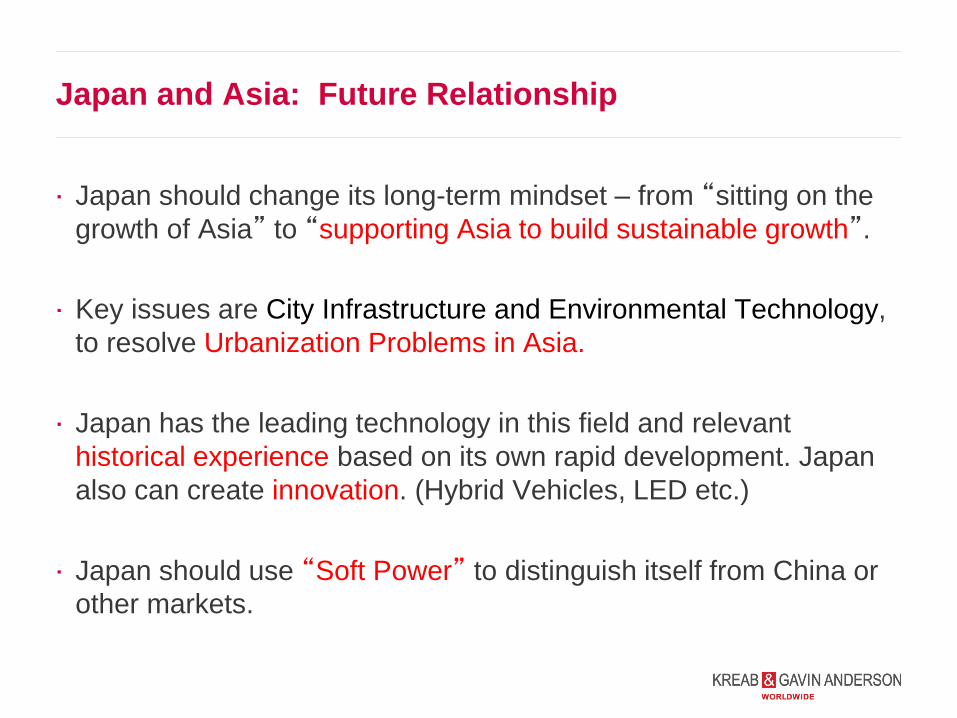
Japan should change its long-term mindset – from “sitting on the
growth of Asia” to “supporting Asia to build sustainable growth”.
Key issues are City Infrastructure and Environmental Technology,
to resolve Urbanization Problems in Asia.
Japan has the leading technology in this field and relevant
historical experience based on its own rapid development. Japan
also can create innovation. (Hybrid Vehicles, LED etc.)
Japan should use “Soft Power” to distinguish itself from China or
other markets.

Japan’s role in the Future
Japan has to contribute to the global economy to
ensure healthy growth and stability.
Social Contribution
Innovation (and transfer current technology to Developing Countries)

20
Economic Development, Problems and Solutions
Economic
Growth autonomous
possible for
growth by
“North”
support
Situation Problems Solution
1. Low GDP increase
1. Aging Society
3. Immigration increase
1. High unemployment rate
caused by “South”
2. Protect industries from
“South”
1. Technology and Industrial Innovation
2. More open markets
3. Transfer technologies to the “South”
Upper 1. Increase exports to
Dev countries.
2. Rapid Industrialization
3. Population increase
(urban)
1. Environmental problems
2. Income discrepancy
3. Urbanization problems (crime
or social unrest)
1. Introduce environmental tech. from “North”
2. Sustainable development policies
3. Enhance urban Infrastructure
Lower 1. Investment from
“North” from
outsourcing
2. Basic infrastructure
1. Natural disasters or Economic
Crises can bring a return to
poverty
1. Support from “North” when disasters occur
1. Disease (AIDS, Malaria)
2. Poverty
3. Lack of education
4. Fragile Agriculture
1. Terrorism
2. Desertification through
excessive farming
3. Rapid Increase Population.
→ Social Instability
1. “North” support for Education, especially
for girls
2. “North” support for medical and health care.
3. “North” support for sustainable agriculture
4. ”North” support for small business
Poorer
Countries ($1.25/day less)
Developing
Countries
Developed
Countries
Pop: 1.4B
Pop: 1.0B
Pop: 4.6B
Created by Masami Doi consulted by Jeffrey Sachs , 2013

Innovation
Innovation will be the most important element to ensure the
healthy growth of both mature and emerging economies.
Technological Innovation (by Developed Countries)
Technological Transfer (from Developed Countries to Developing Countries)
Healthy Growth (for both parties)

Social Contribution
Poverty and natural disasters can lead to social instability of
and therefore conflict, war etc.
Poverty (economic crises, natural disasters etc.)
Before this situation occurs, developed countries should
cooperate to support “Human Security”.
(“Human Security” was advocated by Sadako Ogata,
former the United Nations High Commissioner for
Refugees)
Social unrest: rioting could occur. Terrorists could easily
recruit young people.

Case Study
23

24
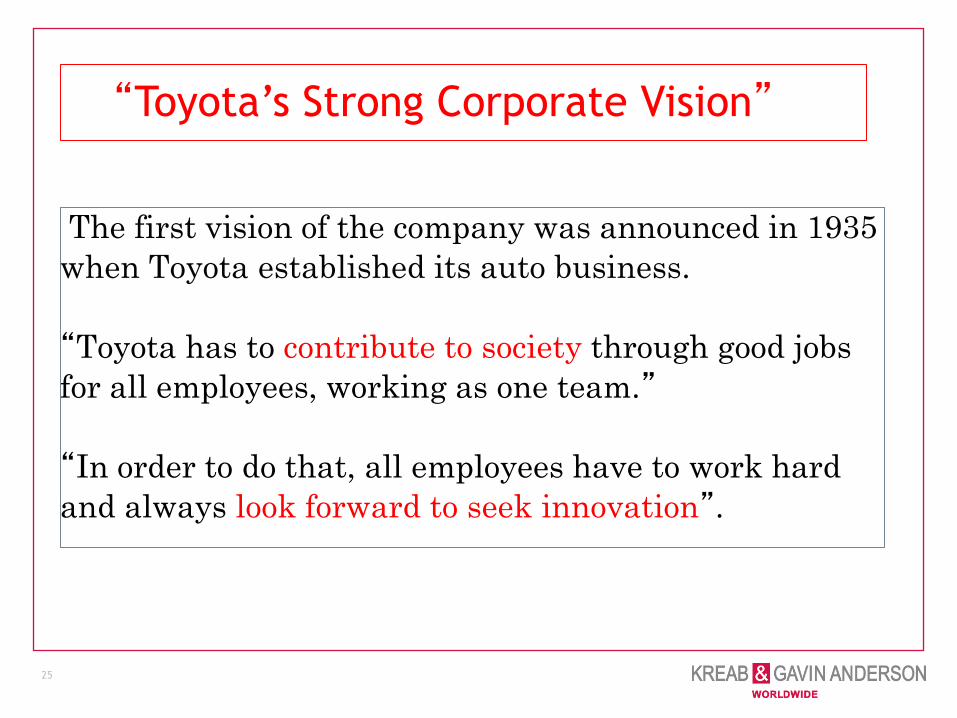
The first vision of the company was announced in 1935
when Toyota established its auto business.
“Toyota has to contribute to society through good jobs
for all employees, working as one team.”
“In order to do that, all employees have to work hard
and always look forward to seek innovation”.
25
“Toyota’s Strong Corporate Vision”

Toyota Global Vision 2020 (March 9,2011)
“Rewarded with a smile by exceeding Customers’ expectations” “Toyota will lead the way to the future of mobility, enriching lives around the world with the safest and most responsible ways of moving people. Through our commitment to quality, constant innovation and respect for the planet, we aim to exceed expectations and be rewarded with a smile. We will meet challenging goals by engaging the talent and passion of people, who believe there is always a better way.”
2
6
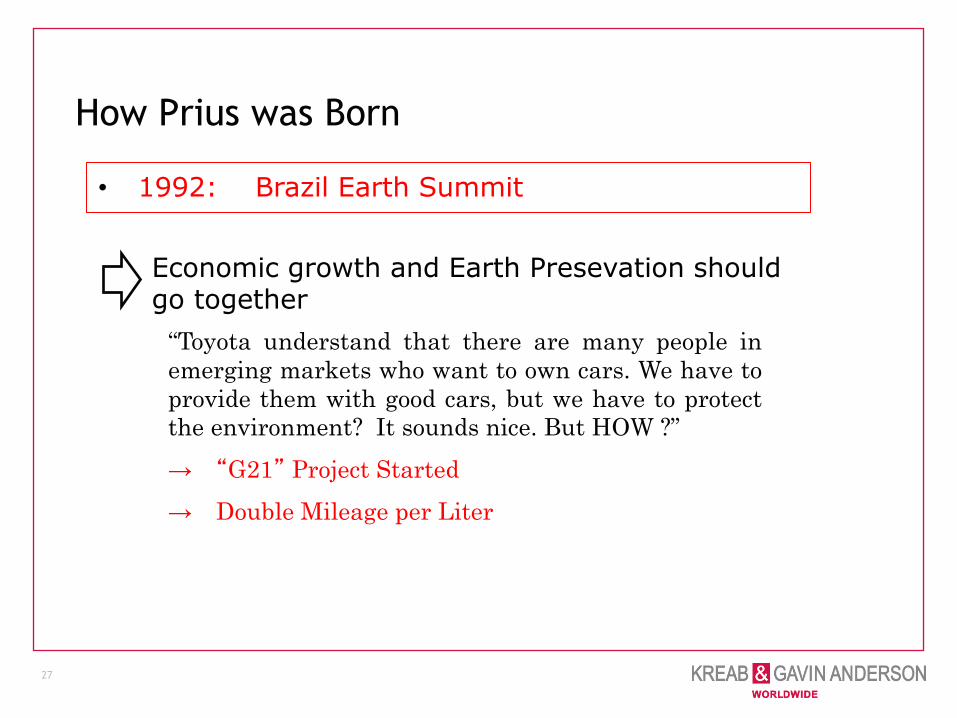
How Prius was Born
27
• 1992: Brazil Earth Summit
Economic growth and Earth Presevation should go together
“Toyota understand that there are many people in
emerging markets who want to own cars. We have to
provide them with good cars, but we have to protect
the environment? It sounds nice. But HOW ?”
→ “G21” Project Started
→ Double Mileage per Liter

First Generation “Prius” in 1997
28

Thomas Freedman in NY Times editorial, wrote twice that “GM
should follow Toyota to provide Toyota Hybrid cars for all
American people”
29
<The New York Times 2005.6.17>
“As Toyota Goes”
< The New York Times 2006.3.31>
“A Quick Fix for the Gas Addicts”

(k units)
600
500
400
300
200
100
0
Sales of HV
Sales of Prius
Sales of Hybrid Vehicles and Prius
1st Generation
Prius 2nd Generation
Prius
3rd Generation
Prius
‘97 ‘98 ‘99 ’00 ’01 ’02 ’04 ’05 ’06 ’07 ’03 ’08 ’09 ’10
販売台数
30
31
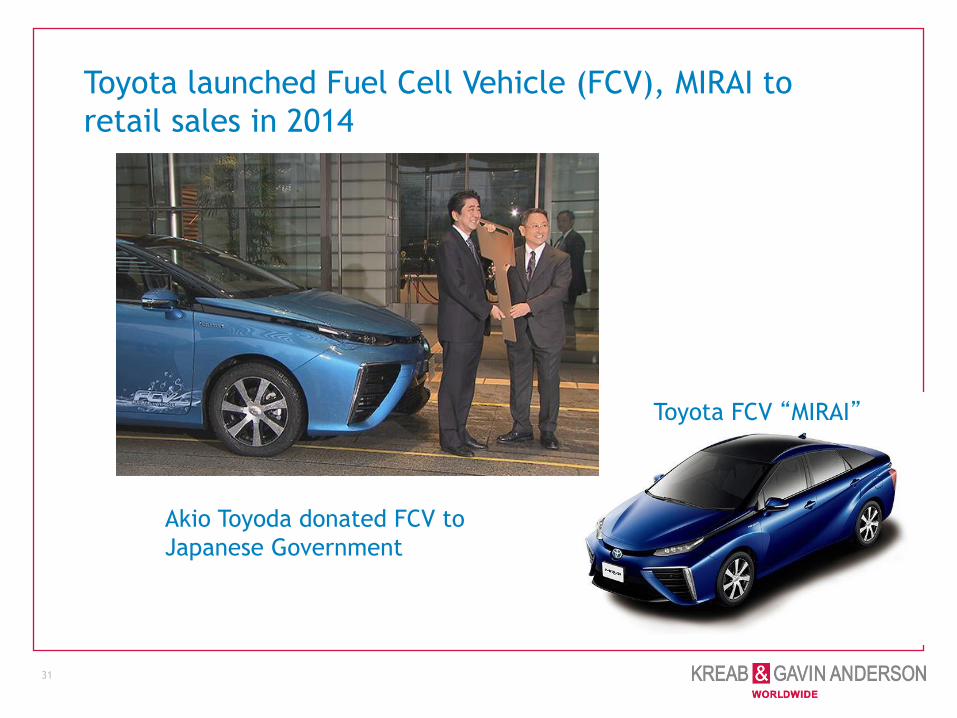
Toyota launched Fuel Cell Vehicle (FCV), MIRAI to
retail sales in 2014
Akio Toyoda donated FCV to
Japanese Government
Toyota FCV “MIRAI”

32
Toyota established “Toyota Mobility Foundation” in 2014
Japan Update:
Japan’s Vision in Asia
Wednesday, February 11, 2015, 4 pm
The Emergence of ‘New Japan’ and its Role in Global Supply Chains
by Dr. Ulrike Schaede
The Emergence of “New Japan”
and its Role in Global Supply
Chains
Ulrike Schaede ウリケ・シェーデ
School of International Relations and Pacific Studies
University of California, San Diego
Saint Louis University
February11, 2015

“Loser Japan”?
35 © Ulrike Schaede, University of California, San Diego The Economist April 21, 2012
Between 2005 and 2010, the Yen appreciated 20%+.

Lots of Doubters
Japan is full of “zombies”
Stagnant economy, “no profit zone”
Failure of industrial policy
Japanese companies are not strategic
Japanese CEOs are not 経営マン (managers) but 調整マン (administrators)
Within Japan, business people say that Japan is too …
Expensive
Rigid (e.g., labor market rules)
Regulated (e.g., leftover laws from the postwar period)
Inward-looking (not enough globalization)
Japan has “lost” it
Previous dominance of consumer product markets gone
Japan is no longer a global economic player
© Ulrike Schaede, University of California, San Diego

Operating Margins of “Old Japan” Firms
Hitachi Fujitsu NEC
2001 4.07 4.45 3.42
2002 -1.47 -1.49 -1.09
2003 1.87 2.17 2.18
2004 2.14 3.15 2.81
2005 3.09 3.36 2.95
2006 2.7 3.79 1.98
2007 1.78 3.57 1.5
2008 3.08 3.85 3.4
2009 1.27 1.47 -0.15
2010 2.25 2.02 1.42
average 2.078 2.634 1.842
Looking at these companies is like looking at Fortune 500 firms of 1988
GM
Sunbeam/Oster
Digital Equipment
Sears
Doesn’t tell you much about the U.S. today
Operating Margins of “Old Japan”
© Ulrike Schaede, University of California, San Diego
People look at companies like these in Japan because
these are the only ones they know.
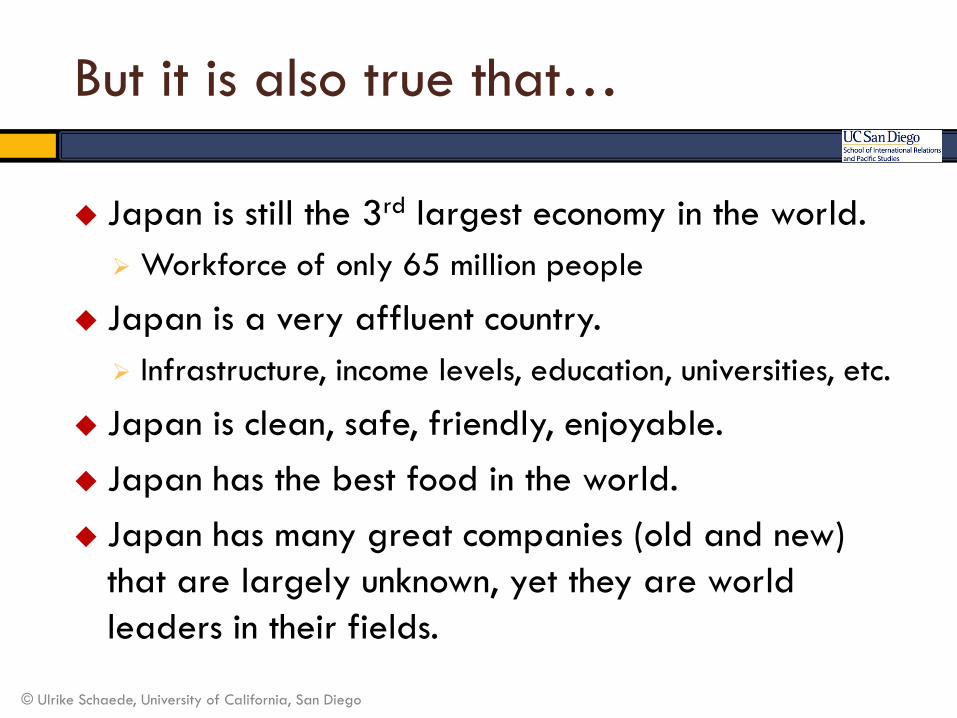
But it is also true that…
Japan is still the 3rd largest economy in the world.
Workforce of only 65 million people
Japan is a very affluent country.
Infrastructure, income levels, education, universities, etc.
Japan is clean, safe, friendly, enjoyable.
Japan has the best food in the world.
Japan has many great companies (old and new)
that are largely unknown, yet they are world
leaders in their fields.
38 © Ulrike Schaede, University of California, San Diego
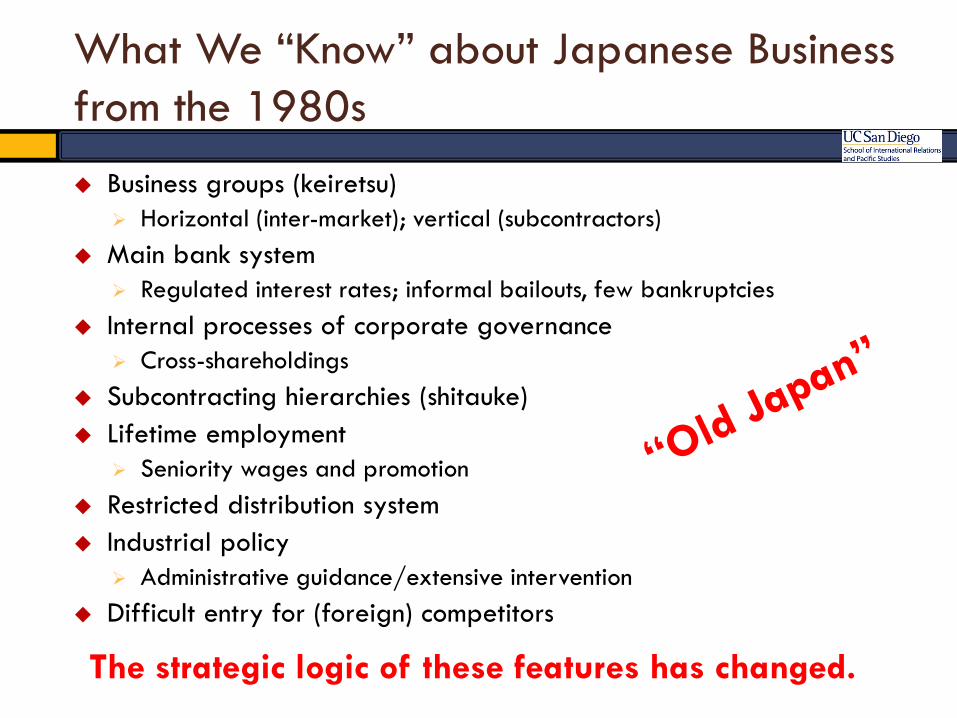
What We “Know” about Japanese Business
from the 1980s
Business groups (keiretsu)
Horizontal (inter-market); vertical (subcontractors)
Main bank system
Regulated interest rates; informal bailouts, few bankruptcies
Internal processes of corporate governance
Cross-shareholdings
Subcontracting hierarchies (shitauke)
Lifetime employment
Seniority wages and promotion
Restricted distribution system
Industrial policy
Administrative guidance/extensive intervention
Difficult entry for (foreign) competitors
39
The strategic logic of these features has changed.
Today’s Agenda
The emergence of “New Japan”
Strategic inflection point: refocusing wave
Rise of new, and newly positioned, companies
in upstream (intermediate) products
What does this mean for global trade?
Japan’s new role as an “invisible” supplier of
high-end materials and components
A new way of thinking about Japan’s role in
Asia, and in the global economy
© Ulrike Schaede, University of California, San Diego

Strategic Inflection
1990s not a “lost decade”, but a period of transformation
Japan lost its low-cost advantage in producing consumer goods
Rise of competitors in Asia in hi-quality mass-manufacturing
Globalization arrived in Japan
Banking crisis and social distress
Strategic inflection point 1998-2006
Complete change in what it takes to “win"
Revision of all laws pertaining to commerce
Allow companies to disassemble previous conglomerates
Changes in Japan’s industrial architecture
Keiretsu and main banks change their strategic functions
HR reforms allow for more specialized careers
Change in ownership structure: institutional investors and foreigners
41 © Ulrike Schaede, University of California, San Diego
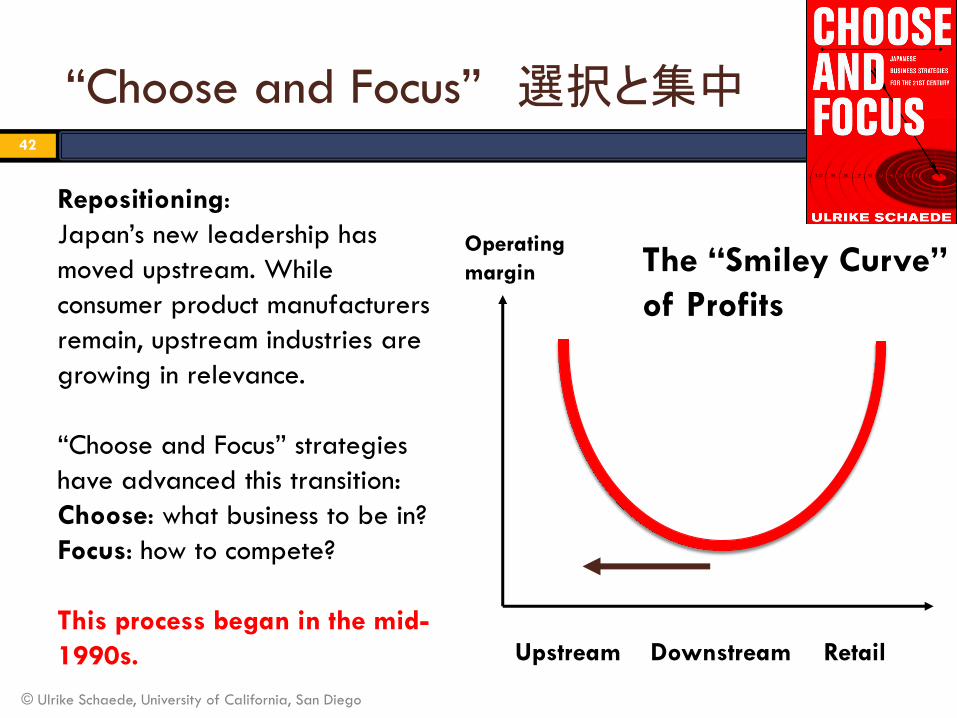
“Choose and Focus” 選択と集中 42
Operating
margin
Upstream Downstream Retail
Repositioning:
Japan’s new leadership has
moved upstream. While
consumer product manufacturers
remain, upstream industries are
growing in relevance.
“Choose and Focus” strategies
have advanced this transition:
Choose: what business to be in?
Focus: how to compete?
This process began in the mid-
1990s.
The “Smiley Curve”
of Profits
© Ulrike Schaede, University of California, San Diego

New Japan’s Dominance:
Upstream and Midstream 43
Example: Japan’s Global Market Share in High-End
Household Electronics in 2003
65% 51% 27%
Upstream:
Semiconductor materials,
layers/films/adhesives
(production equipment: 54%)
Midstream:
semiconductors,
flat panel parts,
cell phone parts
Downstream:
Flat panel TVs, DVDs,
HDD, cell phones, digital
cameras, navigation
systems, TV games Source: 2005年版ものつくり白書 © Ulrike Schaede, University of California, San Diego
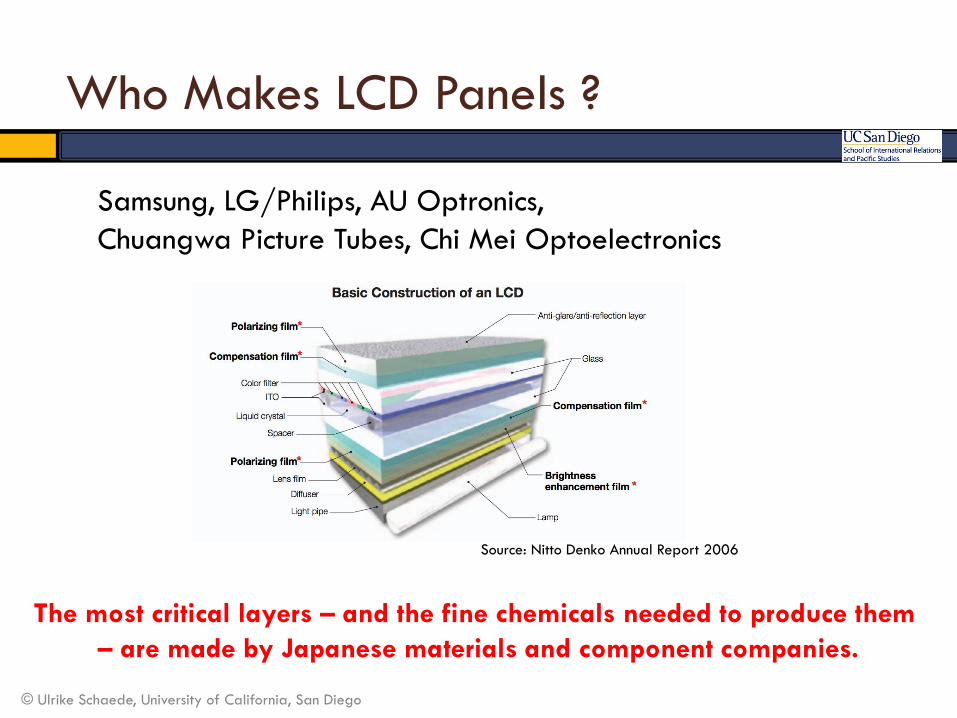
Who Makes LCD Panels ?
Source: Nitto Denko Annual Report 2006
Samsung, LG/Philips, AU Optronics,
Chuangwa Picture Tubes, Chi Mei Optoelectronics
The most critical layers – and the fine chemicals needed to produce them
– are made by Japanese materials and component companies.
© Ulrike Schaede, University of California, San Diego
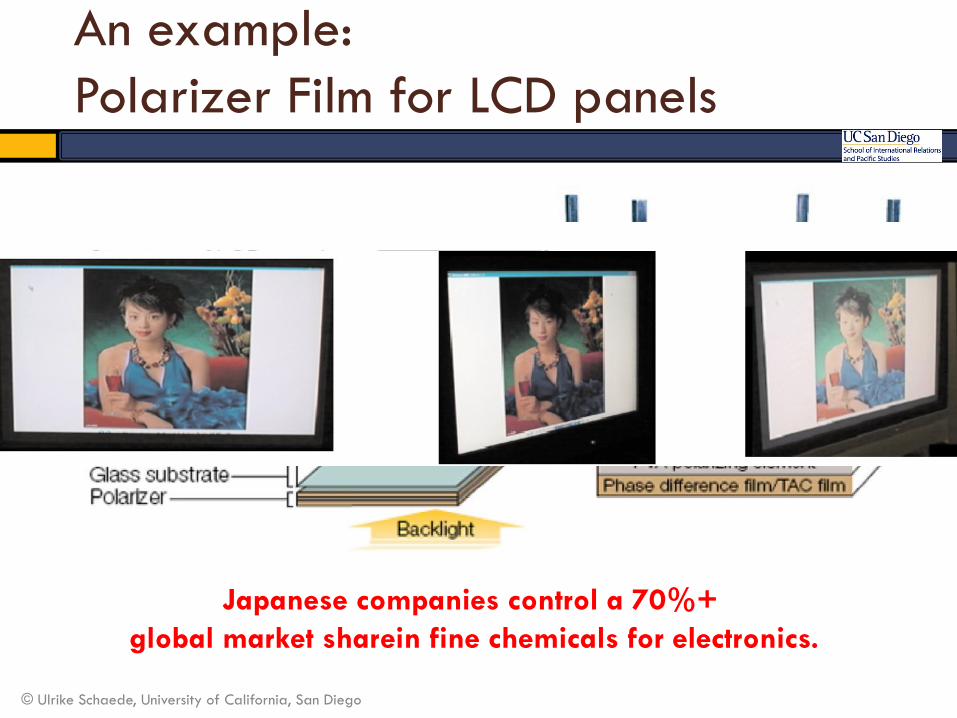
An example:
Polarizer Film for LCD panels
© Ulrike Schaede, University of California, San Diego
Japanese companies control a 70%+
global market sharein fine chemicals for electronics.

Capturing Value in the Global Supply Chain
46 © Ulrike Schaede, University of California, San Diego Source: WSJ 12/16/2010
For every iPhone
sold, somebody
in Japan earns
$178.96 * 34% =
$60.84
Study by Asia Development
Bank Institute
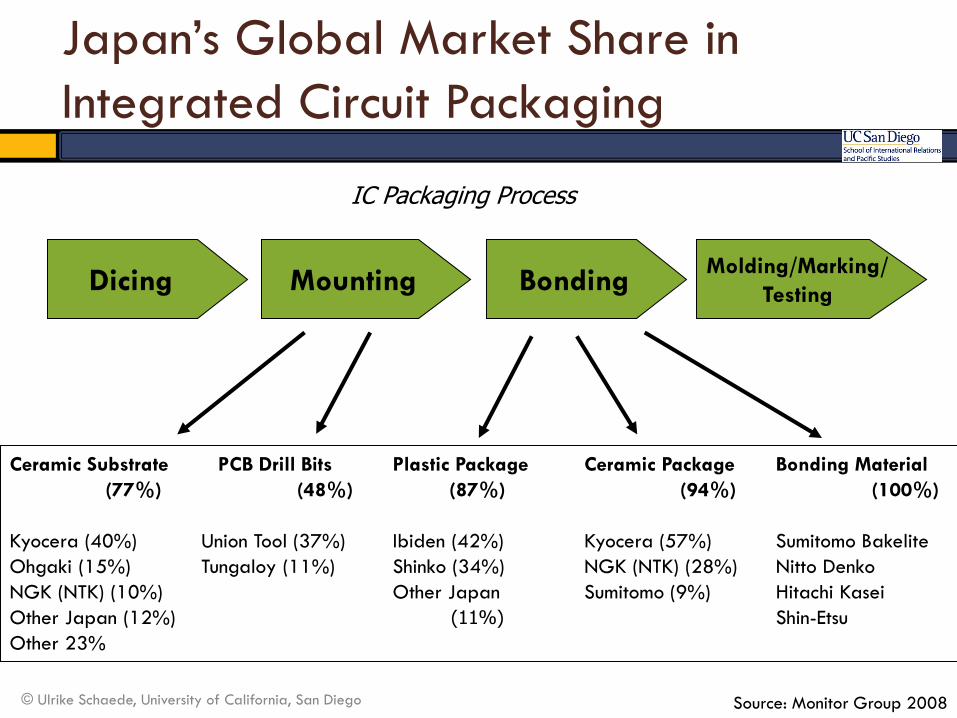
Japan’s Global Market Share in
Integrated Circuit Packaging
Dicing Mounting Bonding Molding/Marking/
Testing
Ceramic Substrate PCB Drill Bits Plastic Package Ceramic Package Bonding Material
(77%) (48%) (87%) (94%) (100%)
Kyocera (40%) Union Tool (37%) Ibiden (42%) Kyocera (57%) Sumitomo Bakelite
Ohgaki (15%) Tungaloy (11%) Shinko (34%) NGK (NTK) (28%) Nitto Denko
NGK (NTK) (10%) Other Japan Sumitomo (9%) Hitachi Kasei
Other Japan (12%) (11%) Shin-Etsu
Other 23%
Source: Monitor Group 2008
IC Packaging Process
© Ulrike Schaede, University of California, San Diego
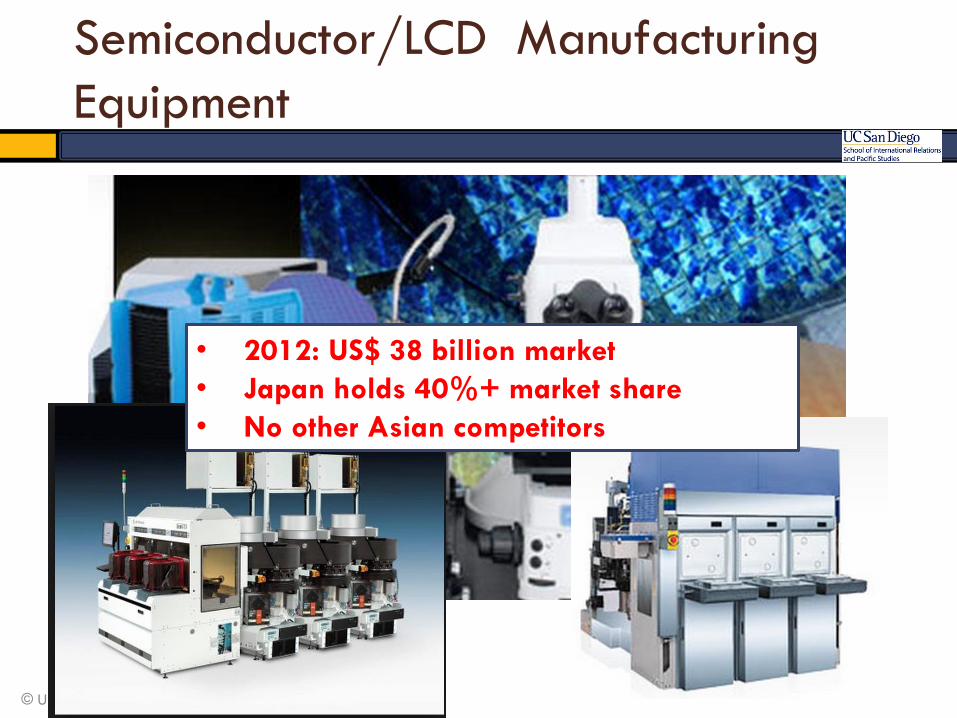
Semiconductor/LCD Manufacturing
Equipment
© Ulrike Schaede, University of California, San Diego
• 2012: US$ 38 billion market
• Japan holds 40%+ market share
• No other Asian competitors

Global Market Dominance (Examples)
Electronic components (highly specialized): 40%
Fine chemicals for electronics: 70%+
NiMH Batteries: 84%+ (automotive: 90%+, Panasonic)
Microcontrollers (car electronics): 50%+
Power Steering: 70% (Mitsubishi Electric)
Brush DC Motors: 86% (Mabuchi)
HDD Motors: 70% (Nidec)
Camera shutters: 70% (Nikon)
Ceramic Condensers: 75%
400nm Laser Pickups: 100%
Carbon-fiber: 65%+
Green technologies?
Source: Monitor Group 2008 © Ulrike Schaede, University of California, San Diego

0
2
4
6
8
10
12
14
16
18
20
In tri
llio
n Y
en
China-Japan Trade
Export to China Imports from China
0
2
4
6
8
10
12
14
16
18
20
In tri
llio
n Y
en
China + HongKong – Japan Trade
Exports to HK Imports from HK
Exports to China+HK Imports from China+HK
Japan-China Trade
1979-2013
Data source: Ministry of Finance, Japan, http://www.e-stat.go.jp/ © Ulrike Schaede, University of California, San Diego

China +
HK Japan
Units: Billion USD
187.5
170.6
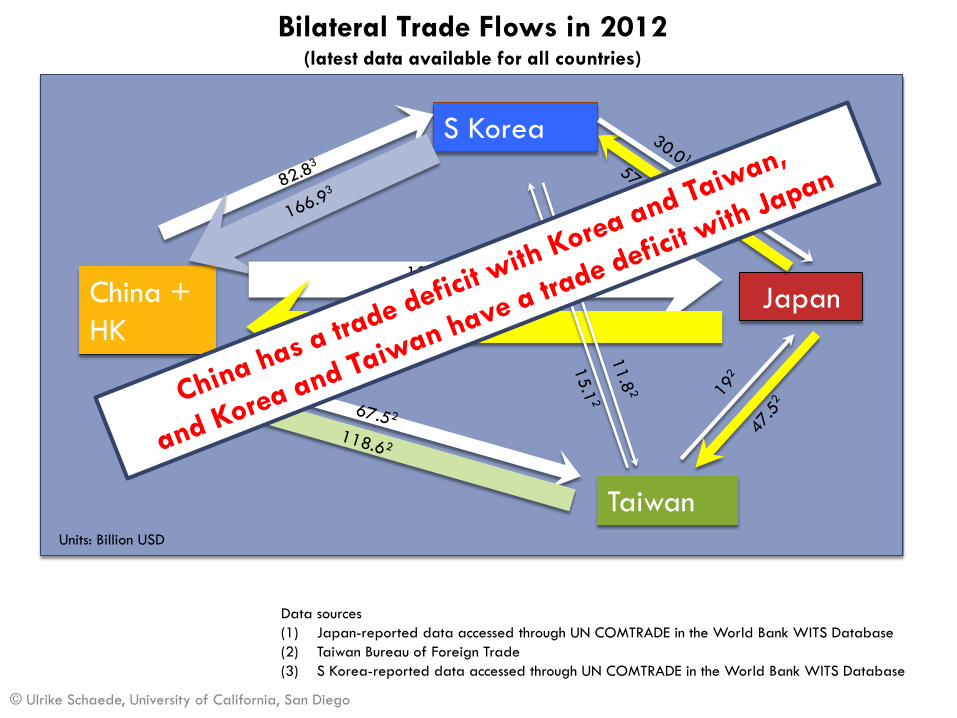
Bilateral Trade Flows in 2012
Data sources
(1) Japan-reported data accessed through UN COMTRADE in the World Bank WITS Database
(2) Japan Customs data from mof.go.jp
But: this is only the beginning of the story
1) Different goods
2) Japan’s new role in supply chains
© Ulrike Schaede, University of California, San Diego

Enter South Korea and Taiwan
© Ulrike Schaede, University of California, San Diego
0
1,000,000,000
2,000,000,000
3,000,000,000
4,000,000,000
5,000,000,000
6,000,000,000
7,000,000,000
19
79
19
81
19
83
19
85
19
87
19
89
19
91
19
93
19
95
19
97
19
99
20
01
20
03
20
05
20
07
20
09
20
11
20
13
Exports to South Korea
Imports from South Korea
0
1,000,000,000
2,000,000,000
3,000,000,000
4,000,000,000
5,000,000,000
6,000,000,000
19
79
19
81
19
83
19
85
19
87
19
89
19
91
19
93
19
95
19
97
19
99
20
01
20
03
20
05
20
07
20
09
20
11
20
13
Exports to Taiwan
Imports from Taiwan
Trade gap:
Yen ~2 trillion Trade gap:
Yen ~1.75 trillion
Why do South Korea and Taiwan
have a growing trade deficit with Japan?
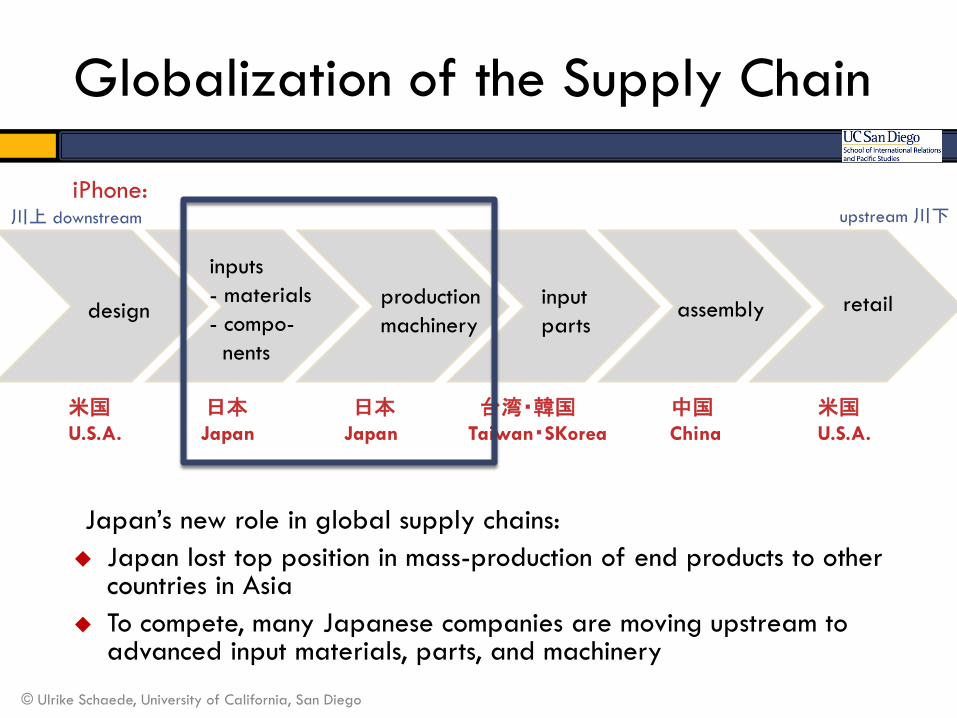
Globalization of the Supply Chain
Japan’s new role in global supply chains:
Japan lost top position in mass-production of end products to other countries in Asia
To compete, many Japanese companies are moving upstream to advanced input materials, parts, and machinery
© Ulrike Schaede, University of California, San Diego
design
inputs
- materials
- compo-
nents
production
machinery
input
parts assembly retail
iPhone:
米国 日本 日本 台湾・韓国 中国 米国
U.S.A. Japan Japan Taiwan・SKorea China U.S.A.
川上 downstream upstream 川下
China +
HK
S Korea
Taiwan
Japan
Units: Billion USD
187.51
170.61
Bilateral Trade Flows in 2012 (latest data available for all countries)
Data sources
(1) Japan-reported data accessed through UN COMTRADE in the World Bank WITS Database
(2) Taiwan Bureau of Foreign Trade
(3) S Korea-reported data accessed through UN COMTRADE in the World Bank WITS Database
© Ulrike Schaede, University of California, San Diego
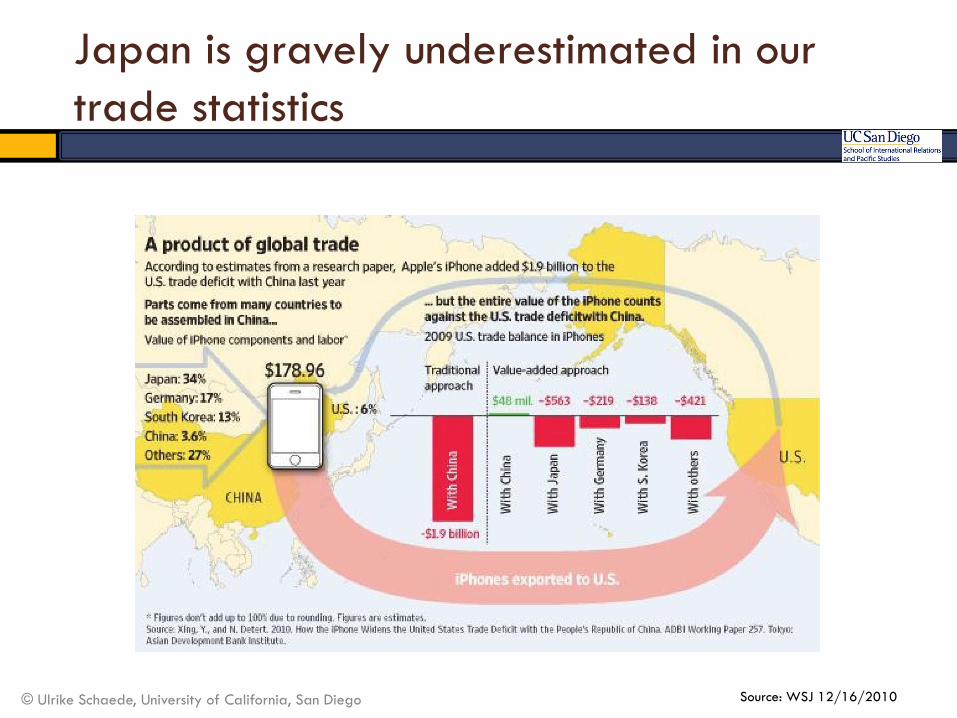
Japan is gravely underestimated in our
trade statistics
56 © Ulrike Schaede, University of California, San Diego Source: WSJ 12/16/2010

Takeaways
Many of New Japan’s leading companies make highly specialized products (components and materials).
To appreciate “New Japan”, we have to stop looking only at “Old Japan” companies.
How many “New Japan” companies are there, and will it be enough?
In the 2000s, 25% of Japan’s listed companies earned 47% of operating profits.
More companies are repositioning to exit end products and lead in intermediate goods.
Japan is re-emerging in a new role.
57 © Ulrike Schaede, University of California, San Diego

Thank you!
Ulrike Schaede
Professor of Japanese Business
University of California at San Diego
School for International Relations and Pacific Studies
© Ulrike Schaede, University of California, San Diego

Japan Update:
Japan’s Vision in Asia
Wednesday, February 11, 2015, 4 pm
Doing Business in Japan
by Brian Josephson

Japan Update:
Japan’s Vision in Asia
Wednesday, February 11, 2015, 4 pm
Funded By:
Sponsored By:
Japan America
Society of St. Louis
Saint Louis University Center for International Studies
Saint Louis University Department of Sociology &
Anthropology
Special Thanks
To Our Partners St. Louis Regional Chamber
Missouri International Trade &
Investment Office
U.S. Department of Commerce
World Trade Center Saint Louis
World Affairs Council
International Institute of St. Louis
Transportation Club of St. Louis
St. Louis Mosaic Project
THANK YOU FOR JOINING US.
PLEASE ENJOY THE RECEPTION.