Embed Size (px)
Citation preview

Japan’s Trade Strategy in the 21st Century and Economic Partnership
with Latin American Countries Revisited Prof. Yorizumi WATANABE
Faculty of Policy Management
KEIO UNIVERSITY (SFC)
Brasilia, December 1 2017
Yorizumi Watanabe, Keio University 1

Outline of Today’s Presentation
• Point of Departure: Two Major Concerns
• 1. Mega-Regions and Mega-FTAs i.e. TPP, RCEP+JCK/FTA, Japan-EU FTA, TTIP
• 2. Japan’s Bilateral FTA/EPA Policy
• 3. TPP/12 & TPP/11: a Bumpy Road towards “the Golden Standard”
• 4. The Japan-Mexico EPA(2005) as a Model for Future Japan-Latin America Economic Partnership
• 5. Bilateral Relations between Japan and Brazil
• 6. Concluding Remarks

Two Major Sources of Uncertainty BREXIT & Trump Shock

Why Brexit matters ?: Major Japanese Companies Presence in the UK company Sales in the
EU(Oku Yen) British Employee
Export to the EU
Toyota 23,233 3,000 75% of the UK production to the EU
SONY 18,813 5,000 Headquarters function for the EU
Nissan 17,481 8,000 80% of the UK production to the EU
Canon 10,743 2,800 Camera, Multi-function equipment
Hitachi 9,511 5,000 8000 OkuYen awarded order trains
Toshiba 5,599 n.a. Headquarters Function for the EU
Ricoh 5,310 3,000 Overall sales in the EU
Mitsubishi Electric
3,699 n.a.. Air conditioning system in the EU
KonicaMinolta 3,197 1,300 Multifunction office equipment
Takeda Pharma. 3,093 n.a. Experiments for the entire EU market
Nomura HD 1,458 2,500 Supporting M&A、security, banking 4

US Withdrawal from the TPP (Jan. 23 2017)
5

1. Mega-Regions and Mega-FTAs; TPP, RCEP+JCK/FTA, Japan-EU FTA, TTIP Existing Mega-FTAs and other Mega-FTAs under Negotiation
NAFTA USA Canada Mexico
CAFTA MERCOSUR Allianza del Pacifico East Asia
ASEAN+3(JCK) +India+Australia・NZ
RCEP
EU Trans-Atlantic
TTIP
ASEM・ Japan-EU EPA
APEC
TPP
Yorizumi Watanabe, Keio University 7
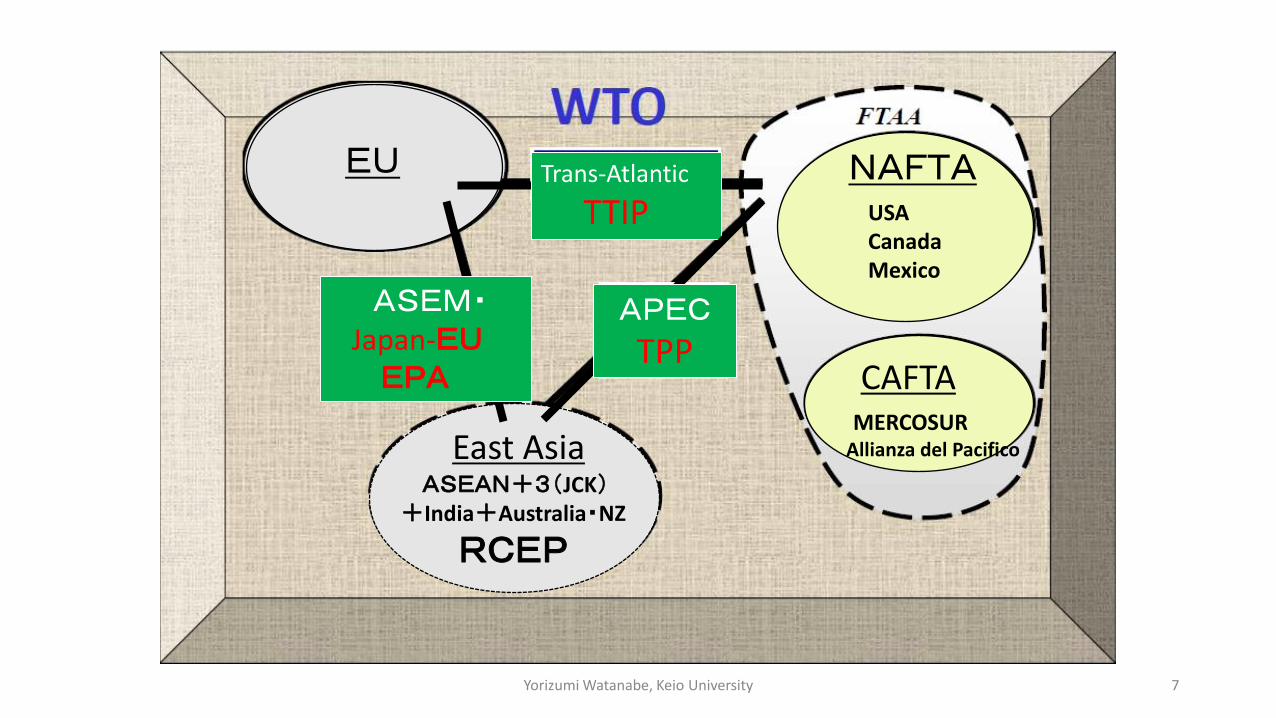
Membership and Economic Importance of the Mega-FTAs
Trade (2012)
Trade (2012)
GDP (2011)
GDP (2011)
Billion US $
Share (%)
Billion US $
Share (%)
JCK FTA 6,619
17.9 14,280.9 20.4
RCEP 10,470 28.4 19,929.9 28.5
TPP 9,545 25.9 26,593.4 38.0
TTIP 15,602 42.3 32,686.5 46.8
World 36,890 100.0 69,899.2 100.0
Yorizumi Watanabe, Keio University 8

Slide 9
RCEP 28% JCK 20%
TPP 38%
TTIP 47%

2. Japan’s FTA/EPA Policy

Unification of supply chain networks in the East Asia region
ASEAN
Australi
a
NZ
Japan
China
South Korea
India
.
• In order to increase exports to growth markets both inside and outside the East Asia
region, the unification of corporate supply chains is essential.
• At present, each EPA has its own set of regulations (e.g. rules of origin), and the
differences between these regulations hinder corporate activities. By unifying these
regulations into a single set of simple, easy-to-use rules for corporations, RCEP will
facilitate the establishment of an trans-national supply chain network.
Example 1: a Japanese automobile
company based in Thailand imports
engines and transmissions from
Japan, assembles them in Thailand,
and exports them to Australia.
Example 2: A Japanese auto-parts
manufacturer based in Thailand
imports parts from Japan,
manufactures airbags in Thailand
using these parts, and exports
these airbags to India.
Example 3: a Japanese elevator
manufacturer based in Thailand
imports hoists from China,
manufactures elevators in Thailand,
and exports them to India.
11
The significance of participation in RCEP

C C
• Transaction volumes of intermediate goods have risen rapidly among ASEAN
states. This reflects the increasing sophistication of production networks in
East Asia.
12
Change in quality of Japan-ASEAN-China trade
Japan
East Asia
China
Source: created from RIETE-TID 2011
*width of arrow represents trade value (1billion dollars); color denotes share of intermediate goods.
East Asia
Japan
China
*width of arrow represents trade value (1billion dollars); color denotes share of intermediate goods.
Source: created from RIETE-TID 2011

Japan’s FTA/EPA Strategy in Asia-Pacific & beyond • De-facto Business-driven Integration through Supply-chain and
Production Networks
• FTA/EPAs to consolidate the merits of the De-facto Integration
• From Bilateral FTA/EPAs to Wider Regional FTA/EPAs: (ASEAN+1)x5, ASEAN+3, ASEAN+6=RCEP, Japan-China-Korea EPA
• Beyond Regional FTA/EPAs ⇒⇒⇒ the TPP as an inter-regional FTA
Yorizumi Watanabe, Keio University 13
14
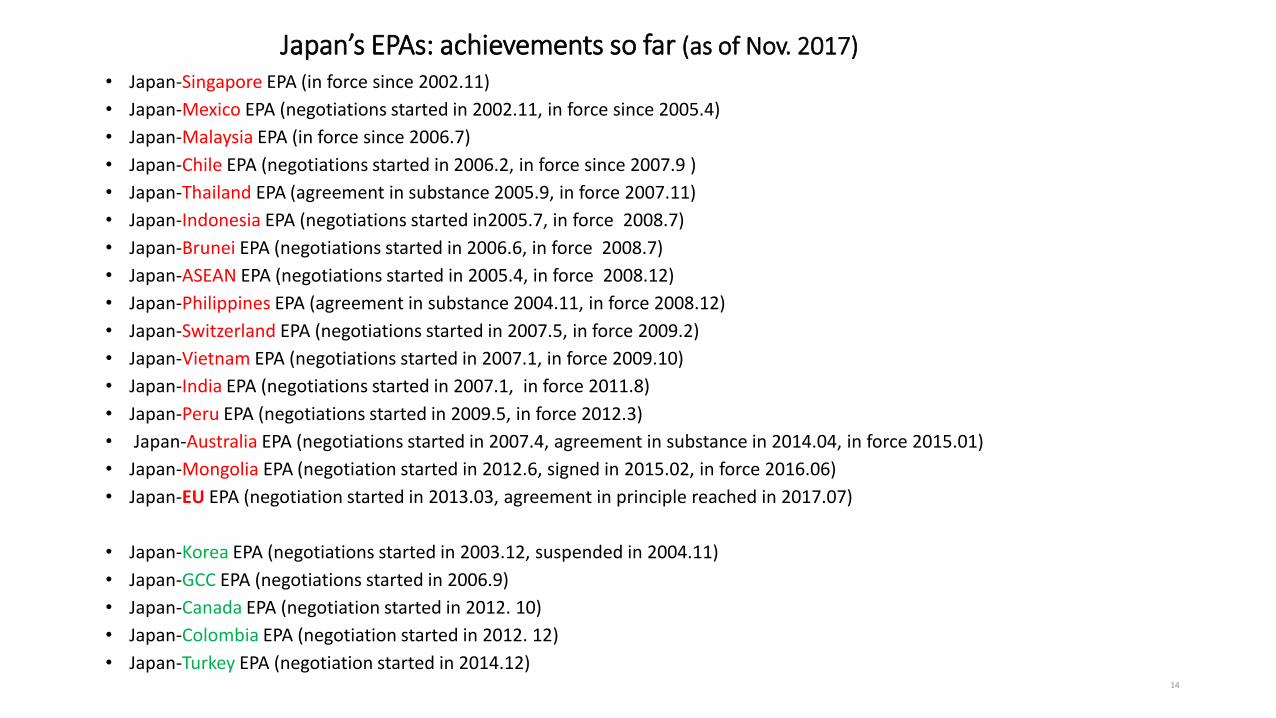
Japan’s EPAs: achievements so far (as of Nov. 2017)
• Japan-Singapore EPA (in force since 2002.11)
• Japan-Mexico EPA (negotiations started in 2002.11, in force since 2005.4)
• Japan-Malaysia EPA (in force since 2006.7)
• Japan-Chile EPA (negotiations started in 2006.2, in force since 2007.9 )
• Japan-Thailand EPA (agreement in substance 2005.9, in force 2007.11)
• Japan-Indonesia EPA (negotiations started in2005.7, in force 2008.7)
• Japan-Brunei EPA (negotiations started in 2006.6, in force 2008.7)
• Japan-ASEAN EPA (negotiations started in 2005.4, in force 2008.12)
• Japan-Philippines EPA (agreement in substance 2004.11, in force 2008.12)
• Japan-Switzerland EPA (negotiations started in 2007.5, in force 2009.2)
• Japan-Vietnam EPA (negotiations started in 2007.1, in force 2009.10)
• Japan-India EPA (negotiations started in 2007.1, in force 2011.8)
• Japan-Peru EPA (negotiations started in 2009.5, in force 2012.3)
• Japan-Australia EPA (negotiations started in 2007.4, agreement in substance in 2014.04, in force 2015.01)
• Japan-Mongolia EPA (negotiation started in 2012.6, signed in 2015.02, in force 2016.06)
• Japan-EU EPA (negotiation started in 2013.03, agreement in principle reached in 2017.07)
• Japan-Korea EPA (negotiations started in 2003.12, suspended in 2004.11)
• Japan-GCC EPA (negotiations started in 2006.9)
• Japan-Canada EPA (negotiation started in 2012. 10)
• Japan-Colombia EPA (negotiation started in 2012. 12)
• Japan-Turkey EPA (negotiation started in 2014.12)
15
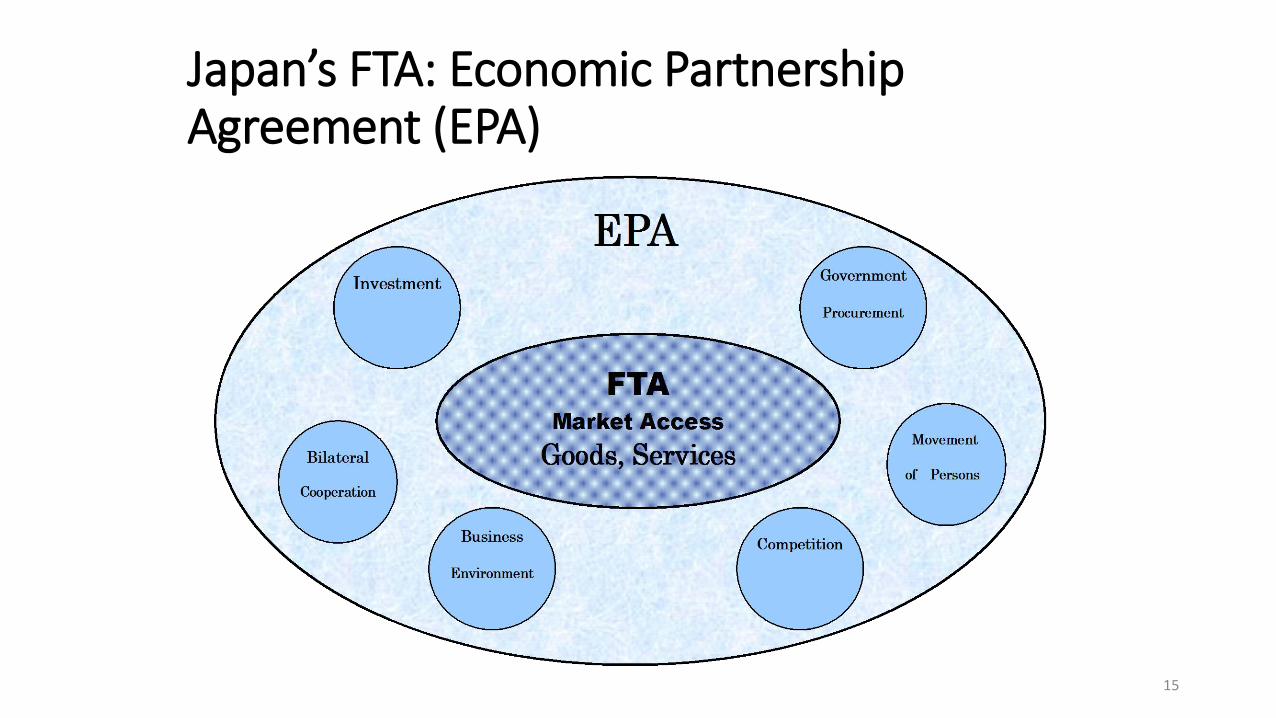
Japan’s FTA: Economic Partnership Agreement (EPA)
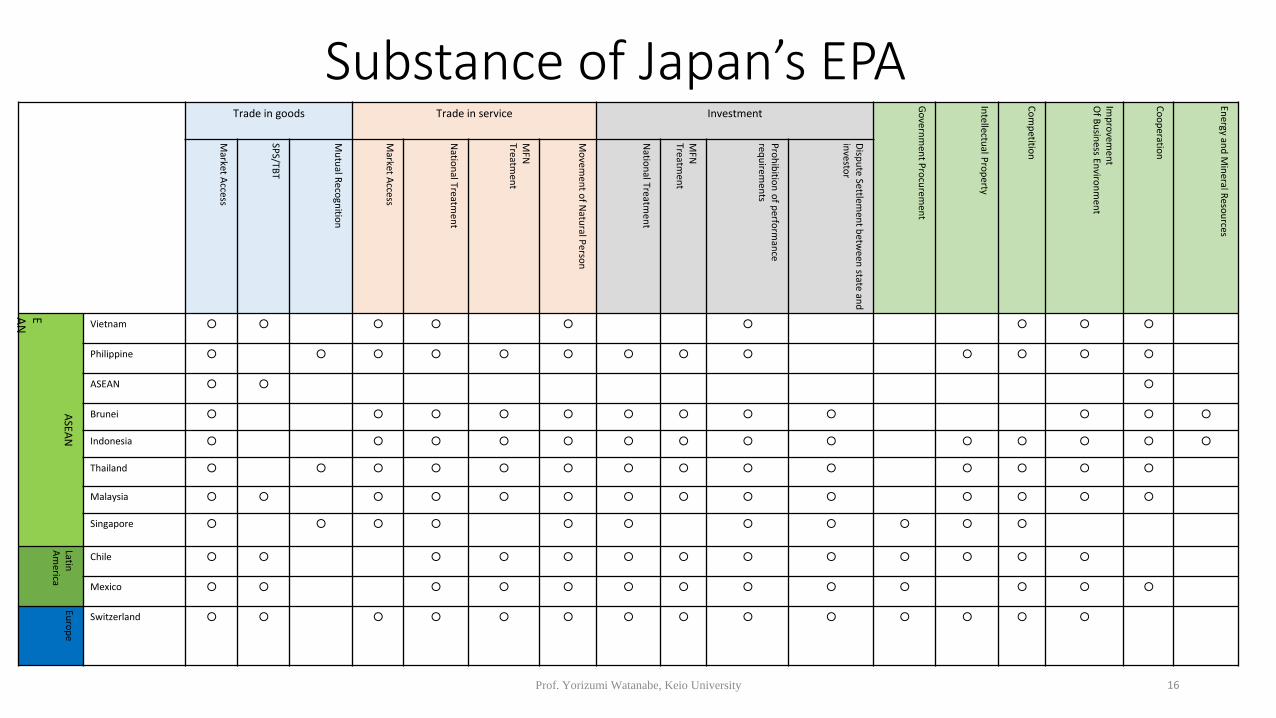
Substance of Japan’s EPA Trade in goods Trade in service Investment
Go
vernm
ent P
rocu
remen
t
Intellectu
al Pro
perty
Co
mp
etition
Imp
rovem
ent
Of B
usin
ess Enviro
nm
ent
Co
op
eration
En
ergy and
Min
eral Reso
urces
Market A
ccess
SPS/TB
T
Mu
tual R
ecogn
ition
Market A
ccess
Natio
nal Treatm
ent
MFN
Treatm
ent
Mo
vemen
t of N
atural P
erson
Natio
nal Treatm
ent
MFN
Treatm
ent
Pro
hib
ition
of p
erform
ance
requ
iremen
ts D
ispu
te Settlemen
t betw
een state an
d
investo
r
ASEA
N
E AN
Vietnam ○ ○ ○ ○ ○ ○ ○ ○ ○
Philippine ○ ○ ○ ○ ○ ○ ○ ○ ○ ○ ○ ○ ○
ASEAN ○ ○ ○
Brunei ○ ○ ○ ○ ○ ○ ○ ○ ○ ○ ○ ○
Indonesia ○ ○ ○ ○ ○ ○ ○ ○ ○ ○ ○ ○ ○ ○
Thailand ○ ○ ○ ○ ○ ○ ○ ○ ○ ○ ○ ○ ○ ○
Malaysia ○ ○ ○ ○ ○ ○ ○ ○ ○ ○ ○ ○ ○ ○
Singapore ○ ○ ○ ○ ○ ○ ○ ○ ○ ○ ○
Latin
Am
erica
Chile ○ ○ ○ ○ ○ ○ ○ ○ ○ ○ ○ ○ ○
Mexico ○ ○ ○ ○ ○ ○ ○ ○ ○ ○ ○ ○ ○
Euro
pe
Switzerland ○ ○ ○ ○ ○ ○ ○ ○ ○ ○ ○ ○ ○ ○
16 Prof. Yorizumi Watanabe, Keio University
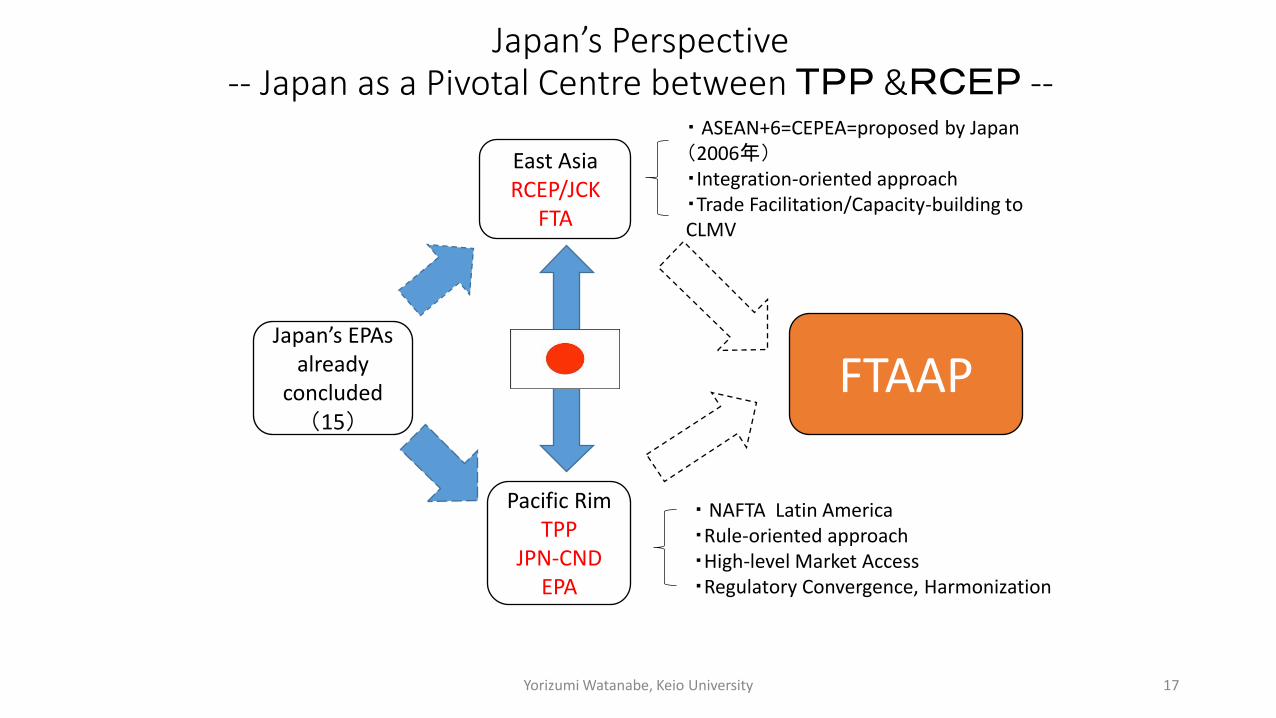
Japan’s Perspective -- Japan as a Pivotal Centre between TPP &RCEP --
East Asia RCEP/JCK
FTA
Japan’s EPAs already
concluded(15)
FTAAP
Pacific Rim TPP
JPN-CND EPA
・ ASEAN+6=CEPEA=proposed by Japan(2006年) ・Integration-oriented approach ・Trade Facilitation/Capacity-building to CLMV
・ NAFTA Latin America ・Rule-oriented approach ・High-level Market Access ・Regulatory Convergence, Harmonization
17 Yorizumi Watanabe, Keio University
Yorizumi Watanabe, Keio University 18
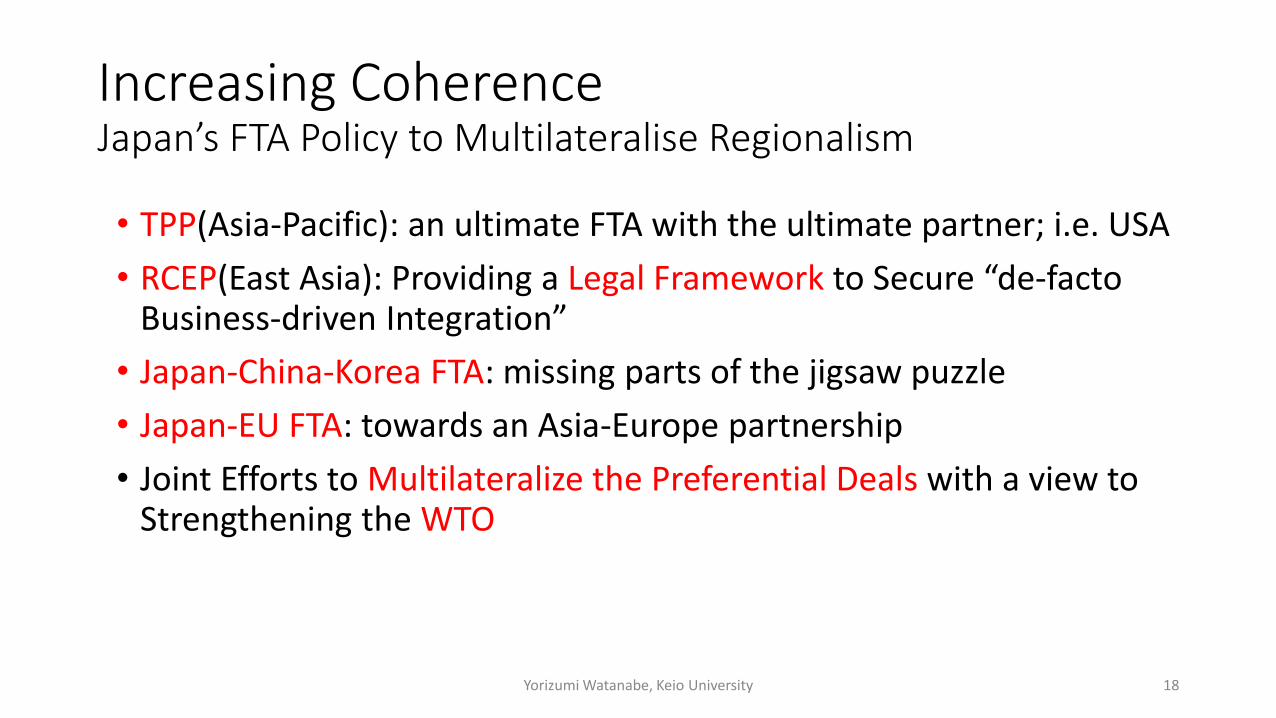
Increasing Coherence Japan’s FTA Policy to Multilateralise Regionalism
• TPP(Asia-Pacific): an ultimate FTA with the ultimate partner; i.e. USA
• RCEP(East Asia): Providing a Legal Framework to Secure “de-facto Business-driven Integration”
• Japan-China-Korea FTA: missing parts of the jigsaw puzzle
• Japan-EU FTA: towards an Asia-Europe partnership
• Joint Efforts to Multilateralize the Preferential Deals with a view to Strengthening the WTO

NAFTA USA Canada Mexico
CAFTA MERCOSUR Allianza del Pacifico East Asia
ASEAN+3(JCK) +India+Australia・NZ
RCEP
EU Trans-Atlantic
TTIP
ASEM・ Japan-EU EPA
APEC
TPP
Yorizumi Watanabe, Keio University 19

3. TPP/12 & TPP/11: A Bumpy Road to Agree on “the Golden Standard”


Agenda of the TPP Trans-Pacific Strategic Economic Partnership Agreement -”P4”: a comprehensive FTA including elimination of all tariffs among Chile, Brunei, New Zealand, and Singapore -TPP/12: ・Participants: US, Canada, Mexico, Peru, Chile, Vietnam, Malaysia, Singapore, Brunei, Australia and New Zealand, Japan
・ Goal: agreed in Oct. 2015, signed in Feb. 2016, BUT US withdrew in Jan. 2017⇒TPP/11 ・ Negotiating Agenda: 30 chapters including 4 cross-cutting issues
• Competition (SOEs)
• Market Access for goods (sugar, beef, rice,..)
• Cooperation and Capacity building
• Cross-border services
• Customs
• E-commerce
• Environment
• Financial services
• Government Procurement
• Intellectual Property Rights
• Investment (ISDS)
• Labour
• Legal issues
• Rules of Origin (textiles and apparel) • Sanitary and Phytosanitary Standards(SPS) • Technical Barriers to Trade (TBT) • Telecommunications • Temporary Entry • Textiles and apparel • Trade remedies • Regulatory coherence • Competitiveness and business facilitation • SMEs • Development
22 Yorizumi Watanabe

Japan and the TPP
• President Obama Visit in Tokyo, November 2009: a wake-up call
• PM Kan(DPJ) on the TPP at the Diet, October 2010: a strategic failure provoking strong opposition against the TPP, inter alia, from Agriculture Lobby
• PM Noda(DPJ) to step forward, November 2011/2012: influence on China (ASEAN+3 ⇒ ASEAN+6/RCEP) and the EU (FTA with Japan)
• Canada, Mexico joined TPP Negotiations 2012
• PM Abe (LDP) to join TPP Negotiations, March 2013
• Japan-US Agreement on Bilateral Talks on Cars & NTMs, April 2013
• Japan joined TPP Negotiations, July 2013
Yorizumi Watanabe, Keio University 23
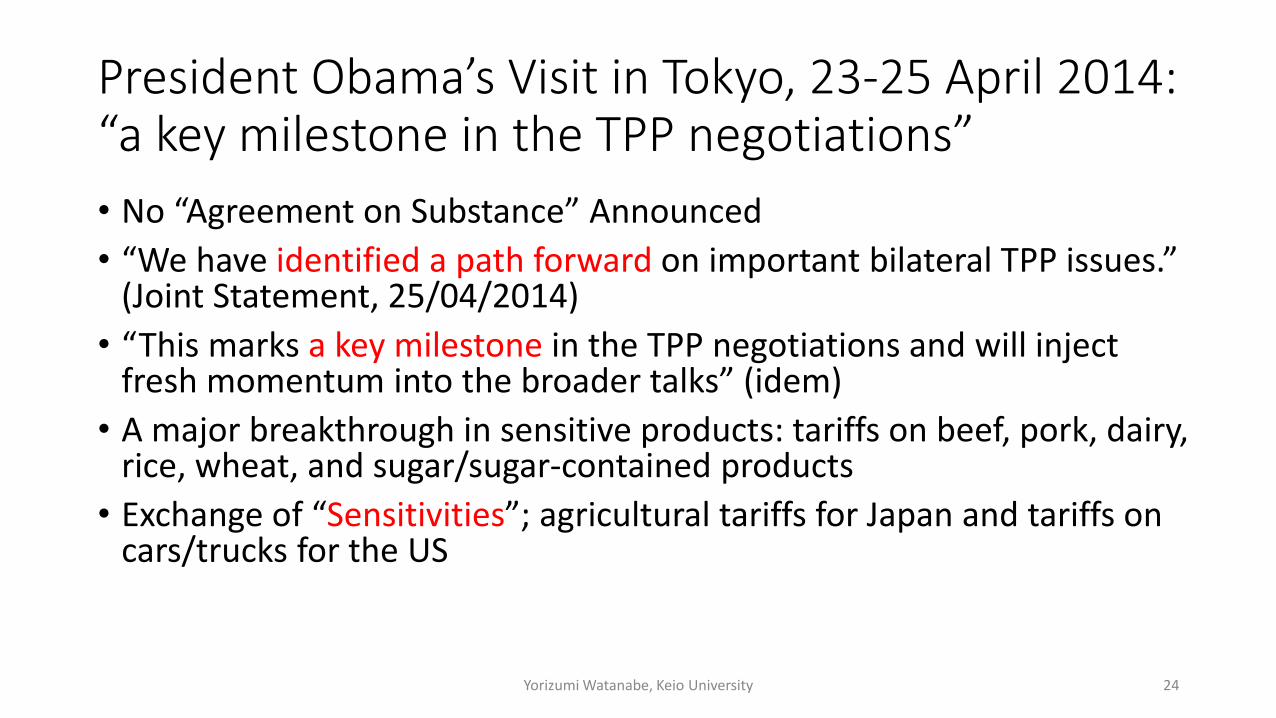
President Obama’s Visit in Tokyo, 23-25 April 2014: “a key milestone in the TPP negotiations”
• No “Agreement on Substance” Announced
• “We have identified a path forward on important bilateral TPP issues.” (Joint Statement, 25/04/2014)
• “This marks a key milestone in the TPP negotiations and will inject fresh momentum into the broader talks” (idem)
• A major breakthrough in sensitive products: tariffs on beef, pork, dairy, rice, wheat, and sugar/sugar-contained products
• Exchange of “Sensitivities”; agricultural tariffs for Japan and tariffs on cars/trucks for the US
Yorizumi Watanabe, Keio University 24

カナダ 0%
メキシコ 0% 豪州 0%
NZ 0%
シンガポール 0%
マレーシア 0%
ベトナム 0%
中国 0% 韓国 0% インド
0% 香港 0% 台湾 0%
EU 0%
その他 0%
カナダ 0%
メキシコ 0%
NZ 0%
シンガポール 0%
マレーシア 0%
ベトナム 0%
その他ASEAN 0% 中国 0% 韓国 0% インド
0%
台湾 0%
EU 0%
その他 0%
U.S. 27.5%
Canada 1.4%
Mexico 0.4%
Australia 5.9%
NZ 0.2%
Singapore 3.5%
Malaysia 1.3%
Vietnam 0.8%
Other ASEAN countries
6.2% China 9.0%
South Korea 2.5%
India 1.5%
Hong Kong 1.8%
Taiwan 1.3%
EU 22.9%
Other 14.0%
TPP
41.0%
RCEP 30.8%
U.S. 17.6%
Canada 1.3%
Mexico 1.3%
Chile 0.2%
Peru 0.1%
Australia 2.3%
NZ 0.2%
Singapore 2.9%
Malaysia 2.2%
Vietnam 1.3% Other ASEAN
countries 9.7%
China 18.1%
South Korea 7.7%
India 1.3%
Taiwan 5.8%
Hong Kong 5.1%
EU 10.2%
Other 12.5%
RCEP
45.8%
TPP
29.6%
Trade data: Trade Statistics of Japan
(Ministry of Finance, 2012)
Japan→world
(2012)
89,812,800
million yen
Japan→world
(2012)
63,747,600
million yen
Proportion of Japanese exports by region, in
2012
Proportion of Japanese FDI by region, in 2012
Approx. 45.8% of exports by value were exported to states engaged in RCEP
negotiations.
Approx. 30.8% of foreign direct investment was invested in states engaged in RCEP
negotiations.
*Individual figures for Peru, Chile, Brunei, and Papua New Guinea are excluded,
since they have not published stock results. However, total figures by region include
those states that have not published their results.
Source: Japanese foreign assets and liabilities balance (Ministry of Finance)
Direct investment (assets) balance statistics, by region (Bank of Japan)
25
The significance to Japan of the Pacific-Asia region
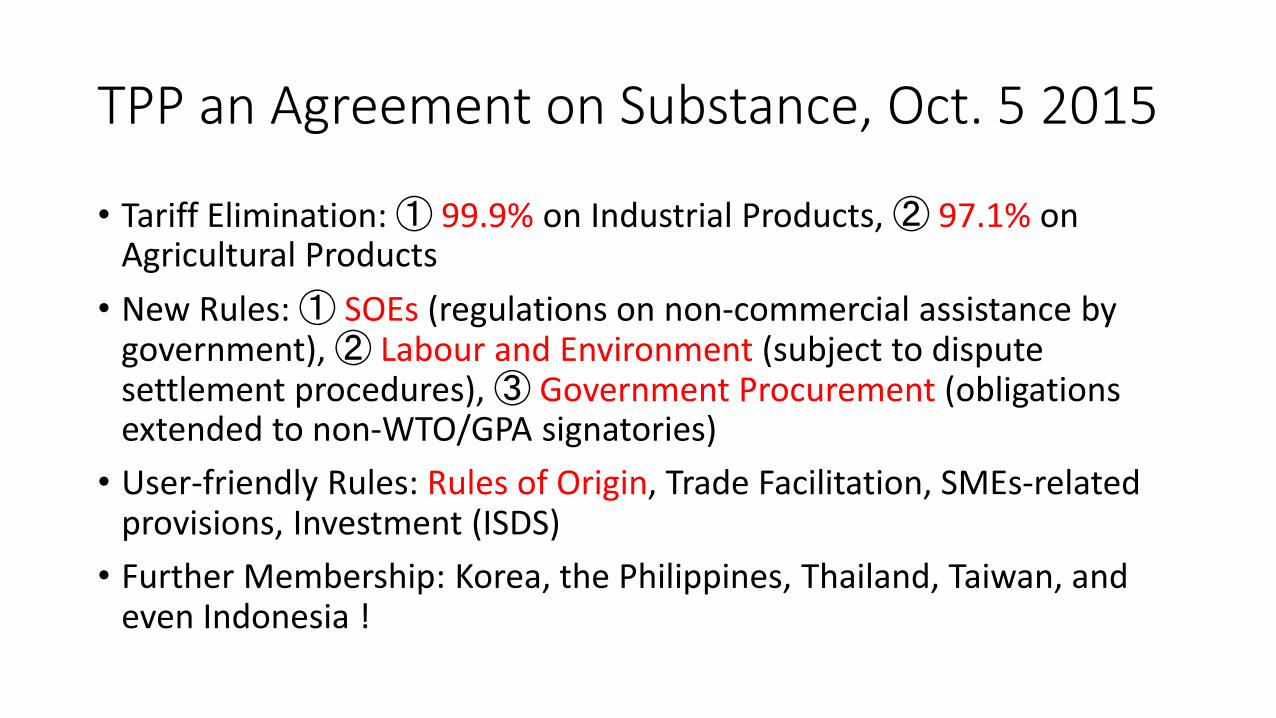
TPP an Agreement on Substance, Oct. 5 2015
• Tariff Elimination: ① 99.9% on Industrial Products, ② 97.1% on Agricultural Products
• New Rules: ① SOEs (regulations on non-commercial assistance by government), ② Labour and Environment (subject to dispute settlement procedures), ③ Government Procurement (obligations extended to non-WTO/GPA signatories)
• User-friendly Rules: Rules of Origin, Trade Facilitation, SMEs-related provisions, Investment (ISDS)
• Further Membership: Korea, the Philippines, Thailand, Taiwan, and even Indonesia !

Tariff Elimination in the TPP Negotiations: Tariff Offer by Japan (81% of agri-tariffs)
95%: tariffs maintained on 412 products (rice, sugar, wheat, dairy products, beef/port, etc)
Provided that the tariffs to be eliminated on leather products, wine, chocolate, cockies, salt, tobacco, beef tongue, etc
93.5%: tariff maintained on 586 products (rice, wheat, dairy, beef/pork, sugar, pineapple, etc.)
89.7%: tariffs maintained on 929 products that Japan has never offered zero-duty
88.4%: the highest level of tariff concession by Japan’s EPA (the Japan-Philippines EPA)
27 Yorizumi Watanabe

Rules of Origin in TPP (most generous accumulation rule to facilitate supply chain) • ASEAN CEPT scheme: 40%
• NAFTA scheme: 62.5% (in case of auto/auto-parts)
• Completed Passenger Vehicle: 55% (exceptions where special considerations provided to such items as; tempered glass, car-body for passenger vehicle, car-body of commercial vehicle, bumper, door, axle)
• Car Parts/Components: Change in Tariff Classification Criteria or Value-added Criteria (45~55%)
⇒⇒⇒ some shift of production might take place from non-TPP countries to TPP member countries
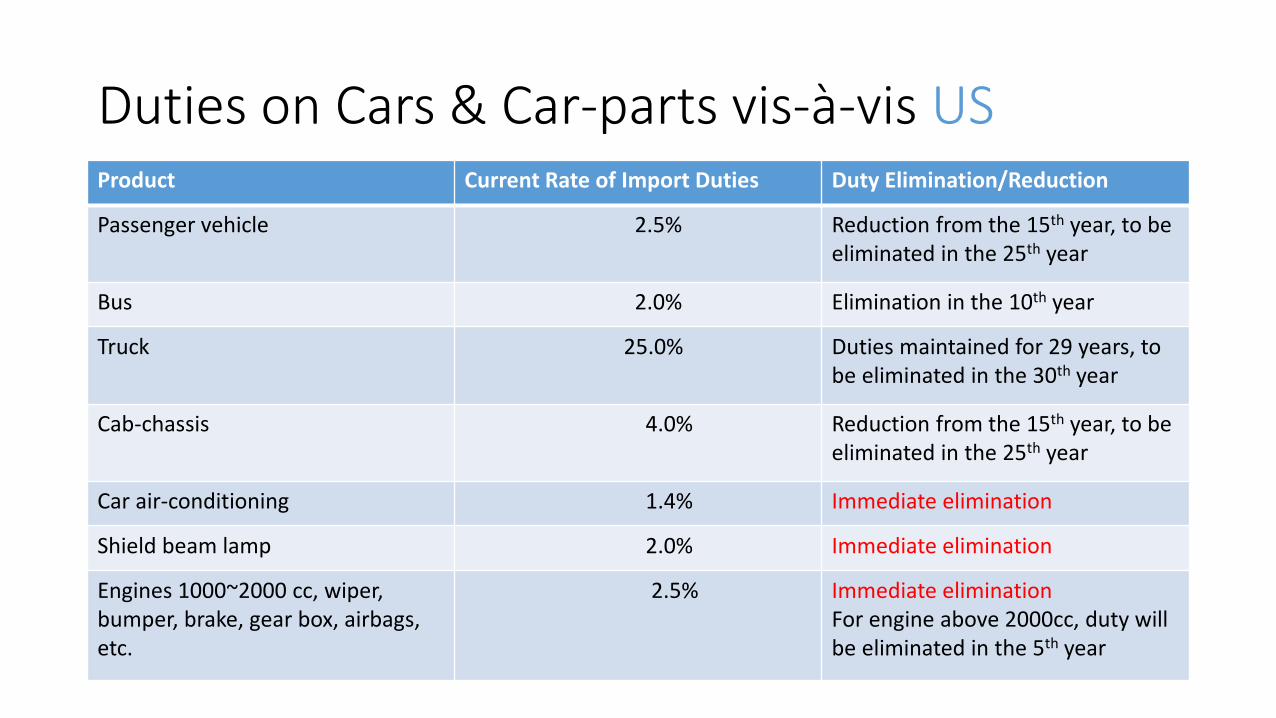
Duties on Cars & Car-parts vis-à-vis US Product Current Rate of Import Duties Duty Elimination/Reduction
Passenger vehicle 2.5% Reduction from the 15th year, to be eliminated in the 25th year
Bus 2.0% Elimination in the 10th year
Truck 25.0% Duties maintained for 29 years, to be eliminated in the 30th year
Cab-chassis 4.0% Reduction from the 15th year, to be eliminated in the 25th year
Car air-conditioning 1.4% Immediate elimination
Shield beam lamp 2.0% Immediate elimination
Engines 1000~2000 cc, wiper, bumper, brake, gear box, airbags, etc.
2.5% Immediate elimination For engine above 2000cc, duty will be eliminated in the 5th year

Duties on Cars & Car-parts vis-à-vis Canada
Product Current Rate of Import Duties Duty Elimination/Reduction
Passenger vehicle 6.1% To be eliminated in the 5th year
Bus 6.1% To be eliminated in the 11th year
Large gasoline truck 6.1% To be eliminated in the 6th year
Truck 6.1% To be eliminated in the 11th year
Car air-conditioning, car body, brake, suspension, steering gear, etc.
6.0% Immediate elimination
tire 7.0% To be eliminated in the 4th year

Duties on Cars & Car-parts vis-à-vis Mexico
Product Current Rate of Import Duties Duty Elimination/Reduction
Passenger vehicle 15~30% Immediate elimination
Bus 15~30% Phasing-out over 10 years
Small truck 15~30% Immediate elimination
Medium-sized & large truck 30% Phasing-out over 10 years
Used car 50% Reduction at coming-into-force
Engine parts 5% Immediate elimination
Shock-absorber parts 5% To be eliminated in the 5th year

Duties on Cars & Car-parts vis-à-vis Others
Country Product Current Rate of Import Duties
Duty Elimination/Reduction
New Zealand Passenger vehicle 10% Immediate elimination
New Zealand Bus 5% Immediate elimination
New Zealand Truck 5% Immediate elimination
Peru Passenger vehicle 9% Immediate elimination
Viet Nam Passenger vehicle above 3000cc
77/80 % To be eliminated in the 10th year
Viet Nam Passenger vehicle below 3000cc
77~83% To be eliminated in the 13th year
Viet Nam Truck 10~80% To be eliminated in the 12th ~13th year

4. The Japan-Mexico EPA(2005) and Beyond The Renewed Partnership between Japan and Mexico as a model for future Japan-Latin America Economic Relations
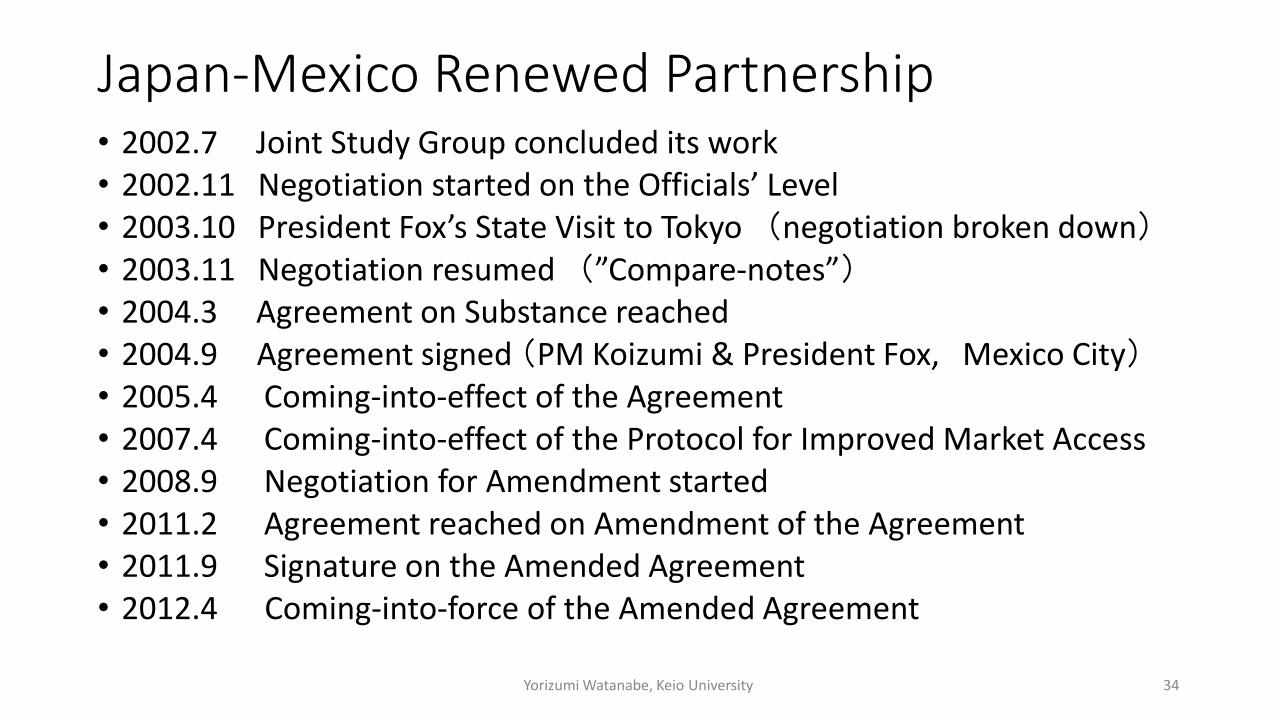
Japan-Mexico Renewed Partnership • 2002.7 Joint Study Group concluded its work • 2002.11 Negotiation started on the Officials’ Level • 2003.10 President Fox’s State Visit to Tokyo (negotiation broken down) • 2003.11 Negotiation resumed (”Compare-notes”) • 2004.3 Agreement on Substance reached • 2004.9 Agreement signed (PM Koizumi & President Fox, Mexico City) • 2005.4 Coming-into-effect of the Agreement • 2007.4 Coming-into-effect of the Protocol for Improved Market Access • 2008.9 Negotiation for Amendment started • 2011.2 Agreement reached on Amendment of the Agreement • 2011.9 Signature on the Amended Agreement • 2012.4 Coming-into-force of the Amended Agreement
Yorizumi Watanabe, Keio University 34

Increase in Bilateral Trade between Japan and Mexico (2004-2013) ☆Two-way Trade: JPY 785 billion (2004) ⇒ JPY 1,358 billion (2013)
Mexico ⇒ Japan • Pork: 32,712 t (2004) ⇒ 57,379 t (2013) • Beef: 1,772 t (2004) ⇒ 14,272 t (2013)
Japan ⇒ Mexico • Automobile: JPY 82.7billion (2004) ⇒ JPY135.3 billion (2013) • Auto Parts: JPY 58.3 billion (2004) ⇒ JPY 137.2 billion (2013)
☆Self-declaration for Certification in Rules-of-Origin ☆Improvement of Business Environment ☆Government Procurement
Yorizumi Watanabe, Keio University 35

Japanese Companies in Mexico (2004-2015)
310 326367 384 366 399 428
464546
679
814
957
0
100
200
300
400
500
600
700
800
900
1000

World Car Production Top 15 (2005-2014) RANKING 2005 million unit 2013 million unit 2014 million unit
1 USA 11.9 China 22.1 China 23.7
2 Japan 10.8 USA 11.1 USA 11.7
3 Germany 5.8 Japan 9.6 Japan 9.8
4 China 5.7 Germany 5.7 Germany 5.9
5 ROK 3.7 ROK 4.5 ROK 4.5
6 France 3.5 India 3.9 India 3.8
7 Spain 2.8 Brazil 3.7 Mexico 3.4
8 Canada 2.7 Mexico 3.1 Brazil 3.1
9 Brazil 2.5 Thailand 2.5 Spain 2.4
10 UK 1.8 Canada 2.4 Canada 2.4
11 Mexico 1.7 Spain 2.2 Russia 1.9
12 India 1.6 Russia 2.2 Thailand 1.9
13 Russia 1.4 France 1.7 France 1.8
14 Thailand 1.1 UK 1.6 UK 1.6
15 Italy 1.0 Indonesia 1.2 Indonesia 1.3
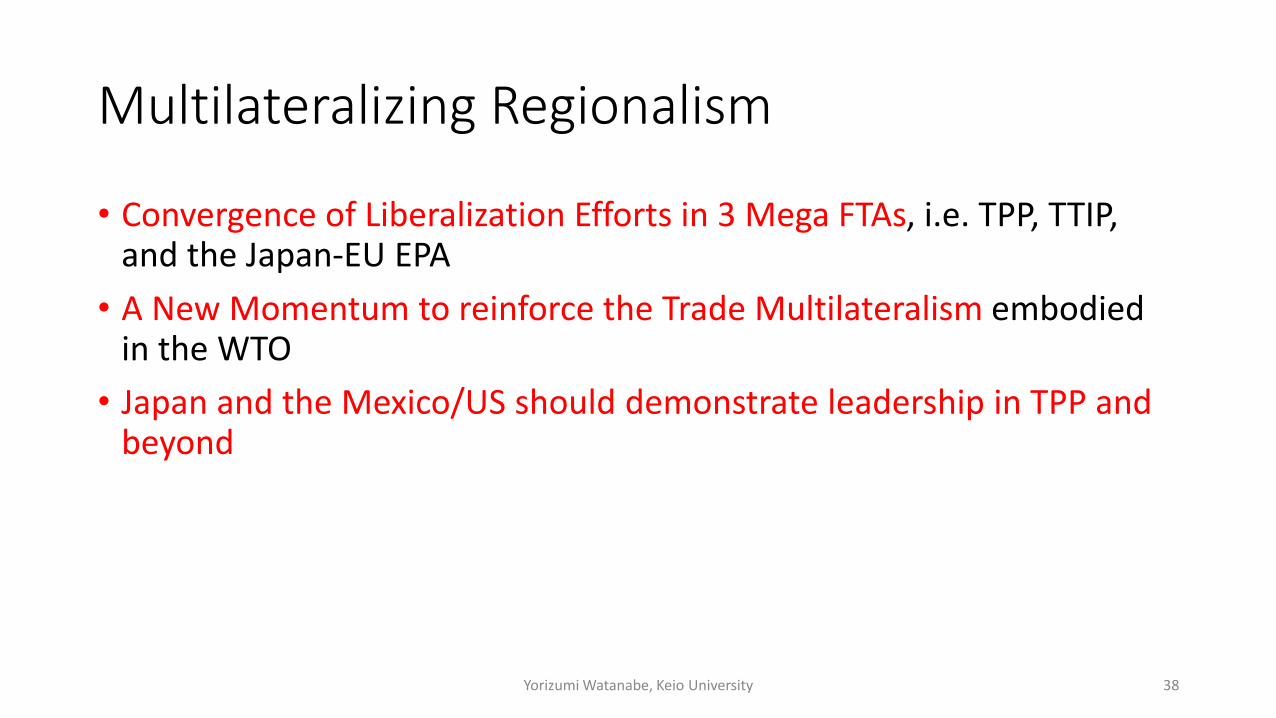
Multilateralizing Regionalism
• Convergence of Liberalization Efforts in 3 Mega FTAs, i.e. TPP, TTIP, and the Japan-EU EPA
• A New Momentum to reinforce the Trade Multilateralism embodied in the WTO
• Japan and the Mexico/US should demonstrate leadership in TPP and beyond
Yorizumi Watanabe, Keio University 38

5. The Bilateral Relations between Japan and Brazil

The Bilateral Economic Relations between Japan and Brazil • Japan’s Export to Brazil: US$ 5.9 billion, 2.6% of Brazil’s Total Import
(MDIC,2014)
• Japan’s Import from Brazil: US$ 6.7 billion, 3% of Brazil’s Total Export (MDIC, 2014)
• FDI from Japan: US$ 3.8 billion (DECAM, 2014), 450+Japanese Companies
• Untapped Potentiality: rich agriculture, natural resources, energy, growing market with young population, etc.
• MERCOSUR since 1995: Pros & Cons
• Proposal on “Japan-Brazil Economic Partnership Agreement” by Japan’s Keidanren and CNI of Brazil, Aug.-Sept. 2015

6. Conclusions TPP provides a momentum to free trade arrangements such as RCEP, JCK FTA and ASEAN Economic Community.
In the absence of WTO/DDA development on rule-making, the TPP rules could become “model rules” in such area as Investment, Competition, and Government Procurement etc.
Japan is interested in high-quality rules as well as high-level market access liberalization with the like-minded countries like Pacific Alliance Members across Asia-Pacific and beyond. Japan and Brazil should explore all the possibilities to establish a FTA between them.

Thank you for Your Attention --- Free Trade for a Better Future ---
42 Yorizumi Watanabe, Keio University
![INDIRECT EXPROPRIATION UNDER NAFTA AND DR-CAFTA: … · 2006] INDIRECT EXPROPRIATION UNDER NAFTA AND DR-CAFTA 933 NAFTA and DR-CAFTA. Part II explains how three earlier NAFTA tribunals](https://img.dokumen.tips/doc/110x75/5ec6d30ffb2475648e7b2fba/indirect-expropriation-under-nafta-and-dr-cafta-2006-indirect-expropriation-under.jpg)