Embed Size (px)
Citation preview
Japanese Banks:Risks and Opportunities
Jonathan Cornish, Managing Director
19 September 2013

Agenda
Macro Environment
Risks and Opportunities for Japan’s Banks
www.fitchratings.com
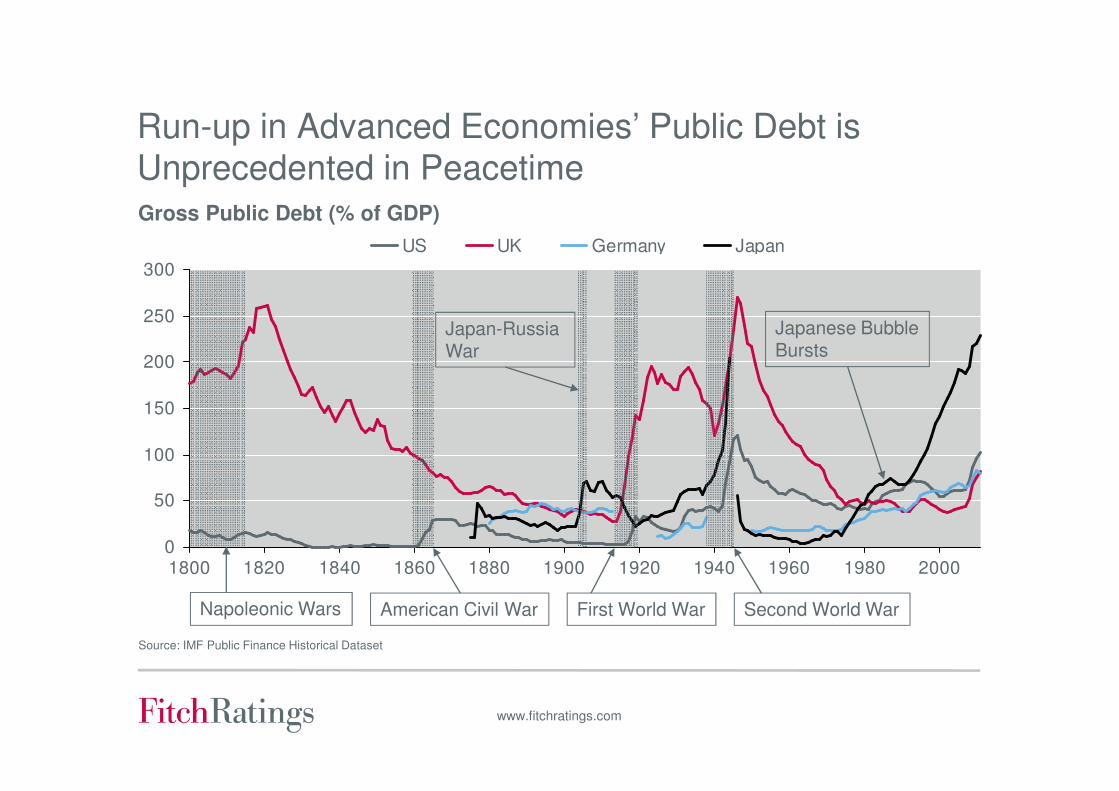
Run-up in Advanced Economies’ Public Debt is Unprecedented in PeacetimeGross Public Debt (% of GDP)
0
50
100
150
200
250
300
1800 1820 1840 1860 1880 1900 1920 1940 1960 1980 2000
US UK Germany Japan
Japan-Russia War
Japanese BubbleBursts
Source: IMF Public Finance Historical Dataset
Napoleonic Wars American Civil War First World War Second World War
www.fitchratings.com
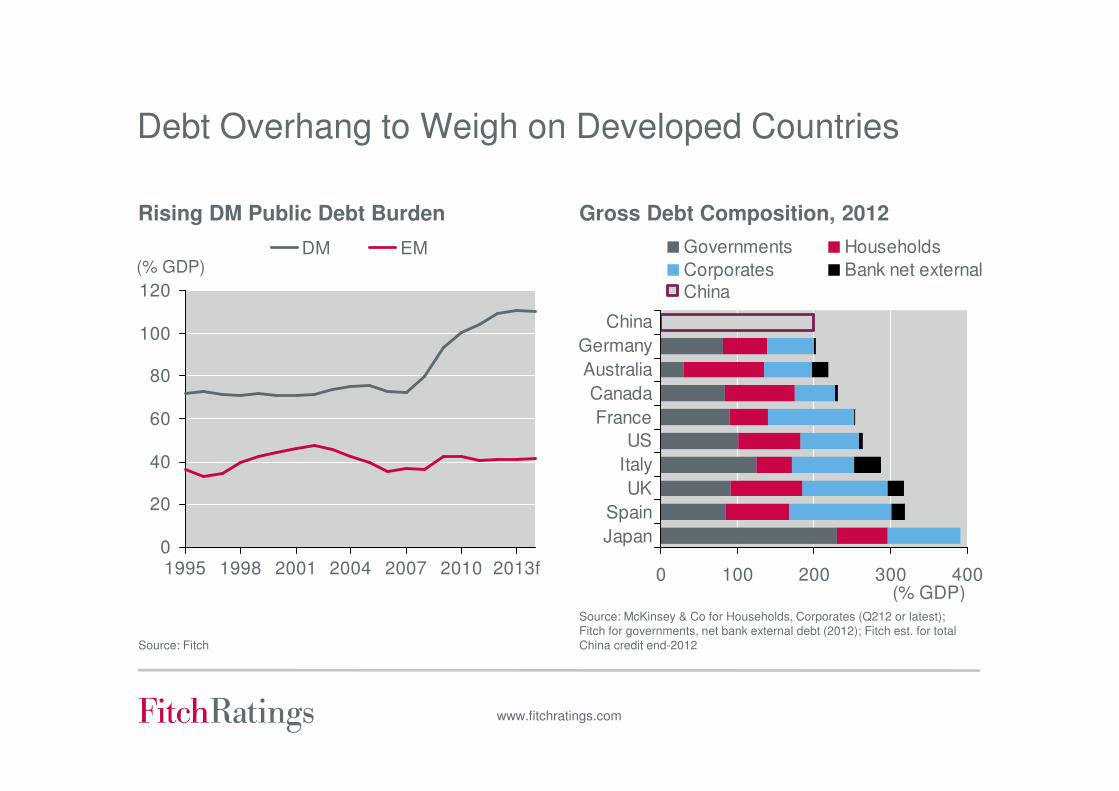
Debt Overhang to Weigh on Developed Countries
Rising DM Public Debt Burden
0
20
40
60
80
100
120
1995 1998 2001 2004 2007 2010 2013f
DM EM(% GDP)
Source: Fitch
Source: McKinsey & Co for Households, Corporates (Q212 or latest); Fitch for governments, net bank external debt (2012); Fitch est. for total China credit end-2012
0 100 200 300 400
Japan
Spain
UK
Italy
US
France
Canada
Australia
Germany
China
Governments Households
Corporates Bank net external
China
(% GDP)
Gross Debt Composition, 2012
www.fitchratings.com
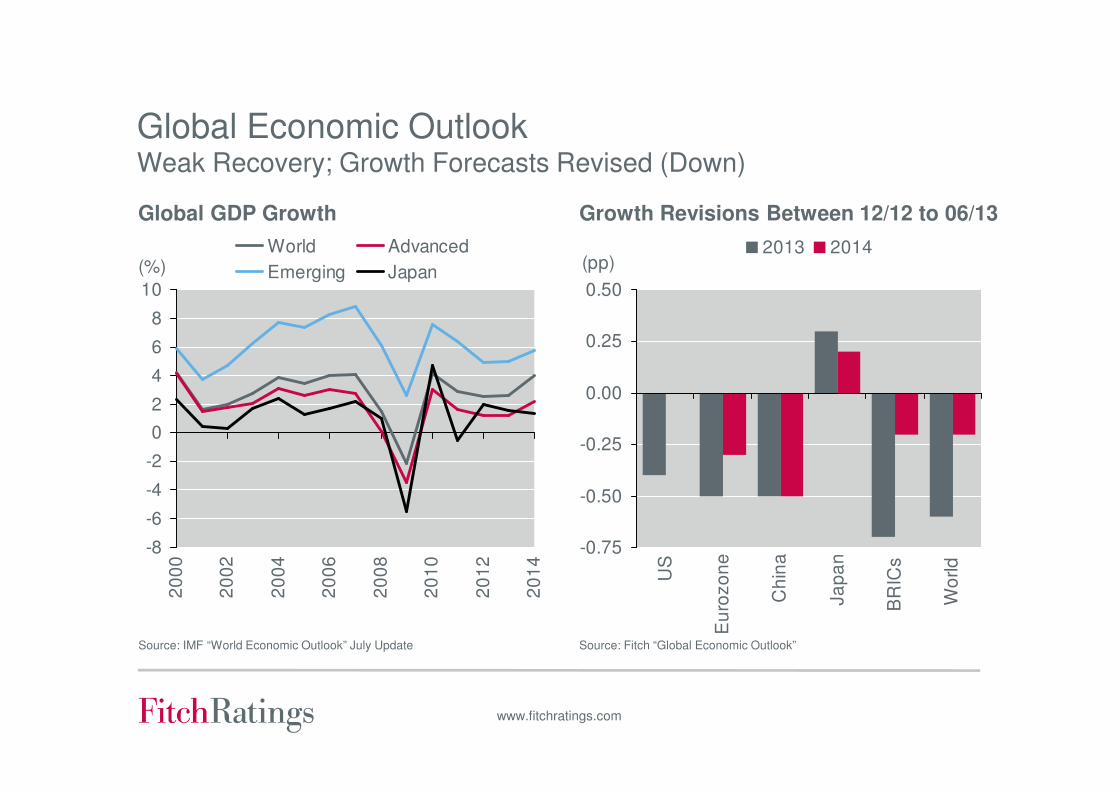
Global Economic OutlookWeak Recovery; Growth Forecasts Revised (Down)
Global GDP Growth
Source: IMF “World Economic Outlook” July Update Source: Fitch “Global Economic Outlook”
-0.75
-0.50
-0.25
0.00
0.25
0.50
US
Eu
rozo
ne
Ch
ina
Ja
pa
n
BR
ICs
Wo
rld
2013 2014(pp)
Growth Revisions Between 12/12 to 06/13
-8
-6
-4
-2
0
2
4
6
8
10
20
00
20
02
20
04
20
06
20
08
20
10
20
12
20
14
World Advanced
Emerging Japan(%)

www.fitchratings.com
Abenomics: Can Wages, Investment Grow Sustainably?Business Confidence
Source: CEIC, Fitch Source: CEIC, Fitch
Wages Growth
-4
-3
-2
-1
0
1
2
12/06 12/07 12/08 12/09 12/10 12/11 12/12
Nominal Real(% yoy)
-30
-20
-10
0
10
20
30
12/06 12/07 12/08 12/09 12/10 12/11 12/1225
30
35
40
45
50
55
Sentix (LHS)
Shoko Chukin (RHS)(Index) (Index)

www.fitchratings.com
Changing of Competitive Landscape
• EU/US bank deleveraging
• Political pressure to boost lending in home markets
• Many of the more “international banks” have support-driven IDRs …
• … but resolution regimes will lead to the erosion of sovereign support in the future
• Anticipate further improvement in financial profiles
- Capital now sound, but regulation driving even larger buffers
- Profit still subdued
• Selective pull-back or restraint (mostly by EU banks) from APAC markets so far …
• … but expected to expand again in APAC over the medium term
• APAC banks have been looking abroad in the region
• Expansion organically and inorganically
• Portfolio restructuring (expansion or divestment)
• Interest also in new frontier EM countries
• Varying degrees of financial capability and track record
- Less attention on Basel 3 concerns, as the region is generally already compliant (or expected to be)

www.fitchratings.com
Key Macro Prudential Risk Indicators for APAC
Country BSI Mar 07 Sep 07 Oct 08 Nov 09 Jun 10 Nov 10 Jun 11 Dec 11 Aug 12 Jan 13
Mongolia 3 3
China bb 1 1 1 1 3 3 3 3 3 3
Hong Kong a 1 1 1 1 1 3 3 3 3 3
Indonesia bb 1 1 1 1 2 2 2 3 3 3
Sri Lanka 1 1 1 1 1 1 1 3 3 3
Vietnam b 2 2 2 2 3 3 3 2 2 2
Australia aa 3 3 3 3 2 2 2 2 2 1
Korea bbb 1 3 3 3 2 2 2 1 1 1
Singapore aa 1 1 1 1 1 1 1 2 2 2
India bb 2 2 2 2 2 1 1 1 1 1
Taiwan bbb 1 1 1 1 1 1 1 1 1 1
Thailand bbb 1 1 1 1 1 1 1 1 1 1
Japan a 1 1 1 1 1 1 1 1 1 1
MPI: 3 = high vulnerability to potential systemic stress, 1 = low vulnerabilityBSI: Weighted average of Bank Viability Ratings in SystemSource: Fitch Macro-Prudential Risk Monitor
www.fitchratings.com
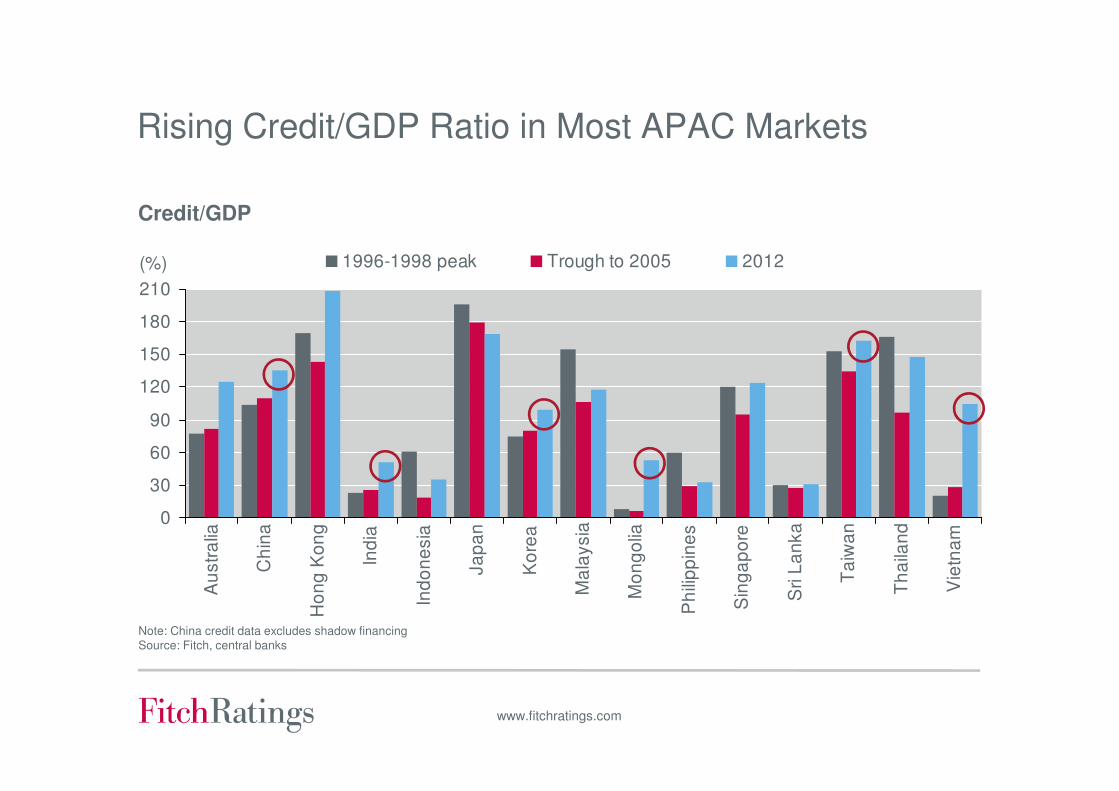
Rising Credit/GDP Ratio in Most APAC Markets
0
30
60
90
120
150
180
210
Au
str
alia
Ch
ina
Ho
ng
Ko
ng
Ind
ia
Ind
on
esia
Ja
pa
n
Ko
rea
Ma
laysia
Mo
ng
olia
Ph
ilip
pin
es
Sin
ga
po
re
Sri L
an
ka
Ta
iwa
n
Th
aila
nd
Vie
tna
m
(%) 1996-1998 peak Trough to 2005 2012
Note: China credit data excludes shadow financingSource: Fitch, central banks
Credit/GDP

Agenda
Macro Environment
Risks and Opportunities for Japan’s Banks

www.fitchratings.com
2006 2007 2008 2009 2010 2011 2012 2013
LT SRF
A-
A
A+
BBB+
2006 2007 2008 2009 2010 2011 2012 2013
LT SRF
BBB+
A-
A
A+
Japan’s Mega Banks: What’s Driving the Ratings …
• Fundamental improvements led
to VR upgrades
• Further improvements expected
(meeting future Basel 3 thresholds)
• Standalone profiles not uniform
• Mizuho’s IDR still support-driven
• Stable Outlook predicated on…
• Strong domestic franchises
• Executing stated plans to de-risk
• Pro-actively managing market risk
• Moderate offshore expansion (no
major increase in risk appetite)
BTMU: VR = a; IDR = A
SMFG: VR = a-; IDR = A-
Mizuho: VR = bbb+; IDR = A-

www.fitchratings.com
Abenomics: Major Uncertainties…
JGB Yields
Consumption & Corporate
Tax
Government Debt
Ageing Population
Direction of Indices
Inflation and Investment
Balancing the Budget
Sustainable Economic
Growth
Trading Partners
Competitive
Corporate Sector
Asset Quality
JPY
Government Support prospects

www.fitchratings.com
Japan: Trade PartnersReliance on China and Other China-Dependent Countries
0%
20%
40%
60%
80%
100%
Export Import Export Import
China HK Taiwan Korea Asia ANZ NA Europe Others
Source: JTIS
Percentage of Trade Volumes
Dec 2010 Jun 2013

www.fitchratings.com
Risk of JGB Holdings: Large Exposure Manageable
a Japan banks at March 2013, other banks at December 2012. Source: JTIS
Government Bonds/Total Assetsa Duration Control Mitigates Risk
Fitch’s Stress Test ResultsMega Banks’ Average FCC Ratio Under Stress
AFS at Cost: Exposure to Stabilise
Sep 12 (10yr
JGB = 0.765%)
FCC
average
+50bp
(1.265%)
+100bp
(1.765%)
+150bp
(2.265%)
Mega banking groups 9.3% 9.0% 8.6% 8.3%
5
10
15
20
25
Mar 08 Mar 09 Mar 10 Mar 11 Mar 12 Mar 130
10
20
30
40
City banks' current a/c with BOJ (RHS)MUFG (LHS)SMFG (LHS)Mizuho (LHS)
(% total
assets) (JPYtn)
0
1
2
3
4
Mar 09 Mar 10 Mar 11 Mar 12 Mar 13
MUFG SMFG Mizuho(Yr)
0
5
10
15
20
StC
ha
rtere
d (
aa-)
No
rdea(a
a-)
Wells
Farg
o(a
a-)
Sta
te S
tre
et(
a+
)
CA
(a)
ING
(a)
Un
iCre
dit(b
bb+
)
Gro
up
e B
PC
E(a
)
MU
FG
(a)
SG
(a-)
BB
VA
(bb
b+
)
Santa
nde
r(b
bb+
)
SM
FG
(a-)
Miz
uho
(bbb+
)
BoC
(bb
)
(%)
www.fitchratings.com
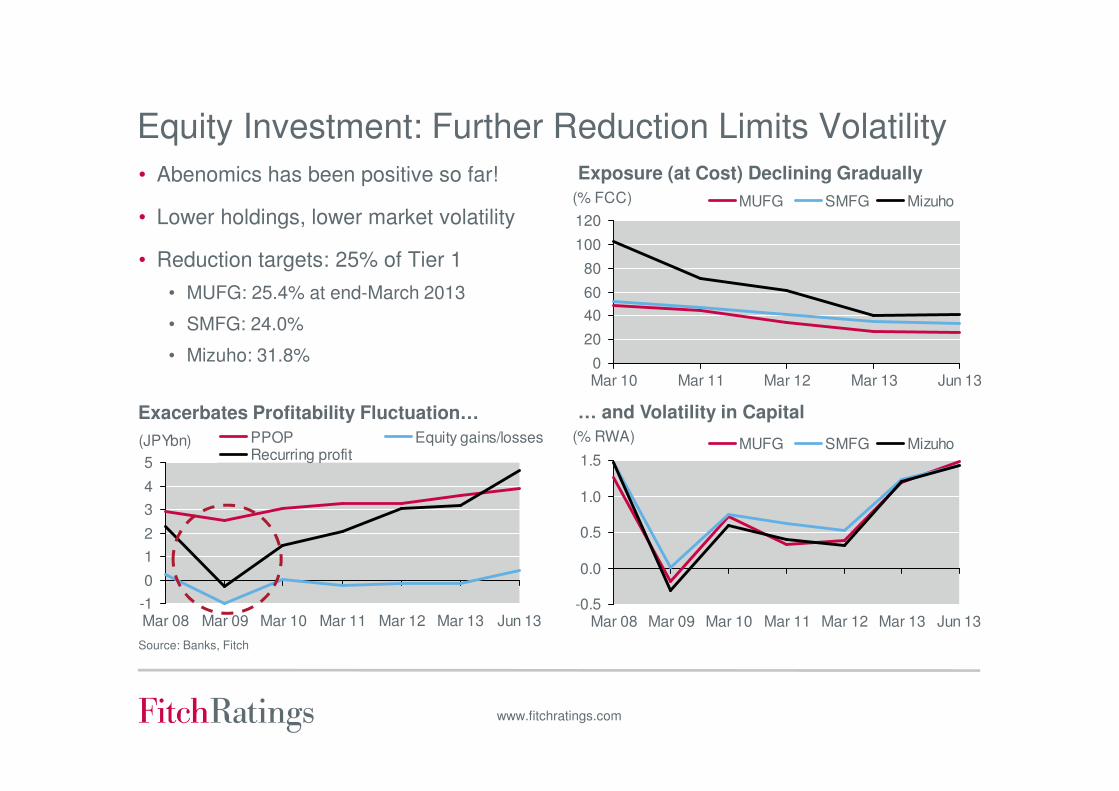
Equity Investment: Further Reduction Limits Volatility
• Abenomics has been positive so far!
• Lower holdings, lower market volatility
• Reduction targets: 25% of Tier 1
• MUFG: 25.4% at end-March 2013
• SMFG: 24.0%
• Mizuho: 31.8%
Source: Banks, Fitch
Exposure (at Cost) Declining Gradually
Exacerbates Profitability Fluctuation… … and Volatility in Capital
0
20
40
60
80
100
120
Mar 10 Mar 11 Mar 12 Mar 13 Jun 13
MUFG SMFG Mizuho(% FCC)
-1
0
1
2
3
4
5
Mar 08 Mar 09 Mar 10 Mar 11 Mar 12 Mar 13 Jun 13
PPOP Equity gains/lossesRecurring profit
(JPYbn)
-0.5
0.0
0.5
1.0
1.5
Mar 08 Mar 09 Mar 10 Mar 11 Mar 12 Mar 13 Jun 13
MUFG SMFG Mizuho(% RWA)

www.fitchratings.com
Domestic Landscape: Little Attraction for Banks
Note: Figures are each group's consolidated figures. Source: Banks, Fitch
Corporate Funds Flow Drives Loans
Risk/Return Reward Evident in NIM? Fee Income to Supplement NIR
Lending has Ticked Upwards in 2013
0.0
0.5
1.0
1.5
FYE08 FYE09 FYE10 FYE11 FYE12 FYE13
MUFG SMFG Mizuho(%)
0.7
0.8
0.9
1.0
1.1
FYE08 FYE09 FYE10 FYE11 FYE12 FYE13
MUFG SMFG Mizuho(FYE08=1)
0.8
0.9
1.0
1.1
MUFG SMFG Mizuho
FYE08 FYE09 FYE10
FYE11 FYE12 FYE13(FYE08=1)
-40
0
40
80
120
FYE03 FYE05 FYE07 FYE09 FYE11 FYE13
Change in capital Bond issuanceLT debt ST debtInternal capital generation DepreciationNet flow(JPYtn)

www.fitchratings.com
Non-APAC Bank Deleveraging = Opportunities
• Deleveraging confined
mostly to EU banks
• Pronounced in most markets,
but already tapering
• US claims growth flat to
modest
• Gaining share where foreign
claims are falling
• Growing Japanese share of
foreign claims
• Complement organic growth
with stakes in higher-growth
markets in APAC…
• …but more patient in EU
Source: BIS, Fitch
0
5
10
15
20
25
30
0
5000
10000
15000
20000
99 01 03 05 07 09 11 Q113
Foreign claim (LHS)
Developed APAC* (RHS)
Japan (RHS)
Europe (RHS)
US (RHS)(USbn)
*Australia, Korea and Taiwan
60
70
80
҂
(%)
0
10
20
30
40
50
60
0
1000
2000
3000
99 01 03 05 07 09 11 Q113
Foreign claim (LHS)
US (RHS)
Europe (RHS)
Japan (RHS)
Australia, Korea and Taiwan (RHS)(USbn)
*Australia, NZ, Korea, HK, Macau, Singapore, Taipei
(%)
0
10
20
30
40
50
60
0
300
600
900
1200
1500
1800
99 01 03 05 07 09 11 Q113
Foreign claim (LHS)
US (RHS)
Europe (RHS)
Developed APAC (RHS)**
Japan (RHS)(USbn)
*Excl. Korea & Taiwan (DMs); **Austraila, Korea & Taiwan
(%)
Share of Foreign Claims: Developed APAC*
Share of Foreign Claims: Developed Europe
Share of Foreign Claims: Emerging APAC*
Share of Foreign Claims: US
*Australia, Korea and Taiwan
0
20
40
60
80
0
2,000
4,000
6,000
8,000
Foreign claim (LHS)
Japan (RHS)
Europe (RHS)
(USbn) (%)
99 01 03 05 07 09 11 Q113

www.fitchratings.com
0
5
10
15
20
25
FYE10 FYE11 FYE12MUFG
FYE13 FYE10 FYE11 FYE12SMFGª
FYE13 FYE10 FYE11 FYE12Mizuho
FYE13
Others E. Europe W. Europe Latin America N. America Asia (ex Japan)(% total loans)
Mega Banks: Offshore Expansion
APAC: A Loan Growth Engine
Overseas Loans: Fee Income GrowthOverseas Loans: Enhancing NIM
0.0
0.5
1.0
1.5
FYE08 FYE09 FYE10 FYE11 FYE12 FYE13
MUFG (Jp) MUFG (Ovs.)SMFG (Jp) SMFG (Ovs.)Mizuho (Jp) Mizuho (Ovs.)
(%)
0.0
0.5
1.0
1.5
2.0
FYE08 FYE09 FYE10 FYE11 FYE12 FYE13
MUFG SMFG Mizuho(FYE08=1)
Note: Figures are operating banks non-consolidatedNote: Figures are each group's consolidated figuresª Sumitomo Mitsui Banking Corporation (SMBC) non-consolidated. Source: Banks, Fitch
www.fitchratings.com
0
1
2
3
4
MUFG Mizuho SMFG Global peer
ave.
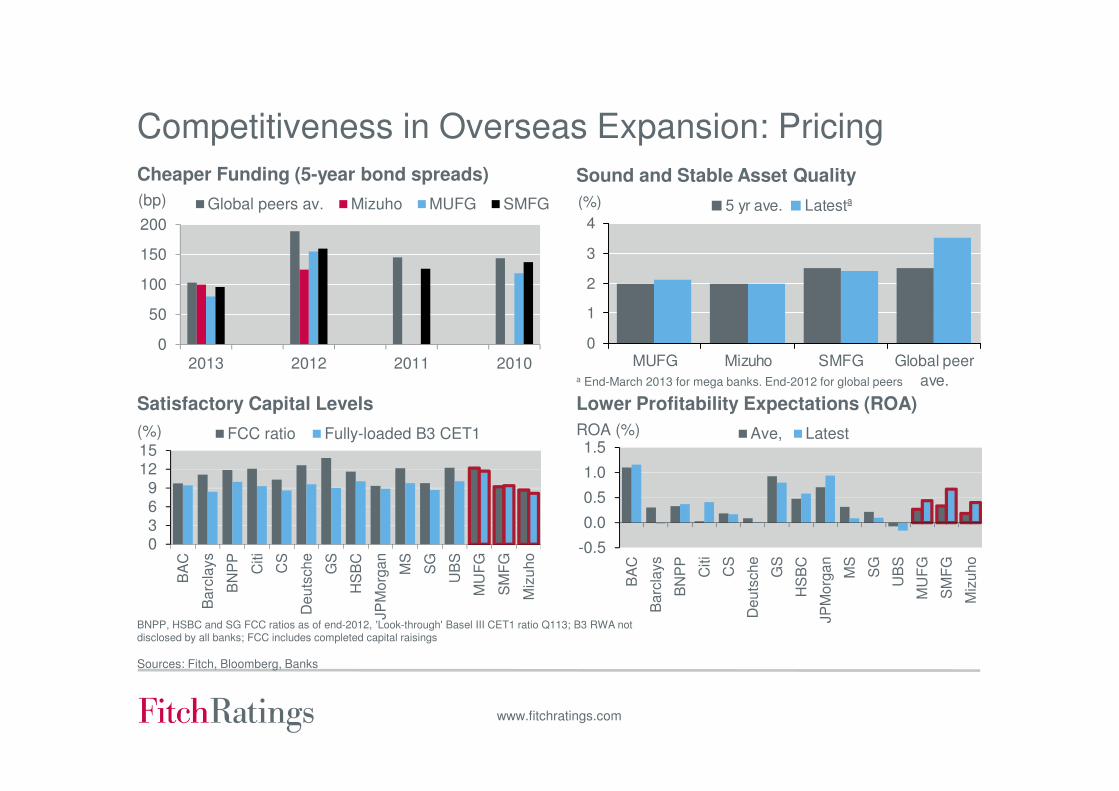
5 yr ave. Latestª(%)
-0.5
0.0
0.5
1.0
1.5
BA
C
Barc
lays
BN
PP
Citi
CS
Deuts
che
GS
HS
BC
JP
Morg
an
MS
SG
UB
S
MU
FG
SM
FG
Miz
uho
Ave, LatestROA (%)
0369
1215
BA
C
Barc
lays
BN
PP
Citi
CS
Deuts
che
GS
HS
BC
JP
Morg
an
MS
SG
UB
S
MU
FG
SM
FG
Miz
uho
FCC ratio Fully-loaded B3 CET1(%)
Competitiveness in Overseas Expansion: Pricing
Cheaper Funding (5-year bond spreads)
BNPP, HSBC and SG FCC ratios as of end-2012, 'Look-through' Basel III CET1 ratio Q113; B3 RWA not disclosed by all banks; FCC includes completed capital raisings
Sources: Fitch, Bloomberg, Banks
Sound and Stable Asset Quality
Satisfactory Capital Levels Lower Profitability Expectations (ROA)
0
50
100
150
200
2013 2012 2011 2010
Global peers av. Mizuho MUFG SMFG(bp)
a End-March 2013 for mega banks. End-2012 for global peers

www.fitchratings.com
Offshore Expansion: Non-Organic Growth
Date Name Country Stake acquired (%)
MUFG Jun 2008 Dah Sing Financial Holdings Limited Hong Kong 15.0
Oct 2008 Morgan stanley US 21.8
Oct 2008 Aberdeen Asset Management UK 18.8
Nov 2008 UnionBanCal Corporation US 100.0
Apr 2010 Tamalpais Bank US 100.0
Apr 2010 Frontier Bank US 100.0
Nov 2010 The Royal Bank of Scotland UK n.a.
Apr 2011 SWS MU Fund Management Co.,Ltd. China 33.3
Dec 2012 Vietnam Joint Stock Commercial Bank for Industry and Trade (VietinBank) Vietnam 20.0
Apr 2013 PB Capital Corporation (sub. of Deutsche Bank; U.S. commercial property loans) US n.a.
Jul 2013 Bank of Ayudhya Thailand max 75%
SMFG Jul 2008 Barclays PLC UK 1.4
Dec 2008 KB Financial Group Korea 1.1
Jan 2010 The Bank of East Asia Ltd. Hong Kong 9.5
Jun 2010 Kotak Mahindra Bank Ltd India 4.5
Jan 2012 Moelis & Company US n.a.
Jan 2012 The Royal Bank of Scotland (aircraft leasing assets) UK n.a.
Mar 2012 PT Indonesia Infrastructure Finance Indonesia 14.9
Apr 2012 China Post & Capital Fund Management Co.,Ltd China 24.0
May 2013 BTPN Indonesia 24.26 (max 40%)
Mizuho Jan 2008 Merrill Lynch & Co., Inc ( converted to a stake in Bank of America) US n.a.
Aug 2008 Evercore Partners Inc US 14.7
Nov 2010 BlackRock, Inc. US n.a.
Aug 2011 PT Imora Motor/PT Balimor Finance Indonesia 51.0
Sep 2011 Vietcombank Vietnam 15.0
Jun 2012 West LB Brasil Brazil 100.0
www.fitchratings.com
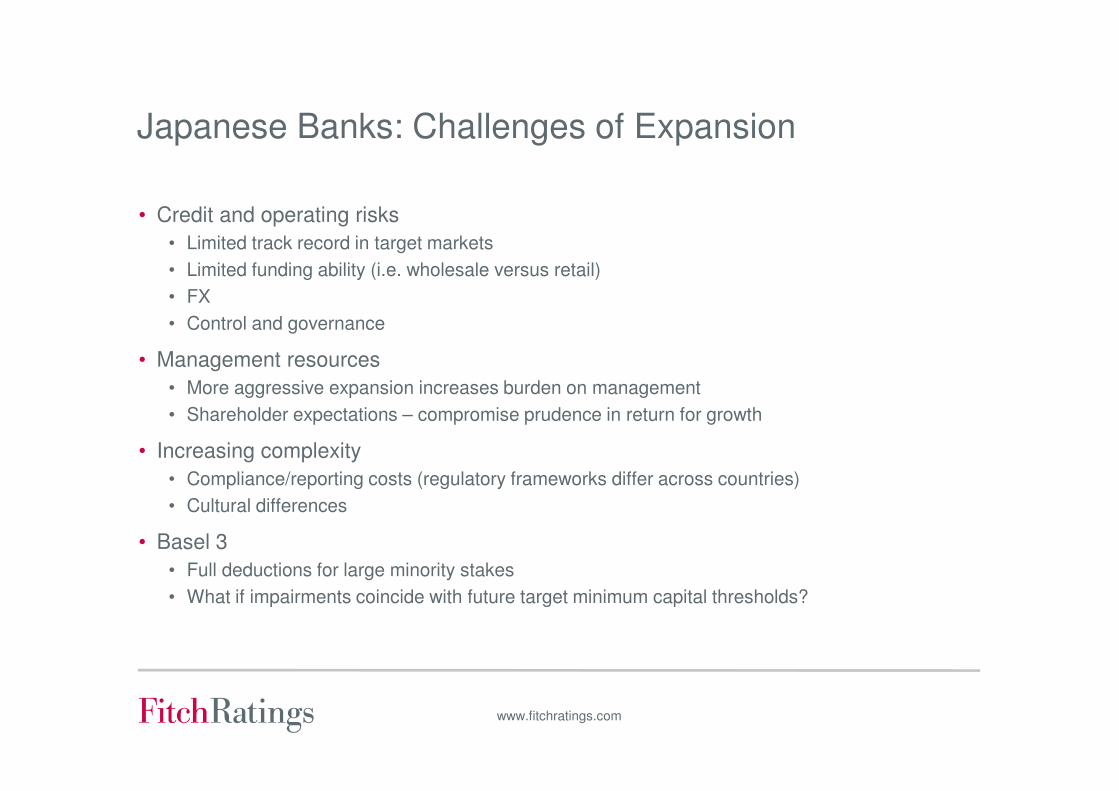
Japanese Banks: Challenges of Expansion
• Credit and operating risks
• Limited track record in target markets
• Limited funding ability (i.e. wholesale versus retail)
• FX
• Control and governance
• Management resources
• More aggressive expansion increases burden on management
• Shareholder expectations – compromise prudence in return for growth
• Increasing complexity
• Compliance/reporting costs (regulatory frameworks differ across countries)
• Cultural differences
• Basel 3
• Full deductions for large minority stakes
• What if impairments coincide with future target minimum capital thresholds?
www.fitchratings.com
Disclaimer
Fitch Ratings’ credit ratings rely on factual information received from issuers and other sources.
Fitch Ratings cannot ensure that all such information will be accurate and complete. Further, ratings
are inherently forward-looking, embody assumptions and predictions that by their nature cannot be
verified as facts, and can be affected by future events or conditions that were not anticipated at the
time a rating was issued or affirmed.
The information in this presentation is provided “as is” without any representation or warranty.
A Fitch Ratings credit rating is an opinion as to the creditworthiness of a security and does not
address the risk of loss due to risks other than credit risk, unless such risk is specifically mentioned.
A Fitch Ratings report is not a substitute for information provided to investors by the issuer and its
agents in connection with a sale of securities.
Ratings may be changed or withdrawn at any time for any reason in the sole discretion of
Fitch Ratings. The agency does not provide investment advice of any sort. Ratings are not
a recommendation to buy, sell, or hold any security.
ALL FITCH CREDIT RATINGS ARE SUBJECT TO CERTAIN LIMITATIONS AND DISCLAIMERS. PLEASE READ THESE
LIMITATIONS AND DISCLAIMERS AND THE TERMS OF USE OF SUCH RATINGS AT WWW.FITCHRATINGS.COM.

New York One State Street Plaza New York, NY 10004
London 30 North Colonnade Canary WharfLondon E14 5GN