Embed Size (px)
Citation preview

SPAIN
January - December 2017
31 January 2018
22
DisclaimerBanco Santander, S.A. ("Santander") cautions that this presentation contains statements that constitute “forward-looking statements” within the meaning of the U.S. Private Securities Litigation Reform Act of
1995. Forward-looking statements may be identified by words such as “expect”, “project”, “anticipate”, “should”, “intend”, “probability”, “risk”, “VaR”, “RORAC”, “RoRWA”, “TNAV”, “target”, “goal”, “objective”,
“estimate”, “future” and similar expressions. These forward-looking statements are found in various places throughout this presentation and include, without limitation, statements concerning our future business
development and economic performance and our shareholder remuneration policy. While these forward-looking statements represent our judgment and future expectations concerning the development of our
business, a number of risks, uncertainties and other important factors could cause actual developments and results to differ materially from our expectations. These factors include, but are not limited to: (1)
general market, macro-economic, industry, governmental and regulatory trends; (2) movements in local and international securities markets, currency exchange rates and interest rates; (3) competitive
pressures; (4) technological developments; and (5) changes in the financial position or credit worthiness of our customers, obligors and counterparties. Numerous factors, including those reflected in the Annual
Report on Form 20-F filed with the Securities and Exchange Commission of the United States of America (the “SEC”) –under “Key Information-Risk Factors”- and in the Documento de Registro de Acciones
filed with the Spanish Securities Market Commission (the “CNMV”) –under “Factores de Riesgo”- could affect the future results of Santander and could result in other results deviating materially from those
anticipated in the forward-looking statements. Other unknown or unpredictable factors could cause actual results to differ materially from those in the forward-looking statements.
Forward-looking statements speak only as of the date of this presentation and are based on the knowledge, information available and views taken on such date; such knowledge, information and views may
change at any time. Santander does not undertake any obligation to update or revise any forward-looking statement, whether as a result of new information, future events or otherwise.
The information contained in this presentation is subject to, and must be read in conjunction with, all other publicly available information, including, where relevant any fuller disclosure document published by
Santander. Any person at any time acquiring securities must do so only on the basis of such person's own judgment as to the merits or the suitability of the securities for its purpose and only on such information
as is contained in such public information having taken all such professional or other advice as it considers necessary or appropriate in the circumstances and not in reliance on the information contained in the
presentation. No investment activity should be undertaken on the basis of the information contained in this presentation. In making this presentation available, Santander gives no advice and makes no
recommendation to buy, sell or otherwise deal in shares in Santander or in any other securities or investments whatsoever.
Neither this presentation nor any of the information contained therein constitutes an offer to sell or the solicitation of an offer to buy any securities. No offering of securities shall be made in the United States
except pursuant to registration under the U.S. Securities Act of 1933, as amended, or an exemption therefrom. Nothing contained in this presentation is intended to constitute an invitation or inducement to
engage in investment activity for the purposes of the prohibition on financial promotion in the U.K. Financial Services and Markets Act 2000.
Note: Statements as to historical performance or financial accretion are not intended to mean that future performance, share price or future earnings (including earnings per share) for any period will necessarily
match or exceed those of any prior year. Nothing in this presentation should be construed as a profit forecast.
The businesses included in each of our geographic segments and the accounting principles under which their results are presented here may differ from the included businesses and local applicable accounting
principles of our public subsidiaries in such geographies. Accordingly, the results of operations and trends shown for our geographic segments may differ materially from those of such subsidiaries.
In addition to the financial information prepared under International Financial Reporting Standards (“IFRS”), this presentation includes certain alternative performance measures as defined in the Guidelines on
Alternative Performance Measures issued by the European Securities and Markets Authority on 5 October 2015 (ESMA/2015/1415es) as well as Non-IFRS measures. The APMs and Non-IFRS Measures are
performance measures that have been calculated using the financial information from the Santander Group but that are not defined or detailed in the applicable financial information framework and therefore
have neither been audited nor are capable of being completely audited. These APMs and Non-IFRS Measures are been used to allow for a better understanding of the financial performance of the Santander
Group but should be considered only as additional information and in no case as a replacement of the financial information prepared under IFRS. Moreover, the way the Santander Group defines and calculates
these APMs and Non-IFRS Measures may differ to the way these are calculated by other companies that use similar measures, and therefore they may not be comparable. Please refer to the quarterly financial
Report for further details of the APMs and Non-IFRS Measures used, including its definition or a reconciliation between any applicable management indicators and the financial data presented in the
consolidated financial statements prepared under IFR, see Section 26 of the Documento de Registro de Acciones for Banco Santander filed with the CNMV on July 4, 2017 (available on the Web page of the
CNMV -www.cnmv.es- and at Banco Santander -www.santander.com) and Item 3A of the Annual Report on Form 20-F for the year ended December 31, 2016, filed with the U.S. Securities and Exchange
Commission on March 31, 2017 (the “Form 20-F”). For a discussion of the accounting principles used in translation of foreign currency-denominated assets and liabilities to euros, see note 2(a) to our
consolidated financial statements on Form 20-F and to our consolidated financial statements available on the CNMV’s website (www.cnmv.es) and on Banco Santander’s website (www.santander.com).

Content
Macroeconomic environment
and financial system
Strategy and business
Results
Appendix
Note: All figures excluding Popular

44
Macroeconomic environment
3.4 3.3 3.1 2.7 2.4
2015 2016 2017 (e) 2018 (e) 2019 (e)
Annual GDP Growth (%, real)
Unemployment rate (%)Inflation (annual change, %)
Interest rate (official rate, %)
0.05 0.00 0.00 0.00
0.50
2015 2016 2017 2018 (e) 2019 (e)
-0.5-0.2
2.01.7 1.7
2015 2016 2017 2018 (e) 2019 (e)
22.119.6
17.215.2 13.9
2015 2016 2017 2018 (e) 2019 (e)
The expansionary cycle in the Spanish economy is expected to continue in the coming years, with
interest rates rises not anticipated before 2019…
Source: Santander Research Department
55
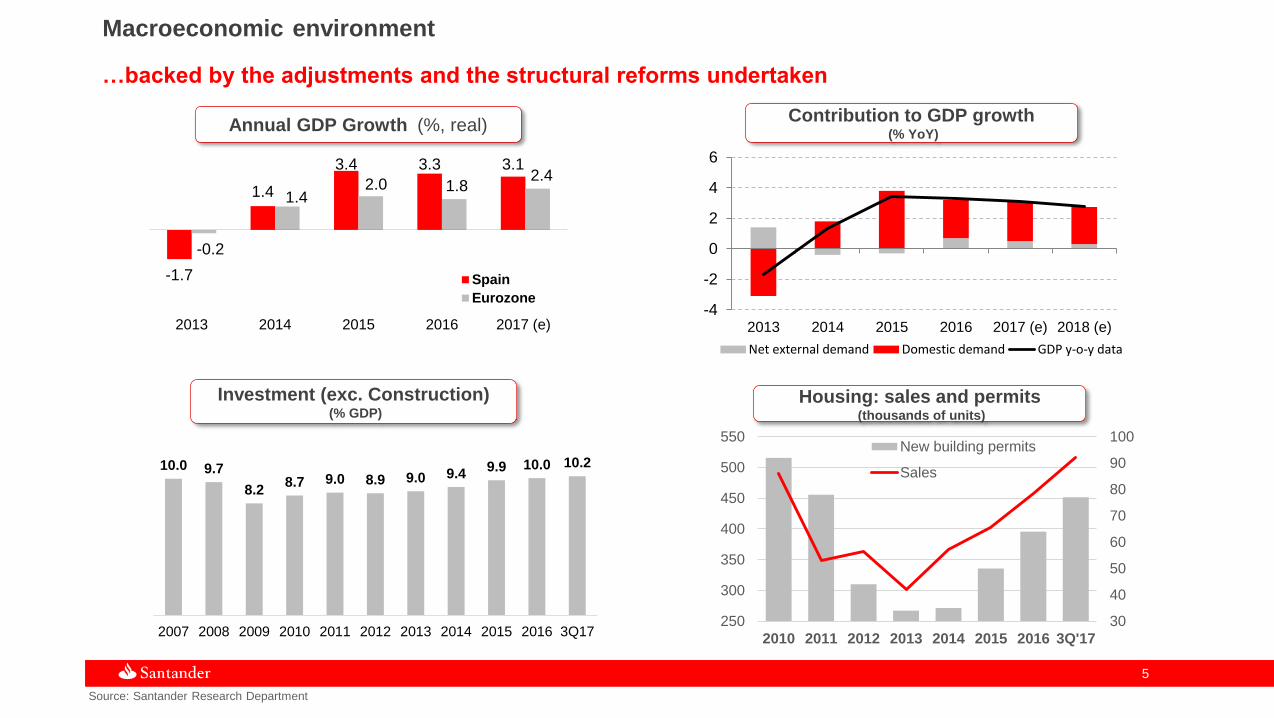
Macroeconomic environment
…backed by the adjustments and the structural reforms undertaken
Source: Santander Research Department
Annual GDP Growth (%, real)
-1.7
1.4
3.4 3.3 3.1
-0.2
1.42.0 1.8
2.4
2013 2014 2015 2016 2017 (e)
Spain
Eurozone
Contribution to GDP growth(% YoY)
-4
-2
0
2
4
6
2013 2014 2015 2016 2017 (e) 2018 (e)
Net external demand Domestic demand GDP y-o-y data
Investment (exc. Construction)(% GDP)
10.0 9.7
8.28.7 9.0 8.9 9.0 9.4
9.9 10.0 10.2
2007 2008 2009 2010 2011 2012 2013 2014 2015 2016 3Q17
Housing: sales and permits(thousands of units)
30
40
50
60
70
80
90
100
250
300
350
400
450
500
550
2010 2011 2012 2013 2014 2015 2016 3Q'17
New building permits
Sales

66
Source: ECB and Bank of Spain. Other Monetary Financial Institutions.
Total banking system volumes
Loans to customers Savings
Loans to Households & Non Financial entities are decreasing at a slower pace than 2016
In savings, the flow from deposits to mutual funds continues
958 989 999
414 380 318
77 54 7088 94 80
1,537 1,517 1,467
Dec'15 Dec'16 Nov'17
Mutual
Funds 220 235 261
Public sector
in Spain
Non-monetary financial
institutions EMU
Other non-resident
sectors in Spain
Households & non-financial
entities in Spain
EUR billion EUR billionYTD
-1.1%
-1.3%
YTD
+10.7%
-3.3%
+1.0%
1,232 1,196 1,181
5561 64
90 88 79
78 65 70
1,4551,410
1,394
Dec'15 Dec'16 Nov'17

Content
Macroeconomic environment
and financial system
Strategy and business
Results
Appendix

88
Our Franchise
The financial group includes retail networks, global businesses and specialised entities
(1) Million euros; (2) Underlying ROTE; (3) Other non-resident sector in Spain as of Nov 2017 (lastest available) excluding Popular. Including Popular: Market share Loans 18.3% and Deposits 18.9%.(4) Millions.
KEY DATA 2017 Var. YoY2017 STRATEGIC PRIORITIES
Predictable, sustainable and profitable growth
Bank of choice for SMEs and corporates
Improve efficiency and customer experience
Best bank to work for
Gross loans1 148,585
Customer funds1 251,196
Attributable profit1 1,180
ROTE2 10.11% +122 bp
Efficiency ratio 57.2% -154 bp
Loans’ market share3 12.9 +20 bp
Deposits’ market share3 14.1 +136 bp
Loyal customers4 1.9
Digital customers4 3.2
Branches 2,843
Employees 22,916
+42%
+15%
-2%
-0%
-2%
+12%
+46%
99
Digital eco-system renewalCredit Cards
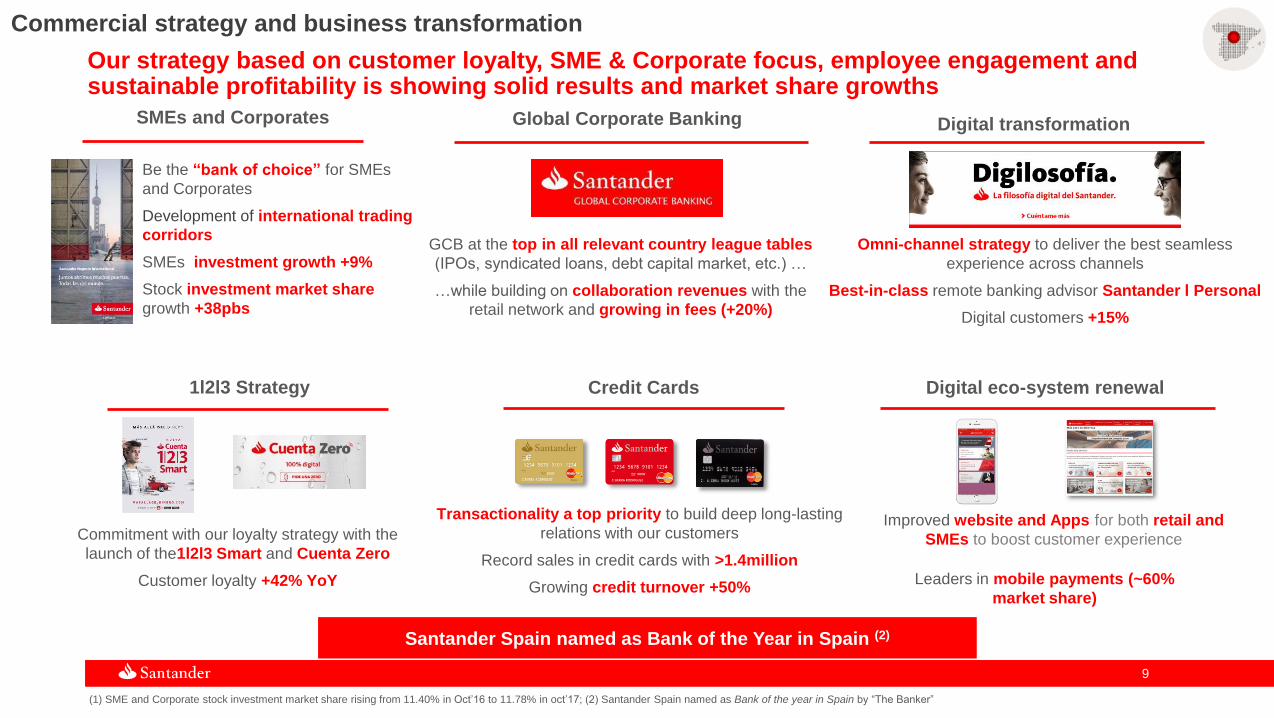
Commercial strategy and business transformation
Our strategy based on customer loyalty, SME & Corporate focus, employee engagement and sustainable profitability is showing solid results and market share growths
1l2l3 Strategy
Global Corporate BankingSMEs and Corporates
Commitment with our loyalty strategy with the
launch of the1l2l3 Smart and Cuenta Zero
Customer loyalty +42% YoY
Improved website and Apps for both retail and
SMEs to boost customer experience
Be the “bank of choice” for SMEs
and Corporates
Development of international trading
corridors
SMEs investment growth +9%
Stock investment market share
growth +38pbs
GCB at the top in all relevant country league tables
(IPOs, syndicated loans, debt capital market, etc.) …
…while building on collaboration revenues with the
retail network and growing in fees (+20%)
Digital transformation
Omni-channel strategy to deliver the best seamless
experience across channels
Best-in-class remote banking advisor Santander l Personal
Digital customers +15%
Santander Spain named as Bank of the Year in Spain (2)
Transactionality a top priority to build deep long-lasting
relations with our customers
Record sales in credit cards with >1.4million
Growing credit turnover +50%Leaders in mobile payments (~60%
market share)
(1) SME and Corporate stock investment market share rising from 11.40% in Oct’16 to 11.78% in oct’17; (2) Santander Spain named as Bank of the year in Spain by “The Banker”

1010
322 341
1,013
Customers
+6%
+54%
Loyal individuals (k)
Loyal companies (k)
Digital customers (k)
Customer centric approach: loyalty and digital transformation are key levers to improve results
and satisfaction.
1,559
Dec’16 Dec`17
Dec’16 Dec’17
2,736 3,158
Dec’16 Dec’17
+15%
• Our commercial strategy is improving customer loyalty and increasing our transactionality
(mobile payments, cards usage…) leading to increases in commercial activity (+3,5 pp in new
mortgage production1)
• Corporate strategy: being the “Bank of choice” for SMEs and Corporates
• Growing in high value-added products: capturing the potential of our international footprint
(+16% in International business production) and growing in collaboration revenues 24%
• Focused on digital transformation, from internal processes to a customer omni-channel
experience, leveraging in our digital philosophy Digilosofía
• Leaders in mobile payments(>60% market share) and best-in-class remote banking advisor
(1) New production mortgage market share rising from 8.0% in Nov’16 to 11.5% in Nov’17

1111
(1) Excluding repos
Total loans
Total gross loans (€Bn1)
151 151 152 149 149
Dec 16 Mar 17 Jun 17 Sep 17 Dec 17
Growth in new lending activity is not reflected in gross loans stock due to drop in Institutions and GCB
Dec 17 Dec 16 Sep 17
Institutions 12 -10.4 -3.5
Individual customers 54 +0.3 +0.1of which:
- Housing mortgages 46 -0.4 -0.2
Companies 52 +1.2 +1.6
Corporate 31 -5.4 -2.3
Gross loans (w/o repos) 149 -1.6 -0.20
Repos 9 +37.8 +1.3
Provisions (4) -18.4 -3.50
Net loans 154 +0.5 -0.0
% var. /

1212
Total customer funds
Total customer funds (€Bn)
Focus on growing through demand deposits and mutual funds
175 177 185 185 193
49 5254 55
5812 12
12 12 11 236 241 251 252 263
Dec 16 Mar 17 Jun 17 Sep 17 Dec 17
Demand +
Time deposit
Repos & other
Mutual funds
Pension funds
% var. /
Dec 17 Dec 16 Sep 17
Demand deposits 154 +19.0 +5.0Time deposits 39 -15.8 +1.5
Deposits w/o Repos 193 +9.9 +4.2
Mutual funds 58 +18.4 +5.7
Customer funds 251 +11.7 +4.6
Pension funds 11 +2.0 +1.5Repos 1 -34.2 -42.2
Total customer funds 263 +11.1 +4.2
Content
Macroeconomic environment
and financial system
Strategy and business
Results
Appendix

1414
Net interest income. Yield and costs
YoY NII evolution affected by mortgage repricing in a competitive and low interest rates environment
QoQ impacted by higher average volumes in customer deposits. Lower contribution from ALCO and GCB
Cost of deposits (%)
Yield on loans (%)Net Interest Income (€MM)
0.47 0.46 0.46 0.46 0.48
4Q'16 1Q'17 2Q 3Q 4Q
747 747 749 726 686
4Q'16 1Q'17 2Q 3Q 4Q
2.10 2.04 2.04 1.96 1.96
(1) Net interest income annualised / Total assets average period (2) Quarter average.
NIM1
(%)
0.93 0.95 0.92 0.86 0.79
Official interest rate2
(%)
0.00 0.00 0.00 0.00 0.00
1515
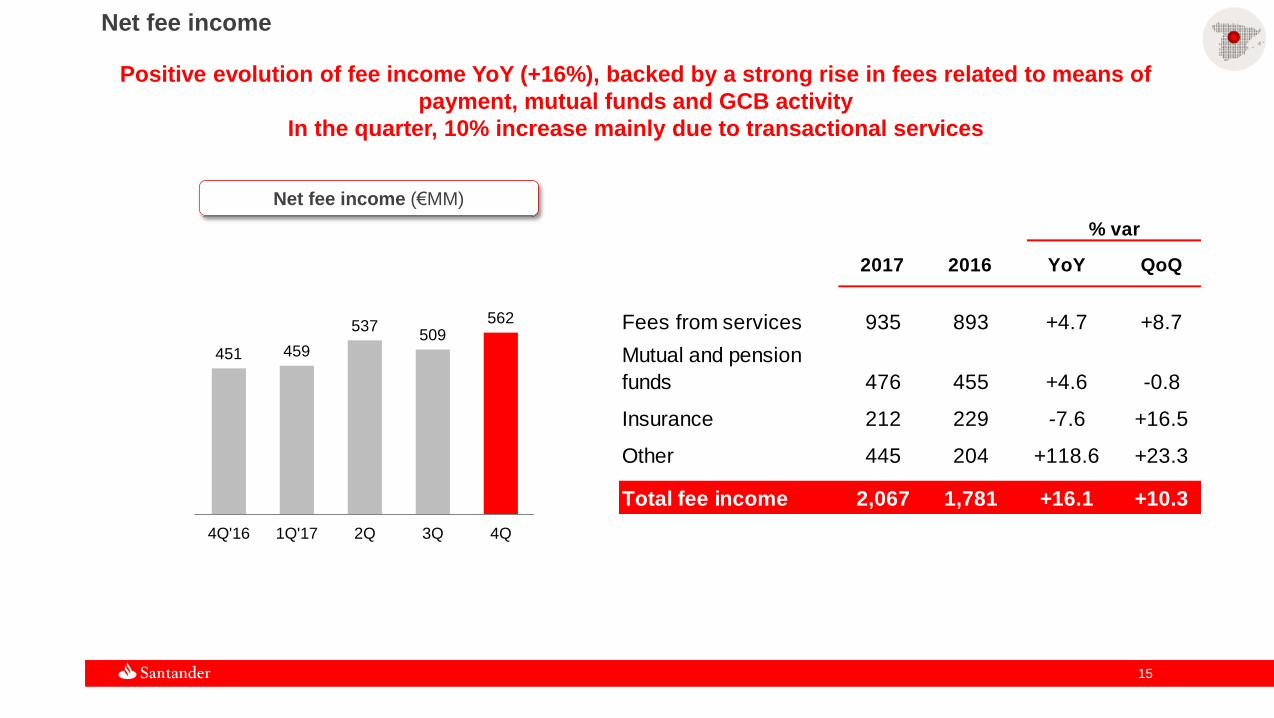
Net fee income
Positive evolution of fee income YoY (+16%), backed by a strong rise in fees related to means of
payment, mutual funds and GCB activity
In the quarter, 10% increase mainly due to transactional services
Net fee income (€MM)
451 459
537509
562
4Q'16 1Q'17 2Q 3Q 4Q
2017 2016 YoY QoQ
Fees from services 935 893 +4.7 +8.7
Mutual and pension
funds 476 455 +4.6 -0.8
Insurance 212 229 -7.6 +16.5
Other 445 204 +118.6 +23.3
Total fee income 2,067 1,781 +16.1 +10.3
% var

1616
EUR million
2017 2016 YoY QoQ
Net interest income 2,909 3,077 -5.5 -5.5
Net fees 2,067 1,781 +16.1 +10.3
Subtotal 4,976 4,858 +2.4 +1.0
Other 718 750 -4.3 -39.8
Total 5,694 5,608 +1.5 -4.7
% var
Gross income
Good performance in fee income offset the lower NII
Positive impact QoQ from dividends received in GCB activity and negative effect for the
DGF charge (€153 MM)
Gross income (€MM)
1,324
1,539
1,3511,435
1,368
4Q'16 1Q'17 2Q 3Q 4Q
(1).- Other includes Gains (losses) on financial transactions and Other Operating income
1

1717
(1) Calculation of efficiency ratio includes amortisations
Operating expenses
Lower costs YoY reflected the efficiency plan announced in 2016
QoQ increased due to costs related to Openbank, Elavon integration and IT depreciations
Operating expenses (€MM)
802 798 806 815 841
4Q'16 1Q'17 2Q 3Q 4Q
EUR million
2017 2016 YoY QoQ
General expenses 3,080 3,156 -2.4 +2.7
- Personnel 1,597 1,632 -2.1 -0.7
- Other 1,482 1,524 -2.7 +6.4
Amortisations 180 140 +28.1 +11.3
Total 3,259 3,297 -1.1 +3.2
Efficiency ratio (%) 57.2 58.8
Branches 2,843 2,911
Employees 22,916 23,017
% var
1

1818
LLPs and Cost of credit (€MM; %)
85
163137
104 110
4Q'16 1Q'17 2Q 3Q 4Q
Cost of credit1
Loan-Loss provisions
Net operating income after loan-loss provisions (LLPs)
Sharp fall in LLPs and further improvement in NPLs and cost of credit YoY
0.37 0.33 0.33 0.31 0.33
EUR million
2017 2016 YoY QoQ
Net operating income 2,434 2,311 +5.3 -15.0
Loan-loss provisions 513 585 -12.3 +5.8
Net operat. income
after provisions 1,921 1,726 +11.3 -19.2
Coverage ratio (%) 45.9 48.3
NPL ratio (%) 4.72 5.41
% var
(1) Cost of credit: Provisions to cover losses due to impairment of loans in the last 12 months / average customer loans and advances of the last 12 months

1919
Attributable profit
Profit backed by fee income (more than offsetting pressure on NII), cost control and LLPs
Attributable profit (€MM)
237
362
241
311265
4Q'16 1Q'17 2Q 3Q 4Q
EUR million
2017 2016 YoY QoQ
Underlying PBT 1,714 1,459 +17.5 -14.3
Tax on profit 518 416 +24.4 -12.0
Consolidated profit 1,197 1,043 +14.7 -15.4
Minority interests 17 21 -18.2 -57.4
Underlying att. profit 1,180 1,022 +15.4 -14.8
Non-recurring1 — (216) — —
Attributable profit 1,180 806 +46.4 -14.8
Effective tax rate (%) 30.2% 28.5%
% var
(1).- In 2Q’16 capital gains from the disposal of the stake in VISA Europe, and restructuring costs

2020
Final remarks
The expansionary cycle in the Spanish economy is expected to continue in the coming years.
GDP growth is backed by the adjustments and the structural reforms undertaken.
Economic environment and financial system
Santander:
Strategy and activity
Santander:
Results
Become the best retail and commercial bank in Spain by improving our value proposition and
transforming the way we do business.
Continue growing our 1l2l3 strategy to improve customer loyalty and to gain market share. Developed the
new Digital philosophy to enhance digital capabilities and boost efficiency and profitability.
New lending increased in main retail products and segments, especially in mortgages.
Demand deposits and mutual funds continued to grow.
Positive evolution in net fees YoY offset the pressure on margins (NII + Net Fees: +2.4%) and lower
results in Gains (losses) on financial transactions.
Cost to income improvement underscoring the positive trend in costs.
Decrease in provisions backed by credit quality improvement.

Content
Macroeconomic environment
and financial system
Strategy and business
Results
Appendix
Note: the following slides provide data on the Spain unit, which includes the retail network of Santander, Global Corporate Banking,
and the ALCO portfolio in Spain.
Not included: Santander Consumer Finance unit in Spain nor Spain's Real Estate activity, as described in Santander Group's quarterly
Financial Report (see Description of Segments in Information by principal segments chapter). All figures excluding Popular

2222
Balance sheet
EUR million Change
Dec 17 Dec 16 Amount %
Customer loans 153,632 152,850 782 0.5
Cash, central banks and credit institutions 89,585 54,207 35,378 65.3
Debt securities 61,836 58,084 3,752 6.5
o/w: available for sale 42,780 38,727 4,054 10.5
Other financial assets 35,391 37,741 (2,350) (6.2)
Other assets 10,354 9,473 881 9.3
Total assets 350,798 312,354 38,444 12.3
Customer deposits 193,639 176,779 16,860 9.5
Central banks and credit institutions 79,146 52,071 27,075 52.0
Other financial liabilities 41,168 46,951 (5,784) (12.3)
Other liabilities 7,883 4,186 3,697 88.3
Total liabilities 338,549 300,850 37,699 12.5
Total equity 12,249 11,504 744 6.5
Other managed and marketed customer funds 77,221 66,649 10,572 15.9
Mutual funds 58,438 49,357 9,080 18.4
Pension funds 10,563 10,359 203 2.0
Managed portfolios 8,221 6,932 1,288 18.6

2323
Income Statement
EUR million Change
2017 2016 Amount %
Net interest income 2,909 3,077 (169) (5.5)
Net fees 2,067 1,781 287 16.1
Gains (losses) on financial transactions 429 595 (167) (28.0)
Other operating income 289 155 135 87.0
Gross income 5,694 5,608 86 1.5
Operating expenses (3,259) (3,297) 37 (1.1)
General administrative expenses (3,080) (3,156) 77 (2.4)
Personnel (1,597) (1,632) 35 (2.1)
Other general administrative expenses (1,482) (1,524) 42 (2.7)
Depreciation and amortisation (180) (140) (39) 28.1
Net operating income 2,434 2,311 123 5.3
Net loan-loss provisions (513) (585) 72 (12.3)
Other income (207) (267) 60 (22.6)
Underlying profit before taxes 1,714 1,459 255 17.5
Tax on profit (518) (416) (102) 24.4
Underlying profit from continuing operations 1,197 1,043 153 14.7
Net profit from discontinued operations — — — —
Underlying consolidated profit 1,197 1,043 153 14.7
Minority interests 17 21 (4) (18.2)
Underlying attributable profit to the Group 1,180 1,022 157 15.4
Net capital gains and provisions — (216) 216 (100.0)
Attributable profit to the Group 1,180 806 374 46.4
*
*Including capital gains from the sale of VISA Europe and restructuring costs

2424
*Including capital gains from the sale of VISA Europe and restructuring costs
EUR million
1Q 16 2Q 16 3Q 16 4Q 16 1Q 17 2Q 17 3Q 17 4Q 17
Net interest income 819 783 728 747 747 749 726 686
Net fees 424 449 456 451 459 537 509 562
Gains (losses) on financial transactions 224 65 149 157 230 (42) 119 121
Other operating income 75 46 64 (30) 103 106 81 (0)
Gross income 1,543 1,343 1,398 1,324 1,539 1,351 1,435 1,368
Operating expenses (837) (834) (824) (802) (798) (806) (815) (841)
General administrative expenses (801) (799) (791) (766) (752) (765) (771) (792)
Personnel (415) (410) (401) (408) (399) (399) (401) (398)
Other general administrative expenses (386) (389) (390) (358) (352) (365) (370) (394)
Depreciation and amortisation (36) (35) (33) (36) (46) (41) (44) (49)
Net operating income 706 509 574 522 741 545 621 528
Net loan-loss provisions (231) (129) (140) (85) (163) (137) (104) (110)
Other income (37) (82) (51) (97) (64) (64) (55) (23)
Underlying profit before taxes 438 298 382 340 514 344 461 395
Tax on profit (126) (85) (108) (97) (146) (98) (145) (128)
Underlying profit from continuing operations 312 213 274 243 367 246 316 267
Net profit from discontinued operations — — — — — — — —
Underlying consolidated profit 312 213 274 243 367 246 316 267
Minority interests 5 5 5 6 6 5 5 2
Underlying attributable profit to the Group 307 208 270 237 362 241 311 265
Net capital gains and provisions* — (216) — — — — — —
Attributable profit to the Group 307 (8) 270 237 362 241 311 265
Quarterly Income Statement

Thank you
Our purpose is to help people and
businesses prosper.
Our culture is based on the belief that
everything we do should be