Embed Size (px)
Citation preview

1
NFO Opens on : January 8, 2018 NFO Closes on: January 22, 2018 Offer opens for continuous sale and
repurchase from: February 6, 2018

INDIA – THEN AND NOW
2

India’s GDP Growth
USD 2 Trillion
USD 1 Trillion
USD 1/2 Trillion

MID CAPS – TREND ANALYSIS
4

China - A Case Study for Mid Cap Outperformance
USD
5
• In the following case study of Chinese Stock Markets, the mid cap index (SSE380 Index) has outperformed the large cap index (SSE50 Index) over a period of 12 years
0
200
400
600
800
1000
1200
Dec-05 Dec-06 Dec-07 Dec-08 Dec-09 Dec-10 Dec-11 Dec-12 Dec-13 Dec-14 Dec-15 Dec-16
Ind
ex V
alu
e
Period
SSE380 SSE50 Index
Absolute Returns
Dec 2005 to Dec 2016 SSE380 Index :724% SSE50 Index :234%
Source: - Bloomberg;
For Comparable purpose the indices are converted in $ term , calendar year end returns shown above are for 31st Dec of each year. The data provided above is for illustrative purpose only. Past performance may or may not be sustained in future; Above line charts are actual index movements. CAGR – Compounded Annual Growth Rate
CAGR
Dec 2005 to Dec 2016 SSE380 Index :19% SSE50 Index :11%
Mid Caps Have Performed Better in Developed Economies Too
Currency : USD
6
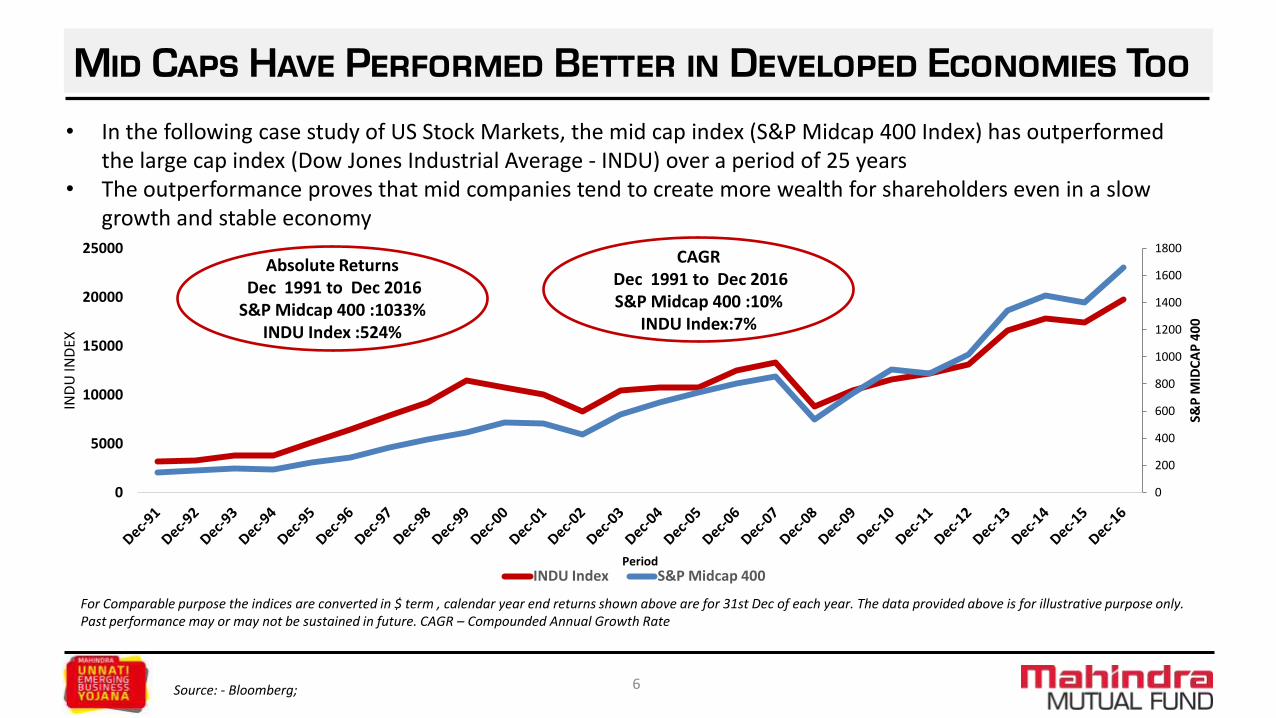
• In the following case study of US Stock Markets, the mid cap index (S&P Midcap 400 Index) has outperformed the large cap index (Dow Jones Industrial Average - INDU) over a period of 25 years
• The outperformance proves that mid companies tend to create more wealth for shareholders even in a slow growth and stable economy
0
200
400
600
800
1000
1200
1400
1600
1800
0
5000
10000
15000
20000
25000
S&P
MID
CA
P 4
00
IND
U IN
DEX
Period INDU Index S&P Midcap 400
Absolute Returns
Dec 1991 to Dec 2016 S&P Midcap 400 :1033%
INDU Index :524%
Source: - Bloomberg;
For Comparable purpose the indices are converted in $ term , calendar year end returns shown above are for 31st Dec of each year. The data provided above is for illustrative purpose only. Past performance may or may not be sustained in future. CAGR – Compounded Annual Growth Rate
CAGR
Dec 1991 to Dec 2016 S&P Midcap 400 :10%
INDU Index:7%

India – Growth in Economy augurs well for Mid Caps
0
1000
2000
3000
4000
5000
6000
0
2000
4000
6000
8000
10000
12000
Dec-08 Dec-09 Dec-10 Dec-11 Dec-12 Dec-13 Dec-14 Dec-15 Dec-16 Nov-17
NIF
TY M
IDC
AP
IND
EX
NIF
TY 5
0 I
ND
EX
Period
NIFTY 50 Index NIFTY MidCap Index
Currency : USD
7
• In it’s first leg of growth of stock market, India has seen significant wealth creation in large caps as a first choice of investment
Absolute Returns Dec 2008 to Nov 2017
Nifty 50:-250% Nifty Mid Cap 50 :294%
Source: - Bloomberg;
For Comparable purpose calendar year end returns for 31st Dec of each year ; Above line charts are actual index movements; The data provided above is for illustrative purpose only and should not be construed as a promise on minimum returns and safeguard of capital. Mahindra Asset Management Company Private Limited/Mahindra Mutual Fund is not guaranteeing or forecasting any returns. Past performance may or may not be sustained in future. CAGR – Compounded Annual Growth Rate
CAGR
Dec 2008 to Nov 2017 Nifty 50 :13%
Nifty Mid Cap 50:15%

THE NEW REGIME
8

New Mid Cap Regime Overview
9
Type of Scheme Would invest in
Large Cap 1st to 100th companies in terms of full market capitalisation
Mid Cap 101st to 250th companies in terms of full market capitalisation
Small Cap 251st company onwards in terms of full market capitalisation
Position by Market Cap Market Capitalisation (in Cr)*
101st Rs 28,700
250th Rs 9,200
Source: Bloomberg| Data as on November 30, 2017| *Rounded off to nearest 100
Source: Bloomberg| Data as on November 30, 2017 | ^This considers top 3000 companies by full market capitalization as per NSE
•As per current SEBI Guidelines •The list of companies will be updated by AMFI every 6 month (June & December). •Portfolio rebalancing, if required, is to be carried out within a period of one month
Coming Up : Companies that made it to the Big League
Mid Cap Schemes - Market Capitalisation Range
15%
17%
14%
54%
% Share in Market Cap^
250-3000 101-250 51-100 1-50 Company Rank by Market Cap
New Equity Regime – Investment Universe by Market Capitalisation*
*As per SEBI Circular dated October 6, 2017

COMPANIES THAT MADE IT TO
‘THE BIG LEAGUE’
10

77%
48% 48%
13%
Bajaj Finance Ltd.
Hindustan Petroleum
Corporation Ltd.
UPL Ltd. Nifty 50
11
Prior to inclusion in ‘The Big League’ (Nifty 50 Index)
Additions in the Index from 29th Sept 2017
12%
23%
11%
Indiabulls Housing
Finance Ltd.
Indian Oil Corporation
Ltd.
Nifty 50
Additions in the Index from 31st March 2017
50%
10%
70%
9% 6%
Aurobindo Pharma
Ltd.
Bharti Infratel Ltd.
Eicher Motors Ltd.
Tata Motors Ltd
DVR
Nifty 50
Additions in the Index from 1st April 2016
CAGR
From 30 Aug 2012 to 30 Aug 2017
Source: - Bloomberg; IISL
CAGR
From 31 Mar 2011 to 31 Mar2016
CAGR
From 28 Feb 2012 to 28 Feb 2017
Returns (CAGR) have been calculated for a 5 years period for the stocks referred above prior to their inclusion in the Nifty 50 / Nifty Next 50 Index. Past performance may or may not be sustained in future. The companies/stocks referred above should not be construed as recommendations from Mahindra Asset Management Company Private Limited / Mahindra Mutual Fund. Schemes of Mahindra Mutual Fund may or may not have any present or future positions in these companies/stocks. Mahindra Asset Management Company Private Limited/Mahindra Mutual Fund is not guaranteeing or forecasting any returns. CAGR – Compounded Annual Growth Rate
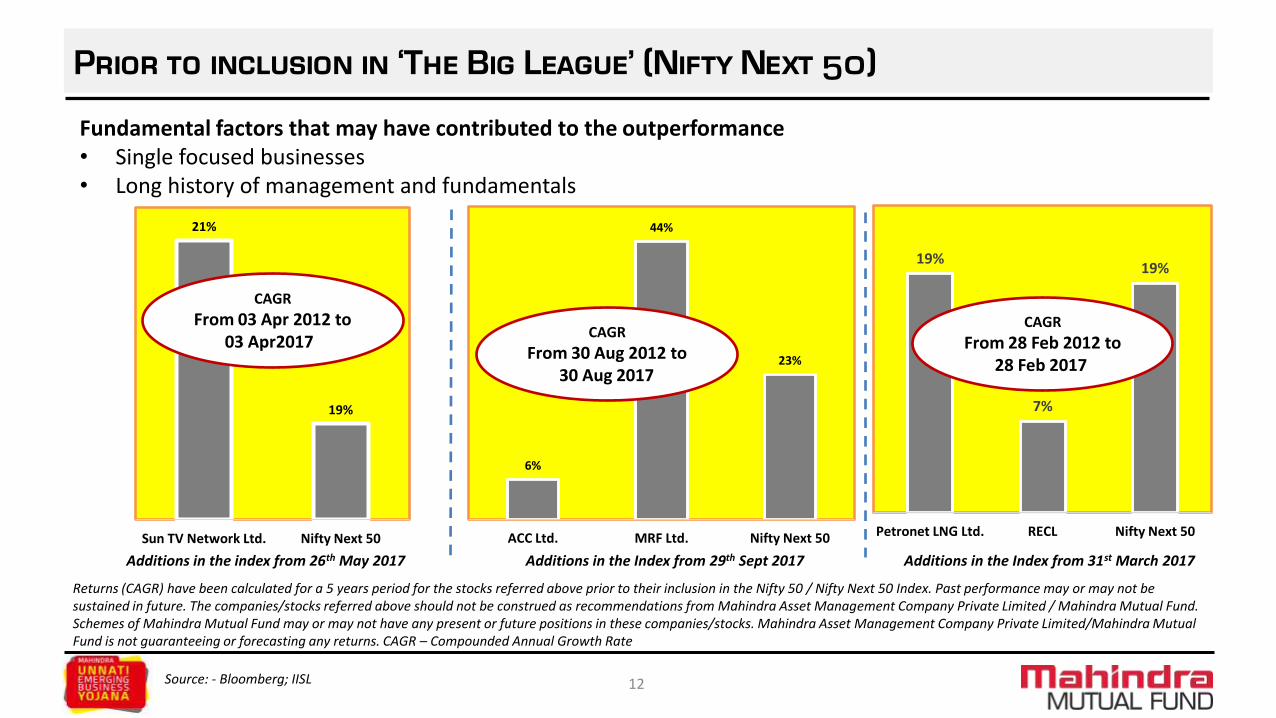
Prior to inclusion in ‘The Big League’ (Nifty Next 50)
21%
19%
Sun TV Network Ltd. Nifty Next 50
Additions in the index from 26th May 2017
12
6%
44%
23%
ACC Ltd. MRF Ltd. Nifty Next 50
Additions in the Index from 29th Sept 2017
19%
7%
19%
Petronet LNG Ltd. RECL Nifty Next 50
Additions in the Index from 31st March 2017
Fundamental factors that may have contributed to the outperformance • Single focused businesses • Long history of management and fundamentals
Source: - Bloomberg; IISL
CAGR
From 03 Apr 2012 to 03 Apr2017
CAGR
From 30 Aug 2012 to 30 Aug 2017
CAGR
From 28 Feb 2012 to 28 Feb 2017
Returns (CAGR) have been calculated for a 5 years period for the stocks referred above prior to their inclusion in the Nifty 50 / Nifty Next 50 Index. Past performance may or may not be sustained in future. The companies/stocks referred above should not be construed as recommendations from Mahindra Asset Management Company Private Limited / Mahindra Mutual Fund. Schemes of Mahindra Mutual Fund may or may not have any present or future positions in these companies/stocks. Mahindra Asset Management Company Private Limited/Mahindra Mutual Fund is not guaranteeing or forecasting any returns. CAGR – Compounded Annual Growth Rate

PRESENTING
13

OUR MID CAP SCHEME
14
PRESENTING

Mahindra Unnati Emerging Business Yojana
15
Time and tide wait for none. Wise are those who follow time’s footsteps. But wiser are those who stay ahead of it.
Only with this foresight comes innovation and success, paving the way for true progress. Mahindra Unnati Emerging
Business Yojana is born out of firm belief in the progress which comes out of such foresight. The foresight which
keeps individuals and organisations ahead of the time, beholding immense potential for growth. If you too are
someone who can see beyond the horizons of time, Mahindra Unnati Emerging Business Yojana is meant for you.
Invest in Mahindra Unnati Emerging Business Yojana and stay ‘Samay se aagey’!

Mahindra Unnati Emerging Business Yojana
16
Asset Allocation
Asset Allocation Pattern Indicative Allocation (% of assets) Risk Profile
Equity and Equity related Securities of Mid Cap Companies^ 65-100 High
Equity and Equity related Securities of Non Mid Cap Companies^ 0-35 High
Debt and Money Market Securities^ (including CBLO, Reverse Repo
and units of liquid mutual fund schemes)
0-35 Low to Medium
Units issued by REITs & InvITs 0-10 Medium to High
^ including derivative instruments to the extent of 50% of the Net Assets of the Scheme For detailed asset allocation refer SID of the Scheme available at www.mahindramutualfund.com or visit nearest Investor Service Centre.
New Equity Regime – Investment Universe by Market Capitalisation*
Type of Scheme Would invest in
Large Cap 1st to 100th companies in terms of full market capitalisation
Mid Cap 101st to 250th companies in terms of full market capitalisation
Small Cap 251st company onwards in terms of full market capitalisation
*As per SEBI Circular dated October 6, 2017

INVESTMENT STRATEGY
17

Investment Strategy
• Active management style
• Diversified portfolio of mid cap companies with a long term perspective.
• Bottom up stock picking across sectors, based on the industry, macro and long term potential of the business.
• Build an appropriate portfolio to capture the growth opportunities in India and identify companies which can grow to become the next leaders in their segment
18

Investment Style
• Identify small companies in a larger industry with a premium or differentiated product
• Identify larger companies in a smaller industry with significant market share or leadership
19

PHILOSOPHY & PROCESS
20

Central Guiding Philosophy
Making Money For Our Investors
At The Lowest Probability Of Risk
Not losing money will be Rule#1
Not Forgetting Rule#1 will be Rule #2,3,4…
21

FUND MANAGEMENT FACTORY
Prevent Permanent Impairment of Capital
Principle of “Primacy of Risk Control”
22

Building Blocks
Research & Discipline Based Asset Allocation
• Economic Cycles
• Business Cycles
Research Based Securities Trading
• Securities Analysis
• Securities Selection
• Position and Trade Decisions
Ongoing Performance Measurement
• Market
• Peers
• Customer
23

The Assembly Line
24
Institutional Repository of Knowledge
Database
Company Database
Industry Database
Analysis
Economic Cycles
Business Cycles
Internal Thesis
Five Stage Process
Sector Outlook
Business Model
Management
Financials
Valuation
Trades
Position Size
Trade Size
Trade Allocation
Trade Range
As historical as possible
Comparative Company Analysis

Process to Follow
Answering the basic question:
“The right time and right price”
25
Sector Outlook
Management Bandwidth
Business Model
Financials Valuations

MARKET PROGNOSIS
BUSTING MYTHS
26

Market Prognosis – busting myths
Busting the myths about mid cap low earnings In a relatively sluggish macro growth environment
Midcap companies have shown higher earnings growth in a sluggish market compared to large caps
This may be due to larger opportunities opening up across sectors
As economies become larger there are multiple opportunities / niche in multiple sectors to create a fair market place
27
Earnings Growth (FY14-17) Mean
Large Caps 8.2
Mid Caps 17.1
Large Caps – Weightage average of Top 100 companies by market cap Mid Caps – Weightage average of Top 101 to 250 companies by market cap
Source: - Bloomberg
Past performance may or may not be sustained in future.

Market Prognosis – busting myths
Busting the myths about global event risk • The FII ownership in mid cap companies are relatively lower compared to domestic institutions
• Domestic ownership of companies may be higher or equal to in midcap as compared to large caps
• Fund flows in domestic institutions will ensure that in the adverse event of global asset re-allocation,
these companies will see minimum impact
28
Average FII Holdings (%)
FY14 FY15 FY16 FY17
Large Caps 21.0 20.0 22.1 21.6
Mid Caps 14.0 13.4 13.5 12.7
Large Caps – Weightage average of Top 100 companies by market cap Mid Caps– Weightage average of Top 101 to 250 companies by market cap
Source: - Bloomberg
Market Prognosis – busting myths
The myths about current high valuations
• Valuations of these mid cap companies are historically and relatively high as these businesses have moat or limited moat strengths.
• These mid cap businesses may be delinked from external environment as these are individual segment focus businesses so any kind of external shocks the impact may be limited.
• We have witnessed resilience of these business models in adverse macro event in the past
29

Midcaps Outperforming Large Caps Over Long Term
-63%
76%
44%
14%
31%
-68.4%
82%
95%
21%
49%
08/01/2008 to 27/10/2008 27/10/2008 to 20/12/2011 20/12/2011 to 25/02/2016 25/02/2016 to 26/12/2016 26/12/2016 to 30/11/2017
Large Cap Index Midcap Index
Source: Bloomberg; Above data is for illustrative purposes only and should not be construed as a promise on minimum returns and safeguard of capital. Mahindra Asset Management Company Private Limited/Mahindra Mutual Fund is not guaranteeing or forecasting any returns.. Periods considered for the above data are periods during which significant market movements were observed. Returns calculated above are in absolute terms for the respective periods as defined above. Past performance may or may not be sustained in future.
30
Large Cap Index – Weightage average of Top 100 companies by market cap Mid Cap Index – Weightage average of Top 101 to 250 companies by market cap
We have considered these periods as there were significant market movements . This is for the illustrative purpose only.

31
India – On growth path to be one of the Largest Economies
Source: Published newspaper articles

Scheme Details
Minimum Application and
Redemption Amount / Number of
Units
Purchase Additional Purchase Repurchase
Rs. 1,000/- and in multiples of Re.
1/- thereafter
Rs. 1,000/- and in multiples of Re.
1/- thereafter
Rs. 1,000/- or 100 units or account
balance, whichever is lower
32
Entry Load: N.A. Exit Load: -An Exit Load of 1% is payable if Units are redeemed / switched-out upto 1 year from the date of allotment;
-Nil if Units are redeemed / switched-out after 1 year from the date of allotment. Systematic Investment Plan Benchmark: S&P BSE Midcap Index Fund Manager: Ratish Varier
Particulars Frequency available
Monthly Quarterly
SIP Transaction Dates Any Date*
For SIPs being registered through Post Dated Cheques (PDC) mode,
available SIP dates will be 5th, 10th, 15th, 20th and 25th day of the month
under the monthly/quarterly frequency
Minimum no. of installments
and Minimum amount per
installment
6 installments of Rs. 500/- each
and in multiples of Re 1/-
thereafter
4 installments of Rs.1,500/- each and in
multiples of Re 1/- thereafter
* If SIP installment due date falls on a Non-Business day, then the respective transactions will be processed on the next Business Day. However, in case the chosen date is not available in a particular month, the SIP will be processed on the last day of that month.
NFO Opens on : January 8, 2018 NFO Closes on: January 22, 2018 Offer opens for continuous sale and repurchase from: February 6, 2018
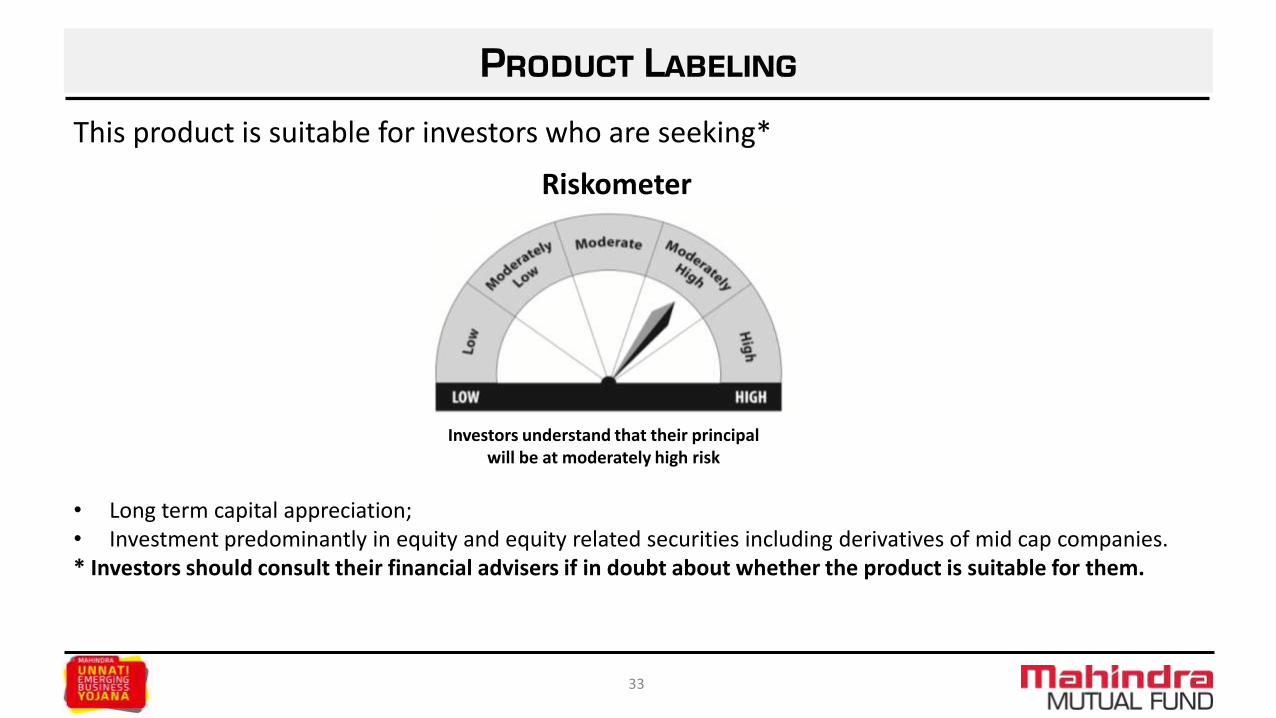
Product Labeling
This product is suitable for investors who are seeking*
• Long term capital appreciation; • Investment predominantly in equity and equity related securities including derivatives of mid cap companies. * Investors should consult their financial advisers if in doubt about whether the product is suitable for them.
33
Riskometer
Investors understand that their principal will be at moderately high risk

Disclaimer
The views expressed here in this presentation are for general information and reading purpose only and do not constitute any guidelines and recommendations on any course of action to be followed by the user. No representation or warranty is made as to the accuracy, completeness or fairness of the information and opinions contained herein. The views are not meant to serve as a professional guide / investment advice / intended to be an offer or solicitation for the purchase or sale of any financial product or instrument or mutual fund units for the user. This presentation has been prepared on the basis of publicly available information, internally developed data and other sources believed to be reliable. While utmost care has been exercised while preparing this presentation, Mahindra Asset Management Company Private Limited (Mahindra AMC) does not warrant the completeness or accuracy of the information and disclaims all liabilities, losses and damages arising out of the use of this information. The data/statistics are given to explain general market trends in the securities market, it should not be construed as any research report/research recommendation. The companies/stocks referred in this presentation should not be construed as recommendations from Mahindra AMC / Mahindra Mutual Fund. Users of this presentation should rely on information / data arising out of their own investigations and advised to seek independent professional advice and arrive at an informed decision before making any investments. Neither Mahindra Mutual Fund, Mahindra AMC nor Mahindra Trustee Company Private Limited, its directors or associates shall be liable for any damages that may arise from the use of the information contained herein.
For detailed asset allocation, investment strategy, scheme specific risk factors and more details, please read the Scheme Information
Document and Key Information Memorandum of Mahindra Unnati Emerging Business Yojana available at ISCs of Mahindra AMC and Computer Age Management Services Private Limited and also available on www.mahindramutualfund.com. Past performance may or may not be sustained in the future and should not be used as a basis for comparison with other investments.
Mutual fund investments are subject to market risks, read all scheme related documents carefully.
34
Cno.000263

THANK YOU
धन्यवाद
35


![IDFC Nifty ETF · [Rajiv Gandhi Equity Savings Scheme (RGESS) Qualified Scheme] NFO Opens : September 7, 2016 NFO Closes : September 30, 2016 Scheme re-opens for ongoing sales and](https://img.dokumen.tips/doc/110x75/601324db1acfb87da357031d/idfc-nifty-etf-rajiv-gandhi-equity-savings-scheme-rgess-qualified-scheme-nfo.jpg)