Embed Size (px)
Citation preview
January 4, 2013
1
Critical Load Exceedance Calculation Protocol Calculating CL Exceedances for Site-Specific Critical Loads
Some Forests may find published critical loads that appear to be more specific to their ecosystems than the national CLs hosted on the Air Quality Portal. Consultation with the authors, as well as FS air quality specialists is recommended to determine whether the underlying assumptions and data used in creating the alternative site-specific CLs will result in better estimates for the Forest. Things to consider prior to using alternative critical loads in the Forest Planning assessment include:
• For calculated steady-state CLs, how representative are the underlying assumptions on base cation weathering, base cation deposition, etc.?
• What area of the Forest is represented by the alternative CLs? • Availability of GIS shapefiles showing the spatial location of the alternative CLs – if
shapefiles are not available consider how the alternative CLs will be extrapolated across the landscape and across ecosystems.
Once the decision is made to use alternative site-specific CLs, CL exceedances will need to be calculated. For the purpose of Forest Planning, the CL Strategy recommends using modeled total deposition estimates available on the Portal. Total deposition includes both wet and dry components of deposition. Currently the best estimates are outputs from the CMAQ v5.1 model using emissions inventory data from 2006. We anticipate providing new total deposition maps (and GIS layers) for nitrogen and sulfur on the portal sometime in 2013. These are being created by the Total Deposition Science Committee of the National Atmospheric Deposition Program (NADP) and will cover the continental United States. The anticipated total deposition map products will incorporate the best current knowledge on how to combine measured and modeled deposition into gridded information that can be used in critical load exceedance calculations. The gridded deposition is necessary when assessing impacts across the landscape, because measured information alone is considered representative for a relatively short distance (roughly 10 miles) from the monitoring site. Total deposition map products from NADP will be released annually, coincident with posting of the most current Clean Air Status and Trends Network (CASTNET) data. The most current year of information posted on the portal will usually be approximately one year behind the current date. Forests should use modeled total deposition estimates when calculating CL exceedances. The Forest should consult with an air specialist before using regionally refined deposition estimates to make sure that all components of total deposition (wet and dry) are incorporated accurately.
General Instructions for Calculating Critical Load Exceedance
Critical load exceedance is determined by subtracting the critical load from the deposition rate. Positive exceedance values reflect the extent to which current pollution loading exceeds the CL. Exceedance = Total Deposition Rate – Critical Load. It is also useful to calculate “exceedance classes” to facilitate mapping. Exceedance classes provide a measure of magnitude (relative size) of the exceedance (e.g., No Exceedance, 1-1.5 times Exceedance, 1.5-2 times Exceedance, or >2 times Exceedance). Exceedance Class = Total Deposition Rate / CL.
January 4, 2013
2
Ideally, alternative CLs will be spatially represented in a format that can be used in GIS, so that the exceedance and exceedance class calculations can be made for each grid cell. There are several key points to keep in mind when making the calculations:
• For Forest Planning, when a range of CLs is provided the lowest CL should be used in this analysis. Selecting the lowest CL protects the most sensitive resources and ecosystems.
• Use total deposition (wet + dry). Deposition from gases and particles is included in modeled dry deposition, although fewer monitoring sites result in increased uncertainty relative to modeled wet deposition. Deposition from rain and snow is included in modeled wet deposition. Deposition from clouds and fog is NOT included in modeled wet deposition. Although deposition from clouds and fog can contribute significantly to total deposition at high elevations in certain parts of the country, this information is available for so few sites that it is generally not recommended for Forest Planning assessments. Areas that have access to cloud chemistry data should document how it was incorporated into total deposition and the rationale behind that process.
• For CLs of nutrient nitrogen, use only nitrogen deposition. For CLs of acidity, use sulfur and nitrogen deposition (accounting for the fact that some nitrogen deposition is used by ecosystems for plant growth). Make sure that you understand the units of measure for the deposition data (see following bullet).
• Both the CL and deposition rate must be in the same unit of measure prior to calculating CL exceedance; this will vary for CLs of nitrogen and CLs of acidity.
o CLs of nutrient nitrogen and CMAQ deposition estimates for nitrogen are both provided on the Portal in kilograms/hectare (kg/ha). When using alternative site-specific CLs and/or deposition estimates, ensure that the units match before calculating CL exceedances.
o CLs of acidity for surface water are provided on the Portal in milliequivalents/square meter (meq/m2). Terrestrial CLs of acidity for forested ecosystems are provided in equivalents/hectare (eq/ha). The CMAQ deposition estimates posted on the Portal are in kg/ha. In the data provided on the Portal, nitrogen and sulfur deposition estimates were converted into these units before CL exceedances were calculated. If you are using alternative site-specific CLs or deposition data, you will be responsible for converting the data into the correct units before calculating critical load exceedances. When sulfur and nitrogen deposition are examined together, as they are
in critical loads of acidity, units must be in eq or meq (not kg), due to the different molecular weights of nitrogen and sulfur. CLs of acidity must be expressed in eq/ha or meq/m2 and compared to deposition of S+N also expressed as eq/ha or meq/m2. If CMAQ deposition estimates from the Portal are used, convert total S and total N, individually, from kg/ha to meq/m2 or eq/ha before adding them together (note that some N is used by the ecosystems for plant growth and should not be included as pollution deposition). This is explained further under the CL of Acidity section below.
Some deposition sources post sulfur and nitrogen deposition, while other sources post sulfate (SO4) and nitrate (NO3) deposition (NADP). The CMAQ deposition estimates hosted on the Portal contain estimates for sulfur and nitrogen deposition. Estimates of sulfate and nitrate deposition need to be converted into sulfur and nitrogen deposition before being used for CL exceedance calculation.
Conversions ensure that units match prior to exceedance calculation.
January 4, 2013
3
Empirical CLs of Nitrogen: calculating CL exceedances and CL exceedance classes
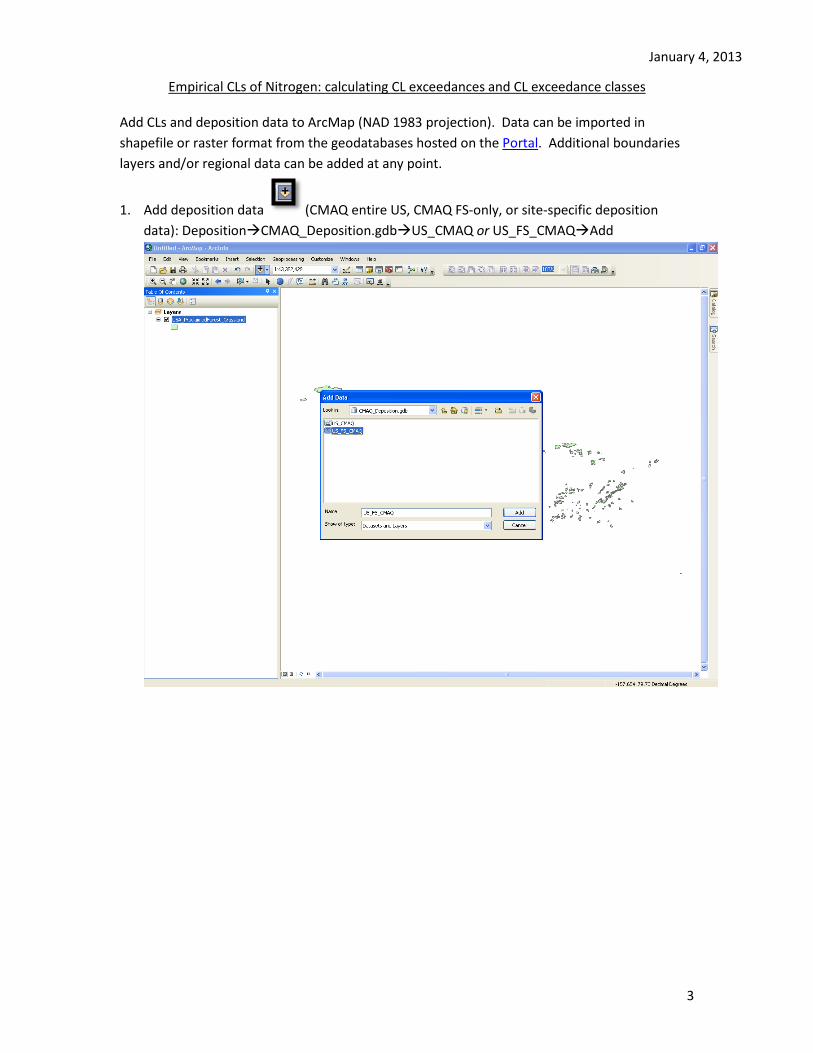
Add CLs and deposition data to ArcMap (NAD 1983 projection). Data can be imported in shapefile or raster format from the geodatabases hosted on the Portal. Additional boundaries layers and/or regional data can be added at any point.
1. Add deposition data (CMAQ entire US, CMAQ FS-only, or site-specific deposition data): DepositionCMAQ_Deposition.gdbUS_CMAQ or US_FS_CMAQAdd
January 4, 2013
4
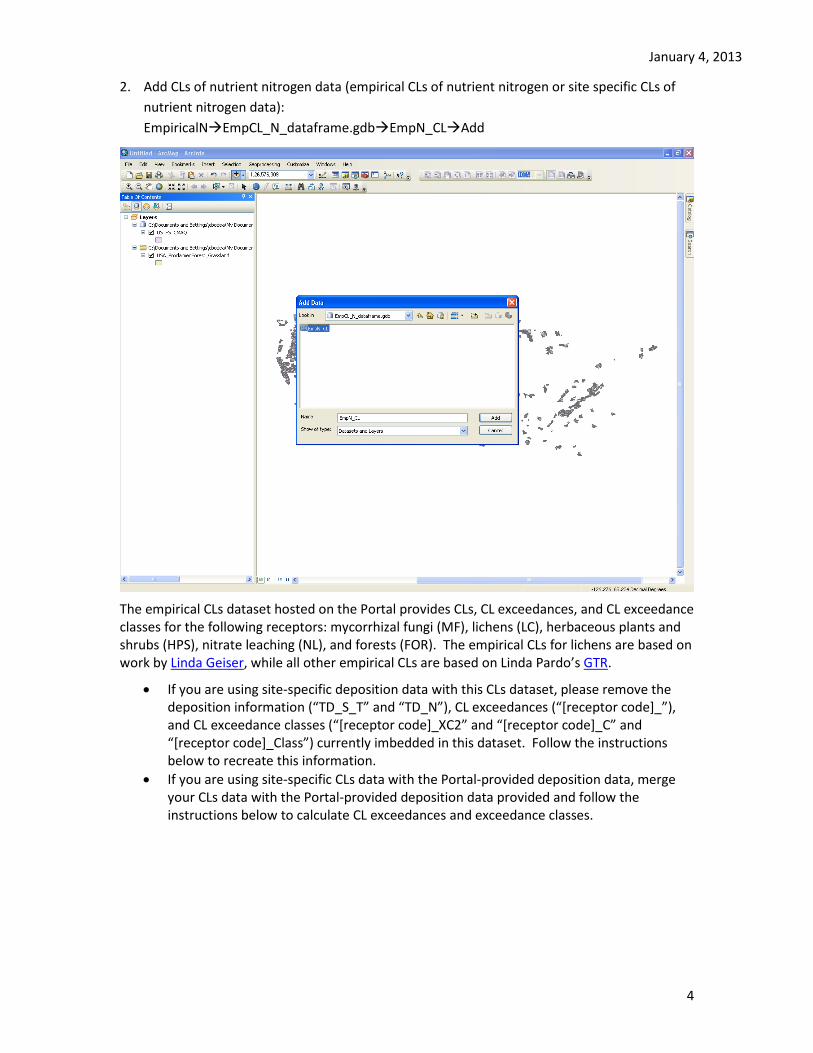
2. Add CLs of nutrient nitrogen data (empirical CLs of nutrient nitrogen or site specific CLs of nutrient nitrogen data): EmpiricalNEmpCL_N_dataframe.gdbEmpN_CLAdd
The empirical CLs dataset hosted on the Portal provides CLs, CL exceedances, and CL exceedance classes for the following receptors: mycorrhizal fungi (MF), lichens (LC), herbaceous plants and shrubs (HPS), nitrate leaching (NL), and forests (FOR). The empirical CLs for lichens are based on work by Linda Geiser, while all other empirical CLs are based on Linda Pardo’s GTR.
• If you are using site-specific deposition data with this CLs dataset, please remove the deposition information (“TD_S_T” and “TD_N”), CL exceedances (“[receptor code]_”), and CL exceedance classes (“[receptor code]_XC2” and “[receptor code]_C” and “[receptor code]_Class”) currently imbedded in this dataset. Follow the instructions below to recreate this information.
• If you are using site-specific CLs data with the Portal-provided deposition data, merge your CLs data with the Portal-provided deposition data provided and follow the instructions below to calculate CL exceedances and exceedance classes.
January 4, 2013
5
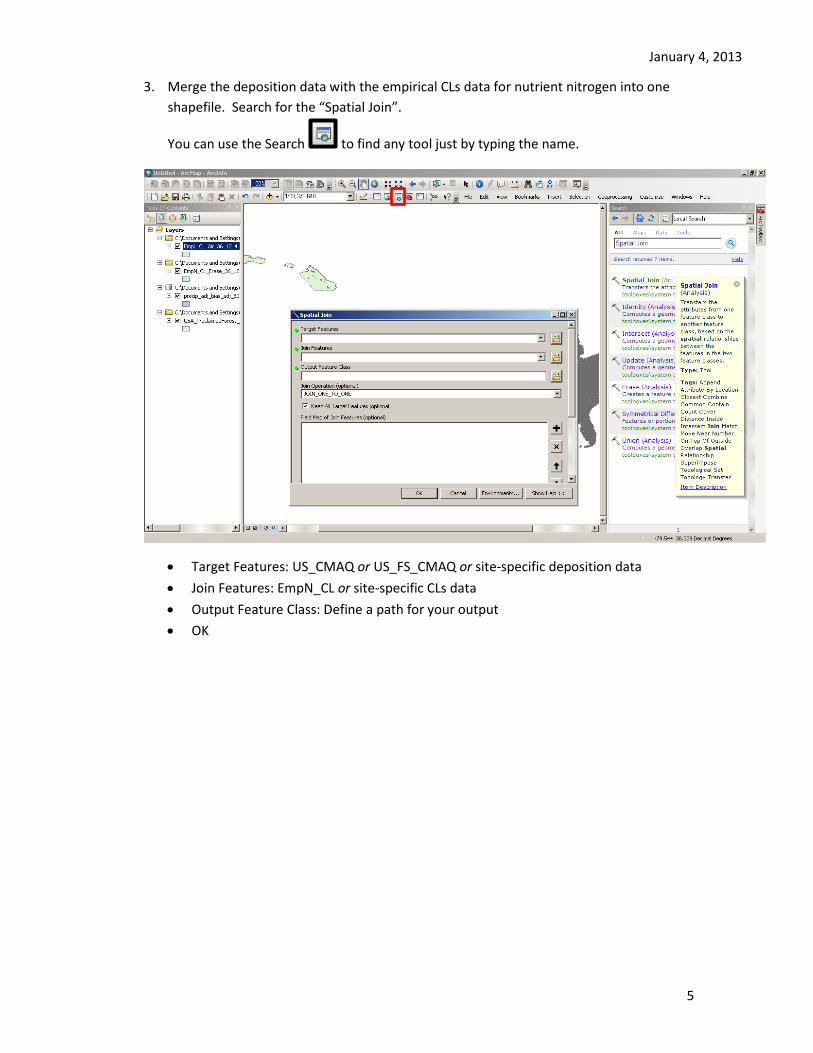
3. Merge the deposition data with the empirical CLs data for nutrient nitrogen into one shapefile. Search for the “Spatial Join”.
You can use the Search to find any tool just by typing the name.
• Target Features: US_CMAQ or US_FS_CMAQ or site-specific deposition data • Join Features: EmpN_CL or site-specific CLs data • Output Feature Class: Define a path for your output • OK
January 4, 2013
6
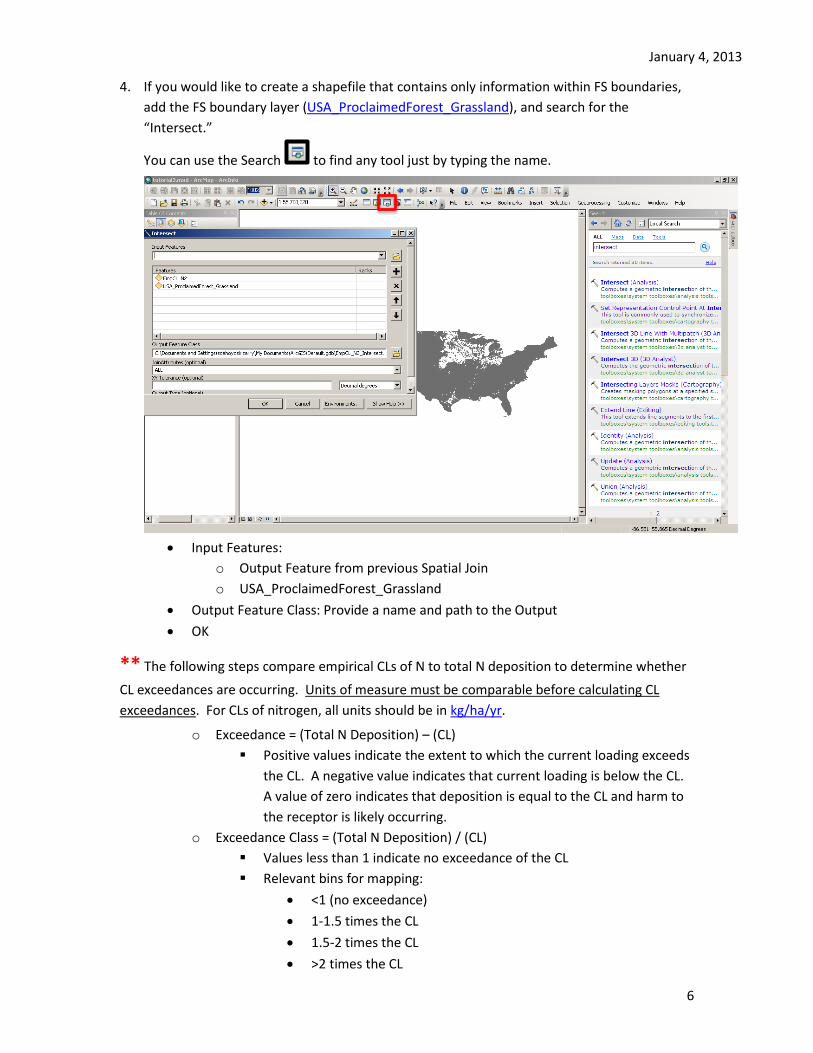
4. If you would like to create a shapefile that contains only information within FS boundaries, add the FS boundary layer (USA_ProclaimedForest_Grassland), and search for the “Intersect.”
You can use the Search to find any tool just by typing the name.
• Input Features:
o Output Feature from previous Spatial Join o USA_ProclaimedForest_Grassland
• Output Feature Class: Provide a name and path to the Output • OK
** The following steps compare empirical CLs of N to total N deposition to determine whether
CL exceedances are occurring. Units of measure must be comparable before calculating CL exceedances. For CLs of nitrogen, all units should be in kg/ha/yr.
o Exceedance = (Total N Deposition) – (CL) Positive values indicate the extent to which the current loading exceeds
the CL. A negative value indicates that current loading is below the CL. A value of zero indicates that deposition is equal to the CL and harm to the receptor is likely occurring.
o Exceedance Class = (Total N Deposition) / (CL) Values less than 1 indicate no exceedance of the CL Relevant bins for mapping:
• <1 (no exceedance) • 1-1.5 times the CL • 1.5-2 times the CL • >2 times the CL
January 4, 2013
7
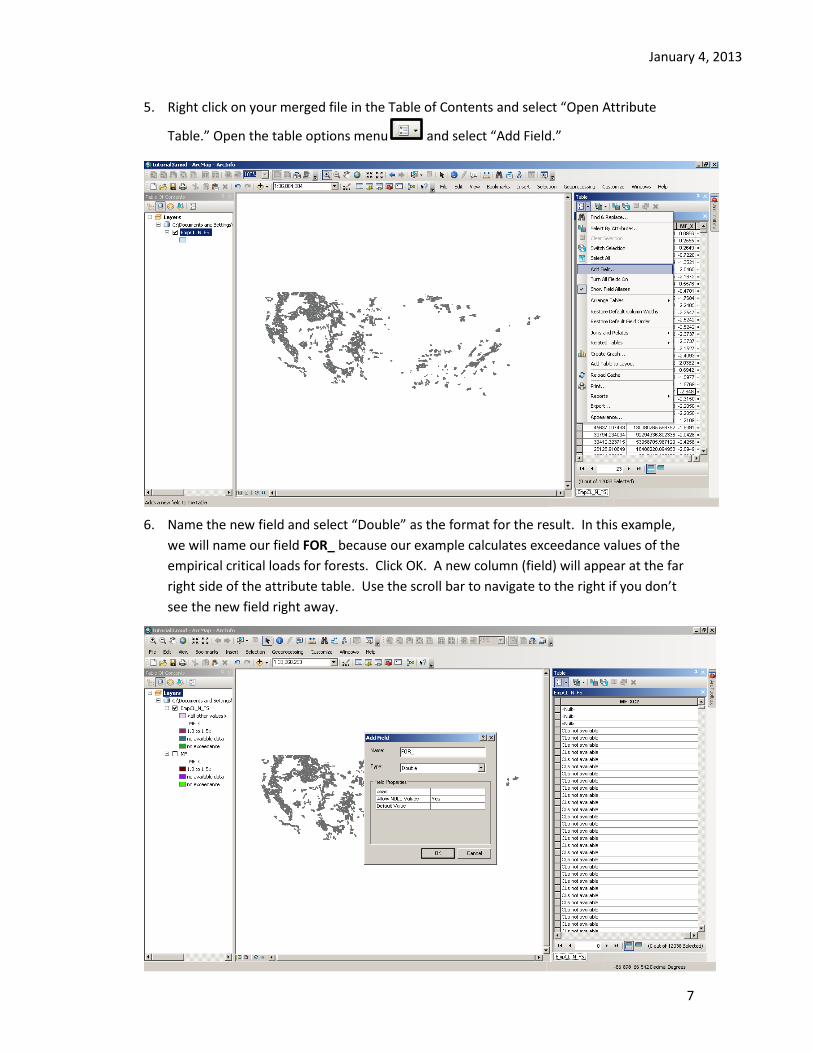
5. Right click on your merged file in the Table of Contents and select “Open Attribute
Table.” Open the table options menu and select “Add Field.”
6. Name the new field and select “Double” as the format for the result. In this example,
we will name our field FOR_ because our example calculates exceedance values of the empirical critical loads for forests. Click OK. A new column (field) will appear at the far right side of the attribute table. Use the scroll bar to navigate to the right if you don’t see the new field right away.
January 4, 2013
8
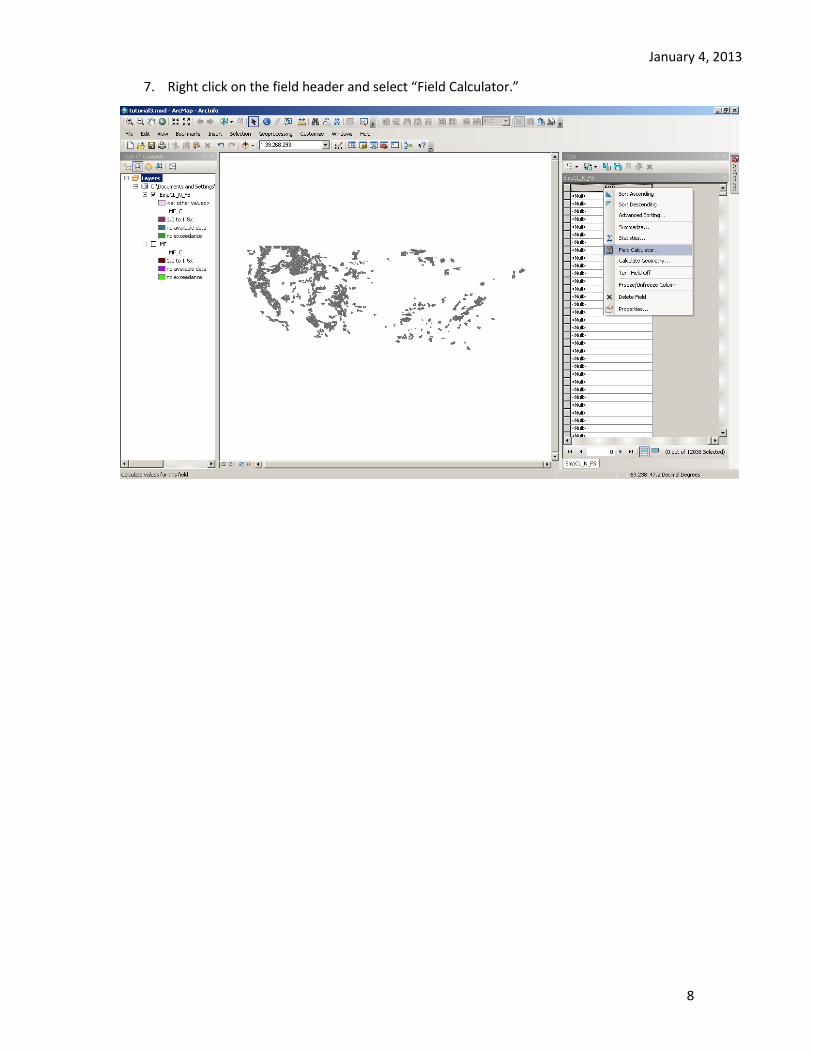
7. Right click on the field header and select “Field Calculator.”
January 4, 2013
9
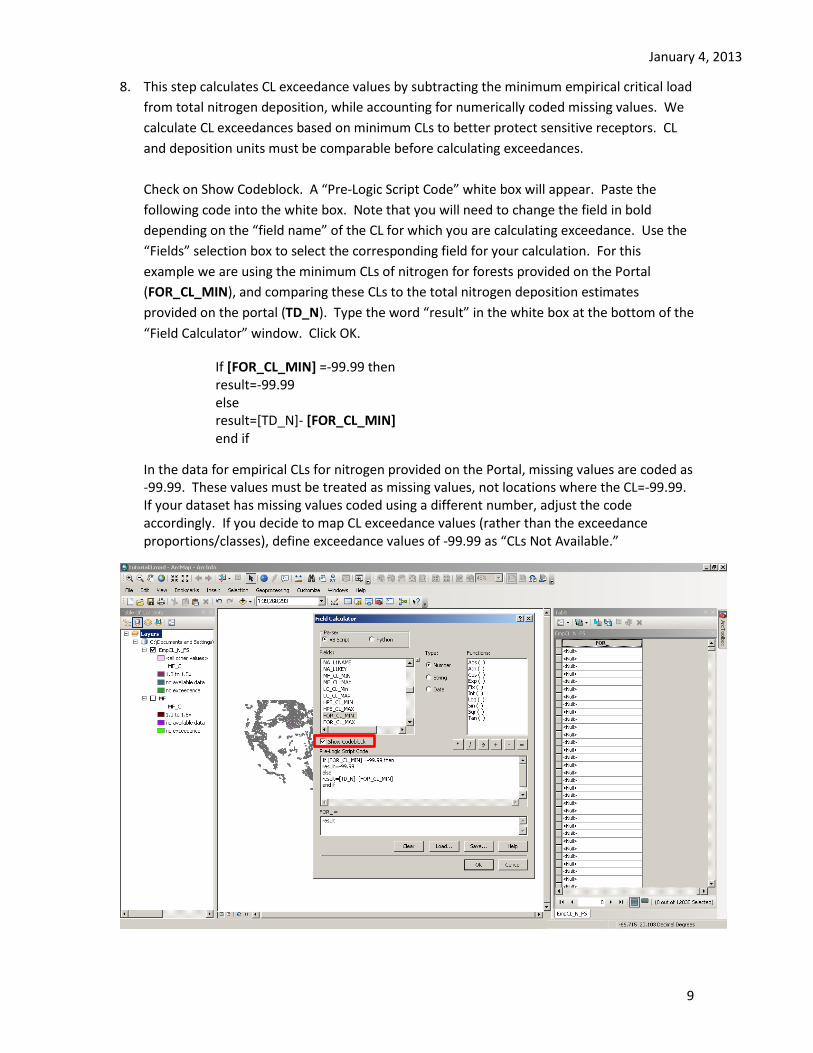
8. This step calculates CL exceedance values by subtracting the minimum empirical critical load from total nitrogen deposition, while accounting for numerically coded missing values. We calculate CL exceedances based on minimum CLs to better protect sensitive receptors. CL and deposition units must be comparable before calculating exceedances. Check on Show Codeblock. A “Pre-Logic Script Code” white box will appear. Paste the following code into the white box. Note that you will need to change the field in bold depending on the “field name” of the CL for which you are calculating exceedance. Use the “Fields” selection box to select the corresponding field for your calculation. For this example we are using the minimum CLs of nitrogen for forests provided on the Portal (FOR_CL_MIN), and comparing these CLs to the total nitrogen deposition estimates provided on the portal (TD_N). Type the word “result” in the white box at the bottom of the “Field Calculator” window. Click OK.
If [FOR_CL_MIN] =-99.99 then result=-99.99 else result=[TD_N]- [FOR_CL_MIN] end if
In the data for empirical CLs for nitrogen provided on the Portal, missing values are coded as -99.99. These values must be treated as missing values, not locations where the CL=-99.99. If your dataset has missing values coded using a different number, adjust the code accordingly. If you decide to map CL exceedance values (rather than the exceedance proportions/classes), define exceedance values of -99.99 as “CLs Not Available.”

January 4, 2013
10
9. Add another field and select “Double” as the format for your result. Name this field FOR_C.
10. To calculate the proportion by which deposition exceeds the CL (rather than the amount), right click on the new field’s header and select Field Calculator. The resulting values can be used as the first step in classifying CL exceedances into “Exceedance Classes,” again leaving non-values as -99.99. Repeat Step 8 using the following code, again adjusting the code if your CLs data does not have numerically coded missing values:
If [FOR_CL_MIN] =-99.99 then result=-99.99 else result=[TD_N]/ [FOR_CL_MIN] end if
11. Add another field. Name this field FOR_XC. This time select “Text” as the format for your output.
12. To classify the exceedance proportions into “Exceedance Classes,” right click on the new field’s header and select “Field Calculator.” Repeat Step 8 using the following code:
If [FOR_C] <1 then result="No Exceedance" elseif [FOR_C] >2.0 then result="Over 2X Exceedance" elseif [FOR_C] >=1.5 then result="1.5 to 2X Exceedance" elseif [FOR_C] >=1 then result="1 to 1.5X Exceedance" else result="Null" end if
This field classifies the exceedance proportions into the following exceedance classes (this in an interim step where missing data is incorrectly classified as “No Exceedance”):
• FOR_C < 1 No Exceedance • FOR_C between 1 and 1.5 1.0 to 1.5 Times Exceedance • FOR_C between 1.5 and 2.0 1.5 to 2.0 Times Exceedance • FOR_C > 2 Over 2.0 Times Exceedance
*Note: The value of the exceedances classes can be adjusted if exceedances are much higher, as they are for the CL exceedance classes for lichens found on the Portal.
January 4, 2013
11
13. Add another field. Name this field FOR_XC2. Select “Text” as the format for your output. If you do not have numerically coded missing values you can skip Steps 13 and 14.
14. This step will define non data values (-99.99) as “CLs Not Available,” however there will still be some “Null” values remaining. Other values for this field will be equal to the previous field value FOR_XC. Right click on the new field’s header and select “Field Calculator.” Change the values in the code below if missing values are coded with a number other than -99.99. Repeat Step 8 using the following code:
If [FOR_CL_MIN] =-99.99 then result="CLs Not Available"' else result= [FOR_XC] end if
15. Add another field. Name this field FOR_Class. Select “Text” as the format for your output.
16. This new field is used to define null values as “CLs Not Available.” Other values for this field will be equal to the previous field value FOR_XC2. This is the field to use when mapping CL exceedance classes. Right click on the new field’s header and select “Field Calculator.” Repeat Step 8 using the following code:
If [FOR_XC2] ="Null" result="CLs Not Available"' else result= [FOR_XC2] end if
17. Add another field. Name this field FOR_X. Select “Text” as the format for your output. 18. This field classifies the data into “Exceedance” versus “No Exceedance” instead of
classifying exceedances into exceedance classes. This in an interim step where missing data is incorrectly classified as “No Exceedance.” Right click on the new field’s header and select “Field Calculator.” Repeat Step 8 using the following code:
If [FOR_C] <1 then result="No Exceedance" else result="Exceedance " end if

January 4, 2013
12
19. Add another field. Name this field FOR_X2. Select “Text” as the format for your output. 20. This new field classifies the data into only three categories: exceedance, no exceedance,
and CLs not available. This field is useful when mapping at the national scale, when exceedance versus no exceedance is a more useful distinction than highlighting levels of exceedance. Right click on the new field’s header and select “Field Calculator.” Repeat Step 8 using the following code: If [FOR_CL_MIN] =-99.99 then result="CLs Not Available"' else result= [FOR_X] end if
21. Steps 6 to 20 can be repeated to determine exceedances of empirical CLs of nutrient
nitrogen for each ecosystem receptor: mycorrhizal fungi (MF), lichens (LC), herbaceous plants and shrubs (HPS), forests (FOR), and nitrate leaching (NL).
Created data layers (naming conventions are the same for all receptors in the data provided on the Portal, substituting in the appropriate ecosystem ID code outlined in Step 21): FOR_: These are the CL exceedance values. A CL exceedance is occurring if deposition is equal to or greater than the CL. Missing values are identified as “Null” or -99.99. FOR_C: These are the CL exceedance proportions. A CL exceedance is occurring if deposition is equal to or greater than 1. Missing values are identified as “Null” or -99.99. This is an interim product which calculates the relative magnitude of the CL exceedance, but the values have not yet been binned into exceedance classes. FOR_XC: This is an interim exceedance class product in which the missing data is not accurately labeled. FOR_XC2: This is an interim exceedance class product in which some of the missing data is not accurately labeled. FOR_Class: These are the exceedance classes that should be used when you want to examine the relative magnitude of the CL exceedance. FOR_X: This is an interim “Exceedance” versus “No Exceedance” product in which the missing data is not accurately labeled. FOR_X2: This is the exceedance data that should be used when you want to examine/map whether exceedance is occurring. Exceedance classes are merged so that only three categories remain: CLs not available, No Exceedance, and Exceedance. This field is useful when mapping at the national scale, when “Exceedance” versus “No Exceedance” is a more useful distinction than highlighting levels of exceedance.
January 4, 2013
13
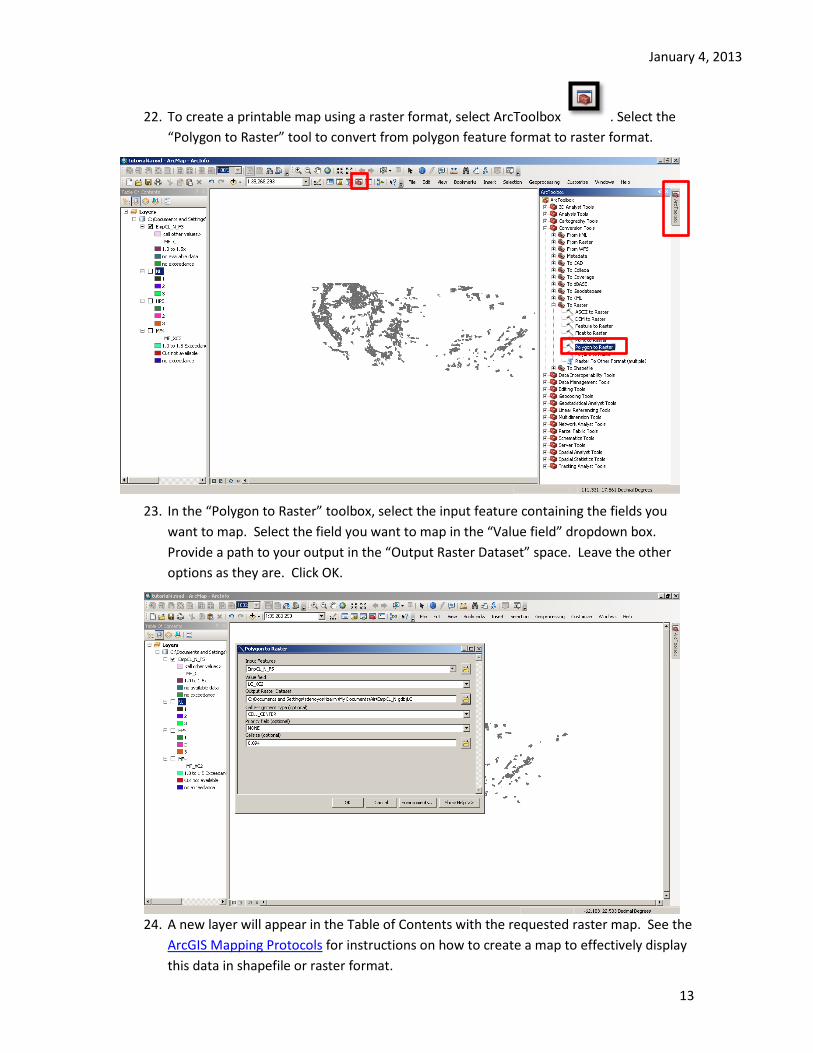
22. To create a printable map using a raster format, select ArcToolbox . Select the “Polygon to Raster” tool to convert from polygon feature format to raster format.
23. In the “Polygon to Raster” toolbox, select the input feature containing the fields you
want to map. Select the field you want to map in the “Value field” dropdown box. Provide a path to your output in the “Output Raster Dataset” space. Leave the other options as they are. Click OK.
24. A new layer will appear in the Table of Contents with the requested raster map. See the
ArcGIS Mapping Protocols for instructions on how to create a map to effectively display this data in shapefile or raster format.
January 4, 2013
14
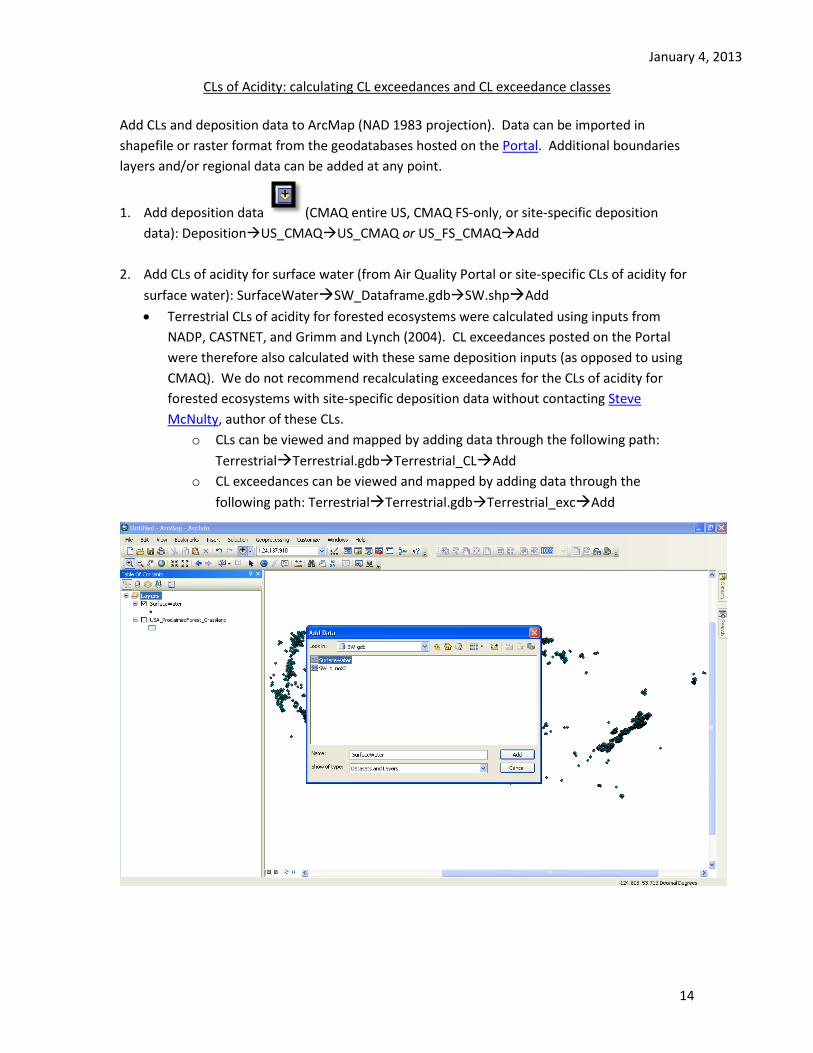
CLs of Acidity: calculating CL exceedances and CL exceedance classes Add CLs and deposition data to ArcMap (NAD 1983 projection). Data can be imported in shapefile or raster format from the geodatabases hosted on the Portal. Additional boundaries layers and/or regional data can be added at any point.
1. Add deposition data (CMAQ entire US, CMAQ FS-only, or site-specific deposition data): DepositionUS_CMAQUS_CMAQ or US_FS_CMAQAdd
2. Add CLs of acidity for surface water (from Air Quality Portal or site-specific CLs of acidity for
surface water): SurfaceWaterSW_Dataframe.gdbSW.shpAdd • Terrestrial CLs of acidity for forested ecosystems were calculated using inputs from
NADP, CASTNET, and Grimm and Lynch (2004). CL exceedances posted on the Portal were therefore also calculated with these same deposition inputs (as opposed to using CMAQ). We do not recommend recalculating exceedances for the CLs of acidity for forested ecosystems with site-specific deposition data without contacting Steve McNulty, author of these CLs.
o CLs can be viewed and mapped by adding data through the following path: TerrestrialTerrestrial.gdbTerrestrial_CLAdd
o CL exceedances can be viewed and mapped by adding data through the following path: TerrestrialTerrestrial.gdbTerrestrial_excAdd
January 4, 2013
15
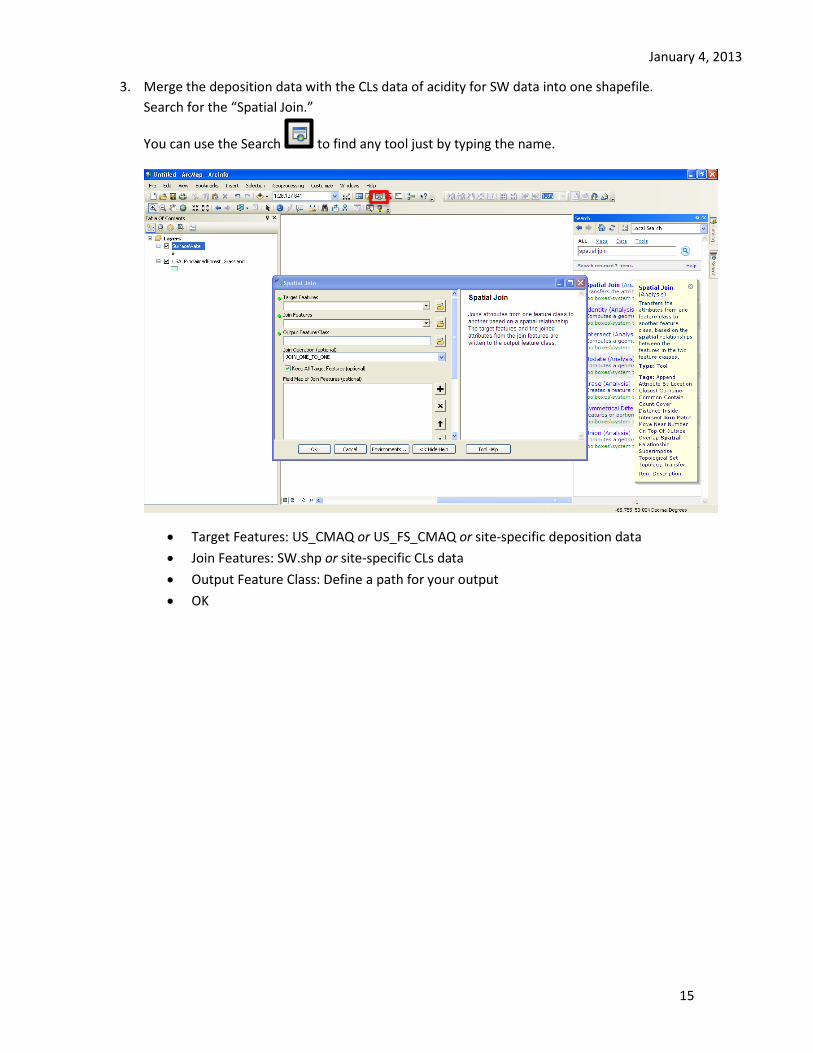
3. Merge the deposition data with the CLs data of acidity for SW data into one shapefile. Search for the “Spatial Join.”
You can use the Search to find any tool just by typing the name.
• Target Features: US_CMAQ or US_FS_CMAQ or site-specific deposition data • Join Features: SW.shp or site-specific CLs data • Output Feature Class: Define a path for your output • OK
January 4, 2013
16
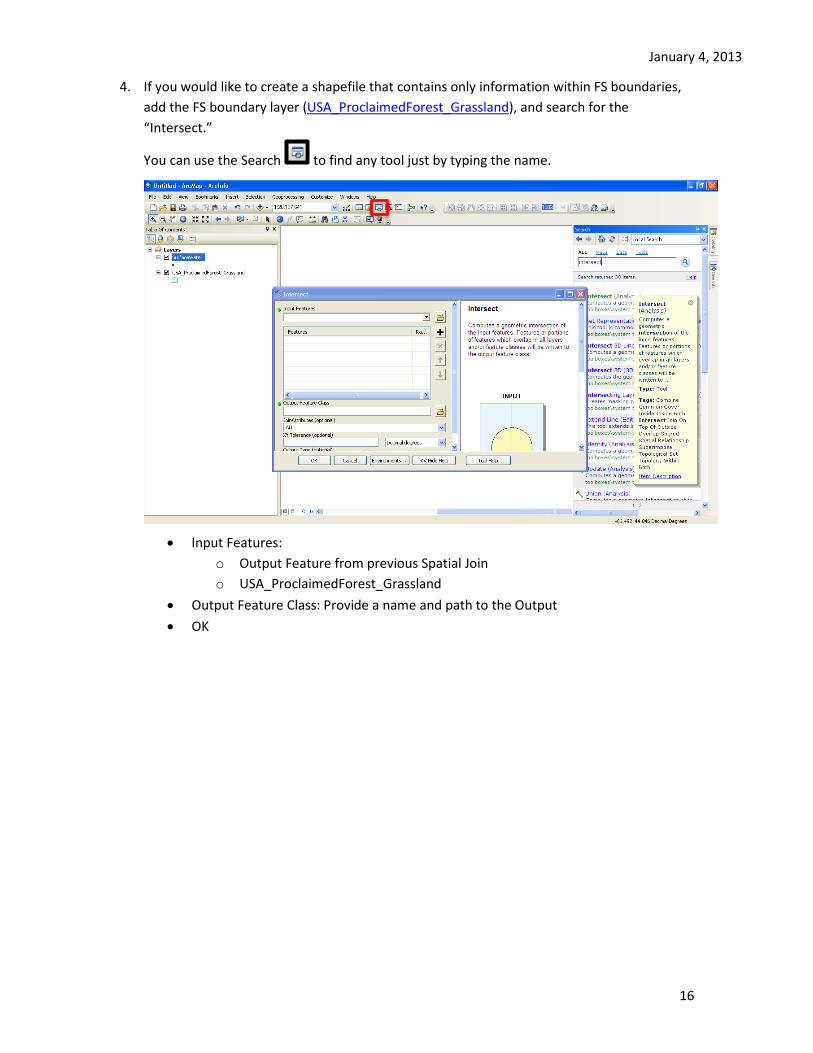
4. If you would like to create a shapefile that contains only information within FS boundaries, add the FS boundary layer (USA_ProclaimedForest_Grassland), and search for the “Intersect.”
You can use the Search to find any tool just by typing the name.
• Input Features:
o Output Feature from previous Spatial Join o USA_ProclaimedForest_Grassland
• Output Feature Class: Provide a name and path to the Output • OK
January 4, 2013
17
** Compare the CLs of acidity for surface waters to Total S+N Deposition. It is important to make sure units of measure for both CLs and deposition are in meq/m2 or eq/ha. Sulfate and nitrate have different abilities to acidify due to the different molecular weights of sulfur and nitrogen; this must be reflected in conversions prior to adding S and N deposition together for CL exceedance calculations.
• Unlike sulfur, some of the nitrogen that is deposited into the ecosystem is used for plant function and growth. Instead of adding S deposition to N deposition to determine Total Deposition, add S deposition to the amount of N deposition not used by the ecosystem. The amount of nitrogen that has leached into surface waters is an appropriate substitute for this value. The CLs of acidity for surface waters provided on the Portal contain a nitrate leaching field (meq/m2) extrapolated across the landscape. After verifying that units are equal and expressed in meq or eq, this term should be added to total S deposition to obtain the Total Deposition value used to calculate CL exceedance.
• Some deposition sources provide sulfur and nitrogen deposition, while other sources provide sulfate and nitrate deposition (NADP). The CMAQ deposition estimates hosted on the Portal contain estimates for sulfur and nitrogen deposition. Estimates of sulfate and nitrate deposition need to be converted into sulfur and nitrogen deposition before being used for CL exceedance calculation.
• The CLs of acidity for surface water provided on the Portal are expressed in meq/m2. • CMAQ modeled depositions for Total S and Total N are presented in kg/ha. Convert S to
meq/m2 using the factor provided below. Add this value to the N-leaching term provided in the CLs of acidity for surface waters shapefile (units already in meq/m2). If using site-specific CLs of acidity for surface waters without an N-leaching term (whether you do not know the N-leaching value or whether you assume N-leaching=0) proceed by using Total S Deposition as Total Deposition (do not include N deposition).
o S kg/ha x 6.25 = S meq/m2 o N kg/ha x 7.14 = N meq/m2
• Exceedance = (Total S Deposition + N-Leaching) – (CL) o Positive values indicate the extent to which the current loading exceeds the CL.
A negative value indicates that current loading is below the CL. A zero value indicates that deposition is equal to the CL and harm to the receptor is likely occurring.
• Exceedance Class = (Total S Deposition + N-Leaching) / (CL) o Values less than 1 indicate no exceedance of the CL o Relevant bins for mapping:
<1 (no exceedance) 1-1.5 times the CL 1.5-2 times the CL >2 times the CL
o CLs in extremely sensitive ecosystems are sometimes calculated as negative numbers; this incorrectly results in these systems being classified into the no exceedance bin. When CL < 0, exceedance should be placed into the highest category for mapping purposes.
January 4, 2013
18
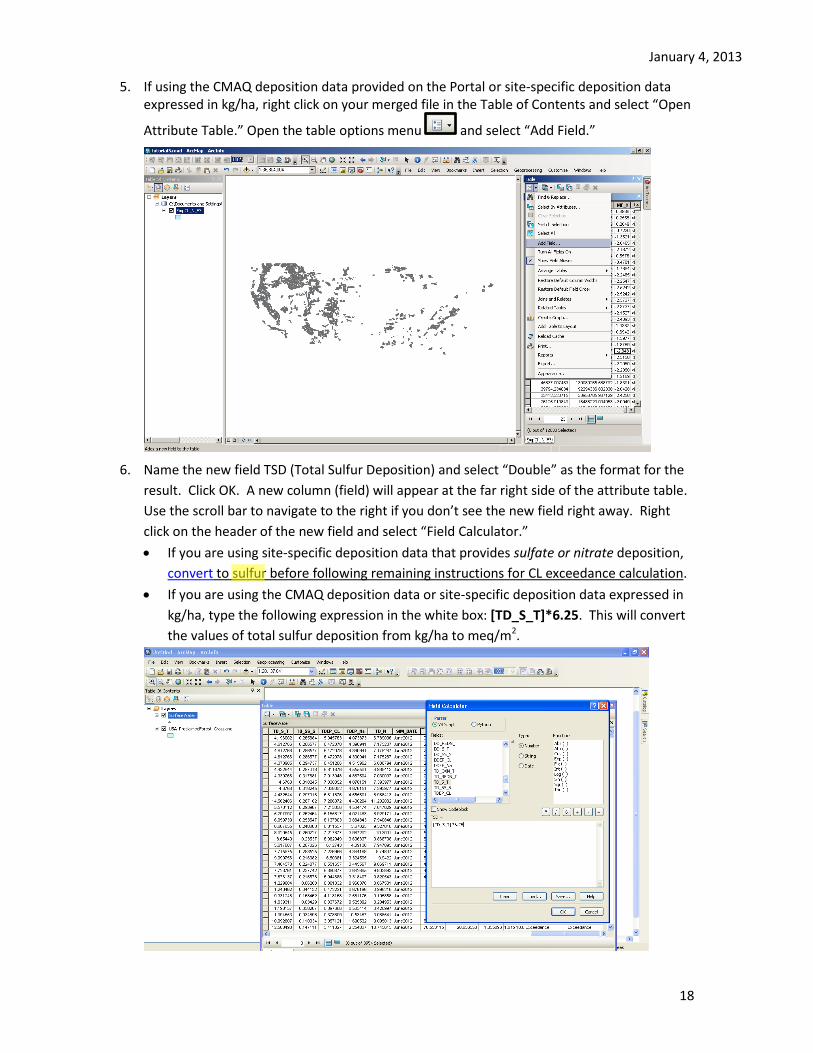
5. If using the CMAQ deposition data provided on the Portal or site-specific deposition data expressed in kg/ha, right click on your merged file in the Table of Contents and select “Open
Attribute Table.” Open the table options menu and select “Add Field.”
6. Name the new field TSD (Total Sulfur Deposition) and select “Double” as the format for the
result. Click OK. A new column (field) will appear at the far right side of the attribute table. Use the scroll bar to navigate to the right if you don’t see the new field right away. Right click on the header of the new field and select “Field Calculator.” • If you are using site-specific deposition data that provides sulfate or nitrate deposition,
convert to sulfur before following remaining instructions for CL exceedance calculation. • If you are using the CMAQ deposition data or site-specific deposition data expressed in
kg/ha, type the following expression in the white box: [TD_S_T]*6.25. This will convert the values of total sulfur deposition from kg/ha to meq/m2.
January 4, 2013
19
7. Add another new field to the attribute table. This step calculates CL exceedance values by subtracting the CL from total deposition. Name the field SW_X (surface water exceedance) and select “Double” as the format for the output values. Right click on the field header and select “Field Calculator.” • Calculate the critical load exceedance value by typing the following expression into the
white box: ([TSD] + [Nleach]) - [CL_50]. • If you are using site-specific CLs of acidity for surface waters that do not provide an N-
leaching term, use Total S to represent Total Deposition. Type the following expression into the white box: [TSD] - [CL_50].
8. Add a new field to the attribute table. Name the field SW_XC and select “Double” as the format for the output values. To calculate the proportion by which deposition exceeds the CL (rather than the amount), right click on the new field’s header and select Field Calculator. • Type the following expression in the white box: ([TSD] + [Nleach]) / [CL_50]. This
equation calculates the proportion by which deposition exceeds the critical load (useful when creating exceedance classes).
• If you are using site-specific CLs of acidity for surface waters that do not provide an N-leaching term, use Total S to represent Total Deposition. Type the following expression into the white box: [TSD] / [CL_50].
• CLs in sensitive ecosystems are sometimes calculated as negative numbers, meaning that effects are experienced even if there is no deposition occurring. Due to the process of division to create exceedance classes, these areas are incorrectly assigned a negative exceedance proportion using the above procedure. Therefore, an additional step is needed to reassign these areas to the highest exceedance class available.
9. Add a new field to the attribute table. Name the field SW_XProportion (surface water exceedance proportion) and select “Double” as the format for the output values. This step uses the exceedance proportions calculated in SW_XC, substituting a high exceedance proportion (1000) when the CL is negative.
If [CL_50] <0 then result=1000 else result= [SW_XC] end if
January 4, 2013
20
10. Add another new field to the attribute table. Name the field SW_XC2 and select “Text” as the format for the field values. To classify the exceedance proportions into “Exceedance Classes,” right click on the new field’s header and select “Field Calculator.” Check “Show Codeblock” and type the following code:
If [SW_XProportion] <1 then result="No Exceedance" elseif [SW_ XProportion] >50.0 then result="Over 50X Exceedance" elseif [SW_ XProportion] >=10.0 then result="10 to 50X Exceedance" elseif [SW_ XProportion] >=1 then result="1 to 10X Exceedance" else result="Null" end if
11. Add another field to the attribute table and name the new field SW_X_1. Select “Text” as the format for your output.
12. This step will create a field to display only exceedance and non exceedance. Right click on the new field’s header and select “Field Calculator.” Repeat Step 8 using the following code:
If [SW_XProportion] <1 then result="No Exceedance" else result="Exceedance" end if
Created data layers: SW_X: These are the CL exceedance values. A CL exceedance is occurring if deposition is equal to or greater than the CL. SW_XC: This is an interim step in the calculation of exceedance proportions (areas with negative CLs are incorrectly assigned a negative value and placed into a no exceedance category). A CL exceedance is occurring if deposition is equal to or greater than 1 (or where CL<0). SW_XProportion: These are the CL exceedance proportions. A CL exceedance is occurring if deposition is equal to or greater than 1. SW_XC2: These are the exceedance classes that should be used when you want to examine the relative magnitude of the CL exceedance. SW_X_1: This is the exceedance data that should be use when you want to examine/map whether exceedance is occurring. Exceedance classes are merged so that only two categories remain: No Exceedance and Exceedance. This field is useful when mapping at the national scale, when “Exceedance” versus “No Exceedance” is a more useful distinction than highlighting levels of exceedance.