Embed Size (px)
Citation preview

January 10, 2013
Report on the Virginia Early Warning System (VEWS)
Education Commission of the States
June 27, 2013
June 27, 2013Virginia Department of Education

January 10, 2013
2June 27, 2013
Early Warning Systems
Early warning systems (EWS) rely on readily available data housed at the school to:
Predict which students are at-risk for dropping out or failing
Target resources to support off-track students while they are still in school, before they drop out
Examine patterns and identify school climate issues
June 27, 2013Virginia Department of Education

January 10, 2013
3June 27, 2013
Ninth Grade is a Critical Year
• Ninth grade is a “make-or-break year” More students drop out in ninth grade than any other high
school grade
A disproportionate number of students who are held back in ninth grade subsequently drop out
•Monitoring students’ progress throughout ninth grade—and even during the first semester—provides powerful indicators that can predict whether students will complete high school
June 27, 2013Virginia Department of Education

January 10, 2013
4June 27, 2013
Key Indicators
Engagement Attendance/absenteeism
Course PerformanceCourse grades Number of credits earned
End-of-Year Indicator Core course performance and accumulated credits
June 27, 2013Virginia Department of Education

January 10, 2013
5June 27, 2013
“High-Yield” Academic Indicators: Attendance
• Additional schoolwide interventions per 500 students in a Title I school: $179,000
• Includes the purchase of supplemental reading and mathematics programs, programs for English Language Learners (ELLs), and professional development
• (Title I Priority schools could receive up to $750,000)
0-4 5-9 10-14 15-19 20-24 25-29 30-34 35-39 40+0%
20%
40%
60%
80%
100%87%
63%
41%
21%
9%5% 2% 1% 0%
Four-Year Graduation Rates for Chicago Public Schools Students Enter-ing High School in 2001, by Ninth Grade Absences
(Allensworth & Easton, 2007)
Days Absent Per Semester (Course Cutting Counted as Partial Days)
Perc
ent G
radu
ated
in F
our Y
ears
June 27, 2013Virginia Department of Education

January 10, 2013
6June 27, 2013
“High-Yield” Academic Indicators: Course Failures
Type of School in Year 1 of Warning/Provisional-Graduation Rate Status
Number of Schools
Elementary and Combined 34
Middle (high grade 8) 27
High School (high grade 12) 11
High School Provisional (high grade 12) 2
Title I Focus School (included in count above) 10
Title I or School Improvement Grant (SIG) Priority School (included in count above)
8
0 1 2 3 4 5 6 7 8 More than 80%
20%
40%
60%
80%
100%
85%
70%
55%
42%33%
25%
13% 11%7%
2%
Four-Year Graduation Rates for Chicago Public Schools Students Entering High School in 2001, by Freshman Course Failures
(Allensworth & Easton, 2007)
Semester Course Failures
Perc
ent G
radu
ated
in F
our Y
ears
June 27, 2013Virginia Department of Education
January 10, 2013
7June 27, 2013
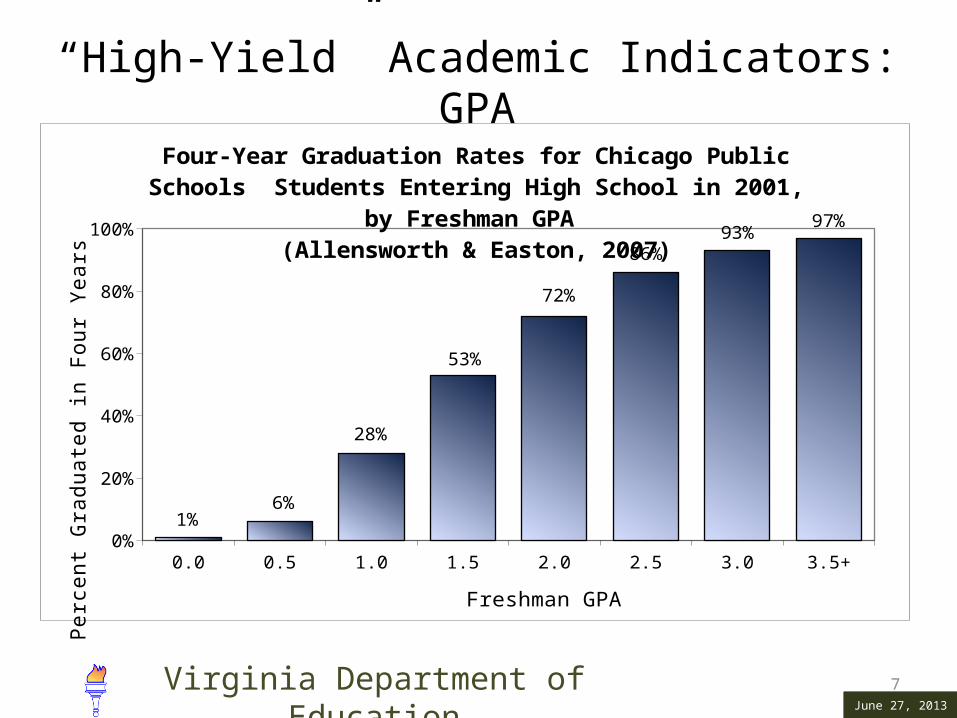
“High-Yield” Academic Indicators: GPA
• In the second year of warning, a contractor is assigned to the school and VDOE Office of School Improvement staff members assist and monitor the school. The contractor and OSI staff members review the school improvement plan and data provided by the school to determine what is working and what needs to be changed.
0.0 0.5 1.0 1.5 2.0 2.5 3.0 3.5+0%
20%
40%
60%
80%
100%
1%6%
28%
53%
72%
86%93%
97%
Four-Year Graduation Rates for Chicago Public Schools Students Enter-ing High School in 2001, by Freshman GPA
(Allensworth & Easton, 2007)
Freshman GPA
Perc
ent G
radu
ated
in F
our Y
ears
June 27, 2013Virginia Department of Education
January 10, 2013
8June 27, 2013
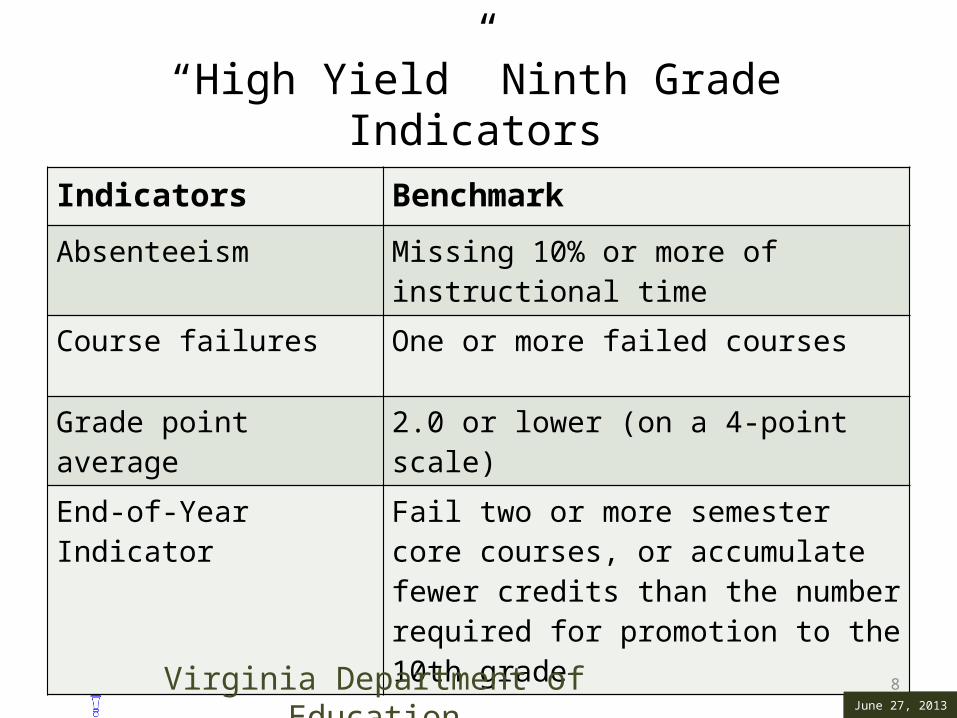
“High Yield” Ninth Grade Indicators
Indicators Benchmark
Absenteeism Missing 10% or more of instructional time
Course failures One or more failed courses
Grade point average 2.0 or lower (on a 4-point scale)
End-of-Year Indicator Fail two or more semester core courses, or accumulate fewer credits than the number required for promotion to the 10th grade
June 27, 2013Virginia Department of Education
January 10, 2013
9June 27, 2013
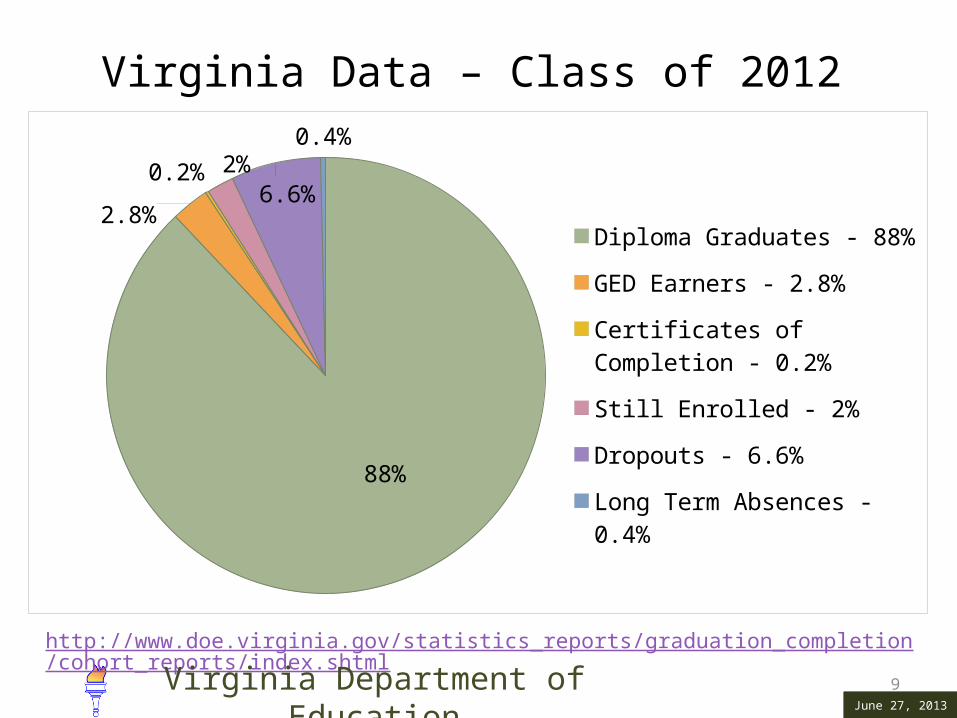
Virginia Data – Class of 2012
88%
2.8%0.2% 2%
6.6%
0.4%
Diploma Graduates - 88%
GED Earners - 2.8%
Certificates of Completion - 0.2%
Still Enrolled - 2%
Dropouts - 6.6%
Long Term Absences - 0.4%
http://www.doe.virginia.gov/statistics_reports/graduation_completion/cohort_reports/index.shtml
June 27, 2013Virginia Department of Education

January 10, 2013
10June 27, 2013
Standards of Accreditation
Modifications to Virginia accreditation calculations that included the Graduation and Completion Index (GCI) were approved by the Virginia Board of Education in February of 2009
New accreditation requirements were implemented with the graduating cohort of 2011
Graduation and Completion Index scores were factored into accreditation ratings for every school with a graduating class beginning with the 2011-2012 school year
http://www.doe.virginia.gov/boe/accreditation/index.shtml
June 27, 2013Virginia Department of Education

January 10, 2013
11June 27, 2013
Graduation and Completion Index (GCI) Point Values
Point Values Assigned to Graduation and Completion Index in the Virginia Standards Of Accreditation
Diploma/Certificate/Other Point Value
Board-recognized diplomas in Virginia Standards of Accreditation
100
GED 75Still in school 70
Certificates of Program Completion 25
•Benchmark of 85 points must be met for full accreditation rating.• Current index points or three-year trailing average of index points are the basis for
ratings (same as current calculation for SOL pass rates).• Schools with GCI below 85 points are rated Provisionally Accredited or Accredited
with Warning
June 27, 2013Virginia Department of Education
January 10, 2013
12June 27, 2013
VEWS Tool Features
Select schools, the National High School Center, the Appalachia Regional Comprehensive Center, and Virginia Department of Education (VDOE) conceptualized the current VEWS Tool.
This version allows users to: Import data from the state and school divisions’ database Accommodate local contextual factors for high schools
(e.g., semesters vs. trimesters vs. quarters) Align with the Virginia pre-high school index Modify the benchmarks/thresholds based on analysis of
longitudinal data (i.e., indicator validation)
June 27, 2013Virginia Department of Education

January 10, 2013
13June 27, 2013
VEWS Tool Features
Features (Continued):
Integrate behavioral indicators (referrals and suspensions) House an inventory of dropout prevention interventions Assign students to intervention programs and monitor student
response and progress in the interventions over the course of the school year
Create pre-set school-level summary reports, detailed student-level reports, and individual student reports
Create customized student-level reports
June 27, 2013Virginia Department of Education

January 10, 2013
14June 27, 2013
Risk Indicators in the VEWS ToolIndicator Time Frame Benchmark (red flag)
Pre-High School Before school begins VDOE validated pre-high school index
Attendance First 20 or 30 days, per grading period, end of year (annual)
Missed 10% or more of instructional time
Course failures Per grading period, end of year (annual)
Failed one or more semester courses (any subject)
Grade point average Per grading period, end of year (annual)
Earned 2.0 or lower (on a 4-point scale)
End-of-Year Indicator End-of-year (annual) Failed two or more semester core courses, or accumulated fewer credits than the number required for promotion to the next grade
Referrals and suspensions Per grading period, end of year (annual)
Locally validated
June 27, 2013Virginia Department of Education

January 10, 2013
15June 27, 2013
7-Step EWS Implementation Process
Step One: Establish the school EWS team, assign roles, and communicate responsibilities of the team in improving the graduation rate at the school
Step Two: Import data into the EWS tool (at a minimum, prior to the beginning of the ninth-grade year and at the end of each marking period)
Step Three: Frequently review and monitor data to identify students at risk for failing or dropping out and to understand patterns in student engagement and academic performance
June 27, 2013Virginia Department of Education

January 10, 2013
16June 27, 2013
7-Step EWS Implementation Process(Continued)
Step Four: Look beyond the indicators to identify root causes for student disengagement with school and academic failure
Step Five: Assign and provide interventions to address students’ identified needs
Step Six: Use data to monitor the progress of students who are participating in interventions to make midcourse corrections, add new interventions, or discontinue interventions as needed
Step Seven: Develop, implement, and monitor the school improvement plan
June 27, 2013Virginia Department of Education
January 10, 2013
17June 27, 2013
School Improvement Planning Requirements for Warned Schools
•The school uses the Eight Elements of High School Improvement: A Mapping Framework available at the National High School Center’s Web site to develop the school improvement plan. http://www.betterhighschools.org/pubs/documents/EightElementsMappingFramework.pdf
Virginia Department of Education

January 10, 2013
18June 27, 2013
School Improvement Planning Requirements for Warned Schools(Continued)
The improvement plan includes the following: Specific measures for achieving and documenting
student academic improvement Instructional practices designed to remediate
students who have not been successful on Standards of Learning tests
Intervention strategies designed to prevent further declines in student performance and graduation rates
Virginia Department of Education
January 10, 2013
19June 27, 2013
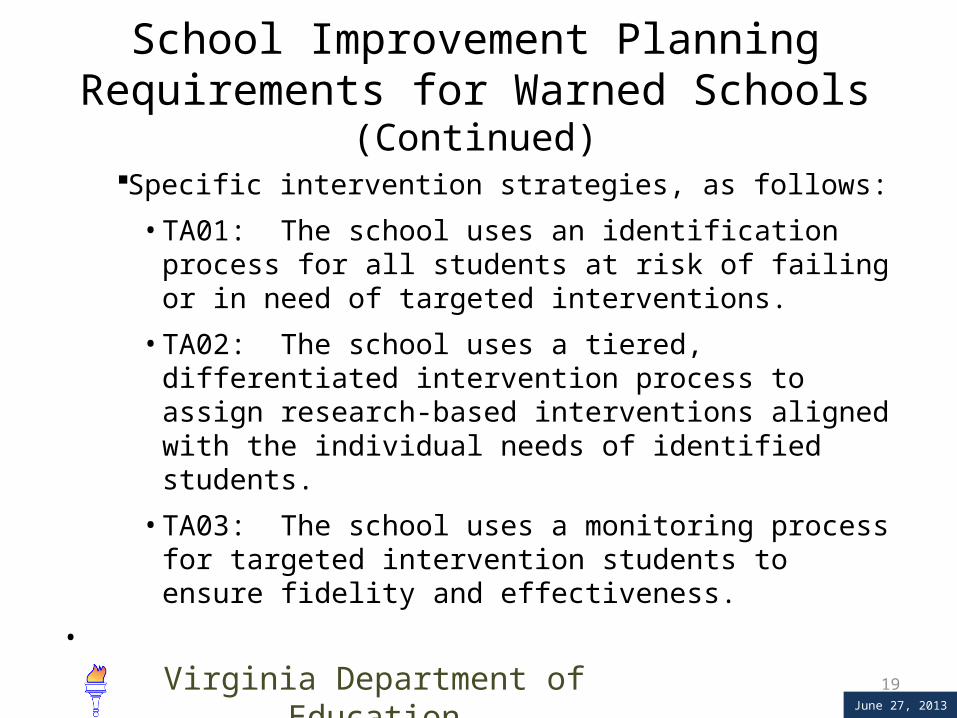
School Improvement PlanningRequirements for Warned Schools (Continued)
Specific intervention strategies, as follows:
• TA01: The school uses an identification process for all students at risk of failing or in need of targeted interventions.
• TA02: The school uses a tiered, differentiated intervention process to assign research-based interventions aligned with the individual needs of identified students.
• TA03: The school uses a monitoring process for targeted intervention students to ensure fidelity and effectiveness.
• Virginia Department of Education

January 10, 2013
VEWS – Risk Status Screenshot
20Virginia Department of Education
January 10, 2013
21
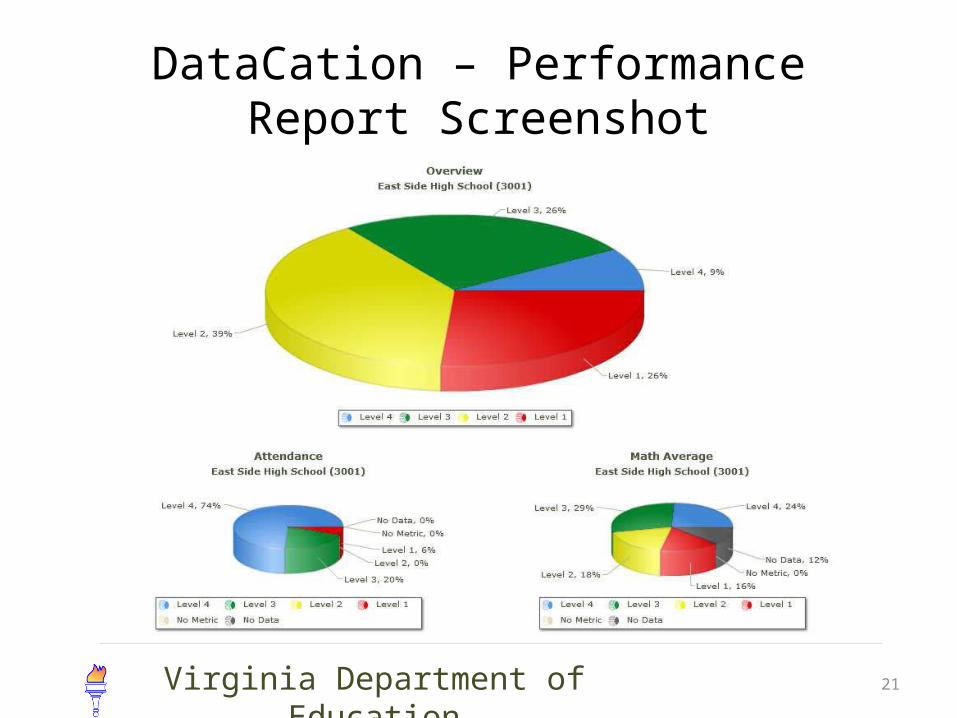
DataCation – Performance Report Screenshot
Virginia Department of Education
January 10, 2013
22June 27, 2013
Contact Information
• Dr. Kathleen Smith• Director, Office of School Improvement
• Virginia Department of Education
• (804) 786-5819• [email protected]
Virginia Department of Education