Embed Size (px)
Citation preview

JAMSTEC Chikyu Expedition 906
“The Kumano Mud-Volcano Drilling II” June 23 (Sasebo) to June 28 (Ugata), 2012
Preliminary Expedition Report
Fumio Inagaki, Yusuke Kuboand Expedition 906 Shipboard Scientists
JAMSTEC
1

Acknowledgements
Expedition 906 shipboard scientists thank all crews and MQJ drilling staffs of
the D/V Chikyu for the wonderful cruise and taking high-quality core samples from the Kumano mud-volcano no. 5 subsurface. Special thanks T. Saruhashi, an operational superintendent of Expedition 906, for successful sampling of
deep sticky mud and high-pressure core samples from the mud-volcano subsurface. We appreciate the technical staffs of MWJ Co. for their best service and support to our onboard scientific activities. We are grateful to Y. Mizuguchi
and J. Aumann for the development of new hybrid-pressure coring system customized for Chikyu, and also grateful to P. Schlutheiss, M. Holland and other personnel of GeoTek Ltd for their effort on the PCAT operation during Expedition
906. We thank M. Kunugiyama for taking a record film of Expedition 906. This cruise was supported in part by the Strategic Fund for Strengthening Leading-Edge Research and Development (to JAMSTEC, PI: F. Inagaki) and the
Funding Program for Next Generation World-Leading Researchers (NEXT Program, to F.I.) by the Japan Society for the Promotion of Science (JSPS) and the Ministry of Education, Culture, Sports, Science and Technology, Japan
(MEXT).
2

Expedition 906 Shipboard Scientists
Fumio Inagaki (Chief Scientist, Geomicrobiologist)Geomicrobiology Group,Kochi Institute for Core Sample Research, andGeobio-Engineering and Technology Group,Submarine Resource Research Project,Japan Agency for Marine-Earth Science and Technology (JAMSTEC),Monobe B200, Nankoku, Kochi 783-8502, JapanPhone: +81-88-878-2204Fax: +81-88-878-2192E-mail: [email protected]
Yu’suke Kubo (Expedition Project Manager/Staff Scientist)Center for Deep Earth Exploration (CDEX),Japan Agency for Marine-Earth Science and Technology (JAMSTEC),Showa-machi 3173-25, Kanazawa-ku, Yokohama 236-0001, Japan.Phone: +81-45-778-5648Fax: +81-45-778-5704E-mail: [email protected]
Rishi Ram Adhikari (Microbiologist)Institute of Earth and Environmental Sciences,University of Potsdam,Karl-Liebknecht-Str. 24, H. 27,14476 Potsdam, Germany.Phone: +49-331-977-5858Fax : +49-331-977-5700E-mail: [email protected]
Gail Lee Arnold (Inorganic Geochemist)Biogeochemistry Department,Max Planck Institute for Marine Microbiology,Celsius strasse 1,28359 Bremen, GermanyPhone: +049 421 2028646E-mail: [email protected]
David Case (Microbiologist)California Institute of Technology,MC131-24,1200E, California Blvd,Pasadena, CA91125, USAPhone: +1-608-443-8880Fax: +1-626-795-6208E-mail: [email protected]
Tomas Fesker (Geophysist)Department of Geosciences,University of BremenPO Box 330 440
3

28334 Bremen, Germany Phone: +49 421 218-6 53 48 Fax: +49 421 218-6 53 69 Email: [email protected]
Tatsuhiko Hoshino (Microbiologist) Geomicrobiology Group, Kochi Institute for Core Sample Research, and Geobio-Engineering and Technology Group, Submarine Resource Research Project, Monobe B200, Nankoku, Kochi 783-8502, Japan Phone: +81-88-878-2231 Fax: +81-88-878-2192 E-mail: [email protected]
Koichi Iijima (Sedimentologist)Exploration Research Promotion Group,Submarine Resources Research Project,Japan Agency for Marine-Earth Science and Technology (JAMSTEC),2-15 Natsushima-cho, Yokosuka 237-0061, Japan. Phone: +81-46-867-9843 E-mail: [email protected]
Akira Ijiri (Organic Geochemist)Geomicrobiology Group,Kochi Institute for Core Sample Research, andGeobio-Engineering and Technology Group,Submarine Resource Research Project,Japan Agency for Marine-Earth Science and Technology (JAMSTEC),Monobe B200, Nankoku, Kochi 783-8502, JapanPhone: +81-88-878-2199Fax: +81-88-878-2192E-mail: [email protected]
Yojiro Ikegawa (Physical Property Specialist)Central Research Institute of Electric Power Industry (CRIEPI),Civil Engineering Research Laboratory,Abiko 1646, Abiko, Chiba 270-1194, Japan.Phone: +81-70-6568-9620Fax: +81-4-7183-3182E-mail: [email protected]
Jens Kallmeyer (Microbiologist) Institute of Earth and Environmental Sciences,University of Potsdam,Haus 27, Zi. 0.34, Karl-Liebknecht-Str. 24,14476 Golm, Germany.Phone: +49-331 - 977-56 94Fax: 49-331 - 977-57 00E-mail: [email protected]
Hidenori Kumagai (Inorganic Geochemist) Subseafloor Dynamics, IFREEJapan Agency for Marine-Earth Science and Technology (JAMSTEC)
4

2-15 Natsushima-cho, Yokosuka 237-0061, Japan. Phone: +81-46-867-9333/9316 Fax: +81-46-867-9315 E-mail: [email protected]
Yuki Morono (Microbiologist)Geomicrobiology Group,Kochi Institute for Core Sample Research, andGeobio-Engineering and Technology Group,Submarine Resource Research Project,Japan Agency for Marine-Earth Science and Technology (JAMSTEC) Monobe B200, Nankoku, Kochi 783-8502, Japan Phone: +81-88-878-2198 Fax: +81-88-878-2192 E-mail: [email protected]
Yuki Nakamura (Sedimentologist)Atmosphere and Ocean Research Institute,The University of Tokyo,Kashiwanoha 5-1-5, Kashiwa, Chiba 277-0885, Japan.Phone: +81-4-7136-6146Fax: +81-4-7136-6148E-mail: [email protected]
Manabu Nishizawa (Inorganic Geochemist) Precambrian Ecosystem Laboratory, Japan Agency for Marine-Earth Science and Technology (JAMSTEC) 2-15 Natsushima-cho, Yokosuka, 237-0061 Japan. Tel: +81-46-867-9669 Fax: +81-46-867-9715 E-mail: [email protected]
Hans Røy (Inorganic Geochemist)Center for Geomicrobiology,Department of Biological Sciences,Ny Munkegade 114, Building 1540,8000 Aarhus C, Denmark.Phone: +45-2311-5884Fax: +45-8715-4326E-mail: [email protected]
Sanae Sakai (Microbiologist) Subsurface Geobiology Advanced Research (SUGAR) Project,Extremobiosphere Research Program, Institute of Biogeosciences,Japan Agency for Marine-Earth Science and Technology (JAMSTEC)2-15 Natsushima-cho, Yokosuka, 237-0061 Japan.Tel: +81-46-867-9695 Fax: +81-46-867-9715E-mail: [email protected]
Frauke Schmidt (Organic Geochemist)MARUM Center for Marine Environmental Sciences,University of Bremen,Leobener Str.,
5

D-28359 Bremen Phone: +49 421-218 65705 Fax: +49 421-218 65715 E-mail: [email protected]
Atsushi Tani (Organic Geochemist)Department of Earth and Space Science,Graduate School of Science,Osaka University,1-1 Machikaneyama, Toyonaka, Osaka 560-0043, Japan.Phone: +81-6-6850-5540Fax: +81-6-6850-5480E-mail: [email protected]
Wataru Tanikawa (Physical Property Specialist)Physical Property Research Group,Kochi Institute for Core Sample Research,Japan Agency for Marine-Earth Science and Technology (JMSTEC),Phone::+81-88-878-2203Fax:+81-88-878-2192E-mail: [email protected]
Takeshi Terada (Microbiologist/Lab and Technical Assistant)Marine Works Japan, Ltd.,Kamariyahigashi 2-16-32-5F, Yokohama, 236-0042, Japan.Phone: +81-88-878-2251Fax: +81-88-878-6287E-mail: [email protected]
Tomohiro Toki (Inorganic Geochemist) Department of Chemistry, Biology, and Marine ScienceFaculty of Science,University of the Ryukyus,1 Senbaru, Nishihara, Okinawa 903-0213, Japan. Phone: +81 (98) 895-8537 Fax: +81 (98) 895-8565 E-mail: [email protected]
Hitoshi Tomaru (Inorganic Geochemist) Department of Earth and Planetary Science,University of Tokyo7-3-1 Hongo, Bunkyo-ku, Tokyo 113-0033, Japan Tel: +81-3-5841-4033 Fax: +81-3-5841-4555 E-mail: [email protected]
Takayuki Tomiyama (KCC Curator) Kochi Institute for Core Sample Research,Japan Agency for Marine-Earth Science and Technology (JAMSTEC),Monobe B200, Nankoku, Kochi 783-8502 Japan.Phone: +81-88-878-2205Fax: +81-88-878-2192E-mail: [email protected]
6

Nan Xiao (KCC Bio-Curator) Kochi Institute for Core Sample Research,Japan Agency for Marine-Earth Science and Technology (JAMSTEC),Monobe B200, Nankoku, Kochi 783-8502 Japan.Phone: +81-88-878-2206Fax: +81-88-878-2192E-mail: [email protected]
1. General Background Submarine mud-volcanoes are globally distributed in plate convergent
margins (Milkov 2000; Kopf 2002). The mud-volcanism supplies hydrocarbon
gases and subsurface fluids from deep realm to the ocean surface, which therefore plays a significant role in the global fluid and element cycles (Etiope et al., 2009). The driving force and trigger of mud-volcano formation is generally
associated with tectonic activity of plate subduction zone. Generally, the fluid from deep source contains hydrocarbons, metal elements and other gaseous components as well as brecciated sediments. On the seafloor of mud-volcano,
cold seep-associated sediments harbor chemosynthetic life, including microbial communities that play significant ecological roles in biogeochemical cycle. For example, microbial activity that mediates anaerobic oxidation of methane
coupled with sulfate reduction in the Haakon Mosby mud-volcano was found to consume approximately 40% of emitting methane (Niemann et al., 2006). Despite such unique geological and geochemical structures of mud-volcano as a
“natural pipeline” that conveys very deep sedimentary matter to the surface ocean, the biogeochemical and microbiological nature of submarine mud-volcano subsurface has remained poorly understood.
The Nankai Trough off Kii Peninsula of Japan is one of the most geologically active plate subduction zones, where episodic gigantic earthquakes and tsunamis have historically occurred and resulted in serious disasters. Previous
efforts on deep-sea research in the Nankai Trough showed that at least 10 mud-volcano-like conical-shape mounds are present in the Kumano forearc basin. Pilot geological and geochemical surveys have demonstrated that the
Kumano mud-volcano no. 5 is one of the active mud-volcanoes in terms of the fluid and gas seepage, where the seep-associated chemosynthetic communities have been observed at near the summit.
During the Chikyu Training Expedition CK09-01 in 2009, we obtained
7

sediment core samples from the mud-volcano no. 5 to the depth of 20 meters below the seafloor (mbsf). Onboard observations using thermo-view IR camera and X-ray CT scan demonstrated that the cored sediment consisted mainly of
dehydrated mud matrices and consolidated breccias, in which dendritically networked vertical formation of methane hydrates was also observed. Using a fluorescent image-based cell count technique, a relatively small population of
bacterial and archaeal cells (~105 cells/cm3) was observed, from which intact and amplifiable genomic DNA was extracted for the molecular ecological analyses. Interestingly, analyses of the pore water chemistry and its isotopic
compositions showed the presence of extraordinary 13C-enriched bicarbonate in the sediment. This may be associated with metabolic activities of subseafloor microbial communities such as CO2-reducing methanogenesis and/or
acetogenesis. These preliminary microbiological and biogeochemical results suggest that the supply of nutrient and energy components through the mud-volcano subsurface harbors a unique habitat of subseafloor microbial
community that may play important roles in biogeochemical carbon cycle. One of the other significant scientific aspects relating to the submarine
mud-volcanoes in the Nankai Trough is the relationship between the formation
mechanism of deep-sourced fluids and gaseous components and the tectonics of accretionary wedge. Isotopic analysis of H2O in sediment cored from the mud-volcano no. 5 indicated that the fluid water is generated from the
smectite-illite dehydration, which process occurs in the temperature range between 60 ºC and 160 ºC. Based on the typical temperature gradient of the Kumano basin area, the depth range of possible dehydration process
corresponds to the bottom of basin sediment or the upper accretionary prism, approximately at 2,500 mbsf. On the other hand, the subsurface sediment of the Kumano mud-volcano contains unusually high concentrations of hydrogen and
carbon monoxide, which were found to be two or more orders of magnitude higher than those in the surrounding Kumano basin sediment. In addition, isotopic analysis of lithium (Li) indicates the potential source from the in-situ
temperature of over 300 ºC, close to the deep seismogenic fault zone. Taken these geochemical and microbiological characteristics together with the
geological setting of the Nankai Trough subduction zone, we can infer that the
8

mud-volcano in the Nankai Trough forearc basin is “the window to the deep seismogenic zone”, in which geochemical and biological characteristics and behaviors may be highly sensitive to the seismogenic fault activity. Hence, the
long-term monitoring of such subsurface geochemical and geophysical parameters of the submarine mud-volcano subsurface through the borehole may be a good strategy to find the way towards the better understanding of
earthquake and tsunami-related geological movements, including the stress and friction that may cause geochemical and geophysical anomalies.
To expand our knowledge of the submarine mud-volcano subsurface, we
planned to drill the previous site on the Kumano mud-volcano no. 5 down to 200 mbsf using a combined use of a hydraulic piston coring system (HPCS) and a newly developed hybrid-pressure coring system (Hybrid-PCS) on Chikyu during
the JAMSTEC Expedition 906. The shipboard scientific party of Expedition 906 is organized by multidisciplinary expertise including geophysics, sedimentology, physical property, geochemistry, microbiology and molecular microbiology.
Despite the relatively short duration of the cruise, some of the planned operations and analyses are the first attempt and hence challenge, opening a new window to the deep subseafloor biosphere and seismogenic zone.
ReferencesEtiope G, Feyzullayev A, Milkov AV, Waseda A, Sun CH. (2009) Evidence of
subsurface anaerobic biodegradation of hydrocarbons and potential secondary methanogenesis in terrestrial mud volcanoes. Mar. Petrol. Geol. In press. (doi:10.1016/j.marpetgeo.2008.12.002).
Kopf AJ. (2002) Significance of mud volcanism. Rev. Geophys. 40: 1005 (doi:10.1029/2000RG000093).Milkov AV. (2000) Worldwide distribution of submarine mud volcanoes and
associated gas hydrates. Mar. Geol. 167: 29-42.Niemann H, Lösekann T, de Beer D, Elvert M, Nadalig T, Knittel K, et al. (2006) Novel microbial communities of the Haakon Mosby mud volcano and their role
as a methane sink. Nature 443: 854-858.
2. Scientific Objectives
9

The main research objectives during Expedition 906 “The Kumano mud-volcano drilling II” are as follows:
1. To characterize in-situ geochemical and geophysical characteristics of solid, gas and fluid components in deep mud-volcano subsurface,
2. To explore the deep subseafloor biosphere within the mud-volcano and
evaluate the population, diversity and metabolic activity of microbial community and its physiological state and energetic habitability,
3. To evaluate the impact of subseafloor microbial activities in
biogeochemical cycles of the plate accretionary wedge, and 4. To understand the nature and amount of methane hydrates and
characterize the formation mechanism of the hydrocarbon reservoir in
the mud-volcano diapir.
To achieve these major scientific objectives, we drill at Site C9004 Hole A, the
same location that was previously drilled down to ~20 mbsf in 2009 during the Chikyu training cruise CK09-01, and we extend the coring depth down to ~200 mbsf. To explore the deep mud-volcano subsurface, keeping in-situ pressure is
critical for the analysis of methane hydrates and volatile gas components such as H2 and CO, which have not been accurately evaluated by the standard hydraulic piston coring system (HPCS) despite the tremendous scientific
significance. To address the issue for the deep mud-volcano subsurface environment, we newly developed a hybrid pressure coring system (Hybrid-PCS) that is available for the Chikyu and also compatible with the
GeoTek Pressure Core Analysis and Transfer System (PCATS). In addition, to estimate microbial activity of the deep subseafloor biosphere, we deployed a new container lab (ISOVAN) for the radioactive tracer experiments.
3. Location of Drilling Site The drilling site location during Expedition 906 is located on the southeastern
slope near the summit of Kumano mud-volcano no. 5. We drilled ~200 meters at Site C9004 Hole B, moved 10 meters west from Hole B, and drilled ~6.5 meters at Site C9004 Hole C.(See, Table 3.1, Figs. 3.1, 3.2 and 3.3).
10

Table 3.1. Expedition 906 Location Summary.
11

Fig. 3.1. Location map of the drilling site, the Kumano mud-volcano no. 5. off Kii
Peninsula of Japan.
12

Fig. 3.2. Mud-volcanoes in the Kumano forearc basin of the Nankai Trough.
Fig. 3.3. Location of Site C9004 Hole A, B, and C on the mud-volcano no. 5.
13

4. Drilling Operation
Fig. 4.1. Water depth and mud-line core summary for Site C9004 Hole B.
14

Table 4.1. Expedition 906 Core Recovery Summary
Site Hole CoringSystem
Total Advance (m)
Total Cored interval (m)
Total Initial Core Length1)
(m)
Total Curated Liner Length(m)
Total Corrected Core Length2)
(m)
Initial Recovery3)
(%)
Corrected Recovery4)
(%)
Water Depth
(mBSL) (mBRT)
C9004 B
HPCS - 34.8 42.39 46.72 40.04 121.8 115.0
1900.0 1928.5 ESCS - 9.5 1.27 1.27 1.27 13.4 13.4 HYB-EP - 7.0 0.25 0.40 0.23 3.6 3.3 HYB-ES - 8.0 0.20 0.00 0.00 2.5 0.0 Total 203.5 59.3 44.11 48.39 41.54 74.4 70.0
C HYB-ES 6.5 6.5 0.90 0.90 0.90 13.8 13.8 1905.0 1933.5
1) Measured by curatorial staff at Core Cutting Area (not same with the final curated length on J-CORES)2) Curated liner length - Void space and extraneous material (flow-in, cavings, fills, cuttings etc)3) Curated liner length / advance (final record on J-CORES)4) Corrected core length / advance
Fig. 4.2. Core recovery of Site C9004 Hole B.
15

B
906 C9004 C9004
Position Proposed Lat: Lon:
33°40.5486'N 136°34.0851'E
Coring Depth Management Sheet for Expedition 906 (CK12-03 Leg 1) Kumano #5 Knoll Drilling II
Water Depth : 1900.00 mMSL = 1928.50 mBRT Expedition: Elevation : 28.50 m Elevation=Length(Rotary Table Bottom of ship)-Draft Location Proposed:
Site: Coring System Code Hole :
H: HPCS: Hydraulic Piston Coring System T: EPCS: Extended Punch Coring System X: ESCS: Extended-Shoe Coring System P: HYB: Hybrid Pressure Core Sampler
1) Determined based on bit depth with taking HPS torque and WOB into account at the time in case of RCB, ESCS and EPCS. 2) For HPCS coring with incomplete shooting, determined by subtracting the remained length of telescope extension from 9.5 m or core recovery in case of noindication of over weight while pulling up the telescope. Shall be finally determined after checking if there is flow-in structure by the XCT image.3) Measured by curatorial staff at Core Cutting Area (not same as the final curated length on J-CORES)4) Initial Core Length / Advance5) Confirm with XCT image and/or split core, and calculate the length from XCT image on Composite Log Viewer of J-CORES6) Curated Core Length - Exraneous Material (flow-in, cavings, fills, cuttings, void space) Interval Length7) Corrected Core Length / Advance8) Curated Core Length / Advance (final record on J-CORES)9) Length of pull-up of drill string until taking over weight in case of partial penetration of HPCS
Position Actual Lat: Lon:
33°40.5486'N 136°34.0851'E
Cor
e
Type Coring Start Time
(JST) 1)
Coring Termination Time
(JST)
Core on Deck Time (JST)
Below Rotary Table (mBRT)
Below Seafloor (mbsf)
Advance2)
(m)
Initial Core
Length3)
(m)
Lithology @ shoe Initial
Recovery4)
(%)
Coring Time (min)
Average ROP
(m/hour)
Extraneous Material Intervals5)
(m) Curated Core
Length8)
(m)
Corrected Core
Length6)
(m)
Corrected Recovery7)
(%)
Overpull Indication Length9)
(m)
Remarks Top of Core
Btm of core9)
Top of Core
Btm of Core9)
Upper Portion (fills,
cavings)
Lower Portion (flow-in, cuttings)
Total Void Portion
1 H 2012.06.25 21:15 2012.06.25 21:15 2012.06.25 22:52 1923.00 1932.50 -5.50 4.00 9.50 9.68 Greenish mid-gray clay bearing granules
101.9 0 5.80 9.80 4.00 42.1 w/ APCT-3. Blew off from the top with carbonate/concretion pebbles and mud. Highly expanded.Greenish mid-gray pebbly clay. H2S detected. Mudline was determined after XCT scan.
2012.06.26 00:30 2012.06.26 00:57 1932.50 1943.00 4.00 14.50 10.50 27 23.3 Drill down
2 H 2012.06.26 02:07 2012.06.26 02:07 2012.06.26 02:58 1943.00 1950.70 14.50 22.20 7.70 7.72 Greenish mid-gray clay bearing granules
100.3 0 0.25 7.80 7.56 98.1 -
w/ APCT-3. Partial penetration, picked up w/ coreline. Blew off from the top with carbonate/conretion pebbles and mud. Greenish mid-gray Pebbly clay.
2012.06.26 03:28 2012.06.26 03:30 1950.70 1952.50 22.20 24.00 1.80 2 54.0 Drill down
3 P /T 2012.06.26 07:39 2012.06.26 07:41 2012.06.26 08:33 1952.50 1955.50 24.00 27.00 3.00 0.05 Mid-gray soupy mud w/ granules
1.7 2 90.0 0.10 0.15 0.05 1.7 Hybrid-PCS w/ EPCS-type shoe. Failed to keep in-situ pressure due to unproper function of check valve.
2012.06.26 08:55 2012.06.26 09:26 1955.50 1978.50 27.00 50.00 23.00 31 44.5 . Drill down w/ kelly down once
4 H 2012.06.26 10:59 2012.06.26 10:59 2012.06.26 11:45 1978.50 1987.50 50.00 59.00 9.00 9.75 light olive gray sandy clay w/ granules
108.3 0 0.34 9.74 9.40 104.4 0.5 w/ APCT-3. Partial penetration. Blew off from top and bottom. Highly expanded. Light olive gray to greenish mid-gray Pebbly clay.
2012.06.26 12:38 2012.06.26 12:39 1987.50 1988.00 59.00 59.50 0.50 1 30.0 Drill down
5 P /T 2012.06.26 22:15 2012.06.26 22:29 2012.06.26 23:00 1988.00 1992.00 59.50 63.50 4.00 0.20 Greenish mid-gray sandy clay w/ pebbles
5.0 14 17.1 0.17 0.40 0.23 5.8 Hybrid-PCS w/ EPCS-type shoe. Sample only at CC. Succeeded to keep almost in-situ pressure.
2012.06.27 00:11 2012.06.27 00:53 1992.00 2028.50 63.50 100.00 36.50 42 52.1 Drill down w/ ESCS, kelly down once
6 H 2012.06.27 03:22 2012.06.27 03:22 2012.06.27 03:59 2028.50 2034.00 100.00 105.50 5.50 6.10 Greenish mid-gray
sandy clay w/ granules
110.9 0 0.10 5.88 5.78 105.1 4.3
w/ APCT-3 . Partial penetration. Extruded from the top about 2.4 m long. Blew out from the bottom. Highly expanded. A piece of hydrate at near bottom. APCT-3 measurement failed due to water leak.
2012.06.27 04:16 2012.06.27 04:20 2034.00 2038.00 105.50 109.50 4.00 4 60.0 Drill down w/ ESCS
7 P /X 2012.06.27 11:41 2012.06.27 11:46 2012.06.27 12:34 2038.00 2042.00 109.50 113.50 4.00 0.20 Greenish mid-gray
sandy clay w/ granules
5.0 5 48.0 0.20 0.20 5.0
Hybrid-PCS w/ ESCS-type shoe. Roughly 0.05 m recovery in CC. Based on PCAT data, about 0.2 m core is recovered though in-situ pressure is not preserved. This recovery data is based on first observation for X-CT data from PCAT. Actual samaple might be slurred mud.
8 H 2012.06.27 14:14 2012.06.27 14:14 2012.06.27 15:07 2042.00 2050.60 113.50 122.10 8.60 9.14 Greenish mid-gray
sandy clay w/ granules
106.3 0 0.20 13.50 13.30 154.7 0.9 w/ APCT-3. Retrial for APCT-3. Pebbly mud.
2012.06.07 16:45 2012.06.27 18:00 2050.60 2118.50 122.10 190.00 67.90 28875 0.1 Drill down w/ ESCS
9 P /X 2012.06.27 22:23 2012.06.27 22:29 2012.06.28 23:41 2118.50 2122.50 190.00 194.00 4.00 0.00 empty 0.0 6 40.0 0.00 0.00 0.0 Hybrid-PCS w/ ESCS-type shoe. Suceeded to keep in-situ pressure, but no recovery.
10 X 2012.06.28 01:15 2012.06.28 01:20 2012.06.28 03:04 2122.50 2132.00 194.00 203.50 9.50 1.27 Dark greenish gray mudstone breccia
13.4 5 114.0 1.27 1.27 13.4 CC plugged. Alternation of mudstone breccia and pebbly mud.
Number of Coring: 10 Total Initial Core Length (m): 44.11 Total Corrected Core Length (m): 41.79 Total Cored Advance (m): 64.80 Average Initial Recovery (%): 68.07 Average Corrected Recovery (%): 64.5
16

Coring Depth Management Sheet for Expedition 906 (CK12-03 Leg 1) Kumano #5 Knoll Drilling II
Water Depth : 1905.00 mMSL = 1933.50 mBRT Expedition: Elevation : 28.50 m Elevation=Length(Rotary Table Bottom of ship)-Draft Location Proposed:
Site: Coring System Code Hole :
H: HPCS: Hydraulic Piston Coring System T: EPCS: Extended Punch Coring System X: ESCS: Extended-Shoe Coring System P: HYB: Hybrid Pressure Core Sampler
1) Determined based on bit depth with taking HPS torque and WOB into account at the time in case of RCB, ESCS and EPCS. 2) For HPCS coring with incomplete shooting, determined by subtracting the remained length of telescope extension from 9.5 m or core recovery in case of noindication of over weight while pulling up the telescope. Shall be finally determined after checking if there is flow-in structure by the XCT image.3) Measured by curatorial staff at Core Cutting Area (not same as the final curated length on J-CORES)4) Initial Core Length / Advance5) Confirm with XCT image and/or split core, and calculate the length from XCT image on Composite Log Viewer of J-CORES6) Curated Core Length - Exraneous Material (flow-in, cavings, fills, cuttings, void space) Interval Length7) Corrected Core Length / Advance8) Curated Core Length / Advance (final record on J-CORES)9) Length of pull-up of drill string until taking over weight in case of partial penetration of HPCS
906 C9004 C9004
C
Position Proposed Lat: Lon:
33°40.5486'N 136°34.0851'E
Position Actual Lat: Lon:
33°40.5486'N 136°34.0786'E
Cor
e
Type Coring Start Time
(JST) 1)
Coring Termination Time
(JST)
Core on Deck Time (JST)
Below Rotary Table (mBRT)
Below Seafloor (mbsf)
Advance2)
(m)
Initial Core
Length3)
(m)
Lithology @ shoe Initial
Recovery4)
(%)
Coring Time (min)
Average ROP
(m/hour)
Extraneous Material Intervals5)
(m) Curated Core
Length8)
(m)
Corrected Core
Length6)
(m)
Corrected Recovery7)
(%)
Overpull Indication Length9)
(m)
Remarks Top of Core
Btm of core9)
Top of Core
Btm of Core9)
Upper Portion
(fills, cavings)
Lower Portion (flow-in, cuttings)
Total Void Portion
1 P /X 2012.06.28 08:47 2012.06.28 08:56 2012.06.28 09:27 1933.50 1940.00 0.00 6.50 6.50 0.90 13.8 9 43.3 0.90 0.90 13.8 Hybrid-PCS w/ ESCS-type shoe. Succeeded to keep the set pressure (3265psi). Recovered an intact cylindrical core. Rich in vein-like feature (hydrate?).
Number of Coring: 1 Total Initial Core Length (m): 0.90 Total Corrected Core Length (m): 0.90 Total Cored Advance (m): 6.50 Average Initial Recovery (%): 13.85 Average Corrected Recovery (%): 13.8
17

5. Core Flow 5.1. Hydraulic Piston Coring System (HPCS) Sampling
18

5.2. Hybrid-Pressure Coring System (Hybrid-PCS)
6. Preliminary Onboard Results
19

6.1. Sediment temperature, thermal conductivity and gas hydrate stability reported by Tomas Feseker and Yojiro Ikegawa
6.1.1. Background The physical parameters that limit the occurrence of gas hydrates in the
sub-seafloor are pressure and temperature. The drill site at the Kumano
mud-volcano no. 5 is located at around 1900 m water depth, hence the pressure at the seabed is around 19.227 MPa at standard atmospheric pressure (101 325 Pa). According to an equation proposed by Tishchenko et al. (2005), pure
methane hydrates are stable at this depth at temperatures below 17.46 °C, assuming a salinity of 20 PSU. The thickness of the gas hydrate stability zone (GHSZ) below the seabed depends on the sediment temperature profile. The
temperature at the seabed is estimated at around 2 °C. Based on long-term temperature observations at shallow sediment depths, Hamamoto et al. (2011) reported sediment temperature gradients of 0.0444 ± 0.0011 °C/m and 0.0876 ±
0.0009 °C/m at around 2080 m water depth approximately 7.4 km east and 8.7 km south of the drill site, respectively. If the sediment temperature gradient were in the same range, the base of the GHSZ would be expected at depths of
between 162 and 482 m below the sea floor (Fig. 6.1.1). A seismic line across the mud-volcano no. 5 shows a bottom simulating reflector (BSR) around 411 to 463 meters below the seafloor (mbsf) in the immediate vicinity, which suggests a
regional background temperature gradient of between 0.0383 and 0.0426 °C/m (Fig. 6.1.2). Depending on the activity of the mud volcano, however, it may be expected that the upward advection of fluids and mud lead to a local increase in
temperature gradient around the mud volcano, which would reduce the thickness of the GHSZ: e.g., if the strong seismic reflector at between 191 and 215 mbsf within the mud volcano marked the base of the GHSZ (Fig. 6.1.2), the
sediment temperature gradient would have to be between 0.0766 and 0.0857 °C/m or approximately twice the background value. Consequently, precise in situ temperature measurements are of crucial importance in
determining the section of the sediment column, in which gas hydrates may occur.
The heat flux through the sediment is defined as the product of temperature
20

gradient and thermal conductivity. The latter depends on the composition of the bulk sediment, and in particular on its porosity. In case the heat flux is constant and there is no advection of fluids, the thermal conductivity of a given interval
controls the temperature gradient. On the other hand, advection of fluids within the pore space or mass movement of the bulk sediment may also affect the temperature gradient and result in curved temperature profiles. In contrast to any
movements, the thermal conductivity of the sediment can be measured in the laboratory, which provides useful constraints for the interpretation of non-linear sediment temperature profiles.
6.1.2 Methods During Expedition 906, in situ temperature measurements were conducted
using the APCT-3 tool (Heesemann et al., 2006). Attached to the tip of the Hydraulic Piston Coring System (HPCS), the APCT-3 will record temperature readings at a sampling interval of 1 s during the each deployment of the HPCS.
Measurements were obtained by stopping the drill bit above the seabed (mudline) and at selected depths for around 10 minutes. The equilibrium sediment temperatures were calculated by extrapolation from the time series
recorded during the measurements (Villinger and Davis, 1987). The depths of the measurements were estimated from the depth of the drill bit and the core recovery. The thermal conductivity of the sediment was measured using needle
probes on the whole round cores after equilibration with room temperature. The dissociation temperature of pure methane hydrates was calculated
according to Tishchenko et al. (2005), assuming a salinity of 20 PSU and
standard atmospheric pressure (101325 Pa). The conversion between depth and pressure followed Saunders (1981).
6.1.3. Preliminary results (1) Temperature at the seabed
In the course of the first deployment of the HPCS (C9004-B-1), the corer was
stopped a few meters above the seabed in order to measure the bottom water temperature above the drill site prior to penetration (Fig. 6.1.3). After the pumps had been stopped, the temperature readings dropped by around 0.1 °C. A
21

corresponding temperature increase at the end of the measurement indicated that the pumps had been switched back on. The bottom water temperature of approximately 1.88 °C was determined as the mean value of the readings in
between these to events. The cause of the relatively large fluctuations of the temperature readings around the mean is unclear.
(2) In situ sediment temperature and gas hydrate stability Using the APCT-3 tool, in situ sediment temperature measurements were
conducted at approximately 4, 22, 59, and 121 mbsf. The quality of the raw data
was generally good. For each measurement, a time window of several minutes could be extracted from the recorded time series for extrapolation of the equilibrium temperatures (Fig. 6.1.4). The corresponding sediment temperature
profile (Fig. 6.1.5) is curved convex upward in the upper part and becomes linear towards the bottom with a gradient of around 0.029 °C/m. Pure methane hydrates are stable throughout the profile. Assuming that the profile remains
linear at greater depths, the estimated depth of the lower limit of the GHSZ is expected at around 590 mbsf.
(3) Thermal conductivity The quality of thermal conductivity measurements depends on the availability
of intact sediment samples. Cracks or gas bubbles in the sediment and large
voids within sections of the cores prevent reliable measurements. Therefore, measurements were conducted only on apparently intact intervals of the sediment cores. The data suggest a trend from just below 1 W/(°C m) near the
seabed to around 1.2 W/(°C m) at 120 mbsf (Fig. 6.1.6).
6.1.4 Summary and onboard conclusions In situ sediment temperature measurements and thermal conductivity
measurements of intact core sections where conducted in order to determine the thermal regime of the Kumano mud-volcano no. 5 and to determine the extent of
the GHSZ. The sediment temperature profile is curved convex upward above around 60 mbsf and linear with a gradient of around 0.029 °C/m. The measured values of sediment thermal conductivity suggest a slight increase with depth, but
22

the trend is insufficient to explain the curvature in the upper part of the temperature profile. Assuming that the profile reflects steady-state conditions, the curvature could indicate upward advection of pore fluids in the order of 0.1 to
0.3 m/year. It is unclear however, why the temperature gradient at depth appears to be lower than in the surrounding seafloor.
The pressure and temperature conditions permit the formation of gas hydrates
throughout the entire length of the profile and down to a depth of around 590 mbsf. Considering that the mud volcano is elevated around 100 m above the surrounding seabed, this depth matches the estimated depth of the regional
BSR. The strong seismic reflectors observed within the mud volcano cannot be related to gas hydrate stability. Visual inspection of CT images of the sediment core recovered from around 190 m (C9004B-10X) suggests that the impedance
contrast may be related to a layer containing large and massive clasts.
6.1.5. References Hamamoto, H., M. Yamano, S. Goto, M. Kinoshita, K. Fujino, and Wang, K.
(2011), Heat flow distribution and thermal structure of the Nankai subduction zone off the Kii Peninsula, Geochem. Geophys. Geosyst., 12, Q0AD20,
doi:10.1029/2011GC003623. Heesemann, M., Villinger, H., Fisher, A.T., Tréhu, A.M., and White, S. (2006),
Data report: testing and deployment of the new APCT-3 tool to determine in
situ temperatures while piston coring, In Riedel, M., Collett, T.S., Malone, M.J., and the Expedition 311 Scientists. Proc. IODP, 311: Washington, DC (Integrated Ocean Drilling Program Management International, Inc.).
doi:10.2204/iodp.proc.311.108.2006. Saunders P. M., (1981). Practical conversion of pressure to depth. J. Phys.
Oceanogr. 11, 573-574.
Tishchenko, P., Hensen, C., Wallmann, K., and Wong, C. S. (2005), Calculation of the stability and solubility of methane hydrate in seawater, Chemical
Geology, 219, 37-52.
Villinger, H., and Davis, E. E. (1987), A New Reduction Algorithm for Marine Heat Flow Measurements, J. Geophys. Res., 92, 12 846-12 856.
23

Fig. 6.1.1. Estimated thickness of the gas hydrate stability zone (GHSZ) for pure
methane hydrates at the drill site on Kumano mud-volcano no. 5 (1900 m water depth, 2 °C bottom water temperature, salinity 20 PSU, sulfate-free porewater).
24

Fig. 6.1.2. A SE-NW seismic line across the Kumano mud-volcano no. 5. shows
a bottom simulating reflector (BSR) at around 411 to 463 m below the sea floor in the immediate vicinity of the mud volcano. Within the mud volcano, another strong reflector is located at around 191 to 215 m below the sea floor. Time to
depth conversion for is based on p-wave-velocities of 1500 m/s in the water column, and 1600 to 1800 m/s in the sediment. (Seismic data courtesy of J. Ashi, University of Tokyo, Japan)
25

Fig. 6.1.3. Temperature measurement in the bottom water of the drill site using the APCT-3 tool. The bottom water temperature of around 1.88 °C was
determined as the mean of the values recorded after the pumps of the corer had been switched off and the temperature had dropped by around 0.1 °C and before the temperature increase the indicated that the pumps had been switched
on again. After the measurement, the Hydraulic Piston Coring System (HPCS) was shot into the sediment to obtain the mudline core.
26

Fig. 6.1.4. In situ sediment temperature measurements using the APCT-3 tool at approximately 4, 22, 59, and 121 mbsf. The dashed lines mark the limits of the time windows that were used to extrapolate the equilibrium temperatures, which
are indicated by the horizontal red lines.
27

Fig. 6.1.5. The sediment temperature profile at the Kumano mud-volcano no. 5 is curved convex upward in the upper part and becomes linear at depth, indicating a temperature gradient of around 0.029 °C per m.
28
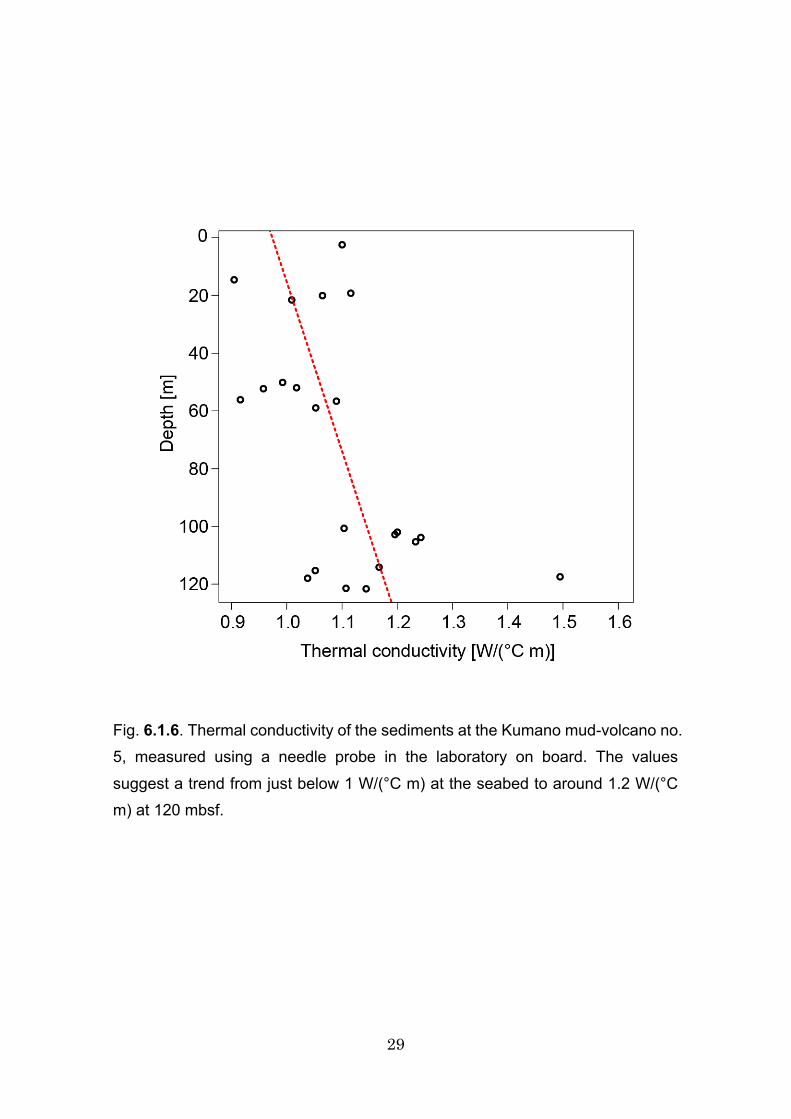
Fig. 6.1.6. Thermal conductivity of the sediments at the Kumano mud-volcano no. 5, measured using a needle probe in the laboratory on board. The values
suggest a trend from just below 1 W/(°C m) at the seabed to around 1.2 W/(°C m) at 120 mbsf.
29

6.2. Sedimentology reported by Koichi Iijima and Yuki Nakamura
6.2.1 Visual Core Description Visual Core Description (VCD) was carried out using archive half section after
image scanning (MSCL-I) of the core was finished. Both in MSCL-I and VCD, the
surface of the cores was not scraped due to difficulty to clear the small undulation arise from heavy disturbance or scattering/intercalating firm mudstone clasts.
In the VCD, lithology (e.g. grain size, distribution, thickness, and characteristics), sedimentary structure, color (using munsell color chart), and drilling disturbances or cracks were recorded on description sheet. After that, all
VCD information was input to J-CORES database through “J-CORES Visual
Core Description” application.
6.2.2. Summary of lithology of Hole C9004B Major lithology of Site C9004 Hole B is clay or silty clay, containing various
size (granular to cobble) of mudstone clasts. Summary of each cores are as
follows:
Core 1H (Fig. 6.2.1): Homogenous gray clay and silty clay. The core is heavily
disturbed and 1-3 mm size bubbles are scattered throughout the core. Sections 1-4 were almost empty but the wall inside the inner tube is totally covered by muddy sediments. These sediments might be
derived from lower section due to expansion during HPCS recovery. Core 2H (Fig. 6.2.2): Homogenous gray silty clay containing mudstone clasts.
The core is disturbed and 1-3 mm size bubbles are scattered
throughout the core. There are some voids caused by gas expansion. Core 4H (Fig. 6.2.3): Homogenous gray clay to silty clay. The core is disturbed
and 1-3 mm size bubbles are scattered throughout the core.
Core 6H (Fig. 6.2.4): Homogenous gray silty clay. Sections 1-3 of this core was popped off on drill floor due to gas expansion and the parts were retrieved into core liner. So the voids and cracks in these sections were
30

artificially made. Core 8H (Fig. 6.2.5): Homogeneous gray clay, but pebble size mudstone clast is
abundant rather than shallower cores. The core is heavily disturbed but
mm size bubbles are not recognized. Core 10X (Fig. 6.2.6): Homogenous gray mudstone or brecciated mudstone.
The core is heavily disturbed. Upward grading observed in section 1
might be developed while Extended Shoe Coring System (ESCS) drilling.
6.2.3 Smear-slide method Some smear-slides were made (at least one per core) and observed using
polarized microscope to recognize components and texture of the sediments for
determination of the lithological name. Typical views of the smear-slide in Core 1H are shown in Figs. 6.2.7 and 6.2.8.
31

32

.
Fig. 6.2.1. Summary of VCD for Core 1H
33

Fig. 6.2.2. Summary of VCD for Core 2H.
34

Fig. 6.2.3. Summary of VCD for Core 4H.
35

Fig. 6.2.4 Summary of VCD for Core 6H.
36

.
Fig. 6.2.5. Summary of VCD for Core 8H
37

Fig. 6.2.6 Summary of VCD for Core 10X.
x200 open nicol
x200 cross nicol
Fig. 6.2.7. Smear-slide photo image of hole C9004B, Core 1H-1, interval 75cm. Nannofossils and small (less than 1 micrometer) carbonate grains are common through the hole.
38

x200 open nicol
x200 cross nicol
Fig. 6.2.8. Smear-slide photo of hole C9004B, Core 1H-1, interval 75cm.
Authigenic dolomite grains are contained.
39

6.3. Syringe and Whole Round Core (WRC) Sampling reported by Tatsuhiko Hoshino, Rhishi Ram Adhikari, David Case, Yuki Morono,
Hans Røy, Sakai Sanae, Takeshi Terada, Hitoshi Tomaru, Takayuki Tomiyama,
and Nan Xiao
6.3.1. Sampling Procedures (1) Syringe sampling
All syringe sampling was done in the core cutting area immediately after core arrival. Generally the syringe samples were taken from section tops at a
frequency of 1 sample/section. The exception was the JKHS code sample, which was taken from section bottoms at a frequency of 1 sample/core. The sampling flow is shown in Fig. 6.3.1. Specific sampling positions and other
details are described in Appendix 1, including deviations from the top/bottom sampling plan described above.
ATHS: 3ml of the sediment was extracted by 2.5 ml syringes, put in plastic bag and stored at 4 ˚C.
DCHS1: 3ml of the sediment was extracted by 3 ml syringes, ejected into vials
with 2 mL NaOH, crimped and stored at room temperature (RT).DCHS1: 5ml of the sediment was extracted by 5 ml syringes, ejected into vials
with 5 mL NaOH, crimped and stored at RT.
AIHS1: 3 ml of the sediment was extracted by 2.5 ml syringes. Only the top of 2.5 ml sediment was ejected into glass bottle with NaCl to remove contamination from the surface of sediment. The samples were stored at
RT. AIHS2: 3 ml of the sediment was extracted by 2.5 ml syringes. After 0.5 ml of
sediment was removed, the syringes were plugged with rubber plug to
avoid exposure of oxygen. The samples were stored at RT. YMHS: ~10 ml of the sediment was extracted by using 10 ml syringe. Only first 5
ml of the sediment was ejected to avoid contamination from the surface
of sediment into 25 ml of 4% PFA in 50 ml Falcon tubes. In the microbiology lab, the samples were mixed until the sediment was completely suspended. The suspension was stored at 4 ˚C at least 6
40

hours for fixation. After the fixation, the sediment was centrifuged at 5,000 x g for 15 min and the supernatant was removed. The fixed sediment was washed with 1 x PBS twice, re-suspended in 25 ml of 50%
ethanol/PBS, and stored at -20 ˚C. The resulting 30mL suspension was then split, 10 mL remaining in 50% ethanol/PBS and the remaining 20 mL re-suspended in 100% ethanol.
JKHS: 20 ml of the sediment was extracted and the top of syringes was sealed by parafilm. Subsequently, the syringes were put into plastic bags, flushed with nitrogen, sealed, and stored at 4 ˚C.
(2) WRC sampling The standard procedure (see, Table 6.3.1) of WRC sampling in this expedition
was: 1) cut WRC: 2) place it in impermeable plastic bag: 3) flush with nitrogen gas: 4) vacuum seal: 5) store at 4˚C or -80˚C.
For IW WRCs, the vacuum seal was omitted. Before each cutting, the scraper
was washed in Milli-Q water and wiped to avoid crossover contamination between samples. 70% ethanol was used to clean the scraper for microbiological samples whereas it was never used for IW samples because it
might have interfered with downstream analyses. The exceptions other than written above were described below. Sampling
reports for all cores are shown in Appendix 1.
FSWR: WRC was vertically cut into 2 sections before nitrogen flush and vacuum seal.
YMWR1: 50-cm WRC was cut into 5 of 10 cm sections before nitrogen flush and vacuum seal.
THWR: WRC was put into aluminum bag and stored at -80 ˚C.
NXWR: WRC was stored at -80 ˚C.
41

Table 6.3.1. Sampling procedure for whole round core.
Fig. 6.3.1. Procedure for syringe sampling on the core cutting area.
42

6.4. Direct measurements of turnover rates reported by Jens Kallmeyer and Rishi Ram Adhikari
6.4.1. Sample processing For sulfate reduction rate measurements samples were taken from a single 10
cm WRC from each HPCS core. Glass barrels equipped with a plunger from a 5 cc disposable syringe were used to retrieve small sub-cores with an intact sedimentary structure. Due to massive degassing of the cores and the resulting
voids, the sedimentary structure was not fully intact. Also mud clasts and presumably carbonate concretions made sampling of intact sedimentary structures rather difficult.
From each WRC a total of 10 sub-cores with a volume of about 4 cc were taken. Each sample was incubated with 15 µl of Na2
35SO4 solution, activity ca. 1.85 MBq. The samples were split as follows:
Sample 1-3: Just with radiotracer, incubated at atmospheric pressure Sample 4-6: with an additional injection of 20 µl of 0.1 M Na-acetate, incubated
at atmospheric pressure Sample 7-9: incubated at ca. 20 MPa pressure, with a syringe containing 3 ml of Methane
Sample 10: Time Zero blank, fixed about 10 minutes after injection of radiotracer.
Samples 1-9 were incubated for 24 hours at 4° C in the dark. Incubation was stopped by transferring the sediment into 20 ml of 20% (w/v) Zinc acetate solution, followed by immediate freezing to stop all microbial activity and to
precipitate all hydrogen sulfide. After freezing for about 12 hours the samples were thawed and will be transported to the home laboratory for analysis.
Due to legal issues the planned Tritium-Hydrogenase assay could not be
performed on board. Samples were preserved both at +4°C and at -20°C for later analysis in the home laboratory.
43

6.5. Interstitial water sampling and shipboard analyses reported by Hitoshi Tomaru, Hnas Røy, Gail Arnold,
Manabu Nishizawa, Frauke Schmidt, Atsushi Tani
6.5.1. Introduction Structure and material within the mud volcano system has been supported by
interstitial water transport. Source and migration history of interstitial waters are essential for describing how the mud volcano has been developed and
contributed to the mass transport from the deep to the shallow interval in mud volcano. Furthermore, interstitial water is a medium for microbial activities and hence geochemical properties are important factor to constrain the activities in
the unique locally active geological setting. Inorganic/organic geochemical analyses proposed for Expedition 906 provide key date sets that disclose the nature of mud-volcano system.
6.5.2. Whole round core sampling The interstitial water samples for general shipboard analyses were obtained
generally from ~30 cm long whole round cores (WRCs) from the bottom of all sections. These whole round samples taken to the laboratory for immediate X-ray CT (X-CT) scanning and sectioned and sealed in a nitrogen-filled plastic
bag in the sampling room, and stored in a 4 ºC refrigerator until squeezing. After extraction from the core liner, the surface of each WRC was carefully
scraped to avoid sediments that had potentially been contaminated from
seawater, drilling fluid, oxidation, and smearing in the borehole. The clean inner parts of the core were then placed into a Manheim-type titanium squeezer and squeezed with a laboratory hydraulic press at the gauge pressures up to 25,000
lbs. Interstitial water was passed through a filter paper fitted on a stainless steel screens at the bottom of the squeezer. Fluids from the squeezing process passed through a 0.45 µM disposable filter into an acid-washed 25 mL plastic
syringe. Interstitial water was sub-sampled for standard shipboard analyses (salinity, alkalinity, pmH, concentrations of Br, SO4, PO4, NH4, and Cl). Subsamples were collected also for shore-based multi-elemental/isotopic
44

analyses on the requests by scientists and were stored in glass or plastic vials prepared by each scientist. In addition, individual WRCs were collected for specific analyses that require greater volume of interstitial water (i.e., sample
code: 906FSIW, 906GAIW, and 906HTIW2). These samples were also obtained following the IW sampling method described above. Detailed sub-sampling plan is described in Appendix 2.
6.5.3. interstitial water analysis Interstitial water samples were routinely analyzed for salinity as total
dissolved solutes with ~100 µL subsample using RX-5000a refractometer (Atago) and for pmH and alkalinity with 3 mL subsample by Gran titration using a Metrohm autotitrator immediately after interstitial water was extracted. The
chloride concentration was measured on a 100 µL subsample by titration using silver nitrate in a 0.2 M sodium nitrate solution with the relative standard deviation of 0.5%. Sulfate and bromide concentrations were measured by
ICS-1500 ion chromatography (Dionex) using subsamples that were diluted by 1:100 with 18 MΩ Millipore water. The relative standard deviations were 1.1% and 0.4%, respectively. Dissolved phosphate concentration was measured by
colorimetric methods with the aid of an UV-2550 UV-Visible spectrophotometer (Shimadzu) at the absorbance of 885 nm with a reproductively better than 1.87%. Because the phosphate concentrations vary, appropriate aliquot of sample or
standard solution (100 µL or 300 µL) was diluted to the required volume for the analysis with 18 MΩ Millipore water in a plastic tube. The mixed solution (ammonium molybdate, sulfuric acid, ascorbic acid, and potassium antimonyl
tartrate) was added in the tube and was well mixed, the tube was capped and kept at room temperature to develop color. Dissolved ammonium concentration was also determined with UV-2550 UV-Visible spectrophotometer at the
absorbance of 640 nm with a reproductively better than 1.4%. A 0.1 mL of sample aliquot was diluted with 18 MΩ Millipore water, phenol ethanol, sodium nitroprusside, and sodium hypochlorite solutions in the capped plastic tube, and
was kept in the dark at room temperature for more than 3 hours to develop colors.
45

6.5.4. Results Figure 6.5.1 shows a summary of shipboard geochemical analyses of
interstitial waters. All the profiles generally show constant downward trend, and
relatively low concentrations compared with general values in the interstitial waters collected from the Nankai Trough area (e.g. IODP NanTroSEIZE expeditions). In addition, contribution of seawater in the samples near the
seafloor is negligible because concentrations in the interstitial waters are distinctly low compared to the seawater for Cl, NH4, Br, and SO4. Contrary to these results, interstitial water value is high for alkalinity resulting from input of
allochthonous fluids from the depth reaches the seafloor. A sample at ~50 mbsf (4H-1) showed values somewhat close to the seawater,
indicating seawater (drilling fluid) contamination during core retrieval.
Contamination of this section was also confirmed by microscopic analysis of the sediment, revealing small pieces of “carpet” material, likely introduced during core recovery.
Gas hydrates are potentially contained in Sections 6H-4 and 8H-5 (indicated by blue line in Fig. 6.5.1) because low temperature anomalies were observed by infrared camera on the core cutting area. Concentrations of dissolved ions are,
however, slightly lower than the adjoining samples, amount of gas hydrates are likely small: e.g. section contained very thin layered or small flake-like gas hydrate.
6.5.5. Shore-based research plans Akira Ijiri: 906AIIW1-3
Dissolved inorganic carbon (DIC), methane & ethane concentration in interstitial waters, d18O, and d13C acetate will be measured to characterize and quantify microbial activities associated with methanogenic processes
in deep sediments.
Tomohiro Toki: 906TTIW B and Li isotopes and concentrations of Na, Ca, K, Mg, Sr, Ba, B, Li, Si, and REE will be measured to examine influence of deep-sourced fluid B and Li that are temperature sensitive elements.
46

Frauke Schmidt: 906FSIW Dissolved organic matter (DOM) concentration will be measured to
investigate the sources, preservation potential and susceptibility to remineralisation by microbial turnover.
Atsushi Tani: 906ATIW Alcohols, aldehydes, and possibly amines in sediment, pore water, and methane hydrate will be measured to reveal distribution of C1 and C2
compounds in deep-sea environment sediment.
Gail Arnold: 906GAIW & 906GAIWS Concentration and isotopic composition of dissolved and solid sulfur species as well as Fe-speciation in the solid phase fraction and the d18Owater will be measured to assess the pathways of sulfur cycling (sulfate
reduction and sulfide/sulfur oxidative processes) in a mud volcano matrix, either at a macro-scale - where sulfate concentrations exceed 1mM, or at a “cryptic scale” – where sulfate concentrations are between 0.1 and 1.0 mM.
Hans Røy: 906HRIW1-3 Fe(II), sulfide, and sulfate concentrations will be measured to constrain the
potential substrates for microbial energy metabolisem within the mud volcano and to quantify as many pools of reactive iron and sulfur species as possible and build a mass balance to detect changes within these pools
as function of depth below seafloor.
Hans Røy: 906IWS Fe(II) and Fe(III)-compounds in the solid phase will be measured to separate and quantify the pools of FeS, FeS2, FeOOH. A similar, though less detailed, speciation balance will be calculated for Mn species.
Manabu Nishizawa: 906NMIW Compositional and isotopic distribution of inorganic nitrogen compounds
47

(N2, N2O, NH4+, NO2
-, NO3-) will be measured to understand nitrogen
(bio)geodynamics in deep sediments thorough IW and gas samples.
Hitoshi Tomaru: 906HTIW1-2 Concentration and isotopic composition of long-lived radio isotope (129I) of dissolved iodine will be measured to determine the age of source organic
matter for methane, representing potentially the relative age of fluid that transport within the mud volcano system.
48

Figure 6.5.1. Depth profile of shipboard geochemical analyses of interstitial waters collected from Site C9004 Hole B.
49

6.6. Head space gas analysis reported by Akira Ijiri and Tomohiro Toki
Head space H2
A 2.5 cm3 of sediment was sub-sampled by cut-off plastic syringe. The syringe was immediately capped by silicone rubber stopper and brought to laboratory. The syringe-containing sample was extruded into 5 mL of glass vial in which 1
mL of saturated sodium chloride solution in distilled, deionized water (DDW) had been supplemented to make slurry. After the vial capped with a Teflon-coated butyl rubber stopper, the vial was shaken and stored for 30 min at room
temperature. The 2–3 mL of gas phase in the vial was taken by a gas tight syringe and then manually injected into the SRI GC equipped with a reduction gas detector (RGD) to determine H2. The GC with RGD was brought by
JAMSTEC Kochi Institute for Core Sample Research (KCC) as 3rd party tool. Chromatographic response on the GC was calibrated against the introduced volume of prepared standard gas (104 ppm of H2).
Headspace methane A 2.5 cm3 of sediment was sub-sampled by cut-off plastic syringe at the same
point as H2 measurement sampling. The syringe-containing sample was immediately extruded into 10 mL of glass vial in which 1 mL of saturated sodium chloride solution in distilled, deionized water (DDW) had been supplemented to make slurry. The sample was brought to KCC for on shore measurement of concentration and stable isotopic compositions of hydrocarbon gases. The raw data are shown in Table 6.6.1.
50

Table 6.6.1. Head space analysis of hydrogen concentration.
51

6.7. Pressure coring and PCATS (Pressure Core Analysis and Transfer System)
reported by Yuki Morono, Hidenori Kumagai,
Tomohiro Toki, Wataru Tanikawa
6.7.1. Introduction “Pressure core” is the cored sample taken from geological formations with
keeping in-situ pressure during recovery. It is important to maintain physical,
geochemical and biological characteristics under the in-situ pressure, especially for gas hydrate-bearing sediment. During Expedition 906, using a newly developed 3.5 meters-pressure coring system (PCS), so called “Hybrid-PCS”,
we attempted to retrieve pressure cores of methane hydrate-bearing sediment from the mud-volcano no. 5 at the water depth of approximately 2000 meters (i.e., in situ pressure is ~200 bar). Decreasing pressure and increasing
temperature during core recovery from the seabed is critical for maintain hydrate structure and volatile gas because of the hydrate dissociation. The dissociation of gas hydrate creates large volumes of gas, which may expand and destroy the
complete fabric of core prior to it reaching the surface.
6.7.2. Coring and transfer of in-situ pressure core All in-situ pressure cores were obtained by a newly developed Hybrid
Pressure Coring System (Hybrid-PCS). Expedition 906 is the first operation of Hybrid-PCS that has been customized for the use of Chikyu. The core length of
Hybrid-PCS is 3.5 meter. During Expedition 906, we tested two core barrels: i.e., punching shoe and cutting shoe. Temperature and pressure logger was deployed on the coring system, which logs are shown in Appendix 5.
After pressure core recovery, the core barrel was placed in a vertical ice shock-chamber on the rig floor at least for ~30 min to keep the low pressure to avoid hydrate dissociation. Then, the core barrel was placed in another ice pool
horizontally and the autoclave part was detached. The core chamber was then immediately transferred to GeoTek PCATS container lab by crane and connected to the transfer system (Fig. 6.7.1, Table 6.7.1). After the connection
52

of the core chamber to PCATS, the inside core was transferred to another aluminum high-pressure chamber without depressurization. The core section can be checked by X-ray during the transfer operation (Fig. 6.7.2).
Table 6.6.1. Summary of hybrid-PCS core recovery.
Hole Core Type Top Bottom Recovery
B 3 P/T 1952.5 1955.5 0.15 (1.7%) B 5 P/T 1988.0 1991.0 0.7
B 7 P/X 2038.0 2042.0 0.2 B 9 P/X 2118.5 2122.5 0.0 C 1 P 0 6.5 0.9
Fig. 6.7.1. Transfer of pressure core into GeoTek PCATS container.
53

Fig. 6.7.2. X-ray observation of the pressure core.
54

6.7.3. Gas sampling from the Hybrid-PCS at/after the hydrate production test.
Outline of gas production test
The test is carried out after the X-ray investigation inside of the pressure-vessel. Up to a 30 cm long section can be stored into the dedicated
(small) pressure vessel. In standard protocol, pressure is released gently down to just beneath the stability field of the hydrate (~40 bar), in approx. 30 min. In case of the vessel contains any gas hydrate, pressure rebounds toward the
hydrate stability field; the pressure became stable at the pressure predicted from the chamber (~ van-inside) temperature, e.g. ~40 bar under 10 °C of the test-van, when sufficient amount of the hydrate is contained. Once reach the stable
pressure, the valve from the chamber is opened to introduce pressured gas and/or water into the graduated cylinder. Prior to the test, the cylinder has been filled by water, and any air bubble was carefully removed and water level was
adjusted. This depressurize process are repeated while the gas is released.
Gas Sampling
(A) Rn and noble gases
reported by Hidenori Kumagai
On the top of the cylinder, a luer lock connecter was equipped with a stopcock.
For on-shore noble gas measurement, approx. 110 mL of the gas was collected directly from the cock into the vacuumed IsoTube.
From the remnant of the gas in the cylinder, up to 800 mL of the gas aliquot is
pumped into the Rn measurement apparatus, AlphaGuard PQ2000 Pro, Saphymo GmbH, Germany. The apparatus counts any decay in its ion-chamber as the Rn decay, thus complete filtering any dust from the gas introduced in the
chamber is required, which potentially makes memorized contamination. The configuration of the connection at this sampling is shown in Fig. 6.7.3.
At the on-line measurement of Rn, maximum Rn concentration >100 Bq/m3
was recorded. This means the obtained hydrate contains some significant amount of the Rn prior to the entire decay (ca. 38 dy as 10 times of the half-life). Although the Rn concentration of the surrounding formation is unknown, this
55

suggests that the hydrate is retrieved very quickly since its formation.
(B) Gas composition analysis of high-pressure core
reported by Akira Ijiri and Tomohiro Toki
PCAT high-pressure core provides an ideal opportunity to study in-situ gas
analyses, which has not been effected by degassing during core recovery. During Expedition 906, the gas was extracted directly from the pressurized chamber through the vacuum line, and then measured pressure of the sample
bottle. Using the gas sample, hydrogen concentration was measured as described previously, and the initial data are shown in Table 6.6.1. We also performed gas-production test from 10-15 cm high-pressure WRC (see, Figs 6.7.6-6.7.9).
56

Fig. 6.7.3. Schematic diagram of the configuration of Rn and noble gas sampling.
6.7.4. Physical property test using PCAT triaxial reported by Wataru Tanikawa
Pressure cores are transferred from PCATS to the tri-axial deformation apparatus (PCATS triaxial, Fig. 6.7.4) by preserving in-situ pressure condition. Sample is covered by rubber jacket during transferring core sample into triaxial
testing pressure vessel; therefore, confining pressure can be applied during physical property measurement. Several physical properties, such as permeability, elastic property, and shear strength, are measured using this
high-pressure apparatus. Permeability is measured by the steady state flow method. In this method, differential fluid pressure is applied between both ends of the specimen by keeping constant flow rate using two flow pumps.
Permeability is then calculated by differential pressure and flow rate. The methodology for elastic properties (shear modulus and Young’s modulus) of sediment is described by Priest et al. (2005, 2009). Low axial strain and shear
strain is applied in this method, therefore no permanent deformation is achieved. A common triaxial deformation test is also performed by applying large axial strain to core samples, and strength of sediment is measured.
57

6.6.5. References Priest, J.A., Best, A. I., and Clayton, C. R. I., 2005, A laboratory investigation into
the seismic velocities of methane gas hydrate-bearing sand, J. Geophys.
Res., 110, B04102, doi:10.1029/2004JB003259 Priest, J. A., Rees, E. V. L. and Clayton, C. R. I., 2009, Influence of gas hydrate
morphology on the seismic velocities of sands, J. Geophys. Res., 114, B11205, doi:10.1029/2009JB006284
58

Fig. 6.7.4. PCATS triaxial system.
59

60
0
0.1
0.2
0.3
0.4
0.5
0.6
0.7
0.8
1 1.5 2 2.5
Gamma Density (g/cc)
0
0.1
0.2
0.3
0.4
0.5
0.6
0.7
0.8
1,400 1,800 2,200 2,600
P-wave Velocity (m/s)
906-C9004C-1P Lo
ggin
g D
epth
(m)
Fig. 6.7.5. Vertical profiles of gamma-ray density, P-wave velocity and X-ray CT image of
Core C9004C-1P.

Table 6.7.6. Gas production test of C9004B-5P-2.
61

Fig. 6.7.7. Gas production test of C9004C-1P-3.
Fig. 6.7.8. Gas production test of C9004C-1P-6.
62

Fig. 6.7.9. Gas production test of C9004C-1PCC.
63

Appendix 1. Syringe and WRC sampling Note.
Site C9004 Hole B Core 1 Type H Time on deck: June 25 2012 22:52 Samplers: Hans Røy & David Case Number of sections: 8
General. Top of core with very little mud, distributed as small chunks on the liner walls. Sampling slow. Section one skipped. Most samples in section two and three were not possible to take with good aseptic technique. All compromised samples have been noted as compromised in the chart. Samples with no comments are good. Cut faces had to be sampled in both side of the cut in all but the last cut (section 7-8). Section 7 was short and was not sampled because there was a good long section 8. Section 8 was sampled in top only.
Detail.
Unless otherwise noted, sampling volumes were reasonably close to:
ATHS: 3cc DCHS1: 3cc DCHS2: 5cc AIHS1: 2.5cc AIHS2: 2.5cc YMHS: 5cc JKHS1: 20cc
Section 1. This section was skipped entirely by scientist sampling, due to a lack of available mud. The D/V Chikyu technicians took one safety gas measurement from the bottom of this section.
Section 2. Due to a low abundance of mud in this section, aseptic technique was not possible. Samples taken in this section were:
• ATHS, bottom of section. Non-sterile. • DCHS1, bottom of section. Non-sterile. • DCHS2, bottom of section. Non-sterile.
Section 3. Due to a low abundance of mud in this section, aseptic technique was not possible. Mud was chunky. Samples taken in this section were:
• ATHS, bottom of section. Non-sterile. • AIHS1, top of section. Non-sterile. • AIHS2, top of section. Non-sterile. Less than 2.5cc. • YMHS, top of section. Non-sterile. Time of sample mixing with PFA: 00:12 (June 26)
Section 4. Here the abundance of mud increased enough to allow proper sterile technique in some samples. Section ends were increasingly filled. Mud retained chunks but increasingly smooth and soft. Samples taken in this section were:
• ATHS, bottom of section. 2cc. • DCHS1, top of section. • DCHS1, bottom of section. • DCHS2, top of section. 3cc. • DCHS2, bottom of section. 3cc. • AIHS1, top of section. Non-sterile. • AIHS1, bottom of section. • AIHS2, top of section. Non-sterile. 2cc. • YMHS, top of section. Time of sample mixing with PFA: 00:30?(June 25)
64

Section 5. Here the mud abundance was sufficient to maintain aseptic technique whenever required (samples sterile unless otherwise noted). Mud was smooth and soft. Samples taken in this section were:
• ATHS, bottom of section • DCHS2, bottom of section. Tried sampling top of Sec. 6, but failed and so sampled bottom
of Sec. 5. 3cc. • AIHS2, top of section • YMHS, top of section. Time of sample mixing with PFA: 00:40 (June 25) • JKHS1, bottom of section
Section 6. High mud abundance, good quality sampling. Samples taken were: • DCHS1, top of section. Sample was adjacent to CH4 hydrate. • AIHS1, top of section. 1.5cc • AIHS2, top of section. 2cc. • YMHS, top of section. Time of sample mixing with PFA: 00:55 (June 25)
Section 7. This section was short and was therefore not sampled. The boundaries of section seven were defined by two void spaces in the core.
Section 8. High quality end to this core, a full suite of all samples was able to be taken. Samples retrieved were:
• ATHS, top of section. Procedure error: sample was plugged with rubber plug. • DCHS1, top of section. • DCHS2, top of section. 3cc. • AIHS1, top of section. • AIHS2, top of section. Procedure error: sample end was covered with parafilm and sample
was placed in plastic baggie. • YMHS, top of section. Time of sample mixing with PFA: 01:20 (June 25) • JKHS1, top of section.
WRC sampling Each WRC was taken and stored according to the table of sampling procedure unless otherwise noticed.
Section 1. No WRC was taken because of low recovery <10% and abundance of breccias
Section 2. No WRC was taken because of low recovery <5% and abundance of breccias
Section 3. No WRC was taken because of low recovery <5% and abundance of breccias
Section 4. No WRC was taken because of low recovery <20% and abundance of breccias
Section 5. Middle parts of the section had low recovery <20% and was not taken for WRCs. 0-40 cm: IW 100-140 cm: IW
Section6. The length is 71 cm with recovery of 60% 0-71 cm (whole section): GAIW
Section7. The length is 113.5 0-50 cm: FSIW 100-113.5 cm: RMS
65

Exp. 906 Site C9004 Hole Core 2 Type H Time on deck: June 25 2012 22:52 Samplers: Tatsuhiko Hoshino, Sanae Sakai, Rishi Adhikari, and Yuki Morono Number of sections: 7
General. The core contained large void in the middle. Total recovery was 7m. The first section wasskipped.All syringe samples except for JKHS (Jens samples) were taken from the top sides. Tomaru-sanobserved the temperature of core liner but did not found abnormal low temperature indicating existenceof methane hydrate. After the sectioning, no methane hydrate was found. Cores contained much breccia,some parts of cores were not suitable for WRC sampling while core recovery was high.
Syringe sampling
Detail.
For all sampling volumes were reasonably close to:
ATHS: 3cc DCHS1: 3cc DCHS2: 5cc AIHS1: 2.5cc AIHS2: 2.5cc YMHS: 5cc JKHS1: 20cc
Section 1. This section was skipped entirely by scientist sampling, due to a lack of available mud. Safety gas measurement sample was taken from the bottom of this section.
Section 2. Mud was very soft and sticky: • ATHS, top of section. Non-sterile. • DCHS1, top of section. Non-sterile. • DCHS2, top of section. Non-sterile. • AIHS1, top of section. Non-sterile • AIHS2, top of section. Non-sterile • YMHS, top of section. sterile, at 0400
Section 3. Mud got harder than the top sections. • ATHS, top of section. Non-sterile. • DCHS1, top of section. Non-sterile. • DCHS2, top of section. Non-sterile. • AIHS1, top of section. Non-sterile • AIHS2, top of section. Non-sterile • YMHS, top of section. sterile, at 0410
• JKHS, bottom of section. sterile
Section 4. Mud was hard. Inserting syringe sampler was difficult especially for large-volume syringes such as 20 ml and 10 ml.
• ATHS, top of section. Non-sterile. • DCHS1, top of section. Non-sterile.
66

• DCHS2, top of section. Non-sterile. • AIHS1, top of section. Non-sterile • AIHS2, top of section. Non-sterile • YMHS, top of section. sterile, at 0420
Section 5. Mud was hard. Inserting syringe sampler was difficult especially for large-volume syringes such as 20 ml and 10 ml.
• ATHS, top of section. Non-sterile. • DCHS1, top of section. Non-sterile. • DCHS2, top of section. Non-sterile. • AIHS1, top of section. Non-sterile • AIHS2, top of section. Non-sterile • YMHS, top of section. sterile, at 0425
Section 6. Mud was hard. Inserting syringe sampler was difficult especially for large-volume syringes such as 20 ml and 10 ml.
• ATHS, top of section. Non-sterile. • DCHS1, top of section. Non-sterile. • DCHS2, top of section. Non-sterile. • AIHS1, top of section. Non-sterile • AIHS2, top of section. Non-sterile • YMHS, top of section. sterile, at 0426
Section 7. Mud was hard. Inserting syringe sampler was difficult especially for large-volume syringes such as 20 ml and 10 ml.
• ATHS, top of section. Non-sterile. • DCHS1, top of section. Non-sterile. • DCHS2, top of section. Non-sterile. • AIHS1, top of section. Non-sterile • AIHS2, top of section. Non-sterile • YMHS, top of section. sterile, at 0430
WRC sampling WRCs for IW (sections 2, 5, and 6) were taken at first. Each WRC was taken and stored according to the table of sampling procedure unless otherwise noticed.
Detail Section 1. Skipped due to the very short length
Section 2. 0-50 cm: IW 50-100 cm: GAIW 100-140 cm: FSIW
Section 3. 0-20 cm: THWR, N2 flash, vacume sealed-> -80˚C 20-30 cm : GAWR, 30-40 cm: JKWR, N2 flash, NOT valucumed, and sealed -> 4˚C 40-50 cm: SSWR 50-60 cm: AIWR 60-70 cm: FSWR 70-132 cm: YMWR1 ->cut into 10-cm sections for first 5: last one, 13 cm WRC
Section 4. No WRC was taken due to breccia
Section 5. 0-30 cm: IWWR (50 cm WRC was requested, but it was shortened to 30 cm)
67

Section 6. 17-27 cm: RMS, put in an aluminum bag -> -80˚C 60-110 cm: GAIW 110-141 cm: IWWR
Section 7 42-56 cm: NX
68

Exp. 906 Site C9004 Hole B Core 4 Type H Time on deck: June 26 2012 11:45 Samplers: David Case, Atsushi Tani & Takeshi Terada Number of sections: 7
General. Core was generally of high quality, with smooth sediment which worked well with syringe samples. David inserted syringes, followed by Terada-san extracting syringes and Tani-san keeping track of labels and notes. In the manner the samples worked sequentially downcore. The top (section 1) and bottom (sections 6, 7) of core had void spaces but the middle of the core (sections 2 through 5) had few voids and the sediment was smooth. Sampling was performed over the course of ~30 minutes. Infrared imaging did not reveal any notable abnormalities.
Detail.
Unless otherwise noted, sampling volumes were reasonably close to:
ATHS: 3cc DCHS1: 3cc DCHS2: 5cc AIHS1: 2.5cc AIHS2: 2.5cc YMHS: 5cc JKHS1: 20cc
Section 1. This section was skipped entirely by scientist sampling, due to a lack of available mud.
Section 2. The top of section 2 still had void space varying over from section 1, so sampling was done at the bottom of section 2. Here there was good sediment quantity and quality for syringe sampling. The samples taken here were:
• ATHS, bottom of section. • DCHS1, bottom of section. • DCHS2, bottom of section. • AIHS1, bottom of section. • AIHS2, bottom of section. • YMHS, bottom of section. Time of sample mixing with PFA: 12:47 (June 26)
Section 3. Sediment quality and quantity were both high in this section. Samples could have been taken from the top of section three, but for intra-core consistency all samples were taken from the bottom of section three. Samples taken were:
• ATHS, bottom of section. • DCHS1, bottom of section. • DCHS2, bottom of section. • AIHS1, bottom of section. • AIHS2, bottom of section. • YMHS, bottom of section. Time of sample mixing with PFA: 12:54 (June 26)
Section 4. Once again, sediment quality and quantity were overall high in this section. There began to be slight difficulty inserting syringes, due to what felt like chunks impeding the syringe upon entry. This was not a large issue, however, and the syringe rarely had to be wiggled to gain entry. All sampling was still able to be performed robustly.
• ATHS, bottom of section. • DCHS1, bottom of section. • DCHS2, bottom of section.
69

• AIHS1, bottom of section. • AIHS2, bottom of section. • YMHS, bottom of section. Time of sample mixing with PFA: 13:01 (June 26)
Section 5. Sediment quality was high, with enough quantity for a full sample set. Difficulty of syringe entry continued to increase, though sediment resistance and/or chunks still did not prevent robust sampling. Due to the approaching end of the core, and the increasing difficulty in syringe entry, David decided to acquire the one/core Jens Kallmeyer syringe sample. Because the regular 6 samples filled up the bottom of section 5, the JKHS1 sample was taken from the top of section 5. It thus best correlates with data from samples at the bottom of section 4.
• ATHS, bottom of section. • DCHS1, bottom of section. • DCHS2, bottom of section. • AIHS1, bottom of section. • AIHS2, bottom of section. • YMHS, bottom of section. Time of sample mixing with PFA: 13:13 (June 26) • JKHS1, top of section. Only 18cc (of 20cc requested) were obtained.
Section 6. Here mud quantity became low, such that taking all standard samples from the bottom of the section was not feasible. Mud quality also became chunky, such that syringe injection was difficult and required jiggling. Only two samples were able to be taken from section six, both from the bottom:
• DCHS1, bottom of section. Low quality sample (required jiggling syringe) • DCHS2, bottom of section. Low quality sample (required jiggling syringe)
Section 7. This section had many void spaces and the sediment quality was not high. Four samples were taken from the top of the section:
• ATHS, top of section. • AIHS1, top of section. • AIHS2, top of section. Low quality sample, much syringe jiggling required. • YMHS, top of section. Time of sample mixing with PFA: 13:19 (June 26)
WRC sampling All sections were cut sequentially from core 1 to 7. Each WRC was taken and stored according to the table of sampling procedure unless otherwise noticed. Section 4 of the core had been twisted in drill operations and thus had a spiral shape which made WRC cutting difficult and likely impacted the internal sediment distribution in that section.
Detail Section 1. Length 90cm 0-30 cm: IW
Section 2. Length 141cm 20-50 cm: IW
Section 3. Length 130cm 12-50 cm: FSIW 50-100 cm: GAIW 100-131 cm: IW
Section 4. Length 140 cm 0-10 cm: GAWR 10-20 cm: JKWR 20-30 cm: AIWR 30-40 cm: SSWR 40-60 cm: FSWR. Cut in half vertically, individually flushed each half with N2 and sealed under vacuum, stored at 4˚C 60-90 cm: THWR 90-140 cm: YHWR1, split into 5x10cm subsamples.
70

Section 5. Lenth 140 cm 0-45cm: GAIW 45-75 cm: IW
Section 6. Length 84cm 54-84cm: IW
Section 7. Length 129 cm 35-50 cm: RMS 90-129 cm: YMWR1
71

Exp. 906 Site C9004 Hole B Core 6 Type H Time on deck: June 27 2012 3:59 Samplers: Tatsuhiko Hoshino, Sanae Sakai, Rishi Adhikari, Yuki Morono and Hitoshi Tomaru Number of sections: 6
General. Core recovery of very low probably due to explosion of methane hydrate. The core had many void space. Based on IR camera observation, the temperature of almost entire core was lower than previous cores. The lowest temperature was observed at the top of section 4. However, no methane hydrate was observed anywhere in the whole core. It was observed that methane gas bubbles were generated when sediment from the core catcher came to the cutting area. Several pieces of methane hydrate of around 5 mm were also find in the sediment. Sections from 1 to 3 were the explored sediments and not used for syringe sampling. All syringe samples other than JKHS were taken from the bottom of sections 4-6.
Detail.
Unless otherwise noted, sampling volumes were reasonably close to:
ATHS: 3cc DCHS1: 3cc DCHS2: 5cc AIHS1: 2.5cc AIHS2: 2.5cc YMHS: 5cc JKHS1: 20cc
Section 1-3. These cores were explored sediments. This section was skipped entirely by scientist sampling,
Section 4. The pieces of cores were concatenated into one section. • ATHS, bottom of section. • DCHS1, bottom of section. • DCHS2, bottom of section. • AIHS1, bottom of section. • AIHS2, bottom of section. • YMHS, bottom of section.
Section 5. • ATHS, bottom of section. • DCHS1, bottom of section. • DCHS2, bottom of section. • AIHS1, bottom of section. • AIHS2, bottom of section. • YMHS, top of section. • JKHS, top of section.
Section 6.. • ATHS, bottom of section. • DCHS1, bottom of section. • DCHS2, bottom of section. • AIHS1, bottom of section. • AIHS2, bottom of section. • YMHS, top of section.
72

WRC sampling Only three sections were available for the WRC sampling.
Detail Section 4. Length 64.5cm 0-33 cm: IW 33-48 cm: AIWR 48-64.5 cm: SSWR
Section 5. Length 56.5cm 0-10 cm: JKWR 30-56.5 cm: THWR
Section 6. Length 93cm 50-73 cm: IW 73-93 cm: FSWR
Exp. 906 Site C9004 Hole B Core 8 Type H Time on deck: June 27 2012 15:07 Samplers: David Case, Takeshi Terada, and Atsushi Tani Number of sections: 8
General. Core had many void spaces, likely due to methane hydrates. Infrared camera did not detect temperature abnormalities, though. MQJ technicians drilled small holes in core to relieve pressure. This off-gassing caused sediment to shift up and down core somewhat. The sediment smoothness varied between sections but in general the sediment was very hard, and difficult to sample with syringe. In some places a small bubbling was observed coming out of the sediment, likely the dissociation of small methane hydrate chunks. Following sampling, void spaces were removed by pushing the sediment back together.
Detail.
Unless otherwise noted, sampling volumes were reasonably close to:
ATHS: 3cc DCHS1: 3cc DCHS2: 5cc AIHS1: 2.5cc AIHS2: 2.5cc YMHS: 5cc JKHS1: 20cc
Section 1-2. These sections were completely disturbed by hydrate expansion and were not syringe sampled.
Section 3. This section had relatively accessible sediment for syringe sampling, though overall the sediment was hard and difficult to inject syringes into.
• ATHS, top of section. • DCHS1, top of section. • DCHS2, top of section. • AIHS1, top of section. • AIHS2, top of section.
73

• YMHS, top of section. PFA fixation begun at: 16:09 July 27 2012
Section 4. Sediment had many sites of small bubbling, indicating the dissolution of methane hydrates. Sampling was of high quality, although sediment was more hard than ideal.
• ATHS, top of section. • DCHS1, top of section. • DCHS2, top of section. • AIHS1, top of section. • AIHS2, top of section. • YMHS, top of section. PFA fixation begun at: 16:17 July 27 2012 • JKHS, top of section. • DCHS1, bottom of section • AIHS1, bottom of section • AIHS2, bottom of section
Section 5. Sediment became too hard and difficult to put all syringes in together. Consequently, syringes were split between the top of section 5 and the bottom of section 4.
• ATHS, top of section. • DCHS2, top of section. • YMHS, top of section. Not sterile because so much wiggling of syringe had to be injected
into multiple locations in order to retrieve enough sediment. PFA fixation begun at: 16:20 July 27 2012 • ATHS, bottom of section • DCHS1, bottom of section • DCHS2, bottom of section
Section 6. Sediment amount was low because of void spaces. Quality of sediment present was high. Sampling was split between the top of section 6 and bottom of section 5 because there was not enough sediment for all syringes at the top of section 6.
• AIHS1, top of section • AIHS2, top of section • YMHS, top of section. PFA fixation begun at: 16:28 July 27 2012 • JKHS, bottom of section.
Section 7. Sediment quality improved, mud was softer and in higher abundance. • ATHS, top of section.
• DCHS1, top of section. • DCHS2, top of section. • AIHS1, top of section. • AIHS2, top of section. • YMHS, top of section. PFA fixation begun at: 16:42 July 27 2012
WRC sampling
Detail
Section 1. Length 150cm. Not sampled for WRC, sediment was too disturbed.
Section 2. Length 45cm. Not sampled for WRC, too many voids.
Section 3. Length 109cm 0-50cm: GAIW 50-80cm: IW 80-90cm: JKWR 90-100cm: AIWR 100-109cm: GAWR
Section 4. Length 97.5cm 0-41cm: FSIW
74

60-80cm: FSWR
Section 5. Length 135.5cm 30-40cm: SSWR 98-116cm: IW 116-135.5cm: IW (Methane hydrate signatures observed here in CT)
Section 6. Length 129.5cm 0-66cm: YMWR 66-100: THWR 100-129.5: IW
Section 7. Length 133cm 0-20cm: FSWR 20-30cm: AIWR 30-40cm: RMS 50-100cm: GAIW 100-133cm: IW
Section 8. Length 92cm. Not sampled for any purpose, too many voids.
Exp. 906 Site C9004 Hole B Core 10 Type X Time on deck: June 28 2012 3:04 Samplers: Tatsuhiko Hoshino, Sanae Sakai, Yuki Morono and Hitoshi Tomaru Number of sections: 1
General. No core recovery. The ESCS coring system did not seem to be suitable for the sediment. One section was obtained but contains only gravels and muddy water. Therefore, no syringe sample and WRC was taken from this core.
75

Appendix 2. Interstitial water sampling flow.
76

77

78

79

80

Appendix 3. Location of whole round core samples on X-ray CT scan image.
81

82

Appendix 4. Sample List.
83

84

85

Appendix 5. Temperature and Pressure Logs during Hybrid-PCS Operation.
0
5
10
15
20
25
0 25 50 75 100 125 150 175 200 225 250
Tem
pera
ture
(˚C
)
Pressure (bar)
906-C9004B-3P
dissolved methane + methane gas
dissolved methane + methane hydrate
86

0
5
10
15
20
25
0 25 50 75 100 125 150 175 200 225 250
Tem
pera
ture
(˚C
)
Pressure (bar)
906-C9004B-5P
dissolved methane + methane gas
dissolved methane + methane hydrate
87

0
5
10
15
20
25
0 25 50 75 100 125 150 175 200 225 250
Tem
pera
ture
(˚C
)
Pressure (bar)
906-C9004B-7P
dissolved methane + methane gas
dissolved methane + methane hydrate
dissolved methane + methane gas
dissolved methane + methane hydrate
88

0
5
10
15
20
25
0 25 50 75 100 125 150 175 200 225 250
Tem
pera
ture
(˚C
)
Pressure (bar)
906-C9004B-9P
dissolved methane + methane gas
dissolved methane + methane hydrate
dissolved methane + methane gas
dissolved methane + methane hydrate
89

0
5
10
15
20
25
0 25 50 75 100 125 150 175 200 225 250
Tem
pera
ture
(˚C
)
Pressure (bar)
906-C9004C-1P
dissolved methane + methane gas
dissolved methane + methane hydrate
dissolved methane + methane gas
90