Embed Size (px)
Citation preview

Our best year so far(by the people who made it our best year so far)
Aldermore Bank PLC Annual Report & Accounts 2013
James CainInvoice Finance Customer

Executive Committee Phillip Monks – Chief Executive Officer
Mark Stephens – Deputy Chief Executive Officer and Group Commercial Director
Paul Myers – Chief Operating Officer
James Mack – Chief Financial Officer
Stephen Barry – Chief Risk Officer
Ali Humphries – Group HR Director
Non-Executive Directors John Callender
Peter Cartwright
David Soskin
Chris Stamper
Secretary Dionne Simpson
Registered Office 1st Floor, Block BWestern HouseLynch WoodPeterboroughPE2 6FZ
Registered number 00947662
www.aldermore.co.uk
Company information Annual Report and Accounts for the year ended 31 December 2013
AuditorsKPMG Audit PlcLeeds
2 |
Ann
ual R
epor
t & A
ccou
nts
2013
| C
ompa
ny in
form
atio
n
John Callender, Non-Executive Director Peter Cartwright, Non-Executive Director
David Soskin, Non-Executive Director Chris Stamper, Non-Executive Director

Executive Committee Phillip Monks – Chief Executive Officer
Mark Stephens – Deputy Chief Executive Officer and Group Commercial Director
Paul Myers – Chief Operating Officer
James Mack – Chief Financial Officer
Stephen Barry – Chief Risk Officer
Ali Humphries – Group HR Director
Non-Executive Directors John Callender
Peter Cartwright
David Soskin
Chris Stamper
Secretary Dionne Simpson
Registered Office 1st Floor, Block BWestern HouseLynch WoodPeterboroughPE2 6FZ
Registered number 00947662
www.aldermore.co.uk
Aldermore Bank PLC is authorised by the Prudential Regulation Authority and regulated by the Financial Conduct Authority and the Prudential Regulation Authority.
Member of British Bankers’ Association
Member of Finance and Leasing Association
Members of The Asset Based Finance Association (ABFA)
Com
pany information | A
nnual Report &
Accounts 2013 | 3
Phillip Monks, Chief Executive Officer
James Mack, Chief Financial Officer
Mark Stephens, Deputy Chief Executive Officer and Group Commercial Director
Stephen Barry, Chief Risk Officer
Paul Myers, Chief Operating Officer
Ali Humphries, Group HR Director

Our business
Aldermore is a UK bank providing retail and SME savings accounts, commercial and residential mortgages, and asset and invoice finance.
4 |
Ann
ual R
epor
t & A
ccou
nts
2013
| O
ur b
usin
ess

Aldermore raises deposits from British savers and lends to British businesses and homeowners.Aldermore Bank PLC is a UK regulated deposit-taking institution. We are authorised by the Prudential Regulation Authority, regulated by the Financial Conduct Authority and Prudential Regulation Authority and registered under the Financial Services Compensation Scheme.
Established in 2009, Aldermore provides modern, straightforward and competitive products to British consumers and small and medium sized businesses (SMEs). We focus on delivering products and services via our digital distribution model in association with specialist brokers across the UK. Our expert, data-driven credit underwriting processes are supported by a modern, scalable IT infrastructure which enables us to deliver increasing operating efficiency as we continue to grow.
Aldermore was founded by an experienced management team with capital provided by funds advised by private equity firm AnaCap Financial Partners LLP. Since then, Aldermore has raised additional equity capital from a number of leading blue chip global investors.
Our funding comes primarily from the deposits made with us by British savers and businesses in a range of straightforward saving products, which we then lend on a secured basis to British SMEs and homeowners. We have been proud to champion the cause of SMEs during the last few difficult years. As such we participate in the UK government’s Funding for Lending Scheme (FLS), which provides loans to banks and building societies to stimulate lending within the economy.
Our marketsWe serve the funding needs of British businesses and homeowners across four market segments. These markets have been selected where we believe customers have been underserved by established providers and provide growth opportunities at sustainable risk adjusted returns.
Residential MortgagesWe offer prime residential and buy-to-let mortgages both through intermediaries and direct to customers.
SME Commercial Mortgages We meet the property finance needs of professional, residential and commercial property investors, and owner-occupier SMEs.
Invoice Finance We provide working capital for SMEs by lending against outstanding invoices in the form of factoring and invoice discounting.
Asset FinanceWe offer lease and hire purchase finance to fund SME capital investment in machinery, plant and equipment.
Our business | A
nnual Report &
Accounts 2013 | 5

#peoplewhomade2013
z Financial highlights 2013
z Strategic report
z Corporate governance
z Directors’ report
z Statement of directors’ responsibilities
z Independent Auditor’s report
z Profit and loss account
z Statement of total recognised gains and losses
z Balance sheet
z Notes to the financial statements
8
11
35
39
51
52
55
56
57
58
Contents | A
nnual Report &
Accounts 2013 | 7
Contents

Financial highlights 20138
| A
nnua
l Rep
ort &
Acc
ount
s 20
13 |
Fin
anci
al H
ighl
ight
s 20
13
£22.4millionPROFIT ON ORDINARYACTIVITIESBEFORE TAX
64%INCREASE INGROSS LOANS
£3.4bn£2.1bn
2012 2013
61%INCREASE INTOTAL CUSTOMERD E P O S I T S
£3.4bn£2.1bn
2012 2013
Profit on ordinary activities before tax of £22.4 million (£1.5m in 20121)
Total balance sheet assets up 66% to £4.2 billion (2012: £2.5 billion)
Gross loans up 64% to £3.4 billion (2012: £2.1 billion)
Total customer deposits up 61% to £3.4 billion (2012: £2.1 billion)
Lending to SMEs up 53% to £1.69 billion (2012: £1.10 billion)
Lending to homeowners up 76% to £1.68 billion (2012: £0.96 billion)
£4.2bn
66%INCREASE INTOTALBALANCES H E E TASSETS
2012 2013
Return on equity
10.9%2013
Tier 1 capital ratio
11.7%2013
0.9%2012
11.5%2012
1 Restated for a change in accounting policy for IFRIC 21, as explained in Note 1 of the financial statements.
£2.5bn

Financial Highlights 2013 | A
nnual Report &
Accounts 2013 | 9
Organic loan origination up 42% to £1.71 billion (2012: £1.20 billion)
Number of customers rises 36% to 136,000 (2012: 99,700)
Staff numbers up 27% to 664 (2012: 521)
Net interest margin up to 2.95% (2012: 2.14%)
Cost/income ratio falls to 67% (89% in 2012)
Charge for bad and doubtful debts 0.36% of average net loans (0.29% in 2012)
Return on equity 10.9% (0.9% in 2012)
Tier 1 capital ratio of 11.7% (11.5% in 2012)
2013 £1.69bn
53%INCREASE INLENDING TO SMEs
76%INCREASE IN LENDINGTO HOMEOWNERS
2013 £1.68bn
27%INCREASE INSTAFF NUMBERS
664
£1.71bn
O R G A N I CLOAN ORIGINATION
UP 42%
67%
COST/INCOME
R A T I ODOWN TO
CHARGE FOR BAD & DOUBTFUL DEBTS
0.36% of average net loans
136,000
NUMBER OF CUSTOMERSUP 36%
NET INTEREST M A R G I N
% %
UP TO 2.95%

#peoplewhomade2013

Strategic report
This was another year of growth for Aldermore, which demonstrated the strength of our business franchise and its ability to satisfy the needs of British businesses, savers and homeowners. Aldermore was established to provide reliable, expert, dynamic and, above all, straightforward and transparent banking for its customers. Our current 700 employees are not only proud to champion the cause of UK SMEs and UK homeowners but also incredibly proud of the bank we have all built.
CEO review
Financial performance
We have invested in, and built, a banking franchise with a sustainable, straightforward and modern business model, supported by an efficient and scalable digital platform. We are now seeing strong, sustainable and growing returns for our shareholders. Operating profits before taxation rose to £22.4 million (2012: £1.5 million)2 while lending increased by 64% to £3.4 billion. This balance sheet expansion goes hand-in-hand with a disciplined approach to lending which has meant we were able to maintain the credit quality of our assets, with a loan loss ratio of 0.4% (2012: 0.3%). Our capital position remained robust, with a Core Tier 1 capital ratio of 11.7% (2012: 11.5%), and a leverage ratio of 5.4% – both above minimum regulatory requirements.
To support this increased lending volume we increased customer deposits by 61% to £3.4 billion. We have diversified our sources of deposits by providing SMEs with the same “great value, delivered effortlessly” that we provide for personal customers. Active management of our funding requirements, including the use of the FLS, has delivered at a reduced average cost of funds across the Bank and our net interest margin therefore grew from 2.14% to 2.95%.
Growing the business required further investment in people and systems but this was more than offset by the increased operating income we generated. As a result, our cost/income ratio reduced to 66.96% (2012: 88.78%) and we expect this will continue to fall as the business grows and the efficiency of our scalable systems and infrastructure drives increased operating leverage.
Our four SME/retail segments are carefully chosen where we believe there are opportunities to provide products and services which generate strong and sustainable risk-adjusted margins. We believe that these customer segments are in general poorly served by other providers, even more so through the last six years since the credit crisis. Indeed, figures from the British Bankers’ Association show that in the last 12 months alone, the volume of SME loan approval in the UK contracted by 12%. Against this backdrop, we are well placed to provide expert and reliable financial solutions for our customers and, at the same time, achieve strong market positions, good returns based on secured lending, and sustainable growth.
2 Restated for a change in accounting policy for IFRIC 21, as explained in Note 1 of the financial statements.
Strategic report | A
nnual Report &
Accounts 2013 | 11

Residential MortgagesAldermore targets poorly served homeowners, would-be homeowners and investors in the residential property market where we have demonstrated our ability to generate attractive returns within our credit appetite. Total loans increased by 76% to £1,683.6 million (2012: £957.3 million), supported by strong and responsive human underwriting and credit management. We were pleased to be amongst the first lenders to support the Government’s “Help to Buy” initiative, aimed at providing improved access to mortgage finance for customers with a lower deposit. During the year we also expanded into the Scottish housing market, and continued to develop our broker and direct to consumer channels. This business has won nine awards in 2013, most notably being awarded the FT Financial Advisor 5 Star Service Award for the third year in a row.
SME Commercial Mortgages In our business supporting SME commercial mortgage customers lending rose 40% to £765 million during the year supported by our specialist team of experienced underwriters. This growth was supported by investment in our people and systems to improve further our ability to respond quickly and consistently to our customers.
Asset Finance In 2013 our Asset Finance business has capitalised on the £1.2 billion market opportunity presented by the withdrawal of ING Lease (UK) from the broker market due to the EU deleveraging pressure. Aldermore’s origination amounted to £609.8 million in 2013, an increase of 74% compared with 2012, against the backdrop of a flat overall market.
12 |
Ann
ual R
epor
t & A
ccou
nts
2013
| S
trat
egic
repo
rt
Strategic report
We also increased the size of our specialist teams and built out our broker proposition during the year to ensure that we continue to be able to deliver a superior service to our customers and brokers. We were proud therefore to be announced winner of the “Asset Finance Firm of the Year” at the Credit Today 2013 awards in recognition of our continued expansion in the asset finance sector.
Invoice FinanceInvoice Finance remains a key working capital product to support SME’s demand for cashflow. In 2013 our regional, industry focused distribution model provided differentiated local expertise and funded client turnover of £2.4 billion, lending our clients £212.0 million (up 19%) and confirming our position as one of the UK’s fastest growing invoice finance providers. We continue to develop our product offering, and expand both our geographic presence and direct distribution model.
A clear and sustainable business modelWe have been able to build a reliable, expert, dynamic and straightforward, business model. By carefully choosing the segments of the market that offer favourable returns we are able to control risk and increase profitability. In 2013 we increased loan origination and profitability while reducing our cost/income ratio. We believe that a strength of our model is the transparency it provides over future earnings. The long-term nature of our assets means they are expected to generate recurring and highly visible income. As a result, 75% of 2014 expected gross interest income is already embedded in our 2013 closing balance sheet.
An efficient and scalable operating platformAldermore employs modern and purpose built, scalable IT platforms to support the Bank’s operations and future growth. This flexible IT architecture is centred around a data warehouse feeding credit, customer and financial information, and a suite of sophisticated management information. The Bank’s IT platforms support and enable superior customer service, strong credit management and dynamic management information.
Aiming to exceed customers’ expectations Service is a key differentiator at Aldermore, helping us to attract and retain customers. Our customers tell us that they have had bad experiences in their dealings with high street banks – from inconvenient opening times to opaque products and slow response times. In contrast we focus on enabling customers to open accounts quickly and simply, get expert help and receive quick decisions on lending. This is provided largely online or by phone, making it more convenient for our customers and more cost effective for our business. We measure the quality of our service with a number of metrics, including complaints and ratings and reviews. We regularly survey our customers on their awareness of our brand, and how they think we are performing against our brand pillars. We also use Net Promoter Scores – a measure of whether a customer would recommend Aldermore to others to measure customer advocacy and are pleased to report a positive score of 25 in contrast to the industry average score of 0 (Source: Satmetrix). We won 20 industry awards during the year in recognition of our outstanding customer proposition. We also continued to attract positive media attention averaging 132 pieces of media coverage each month across various national, regional and trade publications.
Strategic report | A
nnual Report &
Accounts 2013 | 13
14 |
Ann
ual R
epor
t & A
ccou
nts
2013
| S
trat
egic
repo
rt
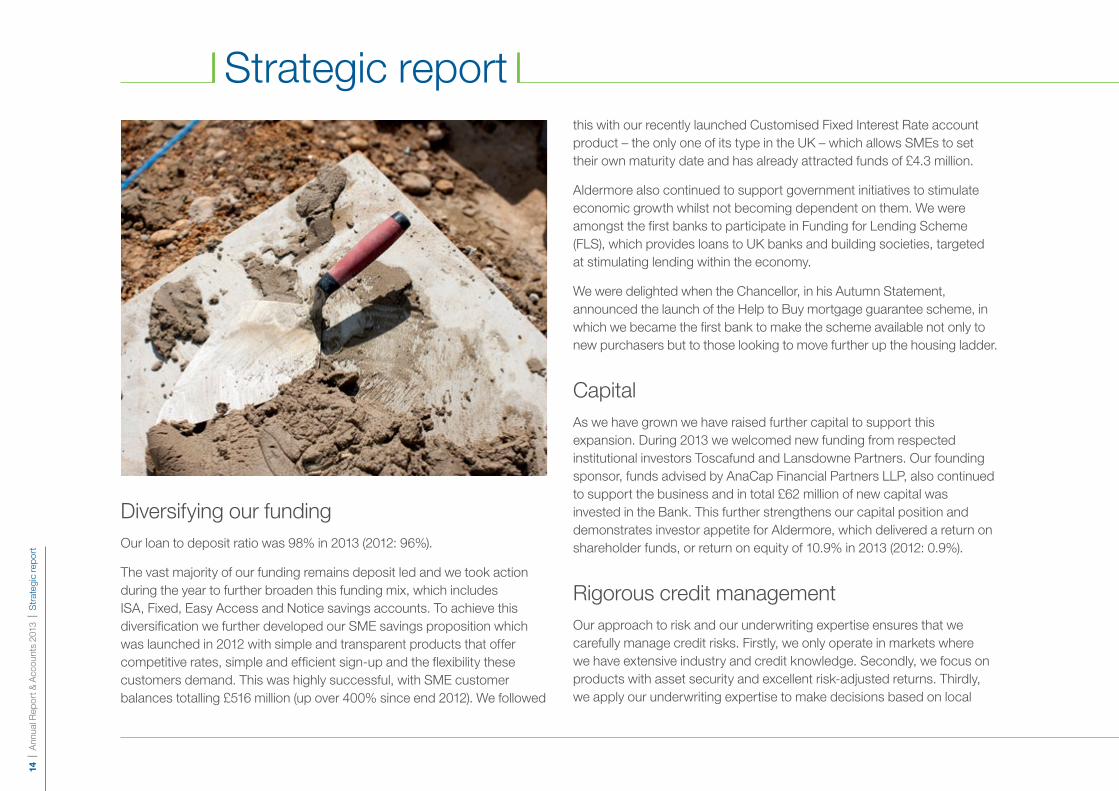
Diversifying our fundingOur loan to deposit ratio was 98% in 2013 (2012: 96%).
The vast majority of our funding remains deposit led and we took action during the year to further broaden this funding mix, which includes ISA, Fixed, Easy Access and Notice savings accounts. To achieve this diversification we further developed our SME savings proposition which was launched in 2012 with simple and transparent products that offer competitive rates, simple and efficient sign-up and the flexibility these customers demand. This was highly successful, with SME customer balances totalling £516 million (up over 400% since end 2012). We followed
this with our recently launched Customised Fixed Interest Rate account product – the only one of its type in the UK – which allows SMEs to set their own maturity date and has already attracted funds of £4.3 million.
Aldermore also continued to support government initiatives to stimulate economic growth whilst not becoming dependent on them. We were amongst the first banks to participate in Funding for Lending Scheme (FLS), which provides loans to UK banks and building societies, targeted at stimulating lending within the economy.
We were delighted when the Chancellor, in his Autumn Statement, announced the launch of the Help to Buy mortgage guarantee scheme, in which we became the first bank to make the scheme available not only to new purchasers but to those looking to move further up the housing ladder.
Capital As we have grown we have raised further capital to support this expansion. During 2013 we welcomed new funding from respected institutional investors Toscafund and Lansdowne Partners. Our founding sponsor, funds advised by AnaCap Financial Partners LLP, also continued to support the business and in total £62 million of new capital was invested in the Bank. This further strengthens our capital position and demonstrates investor appetite for Aldermore, which delivered a return on shareholder funds, or return on equity of 10.9% in 2013 (2012: 0.9%).
Rigorous credit management Our approach to risk and our underwriting expertise ensures that we carefully manage credit risks. Firstly, we only operate in markets where we have extensive industry and credit knowledge. Secondly, we focus on products with asset security and excellent risk-adjusted returns. Thirdly, we apply our underwriting expertise to make decisions based on local
Strategic report

and sector knowledge. Finally, we centrally monitor credit decisions and portfolio performance, supported by our modern reporting infrastructure, credit analytics and experienced Group Risk team. The discipline we apply to each stage of the lending process has allowed the underlying credit quality of our assets to be maintained as the balance sheet has grown. We remain committed to maintaining the quality of our loan book as we continue to grow the Bank.
Well positioned for growthWe expect growth to continue to be driven primarily by organic origination and believe that all four of our market segments have potential to deliver this in 2014. The scalability of our platform means that increases in volume can be accommodated cost effectively and without compromising service quality. Steps taken to increase and diversify our funding base can support this increased lending while maintaining attractive margins.
We expect the broader market context to also remain supportive. Many traditional banks remain distracted by legacy issues and are still in the process of rebuilding capital through balance sheet reductions. The Breedon Report forecasts the gap between supply and demand for SME funding widening to between £80 billion and £190 billion over the next five years. With GDP accelerating in 2013, the need for SMEs to source capital may also be expected to rise, while the risks to their business may reduce. The improving UK economy may also encourage further confidence in the housing market, providing further opportunities in our residential and SME commercial mortgage lines. The regulatory environment continues to be favourable, with the UK government continuing to promote competition in domestic banking, particularly SME and residential mortgage lending, by supporting challengers to the incumbent high street banks. As the current low interest rate environment persists, savers continue to look to improve returns and this may further support our ability to raise funds ahead.
Board changesSir David Arculus stepped down as Chairman during the year, deciding the time was right for a new Chair to lead the next stage of Aldermore’s development. I am personally grateful to Sir David for his contribution and would also like to thank Senior Non-Executive Director John Callender for acting as Interim Chair. We are delighted to announce Glyn Jones as his successor with effect from 21 March 2014.
OutlookHaving made significant progress in 2013, which firmly established the value and efficacy of our scalable business model, we believe the Bank is well positioned for further profitable growth in 2014.
Our headcount increased by 27% during the year and I would like to finish by thanking all our people, old and new, for their hard work, commitment and dedication. They are our most important asset. I am also fortunate to be supported by a strong management team and my thanks go to them, to our Non-Executive Directors and to our investors. But perhaps the last word should go to our customers, whom we regularly ask for feedback. In their ratings and reviews of our services during 2013, a recurring theme is evident when they described Aldermore: “Banking as it should be”.
Phillip MonksChief Executive OfficerAldermore Bank PLC
Strategic report | A
nnual Report &
Accounts 2013 | 15
OverviewThe Bank is authorised to accept deposits under the Financial Services & Markets Act 2000 and the Bank’s principal activities during 2013 were the provision of banking and related services. Our strategy is to deliver a direct and differentiated customer service through innovation and operational transparency. By leveraging diversified sources of funding, robust risk management and market leading operational efficiency we believe we can do this and deliver strong, sustainable growth and shareholder value.
2013 has seen Aldermore build on the momentum of prior years and continue to deliver against our strategy, with good contributions from all of our businesses. We reported a profit before tax of £22.4 million (2012: £1.5 million restated3) driven by strong organic asset growth coupled with improved margins and strong cost and risk management.
The growth of our lending businesses, with gross loans at 31 December 2013 of £3,390 million (2012: £2,071 million) underscores the growth of our franchise and market presence, as does our ability to fund this growth through stable retail and SME deposits. At 31 December 2013, our loan to deposit ratio stood at 98% (2012: 96%).
With such strong organic growth in our balance sheet in 2013, robust capital and liquidity management has been central to our plans. At 31 December 2013, the Bank had Core Tier 1 capital of £250.4 million (2012: £164.8 million), and our Core Tier 1 capital ratio was 11.7% (2012: 11.5%).
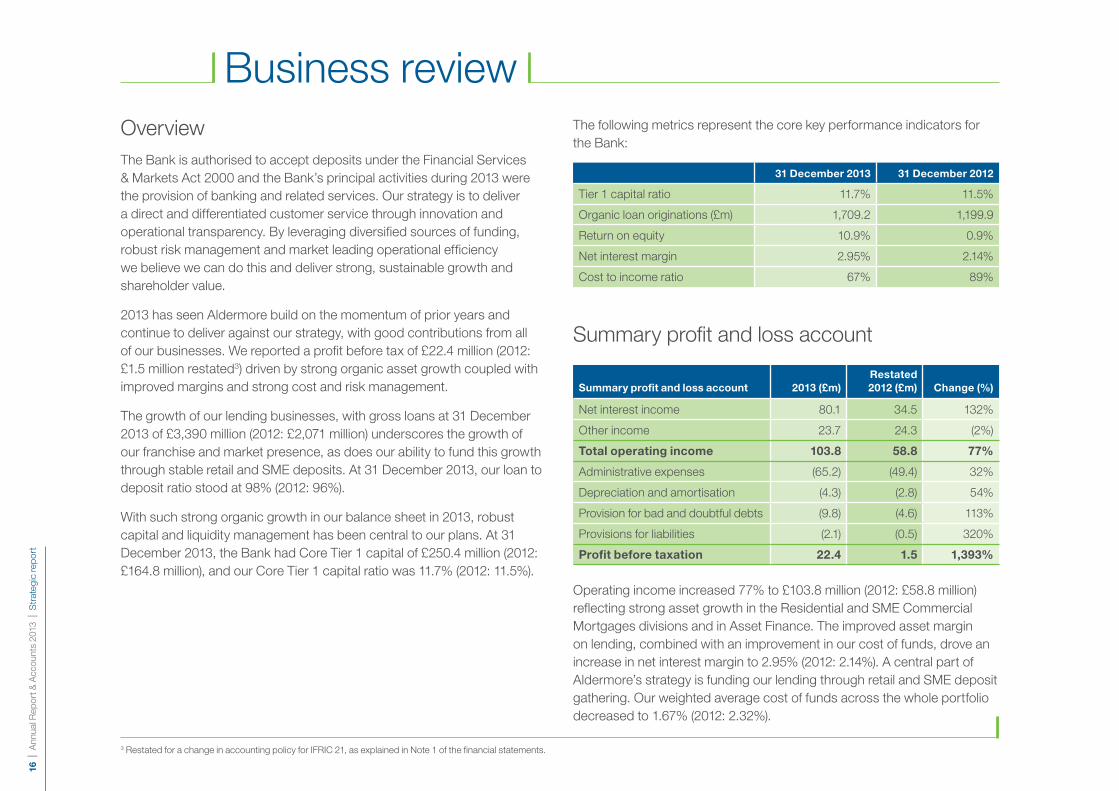
The following metrics represent the core key performance indicators for the Bank:
Summary profit and loss account
Summary profit and loss account 2013 (£m)Restated 2012 (£m) Change (%)
Net interest income 80.1 34.5 132%
Other income 23.7 24.3 (2%)
Total operating income 103.8 58.8 77%
Administrative expenses (65.2) (49.4) 32%
Depreciation and amortisation (4.3) (2.8) 54%
Provision for bad and doubtful debts (9.8) (4.6) 113%
Provisions for liabilities (2.1) (0.5) 320%
Profit before taxation 22.4 1.5 1,393%
Operating income increased 77% to £103.8 million (2012: £58.8 million) reflecting strong asset growth in the Residential and SME Commercial Mortgages divisions and in Asset Finance. The improved asset margin on lending, combined with an improvement in our cost of funds, drove an increase in net interest margin to 2.95% (2012: 2.14%). A central part of Aldermore’s strategy is funding our lending through retail and SME deposit gathering. Our weighted average cost of funds across the whole portfolio decreased to 1.67% (2012: 2.32%).
Business review
31 December 2013 31 December 2012
Tier 1 capital ratio 11.7% 11.5%
Organic loan originations (£m) 1,709.2 1,199.9
Return on equity 10.9% 0.9%
Net interest margin 2.95% 2.14%
Cost to income ratio 67% 89%
3 Restated for a change in accounting policy for IFRIC 21, as explained in Note 1 of the financial statements.
16 |
Ann
ual R
epor
t & A
ccou
nts
2013
| S
trat
egic
repo
rt

Ask the customer – Invoice Finance
The Water Brands Group owns and manages the Harrogate Spring Water and Thirsty Planet brands, supplying more than 65 million bottles a year to customers. When they were looking for a banking partner that really understood their business and supported their growth ambitions, they chose Aldermore.
“Having worked with our existing bank for more than 10 years, the prospect of moving our working capital finance facilities was not a decision to be made lightly, but the transfer process was efficient and the finance facilities give us a solid financial base to realise our strategic objectives.”
James Cain, Managing Director, Water Brands Group, Harrogate
#peoplewhomade2013

Business review18
| A
nnua
l Rep
ort &
Acc
ount
s 20
13 |
Str
ateg
ic re
port
Operating expenses increased 32% to £65.2 million (2012: £49.4 million) as we continued to invest in strengthening the capacity of our businesses. The increase in the year reflected volume related costs primarily in the Asset Finance and Residential Mortgages divisions where we have seen the strongest growth in lending. Central costs increased 37% to £34.7 million (2012: £25.4 million) largely due to the continued build of our support functions, primarily Risk, Compliance and Finance, in line with the ongoing growth of the Bank. Overall, the cost income ratio improved to 67% (2012: 89%). Full-time equivalent staff numbers increased 27% to 664 (2012: 521) at the year end.
Aldermore continues to apply robust underwriting criteria when originating loans. The charge for losses and provisions increased in the year to £9.8 million (2012: £4.6 million) due to the growth of the business but also the impact of two individually significant fraud cases in SME Commercial Mortgages and Invoice Finance. Consequently, the bad debt ratio increased in 2013 to 0.36% of lending assets (2012: 0.29%). However, excluding the impact of these two cases, the underlying performance across the business was stable, reflecting the consistency of underwriting and credit quality of our organic originations.
Aldermore’s profit before tax for 2013 was £22.4 million (2012: £1.5 million), resulting in a return on equity of 10.9% (2012: 0.9%), calculated on average of opening and closing shareholders’ funds. Excluding the impact of capital raised in late December 2013 of £38 million, the Bank’s return on equity was 11.9%.
In 2013 there was a tax credit of £1.0 million (2012: £nil). This represented the net effect of corporation tax on the taxable profit in the year of £2.5 million (2012: £nil), offset by deferred tax assets of £3.5 million (2012: £nil) relating to timing differences on capital allowances, and brought forward tax losses whilst the business has been growing.
Balance sheet review
2013 (£m)Restated 2012 (£m) Change (%)
Assets
Cash and balances at central banks 192.8 1.7 11,241%
Loans and advances to banks 223.9 83.1 169%
Loans and advances to customers 3,370.8 2,059.6 64%
Debt securities 339.4 312.2 9%
Intangible assets 7.0 7.5 (7%)
Tangible fixed assets 12.9 11.4 13%
Other assets 47.5 44.1 8%
Total assets 4,194.3 2,519.6 66%
Liabilities
Due to banks 384.3 115.1 234%
Customers’ accounts 3,444.4 2,141.2 61%
Other liabilities 73.1 56.9 28%
Subordinated notes 35.1 34.1 3%
Total liabilities 3,936.9 2,347.3 68%
Shareholders’ funds 257.4 172.3 49%
Building a strong, simple and transparent balance sheetAldermore is focused on delivering a strong, sustainable franchise whilst maintaining rigorous control over the quality of our assets. During 2013 total assets increased by 66% to £4,194.3 million (2012: £2,519.6 million) driven by strong growth in loans across all our business lines. Our customer loans and high quality liquid assets held to meet the liquidity requirements of our operations, including cash and government securities, account for 96.5% of Aldermore’s total assets (2012: 94.9%).
Loans and advances to customers increased 64% to £3,370.8 million (2012: £2,059.6 million), accounting for 80% of total assets. We are committed to maintaining the high quality of our loan book through the application of consistent lending principles supported by underwriting expertise based on in-depth knowledge of the customer and the underlying asset on which our lending is secured.
Aldermore has maintained consistent and prudent loan-to-value ratios, closely monitoring these against market movements. The discipline we apply to each stage of the lending process allows the credit quality of our assets to be maintained as the balance sheet grows significantly. Our lending varies from short term invoice financing to medium term fixed rate mortgages and has a contractual average maturity of 136 months.
We hold liquidity principally in the form of high quality liquid assets. In the year, cash and loans and advances to banks increased to £416.7 million (2012: £84.8 million), reflecting an increase in deposits at the Bank of England to £192.8 million (2012: £1.7 million) and cash on deposit to £223.9 million (2012: £83.1 million). Overall, non-trading debt securities, including supranational bank bonds, gilts and asset backed securities, increased to £339.4 million (2012: £312.2 million). The additional investments were made to increase the level of liquidity in the Bank, in line with its regulatory requirements.
At 31 December 2013, the Bank held a 19.3% liquidity buffer, up from 18.2% in 2012 (liquid assets excluding encumbered cash as a percentage of total funding liabilities). Based on the liquidity buffer held, the Bank has sufficient liquidity to meet its day to day cash flow needs, with consideration being given to both normal and stressed conditions as well as internal and regulatory liquidity requirements.
Our liabilities principally reflect funding for the loan book in the form of retail and small business deposits. Retail deposit products are offered to consumers and small businesses via the internet with telephone and postal support, and in the year deposits by customers increased 61% to £3,444.4 million (2012: £2,141.2 million).
We have continued to make use of the Funding for Lending Scheme (FLS), a scheme launched by the Bank of England and HM Treasury in 2012 which provides loans to banks and building societies with the aim of stimulating lending within the economy. The Bank has pre-positioned £822.9 million of residential and commercial mortgages with the FLS, which are available for use as collateral for our participation in the FLS (2012: £647.6 million). At 31 December 2013 the Bank had FLS drawings of £485.0 million (2012: £205.0 million).
Total Shareholders’ funds increased by 49% in 2013 to £257.4 million (2012: £172.3 million), reflecting retained profit for the year of £23.4 million (2012: £1.5 million) and the premium on shares issued in the year of £61.6 million (2012: £1.7 million) representing investment via subscription of equity share capital by the Bank’s immediate parent company, Aldermore Holdings Limited.
In the year, Core Tier 1 capital increased by 52% to £250.4 million (2012: £164.8 million), reflecting the profit attributable to shareholders and other positive movements in reserves. Our Core Tier 1 capital ratio remained broadly in line with 2012 at 11.7% (2012: 11.5%). Risk weighted assets increased by 50% in 2013 to £2,146.6 million (2012: £1,427.3 million), as a result of the substantial growth in the loan book. The average risk weighting on our assets has remained stable at 48.0% (2012: 52.0%), reflecting the consistency of our underwriting approach and business mix. This robust capital management has, and will continue, to enable us to grow our business in a controlled, prudent and sustainable way.
Investment in the business systems and support structureFixed asset additions in the year of £5.3 million (2012: £6.3 million) were mainly focused on new IT systems and infrastructure.
Strategic report | A
nnual Report &
Accounts 2013 | 19

#peoplewhomade2013
“The people that made Aldermore such a success are the people that go the extra mile day in, day out in their roles. Whether on the senior management team or a in a more operational role, there is no difference in the application and dedication to exceed customer expectations. The key to our success is employing the right people with the right attitude and commitment to the cause.”
Nick Hughes Aldermore Senior Underwriter
#peoplewhomade2013

To provide a better understanding about our business in this strategic report, the Bank is broken down into four lending divisions, all of which are supported by Central Functions.
2013Residential
Mortgages (£m)SME Commercial
Mortgages (£m) Asset Finance (£m) Invoice Finance (£m)
Net interest income 28.6 23.4 28.0 5.0
Other income 5.2 2.1 (3.5) 18.3
Total income 33.8 25.5 24.5 23.3
Directly attributable administrative expenses (6.9) (4.8) (9.0) (14.0)
Provision for bad and doubtful debts (0.6) (1.3) (2.3) (5.6)
Provisions for liabilities and charges – – (0.5) –
Segmental profit 26.3 19.4 12.7 3.7
Loans and advances to customers, net of provisions 1,683.6 765.0 710.2 212.0
Loan origination 739.5 291.9 609.8 68.0
2012Residential
Mortgages (£m)SME Commercial
Mortgages (£m) Asset Finance (£m) Invoice Finance (£m)
Net interest income 8.1 11.3 14.0 3.3
Other income 2.9 1.2 (1.7) 18.8
Total income 11.0 12.5 12.3 22.1
Directly attributable administrative expenses (4.7) (3.9) (5.1) (13.1)
Provision for bad and doubtful debts (0.4) (0.7) (1.0) (2.5)
Provisions for liabilities and charges – – – –
Segmental profit 5.9 7.9 6.2 6.5
Loans and advances to customers, net of provisions 957.3 548.2 375.4 178.7
Loan origination 536.6 231.8 349.7 81.8
Divisional performance S
trategic report | Annual R
eport & A
ccounts 2013 | 21

Residential Mortgages
2013 (£m) 2012 (£m) Change (%)
Net interest income 28.6 8.1 253%
Other income 5.2 2.9 79%
Total income 33.8 11.0 207%
Directly attributable administrative expenses (6.9) (4.7) 47%
Provision for bad and doubtful debts (0.6) (0.4) 50%
Segmental profit 26.3 5.9 346%
Loans and advances to customers, net of provisions 1,683.6 957.3 76%
Loan origination 739.5 536.6 38%
The Residential Mortgages business grew substantially in 2013, helping over 5,000 customers and increasing our lending by 76% to £1,683.6 million (2012: £957.3 million) through our broker and direct to consumer channels. In June, we expanded into the Scottish housing market for residential and buy-to-let properties. Included in the growth for 2013 was the acquisition of a £125.3 million portfolio of residential mortgages.
Aldermore was amongst the first adopters of the government’s Help-To-Buy scheme in December 2013, a guarantee scheme enabling customers to buy or re-mortgage homes where only a small deposit was available. Total income increased 207% to £33.8 million (2012: £11.0 million), due to the increase in gross loans in the year, resulting in a segmental profit of £26.3 million (2012: £5.9 million).
The quality of our lending was maintained during 2013 as provisions for bad and doubtful debts rose from £0.4 million to £0.6 million representing a loan loss ratio of 0.05% (2012: 0.05%).
SME Commercial Mortgages
2013 (£m) 2012 (£m) Change (%)
Net interest income 23.4 11.3 107%
Other income 2.1 1.2 75%
Total income 25.5 12.5 104%
Directly attributable administrative expenses (4.8) (3.9) 23%
Provision for bad and doubtful debts (1.3) (0.7) 86%
Segmental profit 19.4 7.9 146%
Loans and advances to customers, net of provisions 765.0 548.2 40%
Loan origination 291.9 231.8 26%
Our SME Commercial Mortgage lending targets first charge, low loan-to-value loans, primarily against commercial/industrial premises, professionally managed residential buy-to-let portfolios, and retail premises. In addition, we finance a modest amount of property development with a focus on residential development by established regional developers with a proven franchise.
Our SME Commercial Mortgages business originated £291.9 million in 2013 (2012: £231.8 million). To achieve this level of growth we made an investment in our people and systems, growing our team of experts and enabling brokers to progress their deals quickly on behalf of customers. We also extended our lending to the private rental sector, supporting landlords in the buy-to-let market and continued to work closely with the National Association of Commercial Finance Brokers to support finance SME’s.
Total lending for SME Commercial Mortgages stands at £765.0 million, an increase of 40% from 2012 (£548.2 million). Total income increased
22 |
Ann
ual R
epor
t & A
ccou
nts
2013
| S
trat
egic
repo
rt
Divisional performance

Strategic report | A
nnual Report &
Accounts 2013 | 23
104% to £25.5 million (2012: £12.5 million) and segmental profit increased to £19.4 million (2012: £7.9 million). The loan loss ratio has deteriorated to 0.20% (2012: 0.16%) due to the impact of a third party fraud on completion of a mortgage. However this was substantially offset by recoveries on loans previously provided. On an underlying basis the credit performance in this book remains stable.
Asset Finance
2013 (£m) 2012 (£m) Change (%)
Net interest income 28.0 14.0 100%
Other income (3.5) (1.7) 106%
Total income 24.5 12.3 99%
Directly attributable administrative expenses (9.0) (5.1) 76%
Provision for bad and doubtful debts (2.3) (1.0) 130%
Provisions for liabilities (0.5) – –
Segmental profit 12.7 6.2 105%
Loans and advances to customers, net of provisions 710.2 375.4 89%
Loan origination 609.8 349.7 74%
2013 was a year of strong growth for our Asset Finance team, who originated £609.8 million in the year (2012: £349.7 million), up 74% and grew the balance sheet to £710.2 million (2012: £375.4 million) and over 20,000 contracts. In doing so, the business capitalised on the £1.2 billion market opportunity presented by ING Lease (UK)’s withdrawal from the broker market due to the EU deleveraging pressure. The business has firmly established itself as a strong player in the broker-driven asset finance market place to support UK SME’s funding needs through a growing network of dealers, vendors and brokers.
We successfully broadened our broker proposition and established an agricultural finance offering during the year. Investment in our people supported this significant growth with the Asset Finance team growing by nearly double in size. We also invested in our technology and infrastructure to make it easier for both intermediaries and customers to do business with us. As a result, total income almost doubled to £24.5 million (2012: £12.3 million). The charge for impairments rose to £2.3 million in the year, representing a loan loss ratio of 0.42%, up marginally from 2012 (0.36%) as we strengthened our collective provisions. A provision of £0.5 million was also raised to cover a small number of contracts and statements which were not compliant with the Consumer Credit Act (CCA) following an industry wide challenge from the Office of Fair Trading (OFT). After these changes, segmental profit increased to £12.7 million (2012: £6.2 million).
Invoice Finance
2013 (£m) 2012 (£m) Change (%)
Net interest income 5.0 3.3 52%
Other income 18.3 18.8 (3%)
Total income 23.3 22.1 5%
Directly attributable administrative expenses (14.0) (13.1) 7%
Provision for bad and doubtful debts (5.6) (2.5) 124%
Segmental profit 3.7 6.5 (43%)
Loans and advances to customers, net of provisions 212.0 178.7 19%
Loan origination 68.0 81.8 (17%)
Our Invoice Finance business funded client turnover of £2.4 billion in 2013, an increase of 33% on the same period last year. Our lending to clients increased by 19% to £212.0 million (2012: £178.7 million) with client numbers up by 7%.

24 |
Ann
ual R
epor
t & A
ccou
nts
2013
| S
trat
egic
repo
rt
Divisional performance We have consolidated our support functions into two operating centres and now have seven commercial centres focusing on developing multi-channel origination and improving the client service experience. We established a specialist finance division which will help to develop our product offering and simplify our overall invoice finance proposition.
Total income grew by 5% to £23.3 million (2012: £22.1 million), with segmental profit dropping to £3.7 million (2012: £6.5 million). The segmental profit decreased due to higher bad debt charges, primarily driven by a small number of client facilities which contained an element of fraud which makes recovery uncertain with respect to timing and
value. Following a thorough review of the business line, certain control improvements have been identified and implemented, with further improvements being made following the year end. The improvements in client audits, risk management processes and controls should reduce the risk of future losses arising from bad and doubtful debts, including fraud.
Funding through customer deposits Our savings businesses grew strongly in 2013 with total balances increasing by 61% to £3.4 billion.
Retail deposits
We now look after the savings of over 100,000 retail customers, an increase of 23.9% since December 2012. New inflows amounted to £2.1 billion and balances retained from maturing fixed rate accounts reached £785 million. Over 70% of customers with maturing fixed rate term deposits chose to reinvest their funds with us for a further period.
Our retail savers value the simplicity and convenience of our savings proposition, underlined by the strongly positive customer feedback we receive. Our products are simple, transparent and easy to open and service. We do not offer ‘teaser’ or bonus-type products.
SME deposits
Our business savings products proved attractive to SMEs looking for better returns. We have developed an innovative service proposition, enabling SMEs to open and fund an account on-line in under 15 minutes. We’ve been pleased with the response from SMEs. By the end of December 2013 we had over 7,000 SME customers, with balances totalling £516 million (up over 400% since end 2012). We continued to innovate with the launch of our Customised Fixed Rate Account. This proposition enables customers to select the exact maturity dates and interest rates to suit their saving needs.

#peoplewhomade2013
“Working for Aldermore has not only given me the opportunity to develop my own skills, but has also allowed me to contribute towards shaping the culture and values that the Bank stands for. I am passionate about being part of a motivated and happy team that continues to provide a level of service for our customers that is unaffected by increasing business volumes.”
Adrian Brocklehurst Aldermore Senior Underwriter
#peoplewhomade2013

Digital experienceOver 80% of retail savings applications and over 90% of SME savings applications are now taken online; and customers can apply or get in touch directly online for all business lines. During 2013 we introduced a new Invoice Finance site with a ‘quick quote’ tool and an enhanced site for Residential Mortgages with ‘live chat’ capabilities. These measures helped to drive a 67% increase in visits to our website, which registered over 1.5 million hits in 2013. A number of key developments were also undertaken to expand our core capability and strengthen the brand, including customer “Ratings and Reviews”, “Ask and Answer”, user generated stories, “Aldermore Resource Centre”, the Aldermore newsletter, a centralised login centre for our customers and a tablet optimised website. We continue to invest in the infrastructure with the aim of delivering an increasing quality of product, service and support as we continue to build a digital bank.
Ratings and ReviewsWe believe that transparency is key to providing our customers with exceptional service. So in 2013 we began publishing un-edited ratings and reviews on our website. These offer customers independent insight into our products and services. The reviews also provide us with valuable feedback to help us improve our processes.
When our customers leave a review they are asked whether they’d be willing to recommend the product and 98% of customers answered positively to this question during 2013.
Ask and AnswerOur new online Ask and Answer service was also launched this year and enables customers to submit questions which will either be answered by Aldermore or by another customer. In addition, as part of Small Business Saturday, a UK-wide campaign dedicated to small businesses, we encouraged our SME customers to tell us their Small Business Story and then published the winning entry.
Our customers26
| A
nnua
l Rep
ort &
Acc
ount
s 20
13 |
Str
ateg
ic re
port
Retail Savings1,354 reviews and overall star rating of 4.75 out of 5 4.75/5
SME Savings271 reviews and overall star rating of 4.75 out of 5 4.75/5
Invoice Finance9 reviews and overall star rating of 4.85 out of 5 4.85/5
Delivering exceptional service is vital to our business – it helps differentiate us from our competitors, and attract and retain customers.

Turning feedback into actionIn total we received almost 3,500 pieces of feedback from our customers in 2013, enabling us to make a number of improvements. For example, some of our savings customers pointed out that when making the first transfer to their new account, the payment options available on the form weren’t clear enough. We responded by altering our savings application form to make it more transparent, communicating the change back to customers, then monitoring their response to check that it had been effective. The responses we continue to secure through this digital channel underline how much our customers value the Aldermore product and service offering.
ComplaintsWe take complaints seriously. Each one is investigated and responded to directly by the relevant business line and then reported monthly to our Executive Committee. The total number of complaints received during 2013 was 1,166 which are broken down below by category. We continue to focus on understanding the root causes of all complaints and continually improving our processes to reduce them.
General administration or customer service 49%
Advising, selling and arranging 19%
Terms and disputed sums or charges 19%
Arrears 4%
Other 9%
Strategic report | A
nnual Report &
Accounts 2013 | 27

Awards28
| A
nnua
l Rep
ort &
Acc
ount
s 20
13 |
Str
ateg
ic re
port
Residential Mortgagesz FT Financial Adviser – 5 Star Service award 2013, 2012, 2011
z Mortgageforce – Best Specialised Lender 2013, 2012, 2011
z The Mortgage Strategy – Best Specialised Lender 2013, 2012
z Finance Gazette – Best Buy to Let Lender 2013, 2012
z Personal Finance – Best Buy to Let Mortgage Provider 2013
z Pink home loans – Best Specialised Lender 2013, 2011
z Your Mortgage – Best Intermediary Mortgage Lender 2013, 2012
z What Mortgage – Best Specialist Product Provider 2013
z Moneyfacts – Best Service from a BTL Mortgage Provider 2013
SME Commercial Mortgagesz Bridging and Commercial – Best Commercial Proposition
z The National Association of Commercial Finance Brokers – Best Buy-to-Let Lender and Most Supportive Lender
The Bank has been highly recognised by both industry and customer bodies, including the following awards:

Asset Financez Credit Today – Asset Finance Firm of the Year 2013
Invoice Financez Yorkshire Insider Deal Makers Award
– Asset Based Lender of the Year 2013
Retail depositsz Consumer Moneyfacts – ISA Provider of the year,
4 consecutive years (2011-2014)
z Your Money – Best Online Savings Account Provider 2013, Best Online Cash ISA Provider
z Moneyfacts – Best Bank Savings Provider 2013, Best No Notice Account 2013
z Personal Finance – Best Cash ISA 2013
SME depositsz Savings Champion – Best Business Savings Account
Provider 2014
z Also nominated for 2 innovation awards in 2014 by Business Moneyfacts
COMMERCIAL MORTGAGES
NACFB – Best Buy-to-Let
Lender
RESIDENTIAL MORTGAGES
FT Financial Adviser – 5 Star Service award
INVOICE FINANCE
Yorkshire Insider Deal Makers
Award – Asset Based Lender of
the Year
SAVINGS
Consumer Moneyfacts –
ISA Provider of the year
RESIDENTIAL MORTGAGES
Mortgageforce – Best Specialised
Lender
ASSET FINANCE
Credit Today – Asset Finance
Firm of the Year
Strategic report | A
nnual Report &
Accounts 2013 | 29

Our people 30
| A
nnua
l Rep
ort &
Acc
ount
s 20
13 |
Str
ateg
ic re
port
Dynamic growth depends on dynamic people. We increased our permanent headcount by 27% in 2013, and nearly doubled the size of our Asset Finance team in Reading in response to the opportunities in that market. We plan further expansion into new locations and offices to support our growth strategy in 2014.
Our ability to retain and develop talented people can be seen in the fact that 29% of our vacancies were filled internally; but we continued to focus on this area with new career development initiatives in 2013. We use our yearly employee feedback surveys to gauge employee satisfaction and provide ideas for improvement, as we move towards our ambition of earning external recognition for Aldermore as a great place to work. It is clear that our people are excited by the Bank’s vision, the fact that we are building a new bank that is challenging the competition, championing the causes of our customers, and building a bank to be proud of.
We are committed to maintaining an engaged and motivated workforce. For managers, key initiatives included creating a Manager Community Space on our intranet to provide additional training and development materials, and ‘Train the Trainer’ workshops to deliver more local and on-demand training. We also raised awareness about our employee assistance programme which provides guidance and advice for staff and their families. Our ‘walk the walk’ initiative promoted health and fitness through a walking challenge and was supported by many of our offices across the UK.
Equal opportunities for disabled peopleThe Bank is committed to ensuring that disabled people are afforded equality of opportunity in respect of entering and continuing employment within the business. This includes all stages from recruitment and selection, terms and conditions of employment, access to training and career development.
Employee diversityThe Bank is committed to diversity and encourages equality of opportunity for all.
Employee communication In 2013 the Bank significantly increased communication activity to employees.
We evolved the Internal Communications framework introduced in 2012 to ensure the Bank remains focused on communicating strategic and performance updates to staff in a transparent and timely manner. The Bank has a digital ethos at its core and as such there’s a desire to embrace social networking which led to the introduction of Yammer in 2013.
Yammer is a leading enterprise social network for businesses and helps bring our people together and encourage a social culture across the Bank. Yammer also fosters an environment for two-way feedback and collaboration across our different offices and business lines. We saw 76% of employees sign up to Yammer within the first six months. A comprehensive CEO and Executive Committee site visit programme was also introduced in 2013 with 82% of staff indicating it was a valuable form of face-to-face communication and would like to see this increased in 2014.

Supporting local communities where we work and live
We maintain active programmes of engagement with local communities, encouraging all our staff to take part in initiatives and regularly matching the funds they raise for charities.
£ 4 £ scheme
By matching the charitable commitment of our people we encourage them to be active in the community and increase the value of their efforts. In 2013, we donated £5,300 to charities and causes important to our people as part of our £ 4 £ scheme. In addition we also contributed more than £1,000 to local charities during the Christmas period.
Charities supported through our £ 4 £ scheme in 2013 included Children in Need, where fundraising activities at our Reading office included a silent auction and bake sales; and the Great Ormond Street Hospital Children’s Charity and Breast Cancer Care, for which our Twickenham, Glasgow and Manchester offices organised fundraising activities such as ‘Pink Fridays’ and a ‘Bake Off’ between offices.
Our Manchester office took part in the Factory 100 Business Challenge, organising a Village Fete day to raise much-needed funds for the Factory Youth Zone which offers leisure, mentoring, employability and enterprise programmes to support disadvantaged young people.
SKILL!
In 2013 we supported the training and development of budding young entrepreneurs through our involvement with the SKILL! programme, a series of interactive workshops for students aged 14-16. The workshop is designed to teach students the valuable skills they need on top of their academic ones such as communication, working together as part of a team and presentation skills.
More than 40 of our people volunteered their time to act as corporate mentors to over 170 students at the workshops held in Manchester, Reading and Birmingham. We also held an online competition asking our Twitter followers to vote for the best student idea and awarded the winning school a cash prize of £1,000 to donate to a local charity or community project of their choice.
Our communitiesS
trategic report | Annual R
eport & A
ccounts 2013 | 31
Risk Management32
| A
nnua
l Rep
ort &
Acc
ount
s 20
13 |
Str
ateg
ic re
port
A core objective for the Bank is the effective management of risk. Given the nature of the activities undertaken, the principal risks faced are credit risk, interest rate risk, liquidity and funding risk, regulatory risk and operational risk. Each risk has a detailed documented policy and is overseen by a robust governance process including regular and detailed management information. The Chief Risk Officer is responsible for ensuring each risk is adequately monitored, managed and mitigated. A detailed analysis of all key risks has been documented in the Internal Capital Adequacy Assessment Process report, which has been approved by the Board.
The Board has ultimate responsibility for setting the Bank’s strategy, risk appetite and control framework and key risks are reviewed at the Board meetings. The Bank has an Audit and Risk Committee which meets on a quarterly basis. The committee monitors and considers the internal control environment focusing on operational risks, internal and external audits and compliance matters.
The principal categories of risk facing the Bank are regulatory risk, operational risk, credit risk, market risk and economic risk. A description of regulatory and operational risk and how they are managed is set out below. Further details of the Risk Management framework and how the Bank measures and manages the risks associated with lending and financial instruments are detailed in Note 37 to the financial statements.
Regulatory risk
Regulatory risk is the risk that the Bank does not adhere to the changing regulatory environment in which it operates. Key changes on the horizon include the implementation of those recommendations made by the Independent Commission on Banking reforms which the UK government chooses to bring into law, the replacement of Basel II by CRD IV (Basel III) and the impact upon the Bank’s capital base (see Capital Management disclosures in the Directors’ report), and the practical impact of the

Mortgage Market Review. The Bank has allocated resource to ensure continued regulatory compliance and the directors consider the Bank is compliant with the new requirements.
Operational risk
Operational risk is the risk of loss resulting from inadequate or failed internal processes, people and systems or from external events. This risk includes IT, information security, project, outsourcing, tax, legal, fraud and compliance risks. The Board has defined its operational risk appetite, and the Bank operated within this appetite during the year. Through the establishment of, and investment in, sound systems, controls and audit functions, the Bank minimises operational failures. The Operating Committee meets monthly to ensure that a quality and robust IT, operations and compliance service is delivered at all times and is capable of supporting the changing business requirements of the Bank. It has responsibility for monitoring all the key operational risks facing the organisation, including compliance and operational risks.
Principal risks and uncertainties
As a growing bank, a key risk is maintaining a sound operating environment. Therefore the Board considers and reviews regularly operational risks and emerging risks which relate to the Bank’s business model and plans. As part of this the Board reviews key risk registers which cover both operational and strategic risks. The key strategic risks which the Bank currently faces include:
z Originating loan assets of a quality consistent with the Bank’s risk appetite. The quality and performance of the loan portfolios are actively monitored using key performance indicators and credit scores to ensure that the performance of the existing portfolio remains within expectations and that the quality of new lending is consistent with existing loan assets
z Maintaining a sufficient net interest margin having regards to the competitive and economic environment. We actively track the margins at which both new lending is originated and deposits are raised, as well as the product mix of lending and funding, against our business plan. Our pricing models ensure that lending margins appropriately reflect the full cost of raising funds, including liquidity and hedging costs. The Bank’s exposure to changes in interest rates is mitigated through conservative hedging policies and limits, with regular stress testing carried out
z Ensuring the Bank’s operating environment remains robust and keeps pace with the growth plans and customer base of the business. We continually invest in our systems and controls which includes the use of an Enterprise Risk Management system which allows the Bank to effectively manage operational risks through detailed operational risk registers and control monitoring
z Ensuring that the Bank’s plans appropriately reflect the impacts of the emerging regulatory agenda. We regularly perform stress testing on the adequacy of the Bank’s capital and liquidity position to assist in managing this risk. Our forecasts take into account known regulatory developments and the Bank’s business plan includes conservative transitional assumptions
This report was approved by the Board and was signed on its behalf by:
James MackChief Financial Officer Aldermore Bank PLC 1 April 2014
Strategic report | A
nnual Report &
Accounts 2013 | 33

#peoplewhomade2013

Corporate governanceC
orporate governance | Annual R
eport & A
ccounts 2013 | 35
Standards for good practice are laid out in the UK Corporate Governance Code (the Code) and are the responsibility of the Board of Directors (the Board). Our Board is fully committed to ensuring that these standards are applied across our business in a way that is appropriate to our size and unlisted status.
Corporate governance framework
The Board
Nomination Committee
Remuneration Committee
Executive Committee
Board Credit Committee
Audit & Risk Committee
The BoardThe principal objectives of the Board are to ensure that the business of the Bank is conducted in an efficient and effective manner which promotes its success, within a robust framework of systems of internal control, risk management and compliance, and in accordance with all relevant statutory and regulatory requirements.
The Board is made up of nine members: the Chairman, five Executive Directors and three Non-Executive Directors. Details of the Directors in office at the date of this Annual Report are set out in the Director’s report on page 39.
There are various matters reserved for the Board, a number of which also require shareholder consent; day-to-day operational decisions are made by the Chief Executive Officer assisted by the Executive Committee.

36 |
Ann
ual R
epor
t & A
ccou
nts
2013
| C
orpo
rate
gov
erna
nce
The primary responsibilities of the Board include:
z setting the Bank’s strategy, taking into account stakeholder interests
z ensuring that the business has an effective system of internal controls and management of business risks and is conducted in accordance with the PRA’s principles of business
z monitoring financial information and reviewing the overall financial condition of the Bank and its position as a going concern
z reviewing major developments in business lines and support units
z monitoring of compliance and reputational issues
z reviewing the market, credit and liquidity risks and exposures
z reviewing the priorities for allocating capital and operating resources
z approving all individual transactions of 5% or more of the Bank’s capital base
z reviewing operational performance against strategic objectives and related strategic plans
Audit and Risk CommitteeThe Committee is made up of three Non-Executive Directors all of whom have relevant financial experience: John Callender (interim Chairman), Peter Cartwright and Chris Stamper. At the invitation of the Chair of the Committee, other Directors, the Internal Audit Director and representatives from the risk and finance functions regularly attend meetings.
The primary responsibilities of the Committee are to:
z encourage and safeguard the highest standards of integrity, financial reporting, corporate governance, risk management and internal control
z review and challenge the actions and judgements of management in relation to financial reporting
z review procedures for detecting fraud and the effectiveness of systems for internal financial control, financial reporting and risk management
z review the Internal Audit programme and ensure that the Internal Audit function is adequately resourced and has appropriate standing within the Bank
z consider the appointment, reappointment and removal of the external auditor, their effectiveness and independence and review regularly the findings of their work
z review and approve the risk management reporting framework
Board Credit CommitteeThe Committee is made up of three Non-Executive Directors – John Callender (interim Chairman), Chris Stamper and Peter Cartwright, and two Executive Directors – Phillip Monks (Chief Executive Officer) and Stephen Barry (Chief Risk Officer).
The purpose of the Committee is to oversee all credit risks, ensuring that the Bank operates within its stated risk appetite. The primary responsibilities of the Committee are to:
z review and approve credit policies
z review lending product performance
z monitor large exposures and provisioning for non-performing loans
z monitor portfolio and sector concentration risks
z monitor business growth
z monitor credit quality trends
Corporate governance

Corporate governance | A
nnual Report &
Accounts 2013 | 37
Executive CommitteeThe Committee is made up of six members: the Chief Executive Officer, Chief Financial Officer, Chief Operating Officer, Chief Risk Officer, Group Commercial Director and Group Human Resources Director.
The purpose of the Committee is to assist the Chief Executive Officer in the performance of his day-to-day duties. The Committee, whilst retaining ultimate responsibility for the actions taken, has at its discretion delegated certain responsibilities to the following sub-committees:
z Group Operating Committee
z Management Credit Committee
z Asset and Liability Committee
z Mortgages Division Board
z Commercial Finance Division Board
z Retail and Business Savings Board
Remuneration CommitteeThe Committee is made up of three Non-Executive Directors: John Callender (interim Chairman), Chris Stamper and Peter Cartwright.
The purpose of the Committee is to determine and agree with the Board the policy for remuneration of the Bank’s Executive Directors and members of the Executive Committee. The objective of the remuneration policy is to ensure that appropriate incentives are awarded for individual contributions to the success of the Bank and encourage enhanced performance.
The primary responsibilities of the Committee are to:
z review the appropriateness and relevance of the remuneration policy
z determine and review regularly the policy, terms, objectives and content of Executive Directors’ service contracts
z approve the design of and determine targets for any performance-related pay schemes applying to the Executive Directors
z determine the policy and scope of pension arrangements for the Executive Directors
z oversee any major changes to the Bank’s employee benefits structures
Nominations CommitteeThe Committee is made up of three Non-Executive Directors: John Callender (interim Chairman), Peter Cartwright and Jayne Almond, who stepped down as a Committee member on 16 January 2014. The purpose of the Committee is to ensure that the Board comprises individuals with the necessary skill, knowledge and experience to discharge effectively its responsibilities.
The primary responsibilities of the Committee are to:
z identify and nominate, for approval by the Board, candidates for appointment to the Board and its committees
z regularly review succession planning
z regularly review the structure, size and composition of the Board

Ask the customer – Commercial Mortgages
Property developer John Hesler had been working for a range of clients but decided the time was right to strike out on his own. Having identified a commuter belt site with great potential he applied to Aldermore for a property development loan in order to build 10 apartments.
“Being in the construction industry for 15 years, I have worked with many companies. However I have been particularly impressed with Aldermore’s helpful attitude and knowledge. Given some of the obstacles encountered along the way they did a great job and I would highly recommend them.”
John Hesler, Property Developer, Brentwood, Essex
#peoplewhomade2013

Directors’ report | A
nnual Report &
Accounts 2013 | 39
The directors present their report and the financial statements of Aldermore Bank PLC (‘the Bank’) for the year ended 31 December 2013.
Results and dividendsThe results for the year are set out in the profit and loss account on page 55. The directors do not recommend the payment of a dividend (2012: £nil).
Principal activities and business reviewThe Bank is authorised to accept deposits under the Financial Services & Markets Act 2000 and the Bank’s principal activities during 2013 were the provision of banking and related services. The profit before taxation for the year ended 31 December 2013 was £22.4 million (2012: £1.5 million4). As at 31 December 2013 the Bank had 664 employees (2012: 521).
The Bank had regulatory Tier 1 capital at 31 December 2013 of £250.4 million (2012: £164.8 million) and a Tier 1 capital ratio of 11.7% (2012: 11.5%).
Strategic reportThe Companies Act 2006 requires the directors to present a strategic report containing a fair review of the business of the Bank during the financial year ended 31 December 2013 and a description of the principal risks and uncertainties facing the Bank. The strategic report can be found on pages 11 to 33.
Capital injections The Bank’s immediate parent company is Aldermore Holdings Limited. During 2013 £61.6 million was invested in the Bank by Aldermore Holdings Limited via subscription of equity share capital.
Going concern The financial statements are prepared on a going concern basis, as the directors are satisfied that the Bank has the resources to continue in business for the foreseeable future. In making this assessment, the directors have considered a wide range of information relating to present and future conditions, including the current state of the balance sheet, future projections of profitability, cash flows and capital resources and the longer term strategy of the business. The Bank’s capital and liquidity plans have been reviewed by the directors and are reported against at least monthly, including stress tests. The Bank’s forecasts and projections show that it will be able to operate at adequate levels of both liquidity and capital for the foreseeable future, including a range of stressed scenarios, taking management actions as appropriate if the additional capital needed to continue the forecast growth strategy is not forthcoming. After making due enquiries, the directors believe that the Bank has sufficient resources to continue its activities throughout 2014 and to continue its expansion, and the Bank has sufficient capital to enable it to continue to meet its regulatory capital requirements as set out by the PRA.
The Bank’s business activities and financial position, together with the factors likely to affect its future development, performance and position are set out in the strategic report on pages 11 to 33.
Directors’ report
4 Restated for a change in accounting policy for IFRIC 21, as explained in Note 1 of the financial statements.
Capital management The Board is required to consider all material risks which the Bank faces and determines whether additional capital is required in order to provide additional protection to depositors and borrowers and to ensure the Bank is sufficiently well capitalised to withstand a severe economic downturn.
The Board manages its internal capital levels for both current and future activities and documents its risk appetite and capital requirements during stress scenarios as part of the Internal Capital Adequacy Assessment Process (“ICAAP”).
The ICAAP represents the aggregated view on risk for the Bank and is used by the Board, management and shareholders to understand the levels of capital required to be held over the near and medium term. The ICAAP is reviewed and refreshed at least annually and following approval by the Board in February 2014 the Bank submitted its last ICAAP to the PRA in February 2014.
The Bank is required to maintain a certain level of capital to meet several requirements:
z To meet minimum regulatory capital requirements
z To ensure the Bank can meet its objectives, including growth objectives
z To ensure the Bank can withstand future uncertainty, such as a severe economic downturn
z To provide assurance to depositors, customers, shareholders and other third parties
The Bank produces regular reports on the current and forecasted level of capital, as well as the results of stress scenarios, to the Board and to the Audit and Risk Committee.
The Bank has complied with all externally imposed capital requirements throughout 2013.
The key assumptions and risk drivers used to create the ICAAP are regularly monitored and reported and any material deviation from the forecast and risk profile of the Bank will mean the ICAAP will need to be up-dated.
The principal risks which are considered as part of the ICAAP are detailed in the Principal Risks and Uncertainties section of the strategic report and in Note 37 to the financial statements.
40 |
Ann
ual R
epor
t & A
ccou
nts
2013
| D
irect
ors’
repo
rt
Directors’ report
4 Restated for a change in accounting policy for IFRIC 21, as explained in Note 1 of the financial statements.

The Bank’s regulatory capital position (Basel II) as at 31 December was as follows:
Directors’ report | A
nnual Report &
Accounts 2013 | 41
2013 £’000
Restated 2012 £’000
Tier 1
Called up share capital 3,300 3,300
Share premium account 233,380 171,822
Capital contribution reserve 2,503 2,339
Profit and loss account 18,216 (5,162)
Less: Intangible assets (7,017) (7,467)
Total Tier 1 capital (all Core Tier 1) 250,382 164,832
Tier 2
Subordinated notes 35,119 34,148
Collective impairment allowance 4,154 2,059
Total Tier 2 capital 39,273 36,207
Total regulatory capital 289,655 201,039
Total risk weighted assets 2,146,579 1,427,275
Key capital ratios
Tier 1 (all Core Tier 1) 11.7% 11.5%
Total Capital 13.5% 14.1%

Transition to CRD IV In June 2013, the European Commission published the final regulation and directive, known collectively as CRD IV, to give effect to the Basel III framework. The objective of the reforms are to improve the banking sector’s ability to absorb shocks arising from financial and/or economic stress, and therefore reduce the risk of spill-over from the financial sector into the rest of the economy. CRD IV legislation was implemented with effect from 1 January 2014.
The key elements of CRD IV are as follows:
z Changes to the definition of capital resources. Over the period 2014 to 2018, there will be changes and additions to capital deductions from Core Tier 1 and Tier 2 capital
z New limits and capital buffers. Higher thresholds for all forms of capital with an increased focus on Core Tier 1, with a potential requirement to hold capital conservation, countercyclical and systemic risk buffers
z Introduction of the Leverage Ratio. The Basel Committee is using a period to 2017 to test a minimum Tier 1 leverage ratio of 3%
The Bank’s capital position at 31 December 2013 calculated on current regulatory rules and also estimated on a pro forma basis, applying the CRD IV rules is shown in the table below. The Group’s capital position is reported in the published financial statements of the Bank’s ultimate parent company, AC Acquisitions Limited. The pro forma CRD IV capital resources and risk weighted assets shown reflect estimates of the impact of the CRD IV rules on both a transitional basis applying the rules applicable as of 1 January 2014, and on a fully loaded basis (referred to as the CRD IV end-point definition in the PRA documentation) which applies the rules without applying any of the transitional provisions.
42 |
Ann
ual R
epor
t & A
ccou
nts
2013
| D
irect
ors’
repo
rt
Directors’ report

At 31 December 2013
Current rules £’000
Pro-forma CRD IV rulesTransitional and fully
loaded estimate
£’000
Common equity Tier 1 (CET1)
Shareholders’ equity per the statement of financial position 257,399 257,399
Regulatory adjustments to CET1
Goodwill and other intangible assets (7,017) (7,017)
Total common equity tier 1 (CET1) 250,382 250,382
Tier 2
Subordinated notes 35,119 35,119
Collective impairment allowance 4,154 4,154
Total tier 2 capital 39,273 39,273
Total capital resources 289,655 289,655
Risk weighted assets 2,146,579 1,992,443
Common equity tier 1 ratio 11.7% 12.6%
Tier 1 capital ratio 11.7% 12.6%
Total capital ratio 13.5% 14.5%
Directors’ report | A
nnual Report &
Accounts 2013 | 43

44 |
Ann
ual R
epor
t & A
ccou
nts
2013
| D
irect
ors’
repo
rt
Directors’ reportLeverage ratio on a CRD IV basis The Basel III reforms include the introduction of a capital leverage measure defined as the ratio of tier 1 capital to total exposures measured on a Group consolidated basis. The purpose of the proposed measure is as a non-risk based backstop limit to supplement the risk based capital requirements and which acts as a constraint on the build-up of excess leverage within the banking sector.
The Basel Committee have proposed that final adjustments to the definition and calibration of the leverage ratio be carried out in 2017, with a view to migrating to a Pillar 1 requirement from 1 January 2018. In the interim, the PRA has asked banks to report an estimated leverage ratio on a fully loaded CRD IV basis to indicate the approximate leverage ratio that the Bank would have now if the CRD IV rules were fully implemented. As required the numerator of the leverage ratio has been calculated using the definition of Tier 1 capital set out in the text of the June 2013 regulation and the exposure measure has been calculated on the basis of the original December 2010 Basel III proposals, as interpreted through guidance issued in 2012.
The Bank’s estimates of its leverage ratio at 31 December 2013 are shown in the table below on two different bases. The Group’s estimates are reported in the published consolidated financial statements of the Bank’s ultimate parent company, AC Acquisitions Limited.
The ‘CRD IV transitional’ basis with Tier 1 capital calculated by applying the CRD IV transitional rules applicable as at 1 January 2014 to the position as at 31 December 2013; and
The ‘CRD IV fully loaded’ basis with Tier 1 capital calculated by applying the CRD IV rules without applying any transitional provisions.

Directors’ report | A
nnual Report &
Accounts 2013 | 45
Pro forma CRD IV rules
At 31 December 2013
Transitional estimate £’000
Fully loaded estimate £’000
Total Tier 1 capital for the leverage ratio
Common equity tier 1 (CET1) 257,399 257,399
Goodwill and other intangible assets (7,017) (7,017)
Total Tier 1 capital 250,382 250,382
Exposures for the leverage ratio
Total statutory balance sheet assets 4,194,338 4,194,338
Removal of accounting value for derivatives and securities financing transactions (2,475) (2,475)
Exposure value for derivatives and securities financing transactions 106,291 106,291
Off balance sheet including unconditionally cancellable commitments 343,652 343,652
Other regulatory adjustments (2,862) (2,862)
Total exposures 4,638,944 4,638,944
Leverage ratio 5.4% 5.4%
Forbearance On occasions, borrowers experience difficulties which impact on their ability to meet their mortgage or commercial finance obligations. The Bank seeks to identify borrowers who are experiencing financial difficulties as well as contacting borrowers whose loans have gone into arrears, consulting with them in order to ascertain the reason for the difficulties, and to establish the best course of action that can be taken to bring the account up to date.
In certain circumstances where the borrower is experiencing significant financial distress, the Bank may use forbearance measures to assist them. These are all considered on a case by case basis and must be in the best interest of the customer. The forbearance measures are undertaken in order to achieve the best outcome for both the customer and the Bank by dealing with financial difficulties and arrears at an early stage.
The most widely used methods of forbearance are reduced monthly payments, loan term extension and a temporary or permanent transfer to interest only payments to reduce the borrowers’ financial pressures. Where the arrangement is temporary, borrowers are expected to resume normal payments within six months. As at 31 December 2013, the Bank had undertaken forbearance measures as follows in each of its lending divisions:
46 |
Ann
ual R
epor
t & A
ccou
nts
2013
| D
irect
ors’
repo
rt
Directors’ report
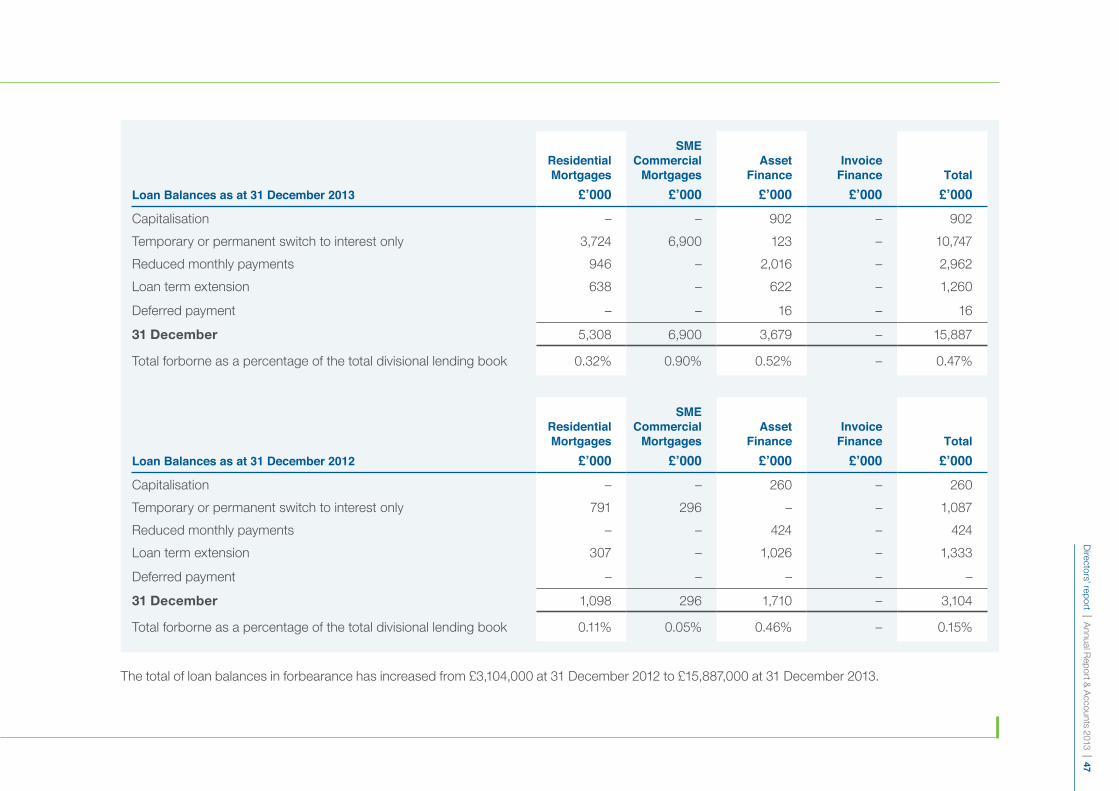
Loan Balances as at 31 December 2013
Residential Mortgages £’000
SME Commercial Mortgages £’000
Asset Finance £’000
Invoice Finance £’000
Total £’000
Capitalisation – – 902 – 902
Temporary or permanent switch to interest only 3,724 6,900 123 – 10,747
Reduced monthly payments 946 – 2,016 – 2,962
Loan term extension 638 – 622 – 1,260
Deferred payment – – 16 – 16
31 December 5,308 6,900 3,679 – 15,887
Total forborne as a percentage of the total divisional lending book 0.32% 0.90% 0.52% – 0.47%
Loan Balances as at 31 December 2012
Residential Mortgages £’000
SME Commercial Mortgages £’000
Asset Finance £’000
Invoice Finance £’000
Total £’000
Capitalisation – – 260 – 260
Temporary or permanent switch to interest only 791 296 – – 1,087
Reduced monthly payments – – 424 – 424
Loan term extension 307 – 1,026 – 1,333
Deferred payment – – – – –
31 December 1,098 296 1,710 – 3,104
Total forborne as a percentage of the total divisional lending book 0.11% 0.05% 0.46% – 0.15%
The total of loan balances in forbearance has increased from £3,104,000 at 31 December 2012 to £15,887,000 at 31 December 2013.
Directors’ report | A
nnual Report &
Accounts 2013 | 47
Directors The directors who held office during the year were as follows:
Phillip Monks *
Jayne Almond (resigned 16 January 2014) ***
Sir David Arculus (resigned 30 July 2013) **
John Baines (resigned 26 February 2013) *
Stephen Barry *
John Callender ***
Peter Cartwright
James Mack (appointed 27 June 2013) *
Paul Myers *
David Soskin ***
Chris Stamper (appointed 29 May 2013) ***
Mark Stephens *
Ian Wilkins (resigned 31 January 2013) *
Subsequent to 31 December 2013, Glyn Jones was appointed as non-executive Chairman with effect from 21 March 2014. Certain directors benefited from qualifying third party indemnity provisions in place during the year ended 31 December 2013 and at the date of this report.
Political donationsThe Bank made no political donations during the year (2012: £nil).
Disclosure of information to AuditorsThe directors who held office at the date of approval of this directors’ report confirm that, so far as they are each aware, there is no relevant audit information of which the Bank’s auditors are unaware; and each director has taken all the steps that he/she ought to have taken as a director to make himself/herself aware of any relevant audit information and to establish that the Bank’s auditors are aware of that information.
AuditorOur auditor, KPMG Audit Plc, has instigated an orderly wind-down of business and is not seeking reappointment. The Board has decided to put KPMG LLP forward to be appointed as auditor and a resolution concerning their appointment will be put to the forthcoming Annual General Meeting of the Bank.
By order of the Board
Phillip MonksDirector and Chief Executive Officer Aldermore Bank PLC 1 April 2014
48 |
Ann
ual R
epor
t & A
ccou
nts
2013
| D
irect
ors’
repo
rt
Directors’ report
* indicates Executive Director ** Chairman *** Independent Non-Executive

#peoplewhomade2013

#peoplewhomade2013
Ask the customer – Residential Mortgages
Rebecca, a secondary school English teacher and Adam, who is a coach builder, had tired of being turned away for a mortgage. Having found the perfect property, they then turned to Aldermore.
“We approached Aldermore who were so helpful and our mortgage adviser, Gemma, was lovely. They really listened and understood our frustrations with the previous lender. They turned our case around really quickly and we were able to buy our dream house. We are absolutely over the moon at finally having a chance to own a property. We’d like to say a big thank-you to Aldermore and particularly to our mortgage adviser Gemma.”
Rebecca Wood, Sandbach, Cheshire
Statem
ent of Directors’ responsibilities | A
nnual Report &
Accounts 2013 | 51
Statement of Directors’ responsibilitiesStatement of Directors’ responsibilities in respect of the Strategic Report, the Directors’ report and the financial statements The directors are responsible for preparing the Strategic Report, the Directors’ report and the financial statements in accordance with applicable law and regulations.
Company law requires the directors to prepare financial statements for each financial year. Under that law they have elected to prepare the financial statements in accordance with UK Accounting Standards and applicable law (UK Generally Accepted Accounting Practice).
Under company law the directors must not approve the financial statements unless they are satisfied that they give a true and fair view of the state of affairs of the Bank and of the profit or loss of the Bank for that period. In preparing these financial statements, the directors are required to:
z select suitable accounting policies and then apply them consistently
z make judgements and estimates that are reasonable and prudent
z state whether applicable UK Accounting Standards have been followed, subject to any material departures disclosed and explained in the financial statements
z prepare the financial statements on the going concern basis unless it is inappropriate to presume that the Bank will continue in business
The directors are responsible for keeping adequate accounting records that are sufficient to show and explain the Bank’s transactions and disclose with reasonable accuracy at any time the financial position of the Bank and enable them to ensure that the financial statements comply with the Companies Act 2006. They have general responsibility for taking such steps as are reasonably open to them to safeguard the assets of the Bank and to prevent and detect fraud and other irregularities.
The directors are responsible for the maintenance and integrity of the corporate and financial information included on the Bank’s website. Legislation in the UK governing the preparation and dissemination of financial statements may differ from legislation in other jurisdictions.
This report was approved by the Board and was signed on its behalf by:
Phillip MonksDirector and Chief Executive Officer1 April 2014

Independent Auditor’s report52
| A
nnua
l Rep
ort &
Acc
ount
s 20
13 |
Inde
pend
ent A
udito
r’s re
port
Independent Auditor’s report to the members of Aldermore Bank PLCWe have audited the financial statements of Aldermore Bank PLC for the year ended 31 December 2013 set out on pages 55 to 94. The financial reporting framework that has been applied in their preparation is applicable law and UK Accounting Standards (UK Generally Accepted Accounting Practice).
This report is made solely to the company’s members, as a body, in accordance with Chapter 3 of Part 16 of the Companies Act 2006. Our audit work has been undertaken so that we might state to the company’s members those matters we are required to state to them in an auditor’s report and for no other purpose. To the fullest extent permitted by law, we do not accept or assume responsibility to anyone other than the company and the company’s members, as a body, for our audit work, for this report, or for the opinions we have formed.
Respective responsibilities of directors and auditorAs explained more fully in the Directors’ Responsibilities Statement set out on page 51, the directors are responsible for the preparation of the financial statements and for being satisfied that they give a true and fair view. Our responsibility is to audit, and express an opinion on, the financial statements in accordance with applicable law and International Standards on Auditing (UK and Ireland). Those standards require us to comply with the Auditing Practices Board’s Ethical Standards for Auditors.
Scope of the audit of the financial statementsA description of the scope of an audit of financial statements is provided on the Financial Reporting Council’s website at www.frc.org.uk/auditscopeukprivate.
Opinion on financial statementsIn our opinion the financial statements:
z give a true and fair view of the state of the company’s affairs as at 31 December 2013 and of its profit for the year then ended;
z have been properly prepared in accordance with UK Generally Accepted Accounting Practice; and
z have been prepared in accordance with the requirements of the Companies Act 2006.
Opinion on other matter prescribed by the Companies Act 2006In our opinion the information given in the Strategic Report and the Directors’ Report for the financial year for which the financial statements are prepared is consistent with the financial statements.

Independent Auditor’s report | A
nnual Report &
Accounts 2013 | 53
Matters on which we are required to report by exceptionWe have nothing to report in respect of the following matters where the Companies Act 2006 requires us to report to you if, in our opinion:
z adequate accounting records have not been kept, or returns adequate for our audit have not been received from branches not visited by us; or
z the financial statements are not in agreement with the accounting records and returns; or
z certain disclosures of directors’ remuneration specified by law are not made; or
z we have not received all the information and explanations we require for our audit.
John Ellacott (Senior Statutory Auditor) for and on behalf of KPMG Audit Plc, Statutory AuditorChartered Accountants, Leeds1 April 2014

#peoplewhomade2013
“Since starting at Aldermore, I have been encouraged to design and implement a career plan to work towards. This has given me the focus to achieve the next step within my career goals through a recent promotion, and I now look forward to being able to support the rest of the team in identifying and taking steps towards their individual career goals.”
Catherine CaseyAldermore Sales Manager
#peoplewhomade2013

Profit and loss account | A
nnual Report &
Accounts 2013 | 55
Profit and loss account
The notes and information on pages 58 to 94 form part of these financial statements.
The profit for the year is derived entirely from continuing activities.
For the year ended 31 December Note
2013 £’000
Restated 2012 £’000
Interest receivable 4 155,953 97,849
Interest payable 5 (75,867) (63,327)
Net interest income 80,086 34,522
Fees and commissions receivable 6 31,149 24,167
Fees and commission payable 7 (16,221) (10,238)
Other operating income 8 6,937 7,102
Gains on disposal of debt securities 18 1,869 3,231
Total operating income 103,820 58,784
Administrative expenses 12 (65,242) (49,424)
Depreciation and amortisation 13 (4,272) (2,767)
Operating profit before impairment losses and provisions 34,306 6,593
Provision for bad and doubtful debts 17 (9,777) (4,644)
Provisions for liabilities 28 (2,111) (483)
Profit on ordinary activities before taxation 14 22,418 1,466
Taxation credit on profit on ordinary activities 15 960 –
Profit on ordinary activities after taxation 23,378 1,466

Statement of total recognised gains and losses
For the year ended 31 December 2013 £’000
Restated 2012 £’000
Profit on ordinary activities after taxation for the year 23,378 1,466
Total recognised gains and losses relating to the financial year 23,378 1,466
Prior year adjustment (as explained in Note 28) 1,369
Total gains and losses recognised since the last annual report 24,747
The notes and information on pages 58 to 94 form part of these financial statements.
The profit for the year is derived entirely from continuing activities.
56 |
Ann
ual R
epor
t & A
ccou
nts
2013
| S
tate
men
t of t
otal
reco
gnis
ed g
ains
and
loss
es

Balance S
heet | Annual R
eport & A
ccounts 2013 | 57
Balance Sheet
At 31 December Note
2013 £’000
Restated 2012 £’000
Assets Cash and balances at central banks 192,844 1,654Loans and advances to banks 16 223,864 83,086Loans and advances to customers 17 3,370,798 2,059,603Debt securities 18 339,445 312,156Intangible assets 20 7,017 7,467Tangible fixed assets 21 12,863 11,386Other assets 22 11,547 22,395Prepayments and accrued income 23 32,508 21,841Deferred tax asset 15 3,452 –Total assets 4,194,338 2,519,588
LiabilitiesDue to banks 24 384,276 115,079Customers’ accounts 25 3,444,392 2,141,198Other liabilities 26 14,707 10,417Taxation 15 2,492 –Accruals and deferred income 27 54,796 45,872Provisions 28 1,157 575Subordinated notes 29 35,119 34,148Total liabilities 3,936,939 2,347,289
Called up share capital 30 3,300 3,300Share premium account 31 233,380 171,822Capital contribution reserve 31 2,503 2,339Profit and loss account 31 18,216 (5,162)
Shareholders’ funds 32 257,399 172,299Total liabilities and shareholders’ funds 4,194,338 2,519,588
Contingent liabilities 34 – –
Commitments 34 343,652 213,639
These financial statements were approved by the Board and were signed on its behalf by:
Phillip MonksDirector and Chief Executive Officer1 April 2014
Registered number: 00947662
The notes and information on pages 58 to 94 form part of the financial statements.

1 Basis of preparation
a) Accounting basis
The financial statements have been prepared under the historical cost convention and are in accordance with applicable United Kingdom law, Accounting Standards (United Kingdom Generally Accepted Accounting Practice), and relevant British Bankers’ Association and Finance and Leasing Association Statements of Recommended Practice. During the year the following changes in accounting policy were adopted:
(i) FSCS – Levies
During the year the Bank changed its accounting policy for the contents of IFRIC 21 on the basis that it is a clarification of IAS 37, and consequently of FRS 12, since FRS 12 is identical to IAS 37. This caused the trigger date for the FSCS levy to change from 31 December each year to the following 1 April which resulted in an £662,000 increase in opening reserves at 1 January 2012 and a reduction in the prior year FSCS levy by £707,000, with a corresponding increase in prior year profit. Details of the prior year adjustment made as a consequence of this are included in Note 28.
(ii) Reclassification of interest receivable and payable on derivatives
In 2013 the Bank amended the presentation of interest on derivatives, which impacts the allocation of amounts between interest receivable and interest payable, but has no impact on net interest income. Under the amended presentation, interest on derivatives is included in interest receivable where the derivative is hedging interest income, and in interest payable where the derivative is hedging interest expense. The previous presentation included net derivative interest income or expense within interest payable, but the revised approach is considered to reflect asset yields more closely. The figures for 2012 have been restated accordingly. Details are included in Note 4 and Note 5.
(iii) Presentation of business segments
In 2013, the Bank amended the presentation of segmental performance in Note 3 to show each lending division as a reportable segment, and to disclose segmental profit before the deduction of common costs. This presentation is more appropriate given the significant growth of the Bank’s activities, and is consistent with the basis on which the Bank’s operating results are reviewed by the Board of Directors. Previously the segmental results were presented for only two distinct business segments: Commercial Finance (comprising Asset Finance and Invoice Finance) and Mortgages (Residential Mortgages and SME Commercial Mortgages, including Property Development). The 2012 segmental performance has also been restated.
b) Going concern
As stated in the Directors’ report, the directors consider that it is appropriate to continue to adopt the going concern basis in preparing the accounts.
c) Areas of significant judgement or estimate
The preparation of these financial statements in conformity with UK Generally Accepted Accounting Practice requires management to make judgements, estimates and assumptions that affect the application of accounting policies and the reported amounts of assets and liabilities at the date of the financial statements and the reported amounts of income and expenses during the reporting period. Although these estimates are based on management’s best knowledge of the amounts, actual results may differ ultimately from those estimates.
The areas involving a higher degree of judgement or complexity, or areas where assumptions and estimates are significant to the financial statements, are disclosed within Note 2 Significant accounting policies, and the detailed notes to the financial statements, which the estimate or judgement relates to as follows:
Notes to the financial statements58
| A
nnua
l Rep
ort &
Acc
ount
s 20
13 |
Not
es to
the
finan
cial
sta
tem
ents

d) Consolidation
The Bank has taken advantage of the exemption, allowed under section 400 of the Companies Act 2006, not to prepare group accounts as it is wholly owned subsidiary of AC Acquisitions Limited a company incorporated in England and is included in the consolidated accounts of AC Acquisitions Limited.
e) Cashflow statement
Under Financial Reporting Standard 1 the Bank is exempt from the requirement to prepare a cashflow statement on the grounds that its ultimate parent company, AC Acquisitions Limited, includes the Bank in its own published consolidated financial statements.
2 Significant accounting policies
a) Finance leases and hire purchase agreements
Interest receivable from finance leases and hire purchase agreements is credited to the profit and loss account to give a constant periodic rate of return after tax on the net cash investment. Investments in finance leases and hire purchase agreements are shown in the balance sheet as assets within loans and receivables, and represent the total rentals receivable less the income allocated to future periods.
Area of judgement or estimate Accounting policy note Financial statement note
Income recognition Note 2 (a), (b), (c), (f), (g) and (n) Note 4 to 8
Provisions for bad and doubtful debts Note 2 (d) Note 17
Taxation including deferred tax and VAT Note 2 (i) Note 15
Impairment of assets Note 2 (l) Note 20 and 21
Carrying value of financial assets and liabilities Note 2 (k), (n) and (s) Note 17, 18 and 29
Provisions for liabilities Note 28
Share based payment transactions Note 2 (t) Note 10
1 Basis of preparation (continued)
c) Areas of significant judgement or estimate (continued)
Notes to the financial statem
ents | Annual R
eport & A
ccounts 2013 | 59

2 Significant accounting policies (continued)
b) Loan agreements
Interest receivable from fixed profile loan agreements is credited to the profit and loss account to give a constant periodic rate of return on the net cash investment over the life of the loan agreement. Interest from revolving loans is credited on an accrued basis. Loan assets in the balance sheet represent the amount of total repayments receivable less the income allocated to future periods, net of provisions for bad and doubtful debts.
c) Invoice financing
Income comprises the amount receivable for the provision of invoice financing services, net of value-added tax, and is recognised as follows:
i) Interest income
The Bank charges its clients interest each day on the balance of their outstanding loan. This interest income is recognised in the profit and loss account as it is added to the clients’ borrowings.
ii) Fee and related income
The Bank charges its clients a factoring fee for managing their sales ledgers. This fee is recognised over the period in which the ledger management service is provided. Other fee income, which includes disbursements, is credited to the profit and loss account when the service has been provided or the disbursement expenditure incurred.
iii) Unallocated cash
This relates to a liability for receipts of unallocated cash, which are held on the Bank’s balance sheet until the expiry of a six-year period. Any unclaimed receipts subsequent to the expiry date are recognised as income.
d) Provisions for loan losses
Provisions for finance agreements and loan losses are based on a regular appraisal of recoverability of all advances.
Specific provision is made against exposures which have been identified as bad or doubtful to reduce the carrying amount, including interest in arrears to net realisable value. The Bank estimates the ultimate net realisable value and incorporates an appropriate forced sale discount and selling costs into that valuation. Bad debts are written-off in part or in full when the extent of loss has been confirmed and there is no realistic or economic prospect of recovery.
A general provision has been provided against loan balances not specifically provided for in order to reflect any losses that have been incurred but not yet identified. In assessing the level of general provisions the Bank uses statistical modelling of historical trends of probability of default, the amount of loss incurred, and the emergence periods between losses being incurred and their identification. The outputs of this modelling are then adjusted for management’s judgement and best estimates as to whether current economic and credit conditions are such that actual losses are likely to be greater or less than suggested by historical statistical trends, including the application of scalars to probabilities of default and adjustments to emergence periods and losses given default. Information used in the statistical models is derived from both the Bank’s historical information and external sources. Default rates, loss rates and emergence periods are benchmarked against actual outcomes to ensure they remain appropriate.
Interest recognition is normally suspended once a customer’s loan is impaired and/or three months or more in arrears.
60 |
Ann
ual R
epor
t & A
ccou
nts
2013
| N
otes
to th
e fin
anci
al s
tate
men
ts
Notes to the financial statements

2 Significant accounting policies (continued)
e) Tangible fixed assets and depreciation
Tangible fixed assets, other than freehold land, are stated at cost less accumulated depreciation and any provision for impairment. Depreciation is provided on all tangible fixed assets, other than equipment held for use in operating leases, at rates calculated to write off the cost of each asset on a straight-line basis over its expected useful life, as follows:
z Fixtures, fittings and equipment – 5 years
z Computer systems – 1 to 5 years
Equipment held for use in operating leases is written down to its estimated residual value on a straight-line basis over the period of the underlying lease agreement.
f) Fees and commissions receivable and payable
Fees and commissions receivable and payable directly incremental to a loan are amortised over the period of the loan to a maximum of five years. Commissions receivable from the sale of third party insurance products are recognised on sale of the product with a provision for future repayment in the event of early termination by the customer.
g) Rentals receivable under operating leases
Rental income from operating leases is recognised on a straight line basis over the lease term of the relevant lease.
h) Foreign currencies
Transactions in foreign currencies are recorded using the rate of exchange ruling at the date of the transaction. Monetary assets and liabilities held at the balance sheet date are translated into sterling at the exchange rates ruling at the balance sheet date. Exchange differences are charged or credited to the profit and loss account.
i) Taxation
Current tax
The charge for taxation is based on the profit for the year and takes into account taxation deferred because of timing differences between the treatment of certain items for taxation and accounting purposes.
Deferred tax
Deferred tax is recognised, without discounting, in respect of all timing differences between the treatment of certain items for taxation and accounting purposes which have arisen but not reversed by the balance sheet date, except as otherwise required by FRS 19.
Value added tax
Most of the activities of the Bank are exempt from Value Added Tax (VAT) meaning output tax does not apply and input tax on purchases is not recoverable. Where output tax is charged or input VAT is incurred, the amounts recognised in the profit and loss account are net of VAT. The amount of irrecoverable VAT is calculated by the Bank applying the partial exemption method it has agreed with HM Revenue & Customs. Irrecoverable VAT is recognised in the profit and loss account within administrative expenses or is capitalised and included within the purchase cost where this relates to tangible fixed assets.
j) Pension costs
The cost of providing retirement pensions is charged to the profit and loss account at the amount of the defined contributions payable for each year. Differences between contributions payable and those actually paid are shown as accruals or prepayments. The Bank has no defined benefit pension scheme.
Notes to the financial statem
ents | Annual R
eport & A
ccounts 2013 | 61

2 Significant accounting policies (continued)
k) Securities
Securities intended for use on a continuing basis in the Bank’s activities are classified as debt securities and stated at cost less provision for any permanent diminution in value.
(i) Asset backed securities
Where asset backed securities are purchased at a discount, the discount is amortised through the profit and loss account on an effective yield basis to give a constant rate of return on the underlying assets.
(ii) Other debt securities
Where other debt securities have been purchased at a premium or discount these premiums and discounts are amortised through the profit and loss account from the date of purchase over the expected remaining life of the investment. An impairment review is undertaken periodically to assess whether there has been any permanent diminution in value.
The amortisation of premium and discounts is included within interest income.
l) Impairment of assets
The carrying amounts of the Bank’s assets are reviewed for impairment when events or changes in circumstances indicate that the carrying amount of the fixed asset may not be recoverable. If any such indication exists, the asset’s recoverable amount is estimated. An impairment loss is recognised whenever the carrying amount of an asset or its income-generating unit exceeds its recoverable amount. Impairment losses are recognised in the profit and loss account unless they arise on a previously revalued fixed asset. An impairment loss on a revalued fixed asset is recognised in the profit and loss account if it is caused by a clear consumption of economic benefits. Otherwise impairments are
recognised in the statement of total recognised gains and losses until the carrying amount reaches the asset’s depreciated historic cost. Impairment losses recognised in respect of income-generating units are allocated first to reduce the carrying amount of any goodwill allocated to income-generating units, then to any capitalised intangible asset and finally to the carrying amount of the tangible assets in the unit on a pro rata or more appropriate basis. An income generating unit is the smallest identifiable group of assets that generates income that is largely independent of the income streams from other assets or groups of assets.
Calculation of recoverable amount
The recoverable amount of fixed assets is the greater of their net realisable value and value in use. In assessing value in use, the expected future cash flows are discounted to their present value using a pre-tax discount rate that reflects current market assessments of the rate of return expected on an equally risky investment. For an asset that does not generate largely independent income streams, the recoverable amount is determined for the income-generating unit to which the asset belongs.
Reversals of impairment
An impairment loss is reversed on intangible assets and goodwill only if subsequent external events reverse the effect of the original event which caused the recognition of the impairment or the loss arose on an intangible asset with a readily ascertainable market value and that market value has increased above the impaired carrying amount. For other fixed assets where the recoverable amount increases as a result of a change in economic conditions or in the expected use of the asset then the resultant reversal of the impairment loss should be recognised in the current period. An impairment loss is reversed only to the extent that the asset’s carrying amount does not exceed the carrying amount that would have been determined, net of depreciation or amortisation, if no impairment loss had been recognised.
62 |
Ann
ual R
epor
t & A
ccou
nts
2013
| N
otes
to th
e fin
anci
al s
tate
men
ts
Notes to the financial statements
2 Significant accounting policies (continued)
m) Goodwill
Positive goodwill arising on acquisitions is capitalised, classified as an asset on the balance sheet and amortised on a straight line basis over its useful economic life up to a presumed maximum of 20 years. It is reviewed for impairment at the end of the first full financial year following the acquisition and in other periods if events or changes in circumstances indicate that the carrying value may not be recoverable. If a business is subsequently sold or closed, any goodwill arising on acquisition that was written off directly to reserves or that has not been amortised through the profit and loss account is taken into account in determining the profit or loss on sale or closure.
n) Discounts arising on the acquisition of loan portfolios
Discounts arising on the acquisition of loan portfolios are recognised in profit and loss within interest receivable on a level yield basis over the expected life of the loan portfolio to which they relate. Any unamortised discount is offset against the gross loan balance included within loans to customers in the balance sheet. At each reporting date, management make an assessment of the expected remaining life of the loan portfolio and the remaining amount of unamortised discount is adjusted so that the discount may be recognised prospectively on the original level yield basis over the revised expected life of the loan portfolio. The adjustment arising is recognised within interest receivable in the current period profit and loss.
o) Leasing – as lessee
Leases of property, plant and equipment where the Bank has substantially all the risks and rewards of ownership are classified as finance leases. Assets held under finance leases or hire purchase contracts are capitalised on inception of the agreement at an amount equal to their fair value or, if lower, the present value of the minimum lease payments.
The interest element of the lease cost is charged to the profit and loss account, within other operating expenses, over the lease period so as to produce a constant periodic rate of interest on the remaining balance of the liability for each period. Liabilities under finance leases and hire purchase contracts are included within other liabilities in the balance sheet. Property, plant and equipment acquired under finance leases or hire purchase contracts is depreciated over the shorter of the period of the agreement and the estimated useful lives of the assets. Leases where the lessor retains substantially all the risks and rewards of ownership are classified as operating leases. Payments made under operating leases, net of any incentives received from the lessor, are charged to the profit and loss account, within other operating expenses or staff costs (in case of company cars), on a straight line basis over the period of the lease.
p) Off-balance sheet financial derivatives
Off-balance sheet financial derivatives are entered into by the Bank for hedging purposes to reduce the risks arising on transactions entered into in the normal course of business. The income and expense arising from off-balance sheet financial derivatives entered into for hedging purposes is recognised in the accounts in accordance with the accounting treatments of the underlying transactions or transactions being hedged. All off-balance sheet financial derivatives are held for the period in which the underlying hedged items mature.
Interest on derivatives is included in interest receivable where the derivative is hedging interest income, and in interest payable where the derivative is hedging interest expense.
q) Capital raising costs
Costs directly incremental to the raising of share capital are netted against the share premium account.
Notes to the financial statem
ents | Annual R
eport & A
ccounts 2013 | 63

2 Significant accounting policies (continued)
r) Repurchase agreements
Securities sold under agreements to repurchase at a specified future date are not derecognised from the balance sheet as the Bank retains substantially all the risks and rewards of ownership. The cash received is recognised in the balance sheet as an asset with the corresponding obligation to return it recognised as a liability within ‘Due to banks’. Interest is accrued over the life of the agreement on a straight line basis.
s) Subordinated notes
Subordinated notes issued by the Bank are assessed to whether they should be treated as equity or financial liabilities. Where there is a contractual obligation to deliver cash or other financial assets they are treated as a financial liability and measured at amortised cost using the effective interest rate after taking account of any discount or premium on the issue and costs that are an integral part of the effective interest rate. The amount of any discount or premium is amortised over the period to the next call date through interest payable. All subordinated notes issued by the Bank are classified as financial liabilities; however, the subordinated notes issued also included a share warrant to the holders of the subordinated notes for shares in AC Acquisitions Limited, the Bank’s ultimate parent. Any amount of value attributable to this warrant is included as a capital contribution in reserves.
t) Share based payment transactions
Employees (including senior executives) of the Bank receive remuneration in the form of share-based payment transactions, whereby employees render services as consideration for equity instruments in the ultimate parent company (‘equity-settled transactions’). The fair value of these transactions is determined at the grant date and is recognised, together with a corresponding increase in equity, over the period in which the performance and/or service conditions are fulfilled, ending on the date on which the relevant employees become fully entitled to the award.
The expense recognised in the profit and loss account for the period represents the movement in cumulative expense recognised at the beginning and end of that period. Where the Bank’s parent grants rights to its equity instruments to the Bank’s employees, which are accounted for as equity-settled in the consolidated accounts of the parent, the Bank accounts for these share-based payments as equity-settled.
3 Segmental informationThe Bank has five reportable segments which are based on the Bank’s four lending divisions plus a central functions segment as listed below. Each of the lending divisions offer groups of similar products and services and is managed separately based on the Bank’s management and internal reporting structure. For each of the reportable segments the Board of Directors reviews internal management reports on a monthly basis.
z Residential Mortgages
z SME Commercial Mortgages
z Asset Finance
z Invoice Finance
z Central Functions
Central Functions include the Bank’s Treasury and Savings functions which are responsible for raising finance on behalf of the lending divisions. The costs of raising finance are all recharged by Central Functions to operating divisions on the basis of lending assets, apart from those costs relating to the subordinated notes.
Information regarding the results of each reportable segment and their reconciliation to the total results of the Bank are included below. Performance is measured based on the segmental result as included in the internal management reports.
64 |
Ann
ual R
epor
t & A
ccou
nts
2013
| N
otes
to th
e fin
anci
al s
tate
men
ts
Notes to the financial statements
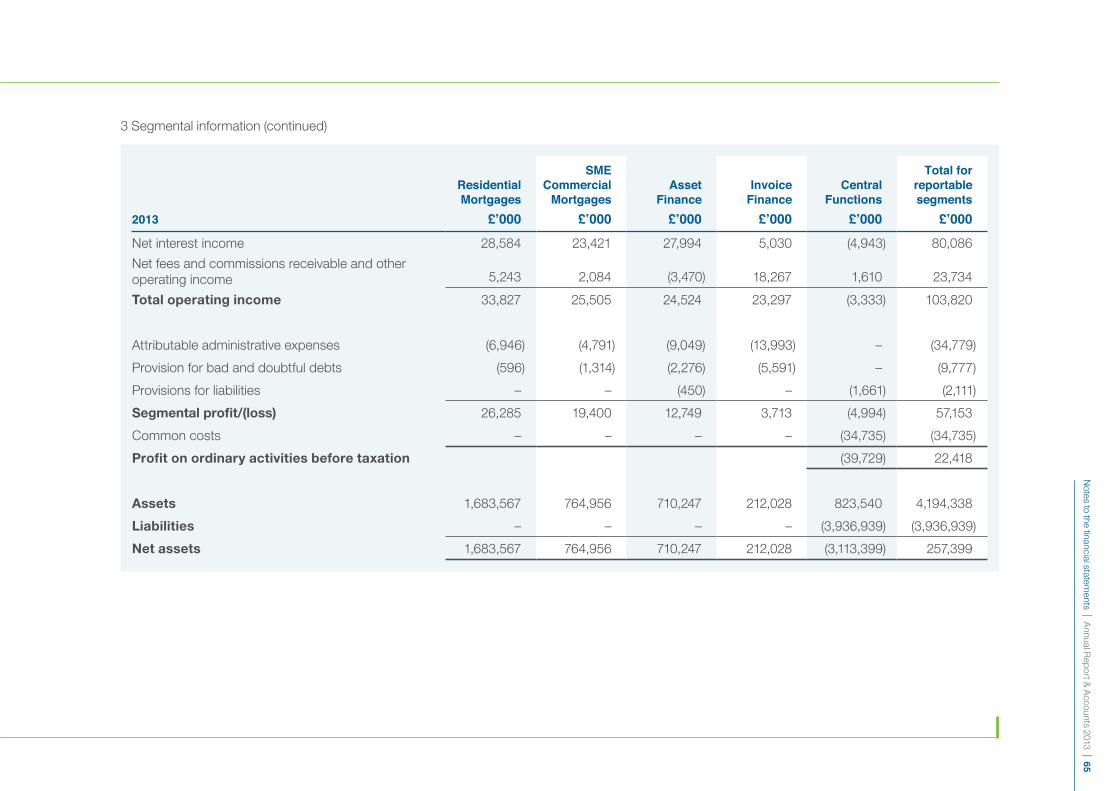
Notes to the financial statem
ents | Annual R
eport & A
ccounts 2013 | 65
2013
Residential Mortgages £’000
SME Commercial Mortgages £’000
Asset Finance £’000
Invoice Finance £’000
Central Functions £’000
Total for reportable segments £’000
Net interest income 28,584 23,421 27,994 5,030 (4,943) 80,086
Net fees and commissions receivable and other operating income 5,243 2,084 (3,470) 18,267 1,610 23,734
Total operating income 33,827 25,505 24,524 23,297 (3,333) 103,820
Attributable administrative expenses (6,946) (4,791) (9,049) (13,993) – (34,779)
Provision for bad and doubtful debts (596) (1,314) (2,276) (5,591) – (9,777)
Provisions for liabilities – – (450) – (1,661) (2,111)
Segmental profit/(loss) 26,285 19,400 12,749 3,713 (4,994) 57,153
Common costs – – – – (34,735) (34,735)
Profit on ordinary activities before taxation (39,729) 22,418
Assets 1,683,567 764,956 710,247 212,028 823,540 4,194,338
Liabilities – – – – (3,936,939) (3,936,939)
Net assets 1,683,567 764,956 710,247 212,028 (3,113,399) 257,399
3 Segmental information (continued)

66 |
Ann
ual R
epor
t & A
ccou
nts
2013
| N
otes
to th
e fin
anci
al s
tate
men
ts
Notes to the financial statements
In 2013, the presentation of segmental performance has been amended to show each lending division as a reportable segment, and to disclose segmental profit before the deduction of common costs. The 2012 segmental performance has been restated so that it is consistent with the basis on which the Bank’s operating results are reviewed by the Board of Directors.
2012 (Restated)
Residential Mortgages £’000
SME Commercial Mortgages £’000
Asset Finance £’000
Invoice Finance £’000
Central Functions £’000
Total for reportable segments £’000
Net interest income 8,128 11,344 14,041 3,342 (2,333) 34,522
Net fees and commissions receivable and other operating income 2,869 1,175 (1,715) 18,761 3,172 24,262
Total operating income 10,997 12,519 12,326 22,103 839 58,784
Attributable administrative expenses (4,688) (3,863) (5,092) (13,114) – (26,757)
Provision for bad and doubtful debts (387) (743) (1,032) (2,482) – (4,644)
Provisions for liabilities – – – – (483) (483)
Segmental profit 5,922 7,913 6,202 6,507 356 26,900
Common costs – – – – (25,434) (25,434)
Profit on ordinary activities before taxation (25,078) 1,466
Assets 957,267 548,220 375,376 178,740 459,985 2,519,588
Liabilities – – – – (2,347,289) (2,347,289)
Net assets 957,267 548,220 375,376 178,740 (1,887,304) 172,299
3 Segmental information (continued)

Notes to the financial statem
ents | Annual R
eport & A
ccounts 2013 | 67
Net interest payable on derivatives hedging interest receivable is included within interest receivable. In the previous year, the total net interest payable on derivatives was included within interest payable. The 2012 comparative figures have been re-stated. The impact is to decrease interest receivable for 2012 by £5,155,000.
4 Interest receivable
5 Interest payable
2013£’000
Restated 2012£’000
On loans and advances to residential mortgages customers 61,516 32,864On loans and advances to SME commercial mortgages customers 36,130 23,797On loans and advances to asset finance customers 42,254 24,061On loans and advances to invoice finance customers 9,348 8,301On debt securities 9,528 11,251Amortisation of discounts and premiums on acquired portfolios 3,942 2,099Bank deposits and treasury bills 1,206 631On derivative financial instruments (7,971) (5,155)
155,953 97,849
2013£’000
Restated 2012£’000
On customer accounts 70,479 62,010Due to banks 1,822 296On subordinated notes 6,121 3,875Other 1,123 39On derivative financial instruments (3,678) (2,893)
75,867 63,327
Net interest receivable on derivatives hedging interest payable is included within interest payable. In the previous year, the total net interest payable on derivatives was included within interest payable. The 2012 comparative figures have been re-stated. The impact is to decrease Interest payable for 2012 by £5,155,000.

68 |
Ann
ual R
epor
t & A
ccou
nts
2013
| N
otes
to th
e fin
anci
al s
tate
men
ts
Notes to the financial statements6 Fees and commissions receivable
2013£’000
2012£’000
Invoice finance fees 14,949 14,533Mortgage arrangement fees 12,670 7,993Asset finance fees 1,883 692Insurance commissions receivable 1,221 767Other 426 182
31,149 24,167
2013£’000
2012£’000
Introducer commissions 10,401 6,158Legal and valuation fees 1,941 1,671Company searches and other fees 2,296 1,598Credit protection and insurance charges 762 469Insurance commissions payable 821 342
16,221 10,238
7 Fees and commissions payable
2013£’000
2012£’000
Disbursements, collect out and other invoice finance income 6,750 7,078Other 187 24
6,937 7,102
8 Other operating income
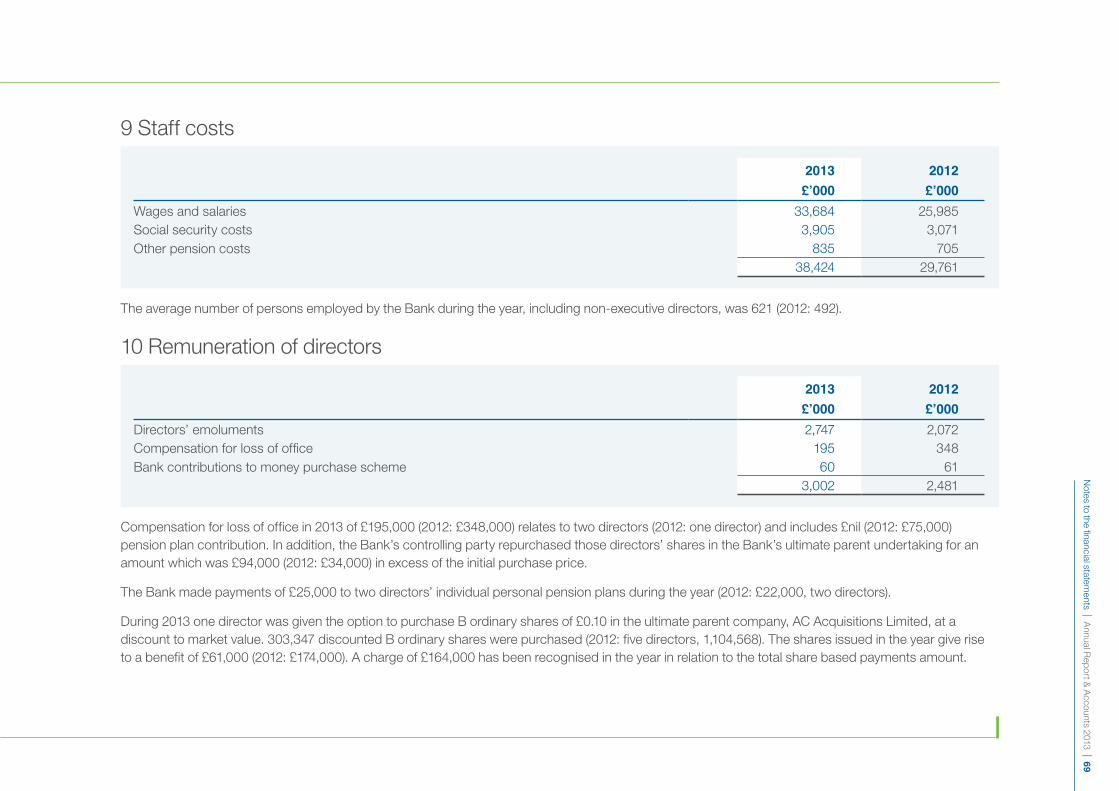
Notes to the financial statem
ents | Annual R
eport & A
ccounts 2013 | 69
The average number of persons employed by the Bank during the year, including non-executive directors, was 621 (2012: 492).
Compensation for loss of office in 2013 of £195,000 (2012: £348,000) relates to two directors (2012: one director) and includes £nil (2012: £75,000) pension plan contribution. In addition, the Bank’s controlling party repurchased those directors’ shares in the Bank’s ultimate parent undertaking for an amount which was £94,000 (2012: £34,000) in excess of the initial purchase price.
The Bank made payments of £25,000 to two directors’ individual personal pension plans during the year (2012: £22,000, two directors).
During 2013 one director was given the option to purchase B ordinary shares of £0.10 in the ultimate parent company, AC Acquisitions Limited, at a discount to market value. 303,347 discounted B ordinary shares were purchased (2012: five directors, 1,104,568). The shares issued in the year give rise to a benefit of £61,000 (2012: £174,000). A charge of £164,000 has been recognised in the year in relation to the total share based payments amount.
2013£’000
2012£’000
Wages and salaries 33,684 25,985Social security costs 3,905 3,071Other pension costs 835 705
38,424 29,761
9 Staff costs
2013£’000
2012£’000
Directors’ emoluments 2,747 2,072Compensation for loss of office 195 348Bank contributions to money purchase scheme 60 61
3,002 2,481
10 Remuneration of directors

70 |
Ann
ual R
epor
t & A
ccou
nts
2013
| N
otes
to th
e fin
anci
al s
tate
men
ts
Notes to the financial statements
2013£’000
2012£’000
Emoluments 653 418Bank contributions to money purchase scheme 10 13Share based payments 61 128
724 559
Highest paid director
The above amounts include the following in respect of the highest paid director:
11 Pension and other post-retirement benefit commitmentsDefined Contributions
The Bank operates two defined contribution pension schemes. The assets of the schemes are held separately from those of the Bank in independently administered funds. Pension contributions of £810,000 (2012: £683,000) were charged to the profit and loss account during the year in respect of these schemes. The Bank made payments amounting to £25,000 (2012: £22,000) to certain employees’ individual personal pension plans during the period. There were outstanding contributions of £128,000 at the year end (2012: £114,000).
2013£’000
2012£’000
Staff costs (see note 9) 38,424 29,761Legal and professional and other services 12,085 8,952Information Technology 4,683 3,283Office costs 3,191 2,956Other 6,859 4,472
65,242 49,424
12 Administrative expenses
10 Remuneration of directors (continued)
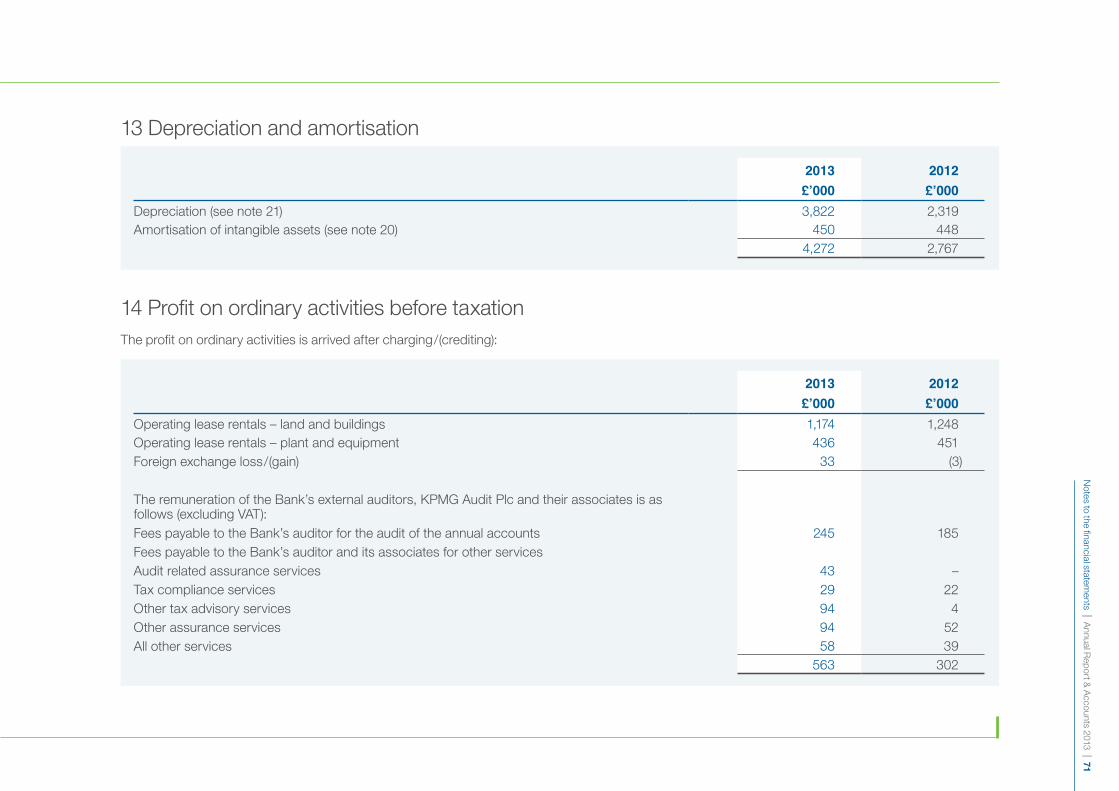
Notes to the financial statem
ents | Annual R
eport & A
ccounts 2013 | 71
14 Profit on ordinary activities before taxationThe profit on ordinary activities is arrived after charging/(crediting):
2013£’000
2012£’000
Operating lease rentals – land and buildings 1,174 1,248Operating lease rentals – plant and equipment 436 451Foreign exchange loss/(gain) 33 (3)
The remuneration of the Bank’s external auditors, KPMG Audit Plc and their associates is as follows (excluding VAT):Fees payable to the Bank’s auditor for the audit of the annual accounts 245 185Fees payable to the Bank’s auditor and its associates for other servicesAudit related assurance services 43 –Tax compliance services 29 22Other tax advisory services 94 4Other assurance services 94 52All other services 58 39
563 302
2013£’000
2012£’000
Depreciation (see note 21) 3,822 2,319Amortisation of intangible assets (see note 20) 450 448
4,272 2,767
13 Depreciation and amortisation
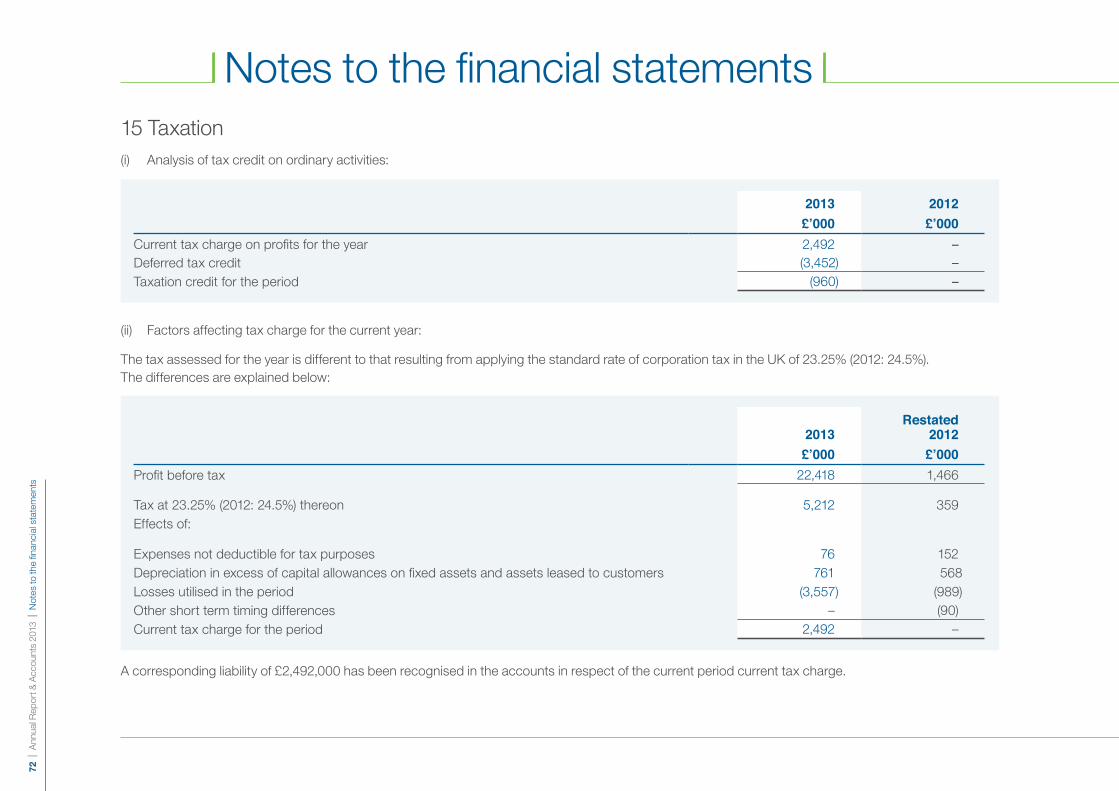
72 |
Ann
ual R
epor
t & A
ccou
nts
2013
| N
otes
to th
e fin
anci
al s
tate
men
ts
Notes to the financial statements15 Taxation(i) Analysis of tax credit on ordinary activities:
(ii) Factors affecting tax charge for the current year:
The tax assessed for the year is different to that resulting from applying the standard rate of corporation tax in the UK of 23.25% (2012: 24.5%). The differences are explained below:
A corresponding liability of £2,492,000 has been recognised in the accounts in respect of the current period current tax charge.
2013£’000
2012£’000
Current tax charge on profits for the year 2,492 –Deferred tax credit (3,452) –Taxation credit for the period (960) –
2013£’000
Restated 2012£’000
Profit before tax 22,418 1,466
Tax at 23.25% (2012: 24.5%) thereon 5,212 359Effects of:
Expenses not deductible for tax purposes 76 152Depreciation in excess of capital allowances on fixed assets and assets leased to customers 761 568Losses utilised in the period (3,557) (989)Other short term timing differences – (90)Current tax charge for the period 2,492 –

Notes to the financial statem
ents | Annual R
eport & A
ccounts 2013 | 73
15 Taxation (continued)
(iii) Deferred tax asset
A net deferred tax asset is regarded as recoverable and therefore recognised only when, on the basis of all available evidence, it can be regarded as more likely than not there will be suitable taxable profits from which the future of the underlying timing differences can be deducted. In 2012, no deferred tax asset was recognised as there was insufficient certainty over the ability to use the amounts in the future.
Reductions in the UK corporation tax rate from 26% to 24% (effective from 1 April 2012) and to 23% (effective 1 April 2013) were substantively enacted on 26 March 2012 and 3 July 2012 respectively. Further reductions to 21% (effective from 1 April 2014) and 20% (effective from 1 April 2015) were substantively enacted on 2 July 2013. This will reduce the Bank’s future current tax charge accordingly. The deferred tax asset at 31 December 2013 has been calculated based on the rate of 20% substantively enacted at the balance sheet date.
Analysis of recognised deferred tax balance:
2013£’000
2012£’000
Capital allowances less than depreciation – 1,147Other timing differences – 61Losses carried forward – 5,646Closing balance not recognised – 6,854
2013
Balance at 1 January
£’000
Recognised in profitorloss
£’000
Used to reduce
current tax£’000
Balance at 31 December
£’000Capital allowances in excess of depreciation – 3,392 – 3,392Other temporary differences – 60 – 60
– 3,452 – 3,452
Analysis of unrecognised deferred tax balance:

74 |
Ann
ual R
epor
t & A
ccou
nts
2013
| N
otes
to th
e fin
anci
al s
tate
men
ts
Notes to the financial statements
2013£’000
2012£’000
Repayable on demand 223,864 83,086223,864 83,086
16 Loans and advances to banks
There were no general or specific doubtful debt provisions against loans and advances to banks.
2013£’000
2012£’000
Repayable in not more than three months 293,182 238,529Repayable in more than three months but not more than one year 200,095 115,156Repayable in more than one year but not more than five years 607,288 316,161Repayable in more than five years 2,289,577 1,401,257Specific and general bad and doubtful debt provisions (19,344) (11,500)
3,370,798 2,059,603
Amounts include:Repayable on demand or at short notice 247,714 202,694
17 Loans and advances to customers

Notes to the financial statem
ents | Annual R
eport & A
ccounts 2013 | 75
2013£’000
2012£’000
Loans and advances before provisions 52,561 28,246Loans and advances after provisions 37,371 18,805
Loans include residential mortgages acquired at a discount during 2013 with a gross loan amount of £125.3 million. The discount to gross loan amount is being amortised on a level yield basis over the expected lives of the underlying loans.
At 31 December 2013 loans and advances to customers of £822.9 million (2012: £647.6 million) were pre-positioned with the Bank of England and HM Treasury Funding for Lending Scheme, and were available for use as collateral with the Scheme, of which £485.0 million had been drawn as at the reporting date (2012: £205.0 million).
Non-performing loans and advances to customers
17 Loans and advances to customers (continued)
Non-performing loans are defined as a default position equivalent to three or more missed monthly repayments, loans where litigation proceedings have commenced and loans which are the subject of an insolvency event or fraud.
Analysis of loans and advances by lending type2013£’000
2012£’000
Finance lease receivables 801,099 424,950Less unearned finance charges (90,852) (49,574)
Asset finance loans 710,247 375,376Residential mortgage loans 1,683,567 957,267SME Commercial mortgage loans 764,956 548,220Invoice financing 212,028 178,740
3,370,798 2,059,603

76 |
Ann
ual R
epor
t & A
ccou
nts
2013
| N
otes
to th
e fin
anci
al s
tate
men
ts
Notes to the financial statements
2013Specific
£’000General£’000
Total£’000
1 January 9,441 2,059 11,500Write off in year net of recoveries (1,933) – (1,933)Charge to profit and loss account 7,682 2,095 9,77731 December 15,190 4,154 19,344
2012Specific
£’000General£’000
Total£’000
1 January 9,849 1,374 11,223Purchases as part of acquisition 150 – 150Write off in year net of recoveries (4,517) – (4,517)Charge to profit and loss account 3,959 685 4,64431 December 9,441 2,059 11,500
Specific and general bad and doubtful debt provisions
17 Loans and advances to customers (continued)

Notes to the financial statem
ents | Annual R
eport & A
ccounts 2013 | 77
Asset backed securities Other debt securities Total
2013£’000
2012£’000
2013£’000
2012£’000
2013£’000
2012£’000
Cost
1 January 70,306 70,408 246,990 167,375 317,296 237,783
Additions 58,835 54,920 29,581 95,115 88,416 150,035
Capital repayments (14,893) (20,707) (9,000) (15,500) (23,893) (36,207)
Disposals (36,466) (34,315) (5,000) – (41,466) (34,315)
31 December 77,782 70,306 262,571 246,990 340,353 317,296
Discount/(premium) on purchase
1 January 5,311 9,314 (171) 511 5,140 9,825
Additions (73) 4,645 (397) (821) (470) 3,824
Amortisation of (discount)/premium (1,827) (3,036) 220 139 (1,607) (2,897)
Disposals (2,143) (5,612) (12) – (2,155) (5,612)
31 December 1,268 5,311 (360) (171) 908 5,140
Book value
31 December 76,514 64,995 262,931 247,161 339,445 312,156
18 Debt securities
During the year the Bank disposed of asset backed securities with a book value of £34,323,000, resulting in a gain of £1,866,000 (2012: £3,231,000). In addition, the Bank disposed of other debt securities with a book value of £4,988,000, resulting in a gain of £3,000 (2012: £nil).

78 |
Ann
ual R
epor
t & A
ccou
nts
2013
| N
otes
to th
e fin
anci
al s
tate
men
ts
Notes to the financial statements19 Investment in subsidiariesHoldings of more than 20%
The Bank holds more than 20% of the share capital of the following companies. They are all dormant subsidiaries.
20 Intangible assets
Goodwill arising on the acquisition and hive up of Base Commercial Mortgages Holdings Limited and goodwill arising on the acquisition and hive up of Aldermore Invoice Finance (Holdings) Limited are being amortised evenly over their presumed useful economic lives of 20 years. The directors do not consider the carrying value of the unamortised goodwill to be impaired.
Company Principal ActivityCountry of
Incorporation Shares heldPercentage
%
Principal subsidiary undertakings are as follows:
Aldermore Invoice Finance (Holdings) Limited Dormant England Ordinary 100
Base Commercial Mortgages Holdings Limited Dormant England Ordinary 100
Aldermore Bank Nominees Limited Dormant England Ordinary 100
Goodwill2013£’000
Cost: 8,962At 31 December 2012 and 31 December 2013
Amortisation:At 1 January 2013 1,495Amortisation for the year 450At 31 December 2013 1,945Net book value at 31 December 2013 7,017Net book value at 31 December 2012 7,467
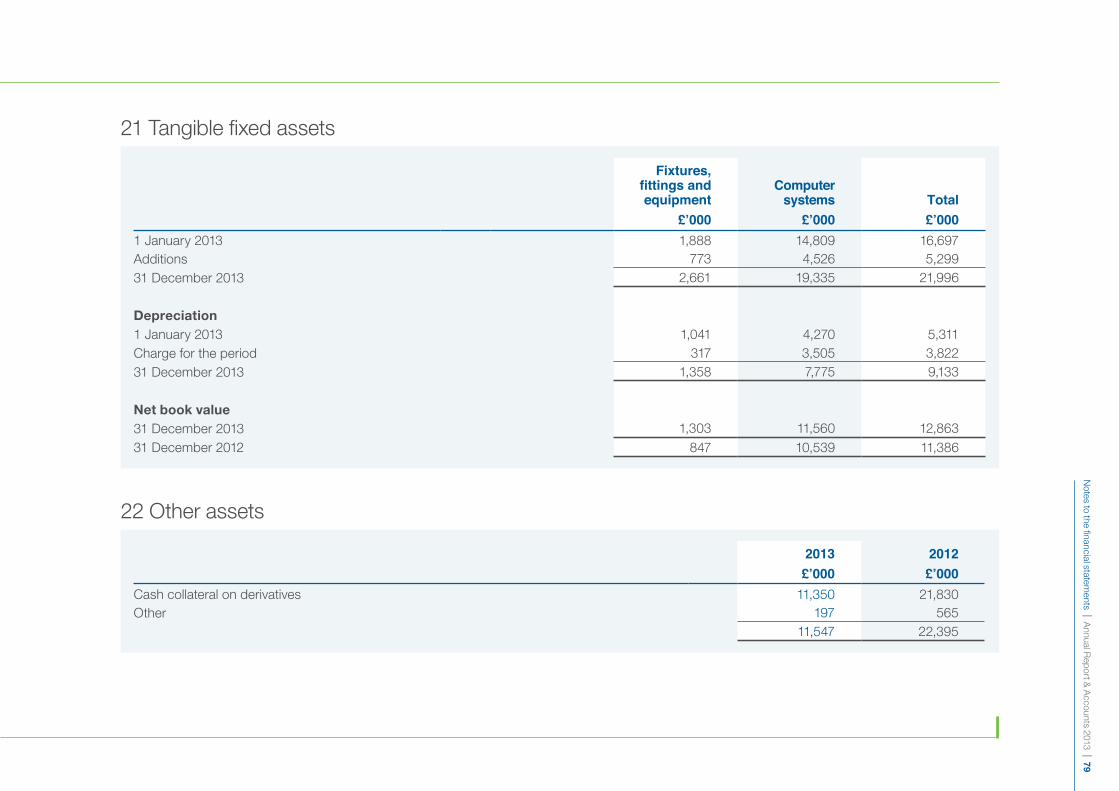
Notes to the financial statem
ents | Annual R
eport & A
ccounts 2013 | 79
21 Tangible fixed assets
Fixtures, fittingsandequipment
£’000
Computer systems
£’000Total£’000
1 January 2013 1,888 14,809 16,697Additions 773 4,526 5,29931 December 2013 2,661 19,335 21,996
Depreciation1 January 2013 1,041 4,270 5,311Charge for the period 317 3,505 3,82231 December 2013 1,358 7,775 9,133
Net book value31 December 2013 1,303 11,560 12,86331 December 2012 847 10,539 11,386
2013£’000
2012£’000
Cash collateral on derivatives 11,350 21,830Other 197 565
11,547 22,395
22 Other assets

80 |
Ann
ual R
epor
t & A
ccou
nts
2013
| N
otes
to th
e fin
anci
al s
tate
men
ts
Notes to the financial statements
2013£’000
2012£’000
Prepaid broker fees 19,754 10,619Accrued income 8,899 9,214Other prepayments 3,855 2,008
32,508 21,841
23 Prepayments and accrued income
2013£’000
2012£’000
Due to banks – repurchase agreements 383,071 114,579Due to banks – deposits 1,205 500
384,276 115,079
24 Due to banks
Collateral given under repurchase agreements
The face values of securities sold under agreements to repurchase at 31 December 2013 was £385.0 million (2012: £115.0 million) of which securities with a face value of £385.0 million (2012: £115.0 million) were drawn down from the Bank of England under the terms of the Funding for Lending Scheme. The carrying value of these repurchase transactions at 31 December 2013 was £383.1 million (2012: £114.6 million). The Bank conducts these transactions under the terms of applicable General Master Repurchase Agreement (GMRA) guidelines.

Notes to the financial statem
ents | Annual R
eport & A
ccounts 2013 | 81
2013£’000
2012£’000
Repayable on demand 949,569 449,713Repayable in not more than three months but not on demand 650,311 379,110Repayable in more than three months but not more than one year 1,108,858 1,037,395Repayable in more than one year but not more than five years 735,654 274,980
3,444,392 2,141,198
25 Customers’ accounts
2013£’000
2012£’000
Other taxation and social security costs 3,967 4,508Amounts payable on credit balances to Invoice Finance customers 3,738 3,210Cash collateral on derivatives 1,675 –Unallocated cash 2,098 1,919Trade creditors 848 211Other payables 2,381 569
14,707 10,417
26 Other liabilities
Unallocated cash primarily relates to a liability for unclaimed cash receipts, which are held on the Bank’s balance sheet until the expiry of a six-year period. During this period, the Bank makes efforts to try to allocate or to return overpayments to customers. Any unclaimed receipts subsequent to the expiry date are recognised as income.

82 |
Ann
ual R
epor
t & A
ccou
nts
2013
| N
otes
to th
e fin
anci
al s
tate
men
ts
Notes to the financial statements
2013£’000
2012£’000
Accrued interest payable to customers 19,681 20,536Prepaid arrangement fees 18,250 13,640Accruals 15,098 10,197Deferred income 1,123 976Fee creditors 644 523
54,796 45,872
27 Accruals and deferred income
FSCS levies Customer redress Total
2013£’000
Restated 2012
£’0002013£’000
2012 £’000
2013£’000
Restated 2012
£’0001 January as previously stated 575 1,012 – – 575 1,012Prior year adjustment – (662) – – – (662)1 January as restated 575 350 – – 575 350Provided during the year as previously stated 1,661 1,190 450 – 2,111 1,190Prior year adjustment – (707) – – – (707)Provided during the year as restated 1,661 483 450 – 2,111 483Utilised during the year (1,529) (258) – – (1,529) (258)31 December 707 575 450 – 1,157 575
28 Provisions
Notes to the financial statem
ents | Annual R
eport & A
ccounts 2013 | 83
28 Provisions (continued)
Financial Services Compensation Scheme
In common with all regulated UK deposit takers, the Bank pays levies to the FSCS to enable the FSCS to meet claims against it. The FSCS levy consists of two parts: a management expenses levy and a compensation levy. The management expenses levy covers the costs of running the scheme and the compensation levy covers the amount of compensation the scheme pays, net of any recoveries it makes using the rights that have been assigned to it. During 2008 and 2009 claims were triggered against the FSCS in relation to Bradford & Bingley plc, Kaupthing Singer & Friedlander Ltd, Heritable Bank plc, Landsbanki Islands hf, London Scottish Bank plc and Dunfermline Building Society.
The FSCS provision at 31 December 2013 of £707,000 represents management expense levies for the scheme triggered but not yet invoiced, and includes an estimate of the levy for the scheme year 2013/2014. The management expenses levy has been calculated using the agreed funding rate of 12 months LIBOR + 100bps.
As a consequence of the Bank’s change in accounting policy for IFRIC 21 Levies, the trigger date for each year’s FSCS levies is now 1 April, previously assumed to be 31 December. Accordingly the liability for the 2014/2015 scheme levies will not be recognised until April 2014. This change in accounting policy has resulted in a decrease of £662,000 in the opening provision balance as at 1 January 2012, and a reduction of £707,000 in the FSCS levy recognised as an expense for the year ended 31 December 2012. The comparatives have been restated accordingly.
The provision includes the Bank’s estimate of its share of the capital shortfalls on loans made to failed institutions by the FSCS. The current estimate of the industry shortfall to be recovered is £961 million and this is being recovered in three approximately equal instalments that began in scheme year 2013/2014.
Customer redress
A provision was recognised in 2013 in relation to Consumer Credit Act (CCA) non-compliance. The Bank has a small number of loans which are regulated under the CCA and has identified that, following changes to the CCA in 2008, certain letters and statements have been sent to customers that do not fully comply with the requirements prescribed by the CCA. Accordingly, these customers are entitled to redress for interest and fees charged on the relevant loans as a result of this technical non-compliance, notwithstanding there is unlikely to have been any customer detriment. The total cost of remediating the interest and fees charged to the affected customers is estimated at £450,000, and is reflected in these financial statements. The relevant customers do not need to take any action and will be contacted in due course by the Bank. The Bank is taking steps to ensure that all relevant customer documentation will in future contain the correct wording required by the CCA.

84 |
Ann
ual R
epor
t & A
ccou
nts
2013
| N
otes
to th
e fin
anci
al s
tate
men
ts
Notes to the financial statements29 Subordinated notes
2013£’000
2012£’000
Subordinated notes 35,119 34,148
During 2012 the Bank issued £40 million subordinated 12.875% loan notes repayable in 2022, with an option for the Bank to redeem early after 5 years. The interest rate is fixed until May 2017. The loan notes were issued at a discount, and are carried in the balance sheet at amortised cost using the effective interest rate of 18.597%. In addition to the loan notes, a warrant was issued by the ultimate parent company, AC Acquisitions Limited, which is accounted for in the financial statements of that company. The warrant was valued at £2,200,000, and this was treated as a capital contribution to the Bank.
During the year five ordinary shares of £1 each were issued for a total of £61,557,543 creating £61,557,538 share premium.
At 31 December 2013 allotted, called up and fully paid shares totalled 3,300,015 (2012: 3,300,010).
2013£’000
2012£’000
Allotted, called up and fully paid ordinary shares of £1 each At 1 January 3,300 3,300Issued during the year – –
3,300 3,300
30 Share capital
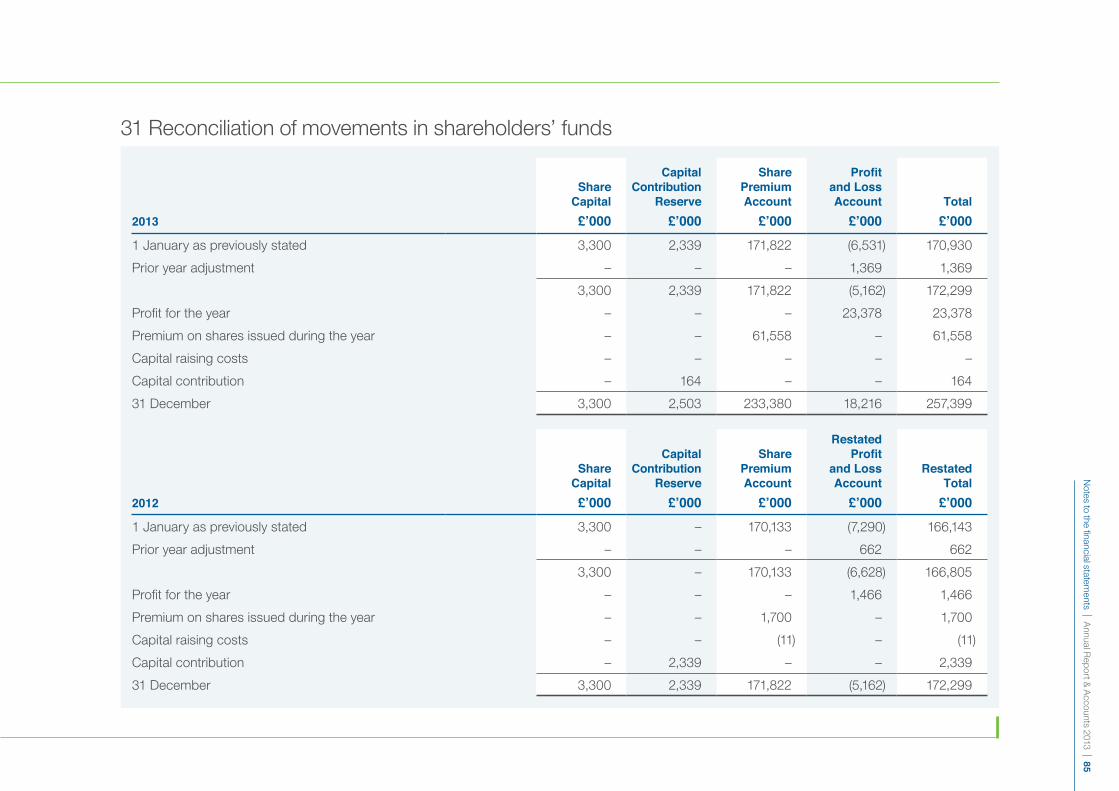
Notes to the financial statem
ents | Annual R
eport & A
ccounts 2013 | 85
31 Reconciliation of movements in shareholders’ funds
2013
Share Capital£’000
Capital Contribution
Reserve£’000
Share Premium Account£’000
Profitand Loss Account£’000
Total£’000
1 January as previously stated 3,300 2,339 171,822 (6,531) 170,930
Prior year adjustment – – – 1,369 1,369
3,300 2,339 171,822 (5,162) 172,299
Profit for the year – – – 23,378 23,378
Premium on shares issued during the year – – 61,558 – 61,558
Capital raising costs – – – – –
Capital contribution – 164 – – 164
31 December 3,300 2,503 233,380 18,216 257,399
2012
Share Capital£’000
Capital Contribution
Reserve£’000
Share Premium Account£’000
Restated Profit
and Loss Account£’000
Restated Total£’000
1 January as previously stated 3,300 – 170,133 (7,290) 166,143
Prior year adjustment – – – 662 662
3,300 – 170,133 (6,628) 166,805
Profit for the year – – – 1,466 1,466
Premium on shares issued during the year – – 1,700 – 1,700
Capital raising costs – – (11) – (11)
Capital contribution – 2,339 – – 2,339
31 December 3,300 2,339 171,822 (5,162) 172,299

86 |
Ann
ual R
epor
t & A
ccou
nts
2013
| N
otes
to th
e fin
anci
al s
tate
men
ts
Notes to the financial statements
During 2012 a non-returnable capital contribution of £2,200,000 was received on the issue of share warrants by the ultimate parent company AC Acquisitions Limited. This amount is distributable. In 2013, one director (2012: five directors) were given the option to purchase ‘B’ ordinary shares of £0.10 in the ultimate parent company, AC Acquisitions Limited, at a discount to market value. This gives rise to a capital contribution reserve in the Bank of £164,000 (2012: £139,000) which is distributable. Details of the share based payment programme are contained in the financial statements of the Bank’s ultimate parent undertaking. The charge in the Bank’s profit and loss account for the year in relation to all share based payment transactions was £164,000 (2012: £139,000).
As a consequence of the Bank’s change in accounting policy for IFRIC 21 Levies, opening reserves at 1 January 2012 have increased by £662,000, and retained profit for 2012 increased by £707,000.
31 Reconciliation of movements in shareholders’ funds (continued)
2013£’000
Restated 2012£’000
Profit for the year 23,378 1,466Shares issued during the year – –Premium on shares issued during the year 61,558 1,700Capital raising costs – (11)Capital contribution during the year 164 2,339Net additions to shareholders’ funds 85,100 5,494At 1 January 172,299 166,805At 31 December 257,399 172,299
32 Reconciliation of movements in shareholders’ funds
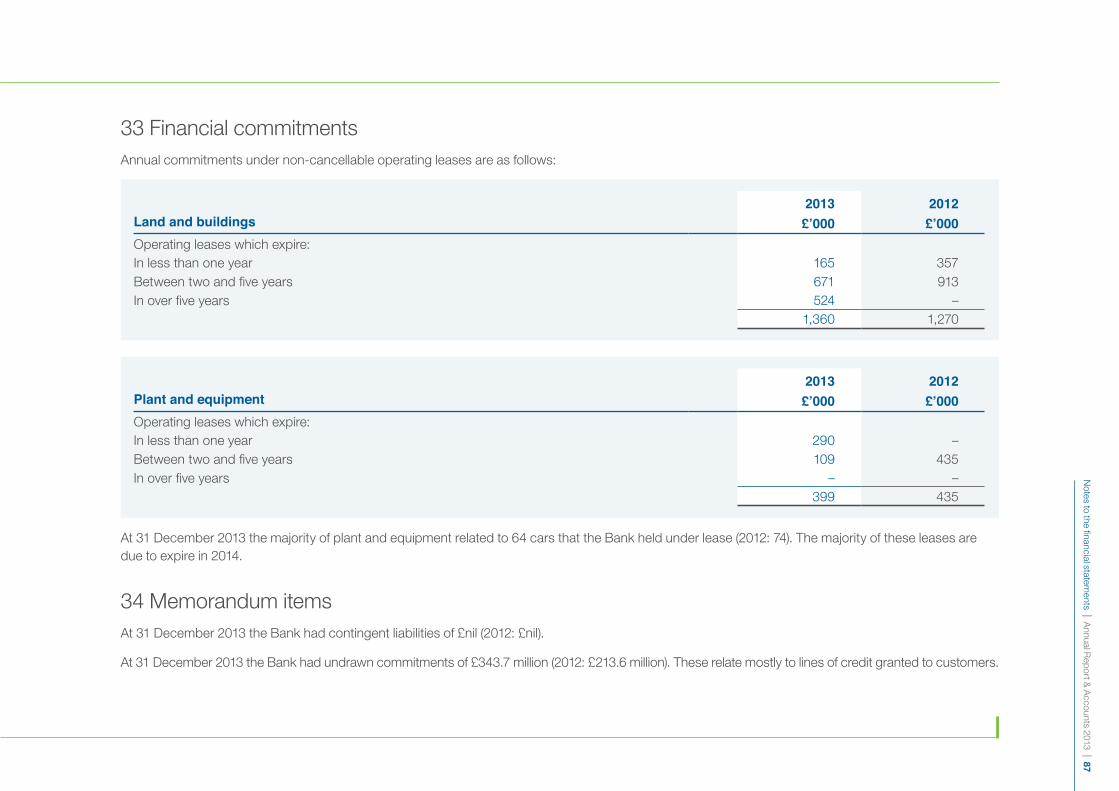
Notes to the financial statem
ents | Annual R
eport & A
ccounts 2013 | 87
33 Financial commitmentsAnnual commitments under non-cancellable operating leases are as follows:
34 Memorandum itemsAt 31 December 2013 the Bank had contingent liabilities of £nil (2012: £nil).
At 31 December 2013 the Bank had undrawn commitments of £343.7 million (2012: £213.6 million). These relate mostly to lines of credit granted to customers.
At 31 December 2013 the majority of plant and equipment related to 64 cars that the Bank held under lease (2012: 74). The majority of these leases are due to expire in 2014.
Land and buildings2013£’000
2012£’000
Operating leases which expire:In less than one year 165 357Between two and five years 671 913In over five years 524 –
1,360 1,270
Plant and equipment2013£’000
2012£’000
Operating leases which expire:In less than one year 290 –Between two and five years 109 435In over five years – –
399 435
88 |
Ann
ual R
epor
t & A
ccou
nts
2013
| N
otes
to th
e fin
anci
al s
tate
men
ts
Notes to the financial statements35 Assets and liabilities denominated in foreign currencyAs at 31 December 2013, there were customer loans of £3,641,000 (2012: £2,047,000) and liabilities of £nil (2012: £nil) denominated in Euros. There were customer loans of £2,907,000 (2012: £2,331,000) and bank borrowings of £nil (2012: £229,000) denominated in US Dollars. There were customer loans of £132,000 (2012: £nil) and liabilities of £nil (2012: £nil) denominated in Canadian Dollars. There were no other foreign currency assets or liabilities at the balance sheet date.
36 Related partiesThe Bank has taken advantage under Financial Reporting Standard 8 ‘Related Party Disclosures’ not to disclose transactions with members of the AC Acquisitions Limited group on the grounds that the Bank is a 100% subsidiary of AC Acquisitions Limited and the Bank is included in consolidated financial statements published by AC Acquisitions Limited.
Certain directors and shareholders of the ultimate parent company and certain directors of the Bank, in their capacities as individuals, trustees, directors of other companies or members of pension schemes, have deposits and loans with, and fees from, the Bank. All deposit arrangements have been operated by the Bank on normal commercial terms and conditions. Directors’ loans at 31 December 2013 were £nil (2012: £113,000).
Directors’ loans with outstanding amounts totalling £115,000 were assigned in July 2013 to the ultimate parent company AC Acquisitions Limited. Interest was charged from 1 January to 29 July at a rate of 1.75% p.a. No repayments were made during the year.
The Bank is controlled by AnaCap Financial Partners, II L.P. (52.3%) and AnaCap Financial Partners, L.P. (47.7%) who are the main shareholders of AC Acquisitions Limited. The following agreements are in place with a company under their common control, Syscap Limited.
The Bank provides £5 million of Block Discounting facilities to Syscap Limited. The facilities commenced in September 2009 and are secured by underlying receivables of short term loans, primarily to solicitors’ practices which are funded at a discount to the face value of the loans. The facilities contain appropriate conditions relating to performance, non-performing deal substitution rights and default provisions in line with Aldermore’s standard commercial policies. Pricing on the facilities is subject to normal commercial terms.
During the year Syscap Limited introduced business of £27.7 million (2012: £32.3 million) and received commission of £0.3 million (2012: £0.4 million) of which £nil is outstanding at year end (2012: £nil).
In addition the Bank has been charged investment monitoring fees by Anacap Derby Co-Investment GP Limited, AnaCap FP GP II Limited and AnaCap Financial Partners GP Limited totalling £150,000 for the year (2012: £75,000). The balance outstanding at the year-end is £195,150 (2012: £120,150).

Notes to the financial statem
ents | Annual R
eport & A
ccounts 2013 | 89
37 Financial instrumentsThe following tables summarise the classification of carrying amounts of the Bank’s financial assets and liabilities.
The Bank’s financial instruments comprise borrowings from banks, loan notes, customer deposits, loans to customers, debt and government securities and cash held at banks. All these arise as a result of the Bank’s normal operations. The Bank does not enter transactions for speculative purposes and accordingly a note of instruments held for trading has not been provided. From time to time, the Bank may use interest rate derivatives such as swaps to manage part of its interest rate risk. The main risks arising from the Bank’s financial instruments are credit risk, liquidity risk, regulatory risk, funding risk and interest rate risk. The directors review and agree policies for managing each of these risks and these are summarised as follows.
Credit risk
Credit risk is the risk that a borrower or counterparty fails to pay the interest or the capital on a loan or other financial instrument. Credit risk is the principal risk encountered by the Bank. Credit risk principally arises from lending activities, but can also arise from other on and off balance sheet activities such as the issue of guarantees. The Bank manages its credit risk by limiting its exposure to certain sectors of business and counterparties, by carrying out appropriate checks when loans are advanced and taking appropriate security to protect itself in the event of a default. Credit exposures are reviewed quarterly by the Board in conjunction with a review of specific provisions. Should any event occur between these reviews which indicates a provision is required then a provision will be made.
The Bank has no direct exposure to any distressed Eurozone countries.
Liquidity risk
Liquidity risk is the risk that the Bank is not able to meet its liabilities when they are due under normal conditions, and under a 91-day liquidity stress as defined by the Bank’s internal stress requirements and PRA stress requirements, or can do so only at excessive cost. The Bank maintains a liquidity buffer of eligible liquid assets, such as UK government treasury bills, gilts, multinational development bank bonds and unencumbered cash. The Bank’s liquidity buffer includes only sterling denominated instruments.
The Bank monitors the adequacy of its liquidity buffer on a regular basis to ensure it is sufficient at all times to meet the Bank’s liquidity risk appetites as stated above. The ALCo meets on a monthly basis to consider market, interest rate and liquidity risks, and to ensure that the Bank adheres to the interest rate risk and liquidity policies and objectives set down by the Board. It also has responsibility for ensuring that the policies that are implemented are adequate to meet operational, prudential and regulatory requirements.
Market risk
Market risk is the risk that the value of, or net income arising from the Bank’s assets and liabilities changes as a result of movements in interest or exchange rates. Market risk arises only as a natural consequence of carrying out and supporting core business activities. Aldermore does not trade or make markets. Interest rate risk is the only material market risk for the Bank.

90 |
Ann
ual R
epor
t & A
ccou
nts
2013
| N
otes
to th
e fin
anci
al s
tate
men
ts
Notes to the financial statements37 Financial instruments (continued)
Funding risk
There is a requirement to keep a balance between the maturity profile of the Bank’s funding and the funding requirements for loans. The Bank raises retail and SME deposits to meet increased lending requirements as well as the replacement of maturing deposits. The Bank closely monitors the profile of deposits and has the flexibility to amend the products offered and deposit rates to rebalance the profile of deposits taking into account the prevailing market conditions as required.
The Bank also participates in the Funding for Lending Scheme (FLS) launched by the Bank of England and HM Treasury, which expands the funding mix utilised by the Bank. In order to access the facility, the Bank pre-positions certain lending assets at the Bank of England in exchange for UK government treasury bills (“FLS T-bills”) which are then converted to cash via repurchase agreements with other counterparties. The FLS T-bills have a fixed maturity of four years from drawdown. The volume of funding available from the scheme is dependent on the Bank’s net new lending and on availability of collateral. The FLS Repurchase agreements encumber the FLS T-bills, and have variable maturity dates according to the Bank’s liquidity requirements. Further information is contained within Note 24.
Interest rate risk
Interest rate risk is the risk that the value of a financial instrument will fluctuate because of changes in market interest rates.
Interest rate related contracts represent interest rate swap transactions which generally involve the exchange of fixed and floating interest payment obligations without the exchange of the underlying principal amounts.
The Bank also enters into basis interest rate swap contracts which involve the exchange of two floating rate instruments which reference to difference bases. The basis swap functions as a floating-floating interest rate swap under which the two difference bases instruments are transformed to a common base.
Derivatives contracts are used for hedging purposes only and are executed with Bank counterparties for whom volume and settlement limits have been approved. Under the Bank’s current treasury policy, derivatives contracts are restricted to interest rate swaps, currency swaps and forward rate agreements. At 31 December 2013, there were 117 swaps outstanding (2012: 96). There were net unrealised mark to market losses outstanding at the year-end of £8.7 million (2012: £21.1 million), of which gains of £1.5 million (2012: £3.5 million) are expected to be realised in the year ending 31 December 2014.

Notes to the financial statem
ents | Annual R
eport & A
ccounts 2013 | 91
Interest Rate Swaps Others
2013
Notional Values
£’million
Fair Values£’000
Notional Values
£’million
Fair Values£’000
Maturity1 year or less 899 1,510 14 315 years or less but over 1 year 1,268 570 – –More than 5 years 87 (10,754) – –
2,254 (8,674) 14 31
Interest Rate Swaps Others
2012
Notional Values
£’million
Fair Values£’000
Notional Values
£’million
Fair Values£’000
Maturity1 year or less 962 3,533 10 (6)5 years or less but over 1 year 809 (4,972) – –More than 5 years 87 (19,670) – –
1,858 (21,109) 10 (6)
The Bank finances its loan book from its capital base, customer deposits and the FLS. At present the Bank has a minimal level of re-pricing mismatches. The table below summarises the re-pricing mismatches on the Bank’s non-trading book as at 31 December 2013. Items are allocated to time bands by reference to the earlier of the next contractual interest rate re-pricing date and the maturity date.
A positive interest rate sensitivity gap exists when more assets than liabilities re-price during a given period. A positive gap position tends to benefit net interest income in an environment where interest rates are rising. However, the actual effect will depend on a number of factors including actual repayment dates and interest rate sensitivities within the banding periods.
37 Financial instruments (continued)
Interest rate risk (continued)

92 |
Ann
ual R
epor
t & A
ccou
nts
2013
| N
otes
to th
e fin
anci
al s
tate
men
ts
Notes to the financial statements
31 December 2013
Less than3 months
£’000
3 to 6months£’000
6 monthsto 1 year
£’000
1 to 5 years£’000
More than
5 years£’000
Non-interest bearing£’000
Total£’000
Cash and balances at central banks 189,015 – – – – 3,829 192,844
Loans and advances to banks 223,864 – – – – – 223,864
Debt securities 137,782 – 5,115 110,581 86,875 (908) 339,445
Loans and advances to customers 1,961,178 149,269 250,181 1,035,634 12,660 (38,124) 3,370,798
Other assets 11,349 – – – – 56,038 67,387
Total assets 2,523,188 149,269 255,296 1,146,215 99,535 20,835 4,194,338
Due to banks 294,471 89,805 – – – – 384,276
Customer accounts 1,594,874 521,806 587,051 735,653 – 5,008 3,444,392
Other liabilities 1,675 – – – – 71,477 73,152
Subordinated notes – – – 35,119 – – 35,119
Shareholders’ funds – – – – – 257,399 257,399
Total liabilities 1,891,020 611,611 587,051 770,772 – 333,884 4,194,338
Off balance sheet items (157,208) 309,443 278,387 (343,747) (86,875) – –
Interest rate sensitivity gap 474,960 (152,899) (53,368) 31,696 12,660 (313,049) –
Cumulative gap 474,960 322,061 268,693 300,389 313,049 – –
37 Financial instruments (continued)
Interest rate risk (continued)

Notes to the financial statem
ents | Annual R
eport & A
ccounts 2013 | 93
31 December 2012
Less than3 months
£’000
3 to 6months£’000
6 monthsto 1 year
£’000
1 to 5 years£’000
More than
5 years£’000
Non-interest bearing£’000
RestatedTotal£’000
Cash and balances at central banks 500 – – – – 1,154 1,654
Loans and advances to banks 83,086 – – – – – 83,086
Debt securities 139,306 – – 91,115 86,875 (5,140) 312,156
Loans and advances to customers 1,117,303 52,316 161,776 735,793 8,561 (16,146) 2,059,603
Other assets 21,830 – – – – 41,259 63,089
Total assets 1,362,025 52,316 161,776 826,908 95,436 21,127 2,519,588
Due to banks 44,898 70,181 – – – – 115,079
Customer accounts 828,710 409,439 627,956 274,943 – 150 2,141,198
Other liabilities – – – – – 56,864 56,864
Subordinated notes – – – 34,148 – – 34,148
Shareholders’ funds – – – – – 172,299 172,299
Total liabilities 873,608 479,620 627,956 309,091 – 229,313 2,519,588
Off balance sheet items (135,982) 254,944 406,886 (438,973) (86,875) – –
Interest rate sensitivity gap 352,435 (172,360) (59,294) 78,844 8,561 (208,186) –
Cumulative gap 352,435 180,075 120,781 199,625 208,186 – –
37 Financial instruments (continued)
Interest rate risk (continued)
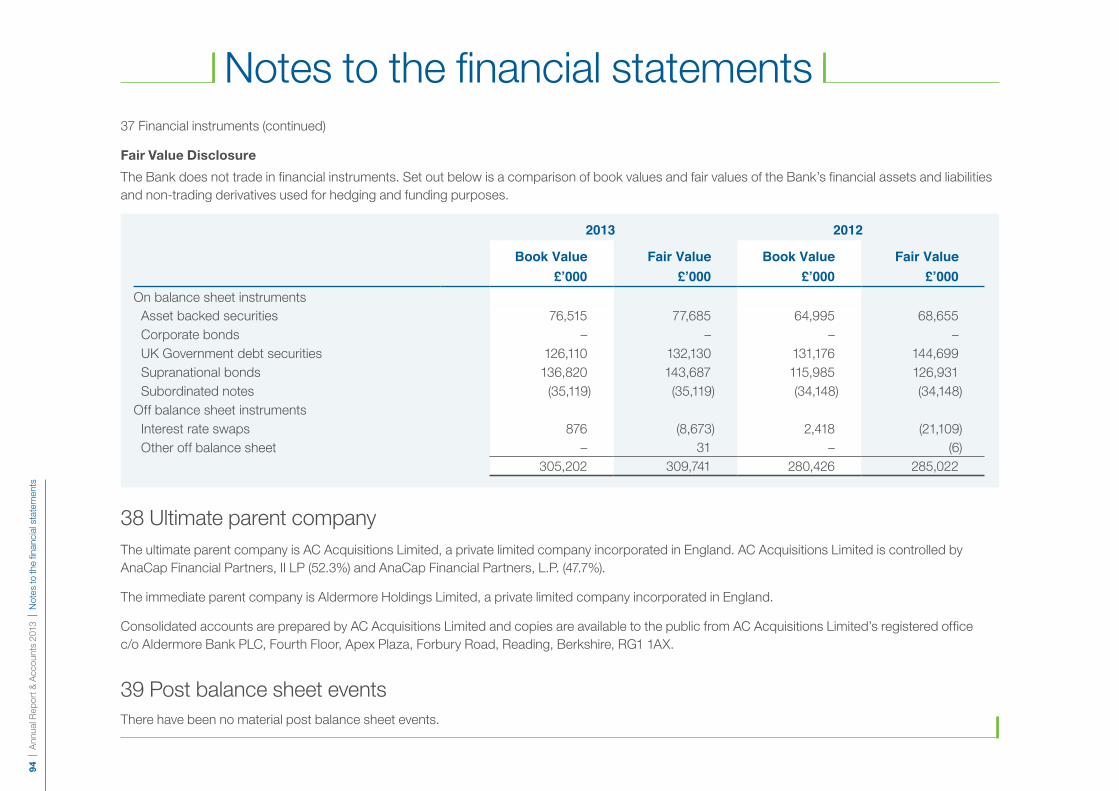
94 |
Ann
ual R
epor
t & A
ccou
nts
2013
| N
otes
to th
e fin
anci
al s
tate
men
ts
Notes to the financial statements
2013 2012
Book Value£’000
Fair Value£’000
Book Value£’000
Fair Value£’000
On balance sheet instruments Asset backed securities 76,515 77,685 64,995 68,655 Corporate bonds – – – – UK Government debt securities 126,110 132,130 131,176 144,699 Supranational bonds 136,820 143,687 115,985 126,931 Subordinated notes (35,119) (35,119) (34,148) (34,148)Off balance sheet instruments Interest rate swaps 876 (8,673) 2,418 (21,109) Other off balance sheet – 31 – (6)
305,202 309,741 280,426 285,022
Fair Value Disclosure
The Bank does not trade in financial instruments. Set out below is a comparison of book values and fair values of the Bank’s financial assets and liabilities and non-trading derivatives used for hedging and funding purposes.
38 Ultimate parent companyThe ultimate parent company is AC Acquisitions Limited, a private limited company incorporated in England. AC Acquisitions Limited is controlled by AnaCap Financial Partners, II LP (52.3%) and AnaCap Financial Partners, L.P. (47.7%).
The immediate parent company is Aldermore Holdings Limited, a private limited company incorporated in England.
Consolidated accounts are prepared by AC Acquisitions Limited and copies are available to the public from AC Acquisitions Limited’s registered office c/o Aldermore Bank PLC, Fourth Floor, Apex Plaza, Forbury Road, Reading, Berkshire, RG1 1AX.
39 Post balance sheet eventsThere have been no material post balance sheet events.
37 Financial instruments (continued)

#peoplewhomade2013

Aldermore Bank PLC is authorised by the Prudential Regulation Authority and regulated by the Financial Conduct Authority and the Prudential Regulation Authority. Registered Office: 1st Floor, Block B, Western House, Lynch Wood, Peterborough PE2 6FZ. Registered in England no. 947662.
aldermore.co.uk