Embed Size (px)
Citation preview

PROJECTREPORT
JAM & JELLY
PURPOSEOFTHEDOCUMENT
This particular pre-feasibility is regarding Jam & Jelly
The objective of the pre-feasibility is primarily to facilitate potential entrepreneurs’ in project identification for investment and in order to serve this objective; the
document covers various aspects of the project concept development, startup, marketing, and finance and business management
[We can modify the project capacity and project cost as per your requirement. We can also prepare project report on any subject as per your requirement.]
Prepared By:
Institute for Industrial development A unit of M/S Samadhan Samiti
Email: [email protected] Phone: +91 7408733333,
+91 7607655555

JAM & JELLY
Introduction
Many varieties of fruit preserves are made globally, including sweet fruit preserves, such as those made from strawberry or apricot, and savoury preserves, such as those made from tomatoes or squash. The ingredients used and how they are prepared determine the type of preserves; jams, jellies, and marmalades are all examples of different styles of fruit preserves that vary based upon the fruit used. In English, the word, in plural form, "preserves" is used to describe all types of jams and jellies.
Jam typically contains both the juice and flesh of a fruit or vegetable, although one cookbook defines it as a cooked and jelled puree. The term "jam" refers to a product made of whole fruit cut into pieces or crushed, then heated with water and sugar to activate its pectin before being put into containers.
Jelly refers exclusively to a clear or translucent fruit spread made from sweetened fruit (or vegetable) juice—thus differing from jam by excluding the fruit's flesh—and is set by using its naturally occurring pectin, whereas outside North America jelly more often refers to a gelatin-based dessert, though the term is also used to refer to clear jams such as blackcurrant and apple. In the United Kingdom, redcurrant jelly is a condiment often served with lamb, game meat including venison, turkey and goose in a festive or Sunday roast. It is a clear jam, set with pectin from the fruit, and is made in the same way, by adding the redcurrants to sugar, boiling, and straining.
Formulation
Pectin is essential to the formation of Jam & jelly because it acts as a gelling agent, meaning when the pectin chains combine, they create a network that results in a gel. The strength and effectiveness of the side chains and the bonds they form depend on the pH of the pectin.

Characteristics of Jam & Jelly
1. Jam and fruit preserves are made from fresh, frozen, concentrated, or previously canned fruit that is cooked with sugar (and added pectin, if required), until enough water has evaporated and it gels. The total soluble solids (TSS) should be > 65%.
2. Jellies are gelatinous, clear, and made from fruit juice and sugar, texture is firm, and it holds its shape. The TSS should be > 65%.
3. Marmalade is made from citrus fruit—sliced or diced, suspended in clear jelly.
4. Lower In fat.
Description of Jam & Jelly Machine
Following machines are required for Jam & Jelly manufacturing unit.
1. Pulper Machine
2. Slicing Machine
3. Juice Extractor
4. Steam Jacketed Kettle
5. Mixer/Grinder
6. Bottle Washing and Filling Machine
7. Baby Boiler
8. Cap Sealing Machine
9. Stirrers, SS Utensils, Burner, Weighing Scales, Hand Gloves
These Machines are used to produce jam & jelly from the raw material. With the help of this machine the work of mixing, extruding & packaging completes in a very short span.
Jam & jelly Market Analysis
The global jam, jelly, and preserves market is projected to register a CAGR of 3.6%, during the forecast period (2019-2024).

Jams, jellies, and preserves are experiencing an increasing demand, all over the world. In regions, like Europe and North America, these products are consumed on a daily basis, by consumers of all age groups. Jams, jellies and preserves have become a part of their daily meals.
The rising health issues, such as obesity, diabetes, and others, and the availability of other kinds of spreads in the market are the major restraints.
As a result, consumers are demanding for jams, jellies, and preserves that are fortified, contain low fat, low sugar, and possess other health-promoting properties.
Owing to the increasing demand for clean-label ingredients, there is an increase in the usage of natural and organic ingredients, in the preparation of jams, jellies, and preserves.
Jam & Jelly Manufacturing Process
Jam & jelly is created by boiling fruit, fruit pulp or canned fruit with water to and adding a sweetening ingredient. In Canada, jam must contain at least 45% of the named fruit and 66% water soluble solids. Jam may contain small amounts of pectin, pectinous preparation or acid ingredients if there is a deficiency in natural pectin. In Canada, Jam may also contain a class II preservative, a pH adjusting agent, an antifoaming agent and cannot contain any apple or rhubarb.
Machinery &Equipment’s required:
Description Value
Main Machinery price 700000
GST @ 18% 1,26,000
Total Cost 8,26,000
* Machine Value is exclusive of other transportation cost.

Furniture & Fixture Requirement: Cost of office furniture (Table, chairs, workstation): Rs. 1,00,000.
Raw Material Requirement
The major consumables you require are fruits, sugar, pectin, additives, preservatives, food colours etc.
Labour Requirement:
2 Manpower are required for the Jam & Jelly unit.
Includes:
1 skilled labour
1 unskilled Labour
Land &Building required:
Land required 650-700 Square Feet (approx.)
Approximate rent for the same is 13000 per Month.
Jam & Jelly License &Registration
For Proprietorship
Obtain the GST registration. Fire/ Pollution Registration as required. Choice of a Brand Name of the product and secure the name with
Trademark if required.
Implementation Schedule
S.N. Activity Time Required
(In Months)
1 Registration, selection of site, statutory, Licensing
1 Month

2 Order to Machine, Raw material & recruitment 1 Month
3 Training & market survey 1 Month
4 Commissioning & commercial production 1 Month
5 Arrangement of Finance 1 month
Total time Required (some activities shall rum simultaneously)
2-3 months (approx.)

PROJECT AT A GLANCE
1 Name of the Entrepreneur Xx
2 Constitution (legal Status) : : Xx
3 Father's/Spouse’s Name
Xx
4 Unit Address :
Taluk/Block: xx
District : xx
Pin:
E-Mail : xx
Mobile xx
5 Product and By Product : Jam & Jelly
6 Name of the project / business activity proposed :
7 Cost of Project : Rs. 9.26
8 Means of Finance
Term Loan
Rs. 8.33 Lacs
KVIC Margin Money
Rs. 25% of 9.26 Lacs (2.315 Lacs)
Own Capital
Rs. 1.70 Lacs
9 Debt Service Coverage Ratio
:
10 Pay Back Period :
5 years
11 Project Implementation Period :
6 months
12 Employment :
13 Power Requirement : 7 KW connection
14 Major Raw materials :
fruits, sugar
15 Estimated Annual Sales Turnover
:
66 Lacs (at 50% capacity)
16 Detailed Cost of Project & Means of Finance
COST OF PROJECT
(Rs. In Lacs)
Particulars Amount
Land
Building & Civil Work -
Plant & Machinery 8.26
Furniture & Fixtures 1.00
Pre-operative Expenses
Contingencies

Working Capital Requirement 7.78
Total 17.04
MEANS OF FINANCE
Particulars Amount
Own Contribution 1.70
Bank Finance 8.33
working capital from bank
7.00
Total 17.04
KVIC Margin Monery
25% of 9.26 Lacs (2.315 Lacs)

FINANCIAL ASSISTANCE REQUIRED
Term Loan of Rs. 8.33 Lacs and Working Capital limit of Rs. 7.00 Lacs
COST OF PROJECT PARTICULARS AMOUNT AMOUNT AMOUNT
10.00% 90.00%
Building Civil Work
Plant & Machinery 8.26 0.83
7.43
Furniture & Fixtures and Other Assets 1.00 0.10
0.90
Working capital 7.78 0.78
7.00
Total 17.04 1.80
15.33
MEANS OF FINANCE PARTICULARS AMOUNT
Own Contribution
1.70
Bank Loan
8.33
Working capital Limit
7.00
Total
17.04
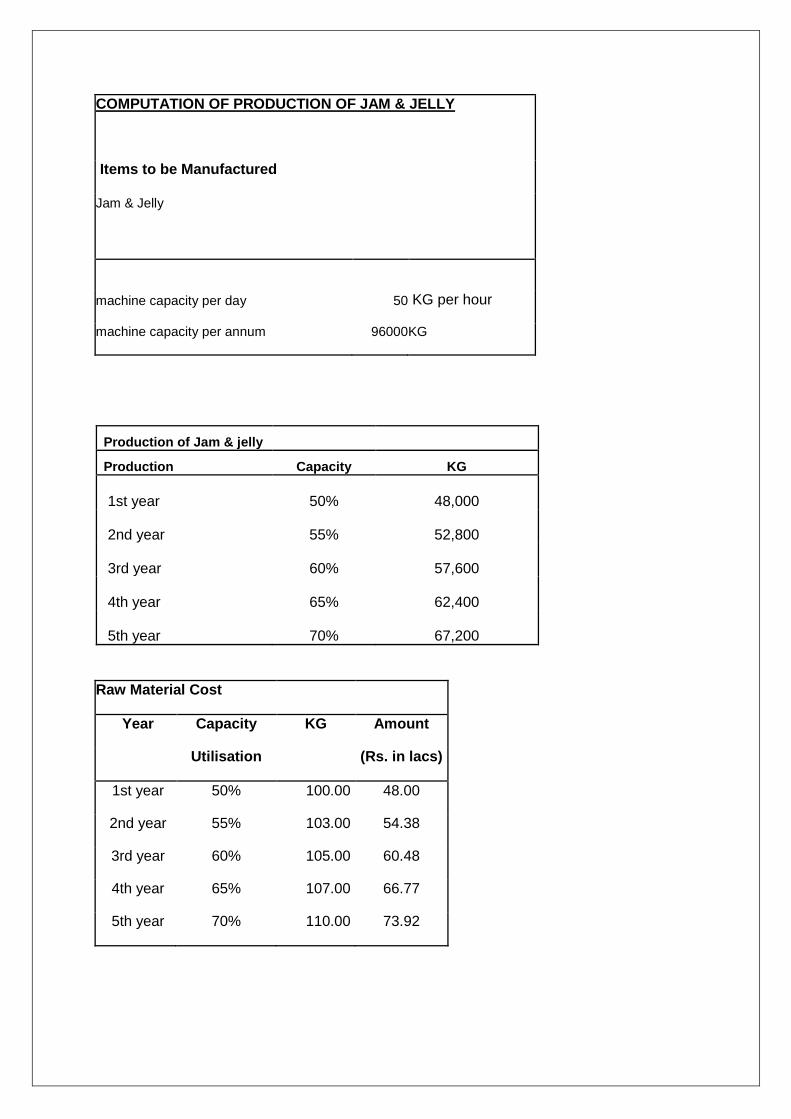
COMPUTATION OF PRODUCTION OF JAM & JELLY
Items to be Manufactured
Jam & Jelly
machine capacity per day 50 KG per hour
machine capacity per annum 96000 KG
Production of Jam & jelly
Production Capacity KG
1st year 50%
48,000
2nd year 55%
52,800
3rd year 60%
57,600
4th year 65%
62,400
5th year 70%
67,200
Raw Material Cost
Year Capacity KG Amount
Utilisation
(Rs. in lacs)
1st year 50% 100.00 48.00
2nd year 55% 103.00 54.38
3rd year 60% 105.00 60.48
4th year 65% 107.00 66.77
5th year 70% 110.00 73.92

Packaging Charges
Raw Material KG
Rate perKG
Amount
(Rs. in lacs)
1st year 48,000 6.00 2.88
2nd year 52,800 6.50 3.43
3rd year 57,600 7.00 4.03
4th year 62,400 7.50 4.68
5th year 67,200 8.00 5.38
COMPUTATION OF SALE
Particulars 1st year 2nd year 3rd year 4th year 5th year
Op Stock - 4,000 4,400 4,800 5,200
Production 48,000 52,800 57,600 62,400 67,200
Less : Closing Stock 4,000 4,400 4,800 5,200 5,600
Net Sale 44,000 52,400 57,200 62,000 66,800
sale price per KG 150.00 152.00 153.00 155.00 157.00
Sales (in Lacs) 66.00 79.65 87.52 96.10 104.88
BREAK UP OF LABOUR CHARGES
Particulars Wages No of Total
Per Month Employees Salary
Skilled 12000 1 12000
Unskilled 10000 2 20000
Total Salary Per Month
32000
Total Annual Labour Charges (in Lacs) 3.84

BREAK UP OF STAFF Charges
Particulars Wages No of Total
Per Month Employees Salary
Accountant 12000 1 12000
Helper 7000 1 7000
Total Salary Per Month
19000
Total Annual Labour Charges (in Lacs) 2.28
Utility Charges at 100% capacity (per month)
Particulars value Description
Power connection required 5 KWH
consumption per day 40 units
Consumption per month 800 units
Rate per Unit 7 Rs.
power Bill per month 5600 Rs.

PROJECTED PROFITABILITY STATEMENT
PARTICULARS 1st year 2nd year 3rd year 4th year 5th year
Capacity Utilisation % 50% 55% 60% 65% 70%
SALES
Gross Sale
Jam & Jelly 66.00 79.65 87.52 96.10 104.88
Total 66.00 79.65 87.52 96.10 104.88
COST OF SALES
Raw Mateiral Consumed 48.00 54.38 60.48 66.77 73.92
Elecricity Expenses 0.67 0.74 0.81 0.89 0.98
Depriciation 1.34 1.14 0.98 0.83 0.71
Consumables 1.98 2.39 2.63 2.40 2.10
Repair & maintennace 1.32 1.75 1.93 2.11 2.31
other direct expenses 1.78 2.15 2.36 2.59 2.83
Bottle charges 2.88 3.43 4.03 4.68 5.38
Cost of Production 57.97 65.99 73.22 80.29 88.23
Add: Opening Stock /WIP - 4.83 5.50 6.10 6.69
Less: Closing Stock /WIP 4.83 5.50 6.10 6.69 7.35
Cost of Sales 53.14 65.32 72.61 79.70 87.57
GROSS PROFIT 12.86 14.33 14.90 16.40 17.31
salary to staff 2.28 2.51 2.76 3.03 3.34
Interest on Term Loan 0.83 0.78 0.63 0.49 0.07
Interest on working Capital 0.77 0.77 0.77 0.77 0.77
Rent 3.60 3.96 4.36 4.79 5.27

Selling & adm Exp 1.98 3.19 2.63 2.88 3.15
TOTAL 9.46 11.20 11.14 11.97 12.60
NET PROFIT 3.40 3.12 3.76 4.44 4.71
Taxation
PROFIT (After Tax) 3.40 3.12 3.76 4.44 4.71

PROJECTED BALANCE SHEET
PARTICULARS 1st year 2nd year 3rd year 4th year 5th year
Liabilities
Capital
opening balance
4.11 5.73 7.69 10.13
Add:- Own Capital 1.70
Add:- Retained Profit 3.40 3.12 3.76 4.44 4.71
Less:- Drawings 1.00 1.50 1.80 2.00 2.20
Closing Blance 4.11 5.73 7.69 10.13 12.64
Subsidy Reserve 2.32 2.32 2.32 - -
Term Loan 7.67 6.35 5.03 1.39 0.18
Working Capital Limit 7.00 7.00 7.00 7.00 7.00
Sundry Creditors 2.40 2.54 3.02 3.34 3.70
Provisions & Other Liab 0.30 0.40 0.55 0.66 0.83
TOTAL : 23.80 24.34 25.62 22.52 24.34
Assets
Fixed Assets ( Gross) 9.26 9.26 9.26 9.26 9.26
Gross Dep. 1.34 2.48 3.46 4.29 5.00
Net Fixed Assets 7.92 6.78 5.80 4.97 4.26
FD of Subsidy 2.32 2.32 2.32
Current Assets
Sundry Debtors 2.75 3.32 4.38 4.00 5.24
Stock in Hand 8.83 10.03 11.14 12.25 13.51
Cash and Bank 1.98 1.89 1.98 1.29 1.26
TOTAL : 23.80 24.34 25.62 22.52 24.27

PROJECTED CASH FLOW STATEMENT
PARTICULARS 1st year 2nd year 3rd year 4th year 5th year
SOURCES OF FUND
Own Margin 1.70
Net Profit 3.40 3.12 3.76 4.44 4.71
Depriciation & Exp. W/off 1.34 1.14 0.98 0.83 0.71
Increase in Cash Credit 7.00 - - - -
Increase In Term Loan 8.33 - - - -
Increase in Creditors 2.40 0.14 0.49 0.31 0.36
Increase in Provisions & Oth lib 0.30 0.10 0.15 0.11 0.17
increase in subsidy 2.32
TOTAL : 26.80 4.51 5.37 5.69 5.94
APPLICATION OF FUND
Increase in Fixed Assets 9.26
Increase in Stock 8.83 1.20 1.11 1.11 1.26
Increase in Debtors 2.75 0.57 1.06 - 0.37 1.24
Repayment of Term Loan 0.66 1.32 1.32 3.64 1.28
Increase in FD 2.32 - - -
Drawings 1.00 1.50 1.80 2.00 2.20
Taxation - - - - -
TOTAL : 24.82 4.59 5.29 6.38 5.98
Opening Cash & Bank Balance - 1.98 1.89 1.98 1.29
Add : Surplus 1.98 - 0.08 0.09 - 0.69 - 0.03
Closing Cash & Bank Balance 1.98 1.89 1.98 1.29 1.26

COMPUTATION OF CLOSING STOCK & WORKING CAPITAL
PARTICULARS 1st year 2nd year 3rd year 4th year 5th year
Finished Goods
4.83 5.50 6.10 6.69 7.35
Raw Material
4.00 4.53 5.04 5.56 6.16
Closing Stock 8.83 10.03 11.14 12.25 13.51
COMPUTATION OF WORKING CAPITAL REQUIREMENT
TRADITIONAL METHOD
Particulars Amount Own Margin Bank Finance
Finished Goods & Raw Material 8.83
Less : Creditors 2.40
Paid stock 6.43 10% 0.64 90% 5.79
Sundry Debtors 2.75 10% 0.28 90% 2.48
9.18 0.92 8.26
WORKING CAPITAL LIMIT DEMAND ( from Bank) 7.00

2nd Method
PARTICULARS 1st year 2nd year
Total Current Assets 13.56 15.24
Other Current Liabilities 2.70 2.94
Working Capital Gap 10.86 12.31
Min Working Capital
25% of WCG 2.71 3.08
Actual NWC 3.86 5.31
item III - IV 8.14 9.23
item III - V 7.00 7.00
MPBF (Lower of VI & VII) 7.00 7.00
3rd Method
PARTICULARS 1st year 2nd year
Total Current Assets 13.56 15.24
Other Current Liabilities 2.70 2.94
Working Capital Gap 10.86 12.31
Min Working Capital
25% of Current Assets 3.39 3.81
Actual NWC 3.86 5.31
item III - IV 7.47 8.50
item III - V 7.00 7.00
MPBF (Lower of VI & VII) 7.00 7.00

COMPUTATION OF DEPRECIATION
Description Plant & Machinery Furniture TOTAL
Rate of Depreciation 15.00% 10.00%
Opening Balance - - -
Addition 8.26 1.00 9.26
Total 8.26 1.00 9.26
Less : Depreciation 1.24 0.10 1.34
WDV at end of Year 7.02 0.90 7.92
Additions During The Year - - -
Total 7.02 0.90 7.92
Less : Depreciation 1.05 0.09 1.14
WDV at end of Year 5.97 0.81 6.78
Additions During The Year - - -
Total 5.97 0.81 6.78
Less : Depreciation 0.90 0.08 0.98
WDV at end of Year 5.07 0.73 5.80
Additions During The Year - - -
Total 5.07 0.73 5.80
Less : Depreciation 0.76 0.07 0.83
WDV at end of Year 4.31 0.66 4.97
Additions During The Year - - -
Total 4.31 0.66 4.97
Less : Depreciation 0.65 0.07 0.71
WDV at end of Year 3.67 0.59 4.26
s - - -

Total 3.67 0.59 4.26
Less : Depreciation 0.55 0.06 0.61
WDV at end of Year 3.12 0.53 3.65
Less : Depreciation 0.47 0.05 0.52
WDV at end of Year 2.65 0.48 3.13
Less : Depreciation 0.40 0.05 0.45
WDV at end of Year 2.25 0.43 2.68
CALCULATION OF D.S.C.R
PARTICULARS 1st year
2nd year
3rd year
4th year
5th year
CASH ACCRUALS
4.74
4.27
4.74
5.27
5.42
Interest on Term Loan
0.83
0.78
0.63
0.49
0.07
Total
5.57
5.04
5.37
5.76
5.50
REPAYMENT
Instalment of Term Loan
0.66
1.32
1.32
3.64
1.28
Interest on Term Loan
0.83
0.78
0.63
0.49
0.07
Total
1.49
2.10
1.95
4.13
1.35
DEBT SERVICE COVERAGE RATIO 3.75 2.41 2.75 1.39 4.06
AVERAGE D.S.C.R.
2.87

REPAYMENT SCHEDULE OF TERM LOAN
Interest 11.00%
Year Particulars Amount Addition Total Interest Repayment Closing Balance
ist Opening Balance
1st month - 8.33
8.33 - - 8.33
2nd month 8.33 -
8.33 0.08 - 8.33
3rd month 8.33 -
8.33 0.08 - 8.33
4th month 8.33 -
8.33 0.08
8.33
5th month 8.33 -
8.33 0.08
8.33
6th month 8.33 -
8.33 0.08
8.33
7th month 8.33 -
8.33 0.08 0.110 8.22
8th month 8.22 -
8.22 0.08 0.110 8.11
9th month 8.11 -
8.11 0.07 0.110 8.00
10th month 8.00 -
8.00 0.07 0.110 7.89
11th month 7.89 -
7.89 0.07 0.110 7.78
12th month 7.78 -
7.78 0.07 0.110 7.67
0.83 0.660
2nd Opening Balance
1st month 7.67 -
7.67 0.07 0.110 7.56
2nd month 7.56 -
7.56 0.07 0.110 7.45
3rd month 7.45 -
7.45 0.07 0.110 7.34
4th month 7.34 -
7.34 0.07 0.110 7.23
5th month 7.23 -
7.23 0.07 0.110 7.12
6th month 7.12 -
7.12 0.07 0.110 7.01
7th month 7.01 -
7.01 0.06 0.110 6.90
8th month 6.90 -
6.90 0.06 0.110 6.79
9th month 6.79 -
6.79 0.06 0.110 6.68
10th month 6.68 -
6.68 0.06 0.110 6.57
11th month 6.57 -
6.57 0.06 0.110 6.46
12th month 6.46 -
6.46 0.06 0.110 6.35

0.78 1.320
3rd Opening Balance
1st month 6.35 -
6.35 0.06 0.110 6.24
2nd month 6.24 -
6.24 0.06 0.110 6.13
3rd month 6.13 -
6.13 0.06 0.110 6.02
4th month 6.02 -
6.02 0.06 0.110 5.91
5th month 5.91 -
5.91 0.05 0.110 5.80
6th month 5.80 -
5.80 0.05 0.110 5.69
7th month 5.69 -
5.69 0.05 0.110 5.58
8th month 5.58 -
5.58 0.05 0.110 5.47
9th month 5.47 -
5.47 0.05 0.110 5.36
10th month 5.36 -
5.36 0.05 0.110 5.25
11th month 5.25 -
5.25 0.05 0.110 5.14
12th month 5.14 -
5.14 0.05 0.110 5.03
0.63 1.320
4th Opening Balance
1st month 5.03 -
5.03 0.05 0.110 4.92
2nd month 4.92 -
4.92 0.05 0.110 4.81
3rd month 4.81 -
4.81 0.04 0.110 4.70
4th month 4.70 -
4.70 0.04 0.110 4.59
5th month 4.59 -
4.59 0.04 0.110 4.48
6th month 4.48 -
4.48 0.04 0.110 4.37
7th month 4.37 -
4.37 0.04 0.110 4.26
8th month 4.26 -
4.26 0.04 0.110 4.15
9th month 4.15 -
4.15 0.04 0.110 4.04
10th month 4.04 -
4.04 0.04 0.110 3.93
11th month 3.93 -
3.93 0.04 0.110 3.82
12th month(Subsidy adjusted)
3.82 -
3.82 0.04 2.430 1.39
0.49 3.640
5th Opening Balance
1st month 1.39 -
1.39 0.01 0.110 1.28

2nd month 1.28 -
1.28 0.01 0.110 1.17
3rd month 1.17 -
1.17 0.01 0.110 1.06
4th month 1.06 -
1.06 0.01 0.110 0.95
5th month 0.95 -
0.95 0.01 0.110 0.84
6th month 0.84 -
0.84 0.01 0.110 0.73
7th month 0.73 -
0.73 0.01 0.110 0.62
8th month 0.62 -
0.62 0.01 0.110 0.51
9th month 0.51 -
0.51 0.00 0.110 0.40
10th month 0.40 -
0.40 0.00 0.110 0.29
11th month 0.29 -
0.29 0.00 0.110 0.18
12th month 0.18 -
0.18 0.00 0.180 -
0.07 1.28
DOOR TO DOOR 60 MONTHS
MORATORIUM PERIOD 6 MONTHS
REPAYMENT PERIOD 54 MONTHS

DISCLAIMER
The views expressed in this Project Report are advisory in nature, iid.org.in and/or Institute
for Industrial Development (IID) assume no financial liability to anyone using the content for
any purpose. All the materials and content contained in Project report is for educational
purpose and reflect the views of the industry which are drawn from various research material
sources from internet. The actual cost of the project or industry will have to be taken on case
to case basis considering specific requirement of the project. It is intended for general
guidance only and must not be considered a substitute for a competent legal advice provided
by a licensed industry professional. iid.org.in and/or Institute for Industrial Development (IID)
hereby disclaims any and all liability to any party for any direct, indirect, implied, punitive,
special, incidental or other consequential damages arising directly or indirectly from any use
of the Project Report Content, which is provided as is, and without warranties