Embed Size (px)
Citation preview

1
Microbial community changes along the Ecology Glacier ablation zone (King George Island, Antarctica)
Jakub Grzesiak1*, Marek K. Zdanowski1, Dorota Górniak2, Aleksander Świątecki2, Tamara Aleksandrzak-Piekarczyk3, Katarzyna Szatraj3, Joanna Sasin-Kurowska4, Marta Nieckarz5
1Polish Academy of Sciences, Institute of Biochemistry and Biophysics, Department of Antarctic Biology, Pawińskiego 5a, 02-106 Warsaw, Poland
2University of Warmia and Mazury, Department of Microbiology, Oczapowskiego 1A, 10-719 Olsztyn, Poland
3Polish Academy of Sciences, Institute of Biochemistry and Biophysics, Department of Microbial Biochemistry, Pawińskiego 5a, 02-106 Warsaw, Poland
4Warsaw University, Institute of Genetics and Biotechnology, Pawińskiego 5a, 02-106 Warsaw, Poland
5Department of Applied Microbiology, Institute of Microbiology, Faculty of Biology, University of Warsaw, Ilji Miecznikowa 1, 02-096 Warsaw, Poland
*Corresponding author: [email protected]
Key words: glacial ice, cryoconite holes, microbiocenosis, microbial abundance, snow line
Abstract
In recent years glacial surfaces have received much attention as microbial habitats of diverse photoautotrophic and heterotrophic cells. Supraglacial ecosystems are annually covered and uncovered by snow. The aim of this study was to investigate the microbial community response to changing environmental conditions in a transect following the receding snow line on the surface of Ecology Glacier (King George Island, Antarctica). Parameters of surface ice and cryoconite holes included chemical composition of ice and sediment, Bacteria diversity by denaturating gradient gel electrophoresis (DGGE), microbial functional diversity (Biolog Ecoplates), and microbial counts (epifluorescence microscopy, colony forming units - CFU). Data demonstrated profound differences between surface ice and cryoconite holes. Changing environmental factors along the transect influenced composition and abundance of the microbiocenosis in both habitat types. Several parameters correlated positively with distance from the glacier edge, including the cell morphotype Shannon Index, chlorophyll a, nitrogen and seston concentrations. Suspended solids content positively correlated with microbial

2
abundance and diversity. Nitrogen and phosphorus were limiting factors of microbial growth as amounts of organic nitrogen and phosphorus positively correlated with the cell numbers, fission rates and photoautotroph contribution. Our findings indicate that microbial community shows a response in terms of abundance and diversity to exposure of the glacial surface as snow-cover melts. To our knowledge this is the first study to recognize a microbial development pattern on a glacier surface in connection with the receding snow line. This may help better understand variability within supraglacial habitats, correct sampling procedures and inform biocenotic development models.
Introduction
A significant part of the biosphere is permanently below 5°C (Anesio and Laybourn-Parry 2012). This includes glaciers and ice sheets, which occupy 11% of Earth’s surface, and which comprise ~70% of surface global freshwater (Shiklomanov 1993; Paterson 1994). Glacial systems result from the perennial accumulation of snow. Their subsequent deformation leads to their flow to lower elevations, where they ultimately melt, sublimate or calve in the ablation zone. The glacial surface is annually covered by fresh snow whose melting during summer months exposes the ice below. As summer progresses, the ablation zone expands as the ‘snow line’ advances up the glacier (Hooke 2005; Anesio and Laybourn-Parry 2012; Edwards et al. 2014). The gradually exposed ice is subjected to wind, solar radiation and aeolian inputs of mineral and organic materials, resulting in its melting; the water produced circulates over and in the ice structure (Hodson 2008). This water often carries a suspension that originates from wind-carried debris from local and from more distant sources (Zarsky et al. 2013). The dark dust deposit is known as cryoconite, and in sufficient quantities reduces ice surface albedo and accelerates melting. As the ice melts, a water-filled hole forms, into which the dark material sinks (Cameron et al. 2012).
Scientific interest in the biology of glaciers was limited up to the 1980s because they were considered to be ‘ice deserts’ with little biological activity (Edwards et al. 2014). However, Kohshima (1984) identified a simple glacier-associated food web. Hodson et al. (2008) and Anesio et al. (2009) then radically changed old beliefs by focusing on the importance of high microbial activity on glaciers in the global carbon cycle. Microbes which are adapted to live under very low temperatures dominate such cryosphere environments, and may comprise 4x1025 to 7x1029 cells in glacial ice globally, and up to 1 x 1026 bacterial cells in the uppermost 1-2 m of ablating glacier ice areas (Irvine-Fynn et al. 2012). Microbiological investigations of glacial habitats have revealed their microbial communities are active in biogeochemical transformations because they can perform metabolic functions involved in the C, N and P cycles (Hodson et al. 2007; Telling et al. 2011; Stibal et al. 2008a). This has important implications at local and global scales. Due to favorable irradiance conditions and access to water, photoautotrophs are more abundant in surface layers than deeper in the ice (Quesada and Vincent 2012). Cell numbers in this glacial ‘euphotic zone’ are of the same order of magnitude as in photic habitats in warmer climates (Edwards et al. 2014).

3
We report here on microbial communities on the surface of Ecology Glacier, a rapidly receding glacier on King George Island, South Shetland Islands, Antarctica. We hypothesize that gradual exposure of ice under melting snow is one of the major factors causing spatial variations of chemical composition, bacterial phylogenetic and microbial functional diversity, and abundance in surface ice and cryoconite holes. We analyzed the data using Simple Regression and Principal Component Analysis (PCA) in order to identify environmental controls of microbial processes. By identifying biological and physical variables for microbial community development in supraglacial habitats, we aim to supplement the still scarce knowledge of these disappearing habitats, and better inform microbiocenotic development models. We also quantitatively and qualitatively investigated the culturable component of the glacial microbial community.
Materials and Methods
Sites and sampling
Ecology Glacier is situated at the western shore of Admiralty Bay, on King George Island, South Shetland Archipelago, Antarctica. It is subjected to annual surface snow melt like other glaciers in the vicinity (Braun and Gossmann 2002). The altitude and distance from glacier terminus of the transient snow line has been observed from early November . Samples were taken in December 2011/January 2012, when the snow line reached over 200 m. a.s.l. and nearly 2 km from glacier terminus. Ice and cryoconite material were collected aseptically at 6 sites on the surface of Ecology Glacier into chemically clean and sterile containers along a 1841 m transect running from the glacier terminus to the snow line at the top of the ablation zone (Tab. 1, Fig. 1). Ice samples were termed EI (Ecology Ice), with EI1 being the first point in the ablation zone, and EI5 the snow line point. Additionally, site EDI was selected below the first sampling point on a fragment of the glacier, which in previous years was an integral part of the glacier and at the sampling period was recognized as dead-ice (Schomacker 2008). Cryoconite samples were labeled EC2 to EC5, the number indicating the same area as the surface ice samples (no cryoconite holes were found in the dead-ice and EI1 areas).
During the 2011/2012 austral summer, ice from the glacier’s surface was crushed with an 70% EtOH sterilized and deionized water-washed Tonar ice auger (158 cm long, 130 mm diameter), collected using sterile plastic spatulas and placed into sterile plastic bags. The crushed ice was gathered from 5 points per sampling site, in an area of 100 m2. Pooled cores totaled 3 kg per site. Cryoconite holes were drained of water and sediment with a 160 mL sterile plastic syringe, and the material was transported in 500 mL sterile bottles to a field laboratory and processed within 2 hours. Five cryoconite holes per site were drained and pooled. A duplicate set of samples was stored at -20°C for further research in Poland.
Measurement of ice and cryoconite components

4
Chloride, sulfate, nitrate, sodium, potassium, calcium and magnesium ion concentrations were determined by high-pressure liquid chromatography (HPLC) in a Shimadzu Prominence modular HPLC model device. Phosphates, total phosphorus (after mineralization), total iron and silicate contents were measured in a Shimadzu UV 1601 spectrophotometer, while nitrates were measured on an Epoll-Eco 20 spectrophotometer (Standard Methods 1980, Hermanowicz et al. 1999). Total organic carbon (TOC), dissolved organic carbon (DOC), particulate organic carbon (POC) and total nitrogen contents were determined in a Shimadzu TOCV-CSH organic carbon analyzer with a TNM-1 total nitrogen analyzer attachment. Particulate content in water was determined by filtering the sample through a combusted Whatman GF/C glass fibre filter (nominal pore size, 1.2 μm) which was then dried at 105ºC; organic matter content was measured as that amount lost on ignition after combustion at 550ºC. Chlorophyll a and pheophytin concentrations were calculated after the Lorenzen equation after extraction in acetone (at 4ºC) and spectrophotometry. A DOC spectrum was determined in a quartz cuvette at 260nm in a Shimadzu UV-1601 bichannel scanning spectrophotometer (Shinichi et al. 2004). The spectrum was corrected against a demineralized water background. SUVA (specific UV absorbance) was calculated as the relative content of aromatic matter (=Abs260 x 1000 DOC-1).
Sample preparation for microbiology Ice samples were melted in a refrigerator (4°C) before processing for microbiological analyses. Cryoconite material was shaken gently on a universal shaker (Premed, model 327) (120 rpm, 20 min, 5°C). Suspensions were then returned to the refrigerator for 10–20 min to allow larger particles to settle. Aliquots of 1mL, 0.5mL and 0.1mL were spread-plated on R2A agar (R2A) and 8-fold diluted R2A agar (R2A/8) (Biocorp). Further, 300mL of melted ice was filtered (47 mm polycarbonate filter, 0.2µm pores), after which the filter was placed in a 50mL sterile plastic tube and shaken with 20mL of melted ice to concentrate the microbes by resuspension in an appropriate medium. The suspension was plated onto R2A agar, and 8-fold diluted R2A agar (R2A/8) as described above. The remainder was frozen for further analysis. Inoculated plates were incubated in darkness at 4°C for 6 weeks. After 6 weeks incubation, cells were collected from R2A and R2A/8 plates by adding 2 x 5mL of sterile 0.9% saline to the plate and suspending the colonies with a sterile plastic spreader (plate wash). The plate wash suspensions were collected into 15mL sterile plastic tubes and homogenized by repeated pipetting (Ellis et al. 2003).
Microbial abundance Sub-samples of melted ice were fixed with buffered formalin to a final concentration of 1% for total counts (TC). Counts were determined in 5mL of melted glacier ice and 1mL of cryoconite water/sediment suspension by epifluorescence microscopy with 4,6-diamidino-2-phenylindole (DAPI) on black Nuclepore® polycarbonate 0.2 µm filters (Porter and Feig 1980), under a Nikon E-200 microscope fitted with a 100W Hg lamp and 100x CFI 60 oil immersion objective, a digital DS-5Mc-U1 Cooled Camera Head, and a filter block of EX 330-380, DM 400, BA 420. Images of fields were analyzed in the Nikon NIS Elements BR 2.30 and MultiScan v.14.02. A minimum 400 cells in 20 fields per sample was counted
5
automatically in the image analysis system. Cell volumes were evaluated by image analysis (Sieracki et al. 1985; Świątecki 1997).
Photoautotrophs including cyanobacteria and photoautotrophic eukaryotes were counted under blue (450–490 nm, B-2A Nikon filter) and green (510–560 nm, G-2A Nikon filter) light (Putland and Rivkin 1999). Cell morphotype diversity was described through the frequency of cocci, rods and curved forms in five volume classes (<0.1; 0.1–0.2; 0.2–0.5, 0.5–1.0; >1 µm3), with a modified Shannon index (Gurienowich 1995; Nübel et al. 1999). Culturable microbial abundance was performed by CFU enumeration after 42 days incubation on R2A agar.
Denaturating gradient gel electrophoresis analysis Water samples and cryoconite water- sediment mix (500 mL) were vacuum filtered through Millipore GTTP 0.2-µm pore-sized (47 mm diameter) white polycarbonate membranes in a sterile filter holder (Nalgene). Total DNA was extracted from the membranes in the UltraClean™ Water DNA Isolation Kit (MoBio, Carlsbad, CA) in accordance with the manufacturer’s protocol. Total DNA from plate wash samples was extracted using Bacterial and Yeast Genomic DNA Purification Kit (EURx Ltd.) according to manufacturer’s protocol. DNA quality and yield were measured with a NanoVueTM spectrophotometer (GE Healthcare Life Science, Germany). Extracted DNA was stored at -20°C until required. DNA molecular weight and quantity was checked by electrophoresis in a 0.8% (w/v) agarose gel in 0.5% TBE (tris-borate-ethylenediaminete-triacetate, pH 8.3) buffer, and stained with 0.9 µg mL-1
ethidium bromide (Sambrook et al. 1989). A molecular size marker (1-kb ladder) was used as the reference.
DGGE analysis of the extracted DNA was performed with a D-Code Universal Mutation Detection System (BioRad Laboratories, USA). 1 µL aliquots (~5-10 ng in undiluted form) of each DNA sample was amplified in a 50 µl polymerase chain reaction mix (PCR) comprising 5 µL 10x buffer (Sigma Aldrich Co.), 6 µL of 25 mM MgCl2 (Sigma Aldrich Co.), 1.2 µL of 20 mg mL-1 BSA (Sigma Aldrich Co.), 0.4 µL of 25 mM dNTP (Sigma Aldrich Co.), 0.5 µL of each primer (20 µM each), 0.2 µL of 5U µL-1Taq DNA polymerase (Sigma Aldrich Co.), and 35.2 µL of PCR-grade water. Primers were F341 with a GC clamp (5’-CGC CCG CCG CGC CCC GCG CCC GTC CCG CCG CCC CCG CCC GCC TAC GGG AGG CAG CAG-3’) complementary to position 341 to 357 (Escherichia coli numbering), and R907 (CCG TCA ATT CMT TTG AGT TT) complementary to positions 926 to 907 (Muyzer et al.1993; Muyzer et al. 1998). Samples were loaded on a 6% acrylamide gel with a denaturing gradient of 35–70% (where 100% denaturant is 7M urea and 40% formamide). Gels were run at 60V for 17 h at 60oC. Electrophoretic products were stained by gentle agitation of the gel for 30 min in 100 mL of 1×TAE containing 5 µL 1:10000 dilution of SYBR Gold nucleic acid stain (Invitrogen, Life Technologies, UK) in DMSO. DGGE banding patterns were visualized by UV transillumination and photographed in the Gel Doc 2000 gel documentation system (BioRad Laboratories, USA). DGGE gel images were analyzed by ‘Quantity One’ software in the GelDoc gel documentation system (BioRad Laboratories, USA). Gel bands were identified using GelCompar software to create a presence-absence matrix (Crump and Hobbie, 2005). Each band represents a bacterial Operational Taxonomic Unit (OTU). The

6
presence or absence of a band in each line was converted to a binary matrix to access data for statistical analysis.
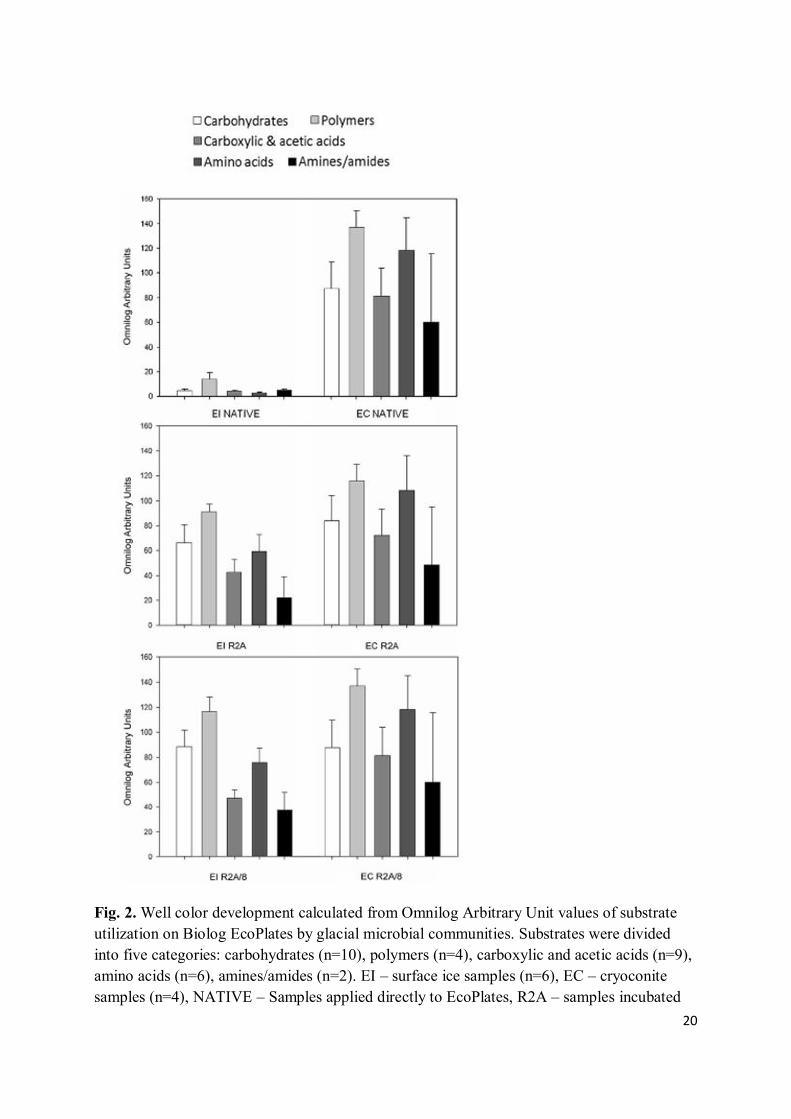
Functional diversity of total and cultivated microbiocenosis Filter concentrated ice, cryoconite and plate wash suspensions were adjusted to optical transmittance of 0.9 by addition of sterile 0.9% saline. Each suspension was then transferred aseptically to the Biolog Ecoplate (Biolog Inc., Hayward, CA). Plates were incubated in darkness at 4°C; color development was measured at 590nm in a microplate reader (OmniLog), and cell respiration was measured kinetically by determining the colorimetric reduction of tetrazolium dye. Data were collected approximately twice weekly for 65 days. The Biolog Ecoplate assesses the ability of a mixed microbial community to utilize 31 carbon compounds presented as sole carbon sources. Before determining the absorbance in ‘Omnilog’ arbitrary units at different read times, samples were first blanked against the T=0 reading and then against the plate’s respective control. Positive values were scored as the community’s ability to utilize a given carbon source. A community’s metabolic diversity was estimated from the number of substrates utilized. To compare the effect of a specific treatment, substrate utilization data were also subdivided into 5 categories representing different substrate types (carbohydrates, carboxylic and acetic acids, polymers, amino acids and amines) (Weber and Legge 2009).
Statistics Simple regression analysis between biological and environmental factors was carried out in STATISTICA v.9 (StatSoft). A Principal Component Analysis (PCA) of physico-chemical and microbiological data as well as bacterial phylogenetic community structure was conducted in a statistical package for Windows, v. Canoco 4.5 (after Braak and Smilauer 2002).
Results Sampling sites characteristics and environmental factors
Chlorophyll a contents varied in surface ice samples from 0.53 (EDI) to 3.53 µg L-1 at EI4 (Tab. 2). A similarly increasing trend was evident in cryoconite holes, with 3.74 (EC2) to 52.18 µg L-1 in EC5. Phaeophytin and total chlorophyll levels in cryoconite holes also followed this pattern, showing lowest values in EC2 (8.23 and 11.98 µg L-1, respectively), and highest in EC5 (123.26 and 175.43 µg L-1, respectively). Highest values in surface ice samples were detected in the dead-ice area (8.49 and 9.82 µg L-1). Highest amounts of total particulates were measured in the higher elevation points of the ablation zone for surface ice (EI4 - 769.20 mg dry wt. L-1), and cryoconite holes (EC5 - 9213 mg dry wt. L-1), comprising in all but one case (i.e., DIE) mostly organic material. pH ranged from 6.10 (EI3) to 7.15 (EI2) for ice samples, and 6.15 (EC2) to 7.00 (EC4) for cryoconite suspension.
Surface ice TOC, DOC and POC levels peaked at EI4 (4.90 mg L-1), EI3 (3.76 mg L-1), and EI2 (3.78 mg L-1) respectively; lowest values were recorded noted at EI5 (1.23 mg L-1), EDI (0.38 mg L-1), and EI3 (1.10 mg L-1). TOC in cryoconite holes ranged from 3.10 to 9.18 mg L-
1, and was composed mostly of DOC (EC3-EC5). The aromatic character of DOC (SUVA) was greatest at points closest to the glacier’s terminus (EDI -17.94 L mgC-1 m-1) for surface

7
ice, and EC2 (9.92 L mgC-1 m-1) for cryoconite holes. Low amounts of inorganic dissolved nitrogen compounds were found along the transect, with highest levels of 0.09 mg L-1 for NO2
- and 0.05 mg L-1 for NH4+. Nitrogen sources were mostly organic, and varied between
0.15 (EDI, EI3) to 0.45 mg L-1 (EI5) for ice, and 0.16 (EC2) to 3.20 mg L-1 (EC5) for cryoconite samples. Total phosphorus amounts were low, ranging from 0.03 to 0.07 mg L-1 for ice samples, and 0.07 to 0.21 mg L-1 for cryoconite suspension. In points near the snow line (EI4, EI5; EC4, EC5) phosphorus sources were mostly organic, while at near the glacier terminus (EDI, EI1) they were inorganic. Sodium and potassium levels varied along the transect, reaching highest values in EI3 (3.11 mg L-1) and EI2 (0.34 mg L-1) for ice samples, and EC3 (3.99 and 0.91 mg L-1 respectively) for cryoconite holes. The concentrations of other elements are shown in Tab. 2.
Microbial abundance and diversity Total counts in ice samples ranged from 8.1 x 10³ (EI1) to 1.01 x 10⁵ (EI4) cells mL-1, while that in cryoconite holes varied between 1.34 x 10⁵ (EC2) and 1.96 x 10⁶ (EC4) cells mL-1
(Tab. 3). CFU counts on R2A agar ranged from 2.14 x 10³ mL-1 to 1.08 x 10⁴ mL-1. CFU/TC ratio was highest in ice samples near the glacier edge, reaching 60.87% (EI1). The percentage of culturable cells was much lower in cryoconite holes, with a maximum of 2.03%.
Average cell volume determined by EFM was higher in cryoconite samples, with a maximum of 0.06 µm3, compared to ice samples (max. 0.03 µm3). The morphotype diversity index (Shannon Index) exhibited highest values in ice samples nearest the snow line (0.73 – EI5), and lowest at the glacier terminus (0.34 – EI1, 0.35 – EDI). In cryoconite holes this value was lowest and highest in neighboring sampling sites (0.43 – EC3; 0.94 – EC4). The highest and lowest dividing cell counts (DC) followed the TC trend, albeit 10-fold lower. In ice and cryoconite samples, the highest DC/TC ratios were noted in points nearest the snow line (20.1% - EI5, 31.6% - EC5); the lowest DC/TC were at the adjacent site (1.7% -EI4, 5.4% - EC4).
Photoautotroph abundance in ice samples (PHAC) followed the pattern of TC, with highest numbers at EI4 (9.13 x 10³ cells mL-1) and lowest at the edge of the glacier (ED1- 9.5 x 10² cells mL-1). In cryoconite holes, high PHAC numbers were noted in the samples nearest the glacier terminus (4.72 x 10⁴cells mL-1 – EC2) and near the snow line (3.94 x 10⁴cells mL-1 – EC5), dropping slightly in between (1.72 x 10⁴ cells mL-1 – EC4). The average length of photoautotrophic cells (PHAC av. l.) per ice sample varied from 3.18 to 15.27 µm, and increased gradually with distance from the glacier edge. Photoautotrophic cell length in cryoconite holes ranged from 5.05 (EC3) to 12.06 µm (EC2).
Phylogenetic community diversity in terms of operational taxonomic units (OTU - DGGE bands) was lower on average in ice samples, with a maximum of 12 (EI4). OTU numbers in cryoconite holes varied from 11-19. In the R2A medium plate wash, a max. of 7 and 9 OTU’s were determined in the ice and cryoconite samples respectively. The 8-fold diluted R2A medium yielded similar results. Functional diversity in Biolog Ecoplates was low in ice samples, ranging from 1 positive response (EI3) to 15 (EI4), and relatively high in cryoconite

8
holes (13 – EC4, 26 – EC2). Diluted R2A was superior to full strength R2A in recovering the functional potential of cultivable microbiota on the glacier (Tab. 3).
Substrate utilizing activities were very low in surface ice samples, compared to the cryoconite samples, and the cultivable fraction of the microbial community (Fig. 2). Polymers were the most actively metabolized group in native ice samples, specifically Tween 40 and Tween 80. D-cellobiose, D-malic acid, pyruvic acid methyl ester, α-D-lactose, glycogen, glucose-1-phosphate, putrescine and itaconic acid were also frequently utilized (data not shown). The native cryoconite microbial community displayed a broad range of metabolic activities, with amino acids being the preferred substrate type. Compounds such as itaconic acid, L-asparagine, D-mannitol, L-serine, D-galactonic acid γ-lactone, L-arginine, pyruvic acid methyl ester, putrescine, N-acetyl-D-glucosamine, D-malic acid and Tween 40 were the most frequently used substrates. Responses in the Ecoplate of the R2A plate wash-obtained surface ice microbiota (EI R2A) displayed a pattern similar to that of the respective native samples, but were much more intensely developed. Polymers remained the favorable carbon source, but carbohydrates and amino acids were also popular. The most marked color changes were seen in wells containing D-mannitol, D-cellobiose, α-D-lactose, L-asparagine, glycogen, Tween 40, itaconic acid, α-cyclodextrin or N-acetyl-D-glucosamine. Cryoconite microbes cultivated on R2A agar also showed higher tetrazolium dye conversion rates than did the native samples, with polymers being the group they utilized most frequently, followed by amino acids and carbohydrates. D-mannitol, L-asparagine, itaconic acid, L-arginine, L- serine, α-cyclodextrin, Tween 40, α-D-lactose, D-galacturonic acid and D-cellobiose were the preferred carbon sources. Plate wash from diluted R2A medium yielded the highest functional diversity; patterns of substrate utilization were the same in the full strength R2A plate wash, but the tetrazolium dye conversion rates were substantially higher (Fig. 2).
Statistics
The PCA of bacterial phylogenetic community structure in surface ice and cryoconite holes was based on the occurrence of DGGE bands (OTUs) in each of the sampling points (Fig. 3); vectors highlight the position and relative determining strength of the bands in the analysis. A phylogenetically diverse and unique community was detected in cryoconite holes EC2 and EC4. A poor microbial community diversity was detected in surface ice samples (EI1-EI4), defined by a limited number of bands. A similar phylogenetic community structure was also revealed in samples EC3, EC5, EDI and EI5, with EDI being the dead-ice samples and EI5 the snow line samples, 1.8 km apart.
A simple regression analysis between certain biological and environmental factors has been conducted. Physical, chemical or biological factors that showed significant (p<0.05) correlation have been displayed in table 4 for surface ice and table 5 for cryoconite holes. Distance from the glacier edge positively correlated with the organic phosphorus concentration (p<0.05) photoautotroph cell average length (p<0.05) and Shannon Index (p<0.01) in surface ice samples (Tab. 4) and with chlorophyll a, nitrate, organic and total nitrogen and seston contents in cryoconite holes (p<0.05) (Tab. 5). Total microbial count (TC) positively correlated in surface ice samples with functional diversity (p<0.01), nitrate, seston, SiO2 and chlorophyll a (p<0.05) levels. In cryoconite samples it displayed a negative

9
correlation with Na and Cl ions (p<0.05). The phototroph percentage correlated positively (p<0.05) with organic nitrogen levels in surface ice, in cryoconite samples with functional diversity and relative content of aromatic matter (SUVA) (p<0.01) but negatively with pH (p<0.01). In surface samples the dividing to total cell ratio displayed negative correlations with total organic carbon (p<0.01) and nitrate concentrations (p<0.05) but a positive one with organic nitrogen content (p<0.05). The CFU/TC ratio showed only a negative correlation with the distance from glacier edge (p<0.05) in surface ice but several positive (with POC (p<0.01); SUVA and Cl- (p<0.05)) as well as negative (with Ptot, Porg (p<0.01); NO3
- (p<0.05)). The phylogenetic diversity by DGGE correlated positively with Mg2+ and CaCO3 contents in the surface ice samples, while in cryoconite samples only with morphotype Shannon Index. The functional diversity by the EcoPlate assay displayed positive correlations with seston (p<0.01), chlorophyll a, SiO2 and Porg (p<0.05) in surface ice. This parameter in cryoconite samples correlated positively with SUVA, Cl- (p<0.01) and POC contents (p<0.05) but negatively with pH (p<0.01) and Porg and Ptot contents (p<0.05).
The CFU/TC ratio displayed several negative correlations with biological and chemical factors in surface ice, inter alia with the phylogenetic and functional diversity (p<0.05 ) (Tab. 4). The statistical Principal Component Analysis (PCA) of physico-chemical data showed significant differences between the sampling points, with a clear distinction between surface ice and cryoconite holes, caused mainly by the different concentration of nutrients and suspended solids in both types of samples (Fig. 4). The PCA of microbiological data indicated an even more pronounced distinction of these habitats. Microbiocenoses of surface ice samples seem to form one cluster, defined mainly by the CFU/TC ratio, whereas cryoconite hole microbiota differ greatly from one melthole to another (Fig. 5).
Discussion Microbial community development on a transect across the ablation zone of Ecology Glacier was investigated, from the glacier’s terminus to the snow line (Tab. 1). The transect has been established in anticipation of there being microbial community structure changes as the underlying glacial ice is exposed by melting snow. Chemical composition, bacterial phylogenetic and microbial functional diversity, and abundance were each determined in surface ice and cryoconite holes. Our data describe microbial supraglacial habitats and a comparison of direct and culturable approaches.
Physico-chemical and biological data Chlorophyll a content, DOC, inorganic nitrogen compounds, and reactive phosphorus concentrations were in line with published values for Antarctic and high Arctic glaciers (Porazińska et al. 2004; Foreman et al. 2007; Telling et al. 2012; Zarsky et al. 2013). Anion and cation concentrations were at the same level or slightly lower than those published for Antarctic glaciers, with the exception of Mg2+ which were up to 10x higher in Ecology Glacier (Welch et al. 1996; Foreman et al. 2007).
Our TC data were in line with those previously reported for Ecology Glacier surface ice, and those for Canada Glacier, Antarctica (Foreman et al. 2007; Zdanowski et al. 2013). Stibal et

10
al. (2012) and Singh et al. (2014) reported higher microbial abundance in cryoconite holes at Svalbard and Greenland glaciers than we have done here. However, these authors’ counts were based on per gram of sediment; Stibal et al. (2012) also presented photoautotroph counts of 10-102 lower than the total count, also consistent with our observations. The little published data on supraglacial CFU numbers that are available are in line with our findings (Christner et al. 2003; Zdanowski et al. 2013; Singh et al. 2014).
Surface ice and cryoconite hole microbiocenosis comparison Cryoconite holes have been praised to be the hot spots of microbial life on glaciers (Edwards et al. 2013), yet a comprehensive comparison of cryoconite hole and surface ice habitats is scarce. Our study shows that microbial counts were indeed on average 20x higher in cryoconite holes than in the surrounding surface ice, although the carbon fraction amounts were not that different, which implies that the carbon concentration is not a limiting factor. This is consistent with the findings of Bagshaw et al. (2013) on McMurdo Dry Valley Glaciers. Total nitrogen, phosphorus and iron levels were however considerably higher (on average 4, 3 and 8 times respectively). The higher macro and micronutrient levels may be attributed to physical and chemical weathering of the cryoconite sediment, but also to microbial activity like nitrogen fixation (Telling et al. 2011) and bioleaching of insoluble mineral compounds (Frey et al. 2010), especially iron containing minerals (Bashan et al. 2013). The slightly elevated PO4
3- and Ca2+ concentrations in surface ice compared to cryoconite holes may be attributable to the lower demand for those nutrients of the less numerous microbiota in surface ice with weathering processes still present. The PHAC/TC ratio was the same in cryoconite hole and surface ice, yet the chlorophyll levels were on average 10 times higher in cryoconite samples. Considering, that cell volume in cryoconite holes was approximately double that in surface ice, this could suggest, that this habitat supports bigger photoautotroph cells, containing more chlorophyll. The bacterial OTU numbers were not much higher in cryoconite holes, but the phylogenetic structure of those communities (based on DGGE band migration patterns and clustered by the PCA) differed greatly. However, the similarities in the phylogenetic community structure of the surface ice sample EI5 and cryoconite sample EC5 gathered at the verge of the snow line could suggest the same source of influence, presumably the melting snow. The more diverse bacterial phylogenetic structure from one cryoconite hole to another compared to surface ice and the higher metabolic activity given as a spectrum of assimilated carbon sources implies a rapid development of a more complex trophic food web and a more diverse nutrient resource since the melthole formation. An evolution on a chemical level throughout the summer season in cryoconite holes was observed by Bagshaw et al. (2007) on McMurdo Dry Valley Glaciers.
Spatial variation issue Many researchers investigating glacial microbiota have collected samples along a transect like ours (Mindl et al. 2007; Uetake et al. 2010; Edwards et al. 2011; Zarsky et al. 2013). However, few have explained the spatial variation of chemical and biological components measured. Moreover, none regarded the ablation zone as an annual chronosequence of ice exposure from beneath the melting snow, although some mentioned the receding snow line during the summer season (Stibal et al. 2012; Telling et al. 2011). Simple regression analysis showed several positive correlations with distance from the glacier edge in surface ice

11
samples and cryoconite holes. A strong correlation (p<0.01) between distance from glacier terminus and the morphotype Shannon Index in surface ice was observed; there was a weaker correlation (p<0.05) between distance from glacier terminus and chlorophyll a, nitrogen and seston concentrations in cryoconite holes. These observations reflect the finding of Stibal et al. (2012) for a Greenland glacier, and Takeuchi (2001) for algal biomass in an Alaskan glacier. Relatively high amounts of dissolved organic nitrogen and phosphorus at the snow line (EI5) could also be attributed to either nutrient excretion or cell lysis of the snow-derived microbiota. Takeuchi et al. (1998) observed a replacement of the snow-specialists by ice-specialist algae at the snow line of a Himalayan Glacier, suggesting cell degradation of the former group. The average length of photoautrophic cells also increased with distance from the glacier terminus. This might be attributable to more frequent sightings of eukaryotic cells (large, spheroid, single cells, exhibiting characteristic autofluorescnce in green-filter light) in the upper parts of the ablation zone - an observation also made by Uetake et al. (2010). Takeuchi (2001) suggested that filamentous and colonial cyanobacteria have an advantage in lower parts of the ablation zone by not being washed from the ice by meltwater.
Considering that the ablation zone represents a time scale, some interesting features do emerge. For example, a substantial spike in microbial total count was noted in both surface ice and cryoconite holes at sampling point 4. This was preceded by or coincided with high photoautotroph counts and chlorophyll contents as mentioned above. Such a phenomenon has also been reported for cryoconite holes at Werenskiold Glacier (Svalbard, Arctic) through the whole ablation season (Stibal et al. 2008b). TC counts in surface ice correlated with high functional diversity and chlorophyll levels. This may indicate a potential role of photoautotrophs in promoting microbial growth, again either via organic carbon excretion or cell lysis. In this respect, Medina-Sánchez and Villar-Argiz (2006) noted substantial DOC excretion by algae in a boreal lake in response to UV irradiation and P limitation. Similarly, Myklestad (1995) observed that P and N limitation caused eukaryotic photoautotrophs (especially diatoms) to excrete polysaccharides and free amino acids. Such responses could explain the marked affinity of supraglacial communities for polymers and amino acids. High TC and phylogenetic community diversity (number of OTUs) at the verge of the snow line observed here have also been seen on the verge of the snow in the ablation zone of Alaska’s Gulkana Glacier (Segawa et al. 2010).
Microbial counts (TC) fell at point 3 (EI3, EC3), while the phylogenetic structure was similar to points at the snow line (EI5, EC5). A potential mechanism that might give rise to this is viral lysis, given that DOC concentrations peaked in the surface ice and cryoconite holes at this point in the transect. Bellas et al. (2013) described high viral abundance in cryoconite holes on an Arctic glacier, and concluded that most of the DOC released in these habitats derived from viral-induced mortality.
Significant environmental controls A consistent parameter here whose benefit to the microbial community was reflected in elevated abundance and diversity was particulate organic and inorganic material (seston, SiO2 or CaCO3). This was apparent, especially in surface ice where this material was labile. The amount of particulate material correlated positively with microbial abundance and functional

12
diversity, whereas CaCO3 concentration corresponded with bacterial phylogenetic diversity. The beneficial role of particulates for microbial activity have been previously recorded for polar aquatic habitats (Junge et al. 2004).
Nitrogen and phosphorus seem to be the major limiting factors in the supraglacial environment of Ecology Glacier, as amounts of organic nitrogen in surface ice correlated with the DC/TC and PHAC/TC ratios (despite a strong negative correlation with TOC of the former). Functional diversity on the other hand correlated positively with organic phosphorus levels. Total and organic phosphorus emerged as the only strong correlation (with TC), when conducting the simple regression analysis for all the ice and cryoconite samples together (data not shown). Phosphorus and nitrogen deficits as factors limiting microbial growth and activity in supraglacial environments have been reported before for Arctic glaciers (Stibal et al. 2008a; Telling et al. 2011).
SUVA measurements indicate mainly humic and fulvic acid abundance (Weishaar et al. 2003). Their presence has been connected with decreased albedo of cryoconite sediment, higher water temperatures, and a subsequent increase in microbial activity (Stibal et al. 2006; Edwards et al. 2011). Our data suggest that the PHAC/TC ratio and tetrazolium reducing activity in Ecoplates increased in cryoconite samples in which SUVA measurements were elevated.
Culturable glacial microbes Cultivation techniques have been dismissed as flawed and of little use in obtaining data on microbial communities in environmental settings (Wagner et al. 1993; Ranjard et al. 2000). However, Sigler and Zeyer (2004) proposed cultivable microorganisms to be the opportunistic part of the community, thus making their contribution to the total count an indicator of the stability of conditions in microbial habitats. Thus, a pattern can be determined along the transect defined here, with several correlations emerging between the CFU/TC ratio and other factors. The CFU/TC ratio displayed a negative correlation with distance from glacier edge implying a decrease in habitat stability towards the terminus. Factors that positively correlated with microbial abundance (Ptot, Porg, nitrate) correlated negatively with the CFU/TC ratio, indicating their positive influence on the non-cultivable part of the microbial community, and at least according to Sigler and Zeyer (2004), showing where unstable and unfavorable conditions prevailed where the ratio was the highest (EDI, EI1). This part of the ablation zone was characterized by high mineral content, low microbial numbers and activity, and a high phylogenetic diversity. Wind-transported mineral debris at glacial termini have been observed, and are believed to be a nutrient source (Hodson et al. 2008; Uetake et al. 2010). High OTU and TC numbers have also been noted at an Alaskan glacier’s edge (Segawa et al. 2010), while Stibal et al. (2011) described low microbial numbers and activities in a comparable area on a Greenland glacier. Considering the glacier edge borders three very different ecosystems (supraglacial, subglacial and proglacial), the extant microbial community structure might be greatly influenced by allochthonous microorganisms that contribute to elevated phylogenetic diversity but fail to cope metabolically with the prevailing conditions (Zdanowski et al. 2013). The R2A/8 plate wash showed that metabolic potential of this community can be ‘unlocked’ in the right conditions. Interestingly, the functional diversity

13
and the CFU/TC ratio shared many correlation (positive and negative) with environmental factors in cryoconite holes yet there was no correlation between the two. This implies, that the same factors that decrease the non-opportunist fraction abundance also widen the communities’ metabolic spectrum of carbon source assimilation.
R2A and the 8-fold diluted R2A recovered cultivable bacteria diversity well, with>50% on R2A and >60% on R2A/8 bands identical to those in native samples. The plate wash also revealed the functional potential of the supraglacial community, especially those in the surface ice, since native samples responded only weakly. Wiebe et al. (1992) explained this phenomenon, stating that the heterotrophic microbiota in cold aquatic habitats have reduced substrate affinities and thus require higher nutrient concentrations. However, the plate wash from the diluted medium has proven more adequate for glacial microbiota, suggesting that nutrient concentrations need to be adjusted to reflect that of the environment.
Conclusions
Passage of the snow line and subsequent exposure of the glacial ice surface to ablation and allochthonous influences, changes environmental conditions on Ecology Glacier. These changes caused the emergence of different microbial habitats, of which surface ice and cryoconite holes are most prominent, yet very different in terms of quantity and quality of the microbiocenosis’ structure. The spatial variability of both of these habitats indicates, that the melting snow was a major source of nutrients and living cells to the glacial surface. A cascade of events triggered by this “snow augmentation” shaped the supraglacial communities towards the glacial terminus, indicating their high adaptive potential. The enriching effect was however temporary. The cryoconite hole and surface ice communities responded similarly to snow melt and exposure to allochtonic inputs, despite their differences in microbial numbers and diversity. Nitrogen and phosphorus amounts were the main factors responsible for limiting microbial abundance and activity. We hope our findings will contribute to the still sparse knowledge of these rapidly disappearing habitats, and provide insight into microbe-environment interactions.
Acknowledments
This work was supported by the National Science Center, Poland (grant N N304 106940).We thank MSc Adam Latusek for a huge logistical contribution in preparations for the expedition, safe operations on the glacier and assistance in the laboratory at Polish Station H. Arctowski.
References Anesio AM and Laybourn-Parry J (2012) Glaciers and ice sheets as a biome. Trends Ecol
Evol 27:219–225.

14
Anesio AM, Hodson AJ, Fritz A, Psenner R , Sattler B (2009) High microbial activity on glaciers: importance to the global carbon cycle. Glob Change Biol 15: 955–960.
Bagshaw EA, Tranter M, Fountain AG, Welch K, Basagic HJ, Lyons WB (2013) Do Cryoconite Holes Have the Potential to be Significant Sources of C, N, and P to Downstream Depauperate Ecosystems of Taylor Valley, Antarctica? Arct Antarc Alp Res 45(4): 440-454. Bagshaw EA, Tranter M, Fountain AG, Welch KA, Basagic H, Lyons WB (2007) Biogeochemical evolution of cryoconite holes on Canada Glacier, Taylor Valley, Antarctica, J Geophys Res 112, G04S35. doi:10.1029/2007JG000442 Bashan Y, Kamnev AA, de-Bashan LE (2013) Tricalcium phosphate is inappropriate as a universal selection factor for isolating and testing phosphate-solubilizing bacteria that enhance plant growth: a proposal for an alternative procedure. Biol Fertil Soils 49:465–479. Bellas CM, Anesio AM, Telling J, Stibal M, Tranter M, Davis S (2013) Viral impacts on bacterial communities in Arctic cryoconite. Environ Res Lett 8: 1-9 (045021). Braun M, Gossmann H (2002) Glacial Changes in the Areas of Admiralty Bay and Potter Cove, King George Island, Maritime Antarctica In: Beyer L, Bölter M (eds) Geoecology of Antarctic ice-free coastal landscapes. Ecological studies, vol 154. Springer, Berlin, pp. 75-89. Cameron KA, Hodson AJ, Osborn AM (2012) Structure and diversity of bacterial, eukaryotic
and archaeal communities in glacial cryoconite holes from the Arctic and the Antarctic. FEMS Microbiol Ecol 82: 254-267.
Christner BC, Kvitko BH, Reeve JN (2003) Molecular identification of Bacteria and Eukarya inhabiting an Antarctic cryoconite hole. Extremophiles 7: 177e183. Crump BC, Hobbie JE (2005) Synchrony and seasonality in bacterioplankton communities of
two temperate rivers. Limnol Oceanogr 50: 1718–1729. Edwards A, Irvine-Fynn TDL, Mitchell AC, Rassner SME (2014). A germ theory for glacial
systems? WIREs Water 1: 331–340. Edwards A, Douglas B, Anesio AM, Rassner, Irvine-Fynn TDL, Sattler B, Griffith GW
(2013) A distinctive fungal community inhabiting cryoconite holes on glaciers in Svalbard. Fungal Ecol 6: 168-176.
Edwards A, Anesio AM, Rassner SM, Sattler B, Hubbard B, Perkins WT, Young M, Griffith
GW (2011) Possible interactions between bacterial diversity, microbial activity and supraglacial hydrology of cryoconite holes in Svalbard. ISME J 5: 150–160.
Ellis RJ, Morgan P, Weightman AJ, Fry JC (2003) Cultivation-Dependent and -Independent Approaches for Determining Bacterial Diversity in Heavy-Metal-Contaminated Soil. Appl Environ Microbiol 69: 3223–3230.

15
Foreman CM, Sattler B, Mikucki JA, Porazinska DL, Priscu JC (2007) Metabolic Activity and Diversity of Cryoconite holes in the Taylor Valley, Antarctica. J Geophys Res 112: G04S32.
Frey B, Rieder SR, Brunner I, Plötze M, Koetzsch B, Lapanje A, Brandl H, Furrer G (2010) Weathering-associated bacteria from the Damma Glacier forefield: physiological capabilities and impact on granite dissolution. Appl Environ Microbiol 78:4788–4796. Gurienowich T (1995) Osobiennosti razvitia bakterioplanktona i bakteriobentosa
raznotipnych rybohoziastviennych vodojemov. (Characteristic and development of bakterioplankton and benthic bacterial communities in different types of fish pond). PhD thesis, The State Scientific Institute for Fisheries, Sankt-Petersburg, Russia (in Russian).
Hermanowicz W, Dożańska W, Dojlido J, Koziorowski B, Zerbe J (1999) Physicochemical studies of water and sewage. Arkady, Warszawa, 847 p. (in Polish).
Hodson A, Anesio AM, Ng F, Watson R, Quirk J, Irvine-Fynn T, Dye A, Clark C, McCloy P, Kohler J, Sattler B (2007) A glacier respires: quantifying the distribution and respiration CO2 flux of cryoconite across an entire Arctic supraglacial ecosystem. J Geophys Res 112: G04S36. Hodson A, Anesio AM, Tranter M, Fountain A, Osborn M, Priscu J, Laybourn-Parry J,
Sattler B (2008) Glacial ecosystems. Ecol Monogr 78: 41–67. Hooke R (2005) Principles of Glacier. Mechanics Cambridge University Press. p. 429 Irvine-Fynn TDL, Edwards A (2012) A frozen asset: the potential of flow cytometry in
constraining the glacial biome. Cytometry A 85: 3–7. Junge K, Eicken H, Deming JW (2004) Bacterial Activity at -2 to -20°C in Arctic Wintertime Sea Ice. Appl Environ Microbiol 70: 550–557. Kohshima S (1984) A novel cold-tolerant insect found in a Himalayan glacier. Nature 310:
222–227. Medina-Sánchez JM, Villar-Argaiz M (2006) Solar radiation–nutrient interaction enhances
the resource and predation algal control on bacterioplankton: A short-term experimental study. Limnol Oceanogr 51: 913–924.
Mindl B, Anesio AM, Meirer K, Hodson AJ, Laybourn-Parry J, Sommaruga R, Sattler B
(2007) Factors influencing bacterial dynamics along a transect from supraglacial runoff to proglacial lakes of a high Arctic glacieri. FEMS Microbiol Ecol 59: 307–317.
Muyzer G, de Waal EC, Uitterlinden AG (1993) Profiling of complex microbial populations
by denaturing gradient gel electrophoresis analysis of polymerase chain reaction-amplified genes coding for 16S rRNA. Appl Environ Microbiol 59: 695–700.
Muyzer G, Brinkhoff T, Nübel U, Santegoeds C, Schäfer H, Waver C (1998) Denaturing
gradient gel electrophoresis (DGGE) in microbial ecology. Molecular Microbial Ecology Manual (Akkermans ADL, van Elsas JD, de Bruijn FJ, eds), pp. 1–27. Kluwer Academic Publishers: Dordrecht, The Netherlands.

16
Myklestad SM (1995) Release of extracellular products by phytoplankton with special
emphasis on polysaccharides. Sci Total Environ 165:155-164. Nübel U, Garcia-Pichel F, Kühl M, Muyzer G (1999) Quantifying microbial diversity:
morphotypes, 16SrRNA genes, and carotenoids of oxygenic phototrophs in microbial mats. Appl Environ Microbiol 65: 422–430.
Paterson WSB (1994) The physics of glaciers, 3rd edition. Pergamon, Oxford. Porazinska DL, Fountain AG, Nylen TH, Tranter M, Virginia RA,Wall DH (2004) The biodiversity and biogeochemistry of cryoconite holes from McMurdo Dry Valley glaciers, Antarctica. Arct Antarct Alp Res 36:84–91. Porter KG, Feig YS (1980) The use of DAPI for identifying and counting aquatic microflora.
Limnol Oceanogr 25: 943-948. Putland JN, Rivkin RB (1999) Influence of storage mode and duration on the microscopic
enumeration of Synechococcus from cold coastal environment. Aquat Microb Ecol 17: 191–199.
Quesada A, Vincent WF (2012) Cyanobacteria in the cryosphere: snow, ice and extreme cold.
Ecology of Cyanobacteria II: Their Diversity in Space and Time (Whitton BA, ed.), pp. 387-399. Springer Science+Business Media.
Ranjard L, Poly F, Nazaret S (2000) Monitoring complex bacterial communities using
culture-independent molecular techniques: application to soil environment. Res Microbiol 151: 167–177.
Sambrook J, Fritschi EF, Maniatis T (1989) Molecular cloning: a laboratory manual, Cold
Spring Harbor Laboratory Press, New York. Schomacke A (2008) What controls dead-ice melting under different climate conditions? A
discussion. Earth-Sci Rev 90-103–113. Segawa T, Takeuchi N, Ushida K, Kanda H, Kohshima S (2010) Altitudinal Changes in a
Bacterial Community on Gulkana Glacier in Alaska. Microbes Environ 25: 171–182. Shiklomanov I. (1993). World freshwater resources. Water in Crisis: A Guide to the World’s
Fresh Water Resources (Gleick PH, ed.) New York: Oxford University Press. Shinichi A, Yasuro F, Etsu Y (2004) Determinations of humic substances and other dissolved organic matter and their effects on increase of COD in lake Biwa. Analyt Sci 20:159-164.
Sieracki ME, Johnson PW, Sieburth JMcN (1985) Detection, enumeration, and sizing of planktonic bacteria by image-analyzed epifluorescence microscopy. Appl Environ Microbiol 49: 799–810. Sigler WV, Zeyer J (2004) Colony-forming analysis of bacterial community succession in
deglaciated soils indicates pioneer stress-tolerant opportunists. Microb Ecol 48: 316–323.

17
Singh P, Singh SM, Dhakephalkar P (2014) Diversity, cold active enzymes and adaptation strategies of bacteria inhabiting glacier cryoconite holes of High Arctic. Extremophiles 18: 229–242.
Standard Methods (1980) Standard methods for the examination of water and wastewater.
Fourteenth edition – American Public Health Association, Washington. Stibal M, Šabacká M, Kaštovská K (2006) Microbial communities on glacier surfaces in
Svalbard: impact of physical and chemical properties on abundance and structure of cyanobacteria and algae. Microb Ecol 52: 644–654.
Stibal M, Telling J, Cook J, Mak KM, Hodson A, Anesio AM (2012) Environmental controls
on microbial abundance and activity on the Greenland ice sheet: a multivariate analysis approach. Microb Ecol 63: 74–84.
Stibal M, Tranter M, Telling J, Benning LG (2008a) Speciation, phase association and potential bioavailability of phosphorus on a Svalbard glacier. Biogeochemistry 90:1–13 DOI 10.1007/s10533-008-9226-3. Stibal M, Tranter M, Benning L G and Rěhák J (2008b) Microbial primary production on an
Arctic glacier is insignificant in comparison with allochthonous organic carbon input. Environ Microbiol 10: 2172–2178.
Świątecki A (1997) Zastosowanie wskaźników bakteriologicznych w ocenie wód
powierzchniowych. (Application of bacteriological indicators in surface water quality assessment). WSP Olsztyn (in Polish).
Takeuchi N (2001) The altitudinal distribution of snow algae on an Alaska glacier (Gulkana
Glacier in the Alaska Range). Hydrol Process 15: 3447–3459. Takeuchi N, Kohshima S, Fujita K (1998) Snow algae community on a Himalayan glacier, Glacier AX010 East Nepal: relationship with glacier summer mass balance. Bull Glaciol Res 16: 43–50. Telling J, Anesio AM, Tranter M, Irvine-Fynn T, Hodson A, Butler C, Wadham J (2011) Nitrogen fixation on Arctic glaciers, Svalbard. J Geophys Res 116: 1-8 (G03039). Telling J, Anesio AM, Tranter M, Stibal M, Hawkings J, Irvine-Fynn T, Hodson A, Butler C,
Yallop M, Wadham J (2012) Controls on the autochthonous production and respiration of organic matter in cryoconite holes on high Arctic glaciers. J Geophys Res 117: 1-10 (G01017).
terBraak CJF, Šmilauer P (2002) CANOCO reference manual and CanoDraw for Windows
user’s guide: software for canonical community ordination (version 4.5). Microcomputer Power, Ithaca.
Uetake J, Naganuma T, Hebsgaard MB, Kanda H, Kohshima S (2010) Communities of algae
and cyanobacteria on glaciers in west Greenland. Polar Sci 4: 71-80.

18
Wagner M, Amann R, Lemmer H, Schleifer K-H (1993) Probing Activated Sludge with Oligonucleotides Specific for Proteobacteria: Inadequacy of Culture-Dependent Methods for Describing Microbial Community Structure. Appl Environ Microbiol 59: 1520-1525. Weber K , Legge R (2009) One-dimensional metric for tracking bacterial community divergence using sole carbon source utilization patterns. J Microbiol Meth 79: 55–61. Weishaar JL, Aiken GR, Bergamaschi BA, Fram MS, Fujii R, Mopper K (2003) Evaluation of
Specific Ultraviolet Absorbance as an Indicator of the Chemical Composition and Reactivity of Dissolved Organic Carbon. Environ Sci Technol 37: 4702-4708.
Welch KA, Lyons WB, Graham E, Neumann K, Thomas JM, Mikesell D (1996) Determination of major element chemistry in terrestrial waters from Antarctica by ion chromatography. J Chromatogr A, 739 257-263. Wiebe WJ, Sheldon WM Jr, Pomeroy LR (1992) Bacterial growth in the cold: evidence for an
enhanced substrate requirement. Appl Environ Microbiol 58: 359–364. Zarsky JD, Stibal M, Hodson A, Sattler B, Schostag M, Hansen LH, Jacobsen CS, Psenner R
(2013) Large cryoconite aggregates on a Svalbard glacier support a diverse microbial community including ammonia-oxidizing archaea. Environ Res Lett 8: 035044 (11pp).
Zdanowski MK, Żmuda-Baranowska MJ, Borsuk P, Świątecki A, Górniak D, Wolicka D,
Jankowska KM, Grzesiak J (2013) Culturable bacteria community development in postglacial soils of Ecology Glacier, King George Island, Antarctica. Polar Biol 36: 511–527.

19
Fig. 1. Location of sampling points on Ecology Glacier surface.
20
Fig. 2. Well color development calculated from Omnilog Arbitrary Unit values of substrate utilization on Biolog EcoPlates by glacial microbial communities. Substrates were divided into five categories: carbohydrates (n=10), polymers (n=4), carboxylic and acetic acids (n=9), amino acids (n=6), amines/amides (n=2). EI – surface ice samples (n=6), EC – cryoconite samples (n=4), NATIVE – Samples applied directly to EcoPlates, R2A – samples incubated

21
on full strength R2A agar (plate wash), R2A/8 – samples incubated on 8-fold diluted R2A agar (plate wash).
Fig. 3. Principal component analysis of bacterial phylogenetic community structure (based on OTUs relations) in surface ice (black diamonds) and cryoconite samples (circles).

22
Fig. 4. Principal component analysis of physico-chemical data in surface ice (black diamonds)
and cryoconite samples (circles). TOC – total organic carbon; DOC – dissolved organic carbon; POC – particulate organic carbon; Ntot – total nitrogen; SO4 – sulphate conc., K – potassium conc., Cl – chloride conc., Na – sodium conc., Mg – magnesium conc, CaCO3 – calcium carbonate conc., Chl-T – total chlorophyll conc., Chl-a – chlorophyll a conc., Fe – total iron conc., Ses-T – total seston conc., SiO2 – silica conc., SUVA – aromatic content of DOC.

23
Fig. 5. Principal component analysis of microbiological data in surface ice (black diamonds)
and cryoconite samples (circles). PHAC – photoautotrophic cell count; TC – total microbial count; CFU/TC – ratio of colony forming units on R2A agar to total count; PHAC/TC – photoautotrophic cell count to total microbial count ratio; DC/TC – ratio of dividing cell count to total count, ShI – morphotype diversity index (Shannon Index); DGGE – phylogenetic diversity of native samples by operational taxonomic units (OTU’s), CFU – colony forming units on R2A agar, EcoPlate – functional diversity of native samples by positive response numbers on Biolog Ecoplates, DC – dividing cell count.

24
Table 1.Sampling points along transect from EDI (‘dead ice’) near the Ecology Glacier terminus to the highest part of the ablation zone (snow line). EI – surface ice, EC – cryoconite holes.
Sample point Latitude (S) Longitude
(W)
Distance from glacier terminus (m)
Elevation (m) Description
EDI 62°10’09.3’’ 58°28’18.5’’ 0 12
Dead ice area, solid, blue glacier ice heavily covered with mineral debris. No cryoconite holes
EI1 62°10’11.6’’ 58 28’20.0’’ 79 35
Ablation zone, blue glacier ice heavily covered with mineral debris. No cryoconite holes
EI2; EC2 62°10’21.4’’ 58°28’32.6’’ 427 73
Ablation zone, castellated clear ice with mineral debris. Cryoconite holes present
EI3; EC3 62°10’35.8’’ 58°28’45.9’’ 914 125
Ablation zone, ice with very porous surface, minor mineral debris. Cryoconite holes present
EI4; EC4 62°10’41.4’’ 58°28’53.6’’ 1117 137
Ablation zone, ice with very porous surface, minor mineral debris. Cryoconite holes present
EI5; EC5 62°10’59.7’’ 58°29’25.6’’ 1841 235
Equilibrium Line area, ice/firn with snow patches. Cryoconite holes present

25
Table 2. Values of chlorophyll and pheophytin concentrations, particulates, pH, carbon (TOC – total organic carbon; DOC – dissolved organic carbon; POC – particulate organic carbon), nitrogen, phosphorus and other mineral contents in samples used for microbiological analysis. EDI, EI1-5 – ice samples; EC2-5 – cryoconite suspension.
Sampling points EDI EI 1 EI 2 EI 3 EI 4 EI 5 Mean EC 2 EC 3 EC 4 EC 5 Mean Chlorophyll a (µg/l) 1.34 0.53 0.75 0.96 3.53 2.57 1.61 3.74 6.15 9.84 52.18 17.98
Pheophytin (µg/l) 8.49 1.49 1.35 2.93 4.48 4.02 3.79 8.23 11.63 10.45 123.26 38.39 Total chlorophyll (µg/l) 9.82 2.02 2.10 3.89 8.01 6.59 5.41 11.98 17.78 20.28 175.43 56.37
Total seston (mg dry wt./l) 27.50 54.00 144.80 42.00 769.20 515.60 258.85 514.67 135.00 1305.60 9213.00 2792.07 Mineral seston (mg dry wt./l) 17.50 12.80 17.20 12.00 56.80 40.00 26.05 48.00 32.00 107.20 535.00 180.55 Organic seston (mg dry wt./l) 10.00 41.20 127.60 30.00 712.40 475.60 232.80 466.67 103.00 1198.40 8678.00 2611.52
pH 6.96 7.00 7.15 6.10 6.66 6.65 6.75 6.15 6.98 7.00 6.74 6.72 TOC (mg/l) 2.35 2.33 4.47 4.85 4.90 1.23 3.36 5.96 9.18 3.10 3.95 5.55 DOC (mg/l) 0.38 1.22 0.69 3.76 2.25 0.92 1.54 0.79 5.94 1.91 2.42 2.77 POC (mg/l) 1.97 1.11 3.78 1.10 2.65 0.30 1.82 5.18 3.25 1.19 1.53 2.79
SUVA 17.94 8.14 10.74 1.65 2.04 5.42 7.66 9.92 4.95 2.41 4.30 5.40 NH4+(mg/l) 0.01 nd 0.05 0.01 0.01 0.01 0.02 0.01 nd nd 0.01 0.01 NO2- (mg/l) nd 0.09 nd nd nd nd 0.02 nd nd nd nd - NO3- (mg/l) nd nd nd nd nd nd - nd nd nd nd -
Total nitrogen (mg/l) 0.17 0.29 0.28 0.16 0.18 0.46 0.26 0.18 0.44 0.34 3.21 1.04 Organic nitrogen (mg/l) 0.15 0.20 0.23 0.15 0.17 0.45 0.23 0.16 0.44 0.33 3.20 1.03
PO43-(mg/l) 0.06 0.02 0.02 0.02 0.02 0.02 0.03 0.02 0.02 0.02 0.01 0.02 Total phosphorus (mg/l) 0.06 0.03 0.04 0.03 0.06 0.07 0.05 0.07 0.13 0.21 0.20 0.15
Organic phosphorus (mg/l) nd 0.01 0.02 0.01 0.04 0.04 0.02 0.05 0.11 0.19 0.19 0.14 Na+ (mg/l) 2.53 2.34 1.56 3.11 1.82 2.09 2.24 3.81 3.99 3.21 3.70 3.68 K+ (mg/l) 0.30 0.09 0.34 0.18 0.25 0.13 0.22 0.45 0.91 0.22 0.28 0.47
Ca2+ (mg/l) 1.12 0.55 0.28 0.87 0.63 0.33 0.63 0.41 0.26 0.51 0.61 0.45

26
Mg2+ (mg/l) 4.97 0.79 1.39 4.45 3.58 2.07 2.88 3.46 2.62 5.28 7.59 4.73 Cl- (mg/l) 0.67 4.41 1.07 1.43 0.42 0.67 1.45 3.30 2.82 2.20 2.64 2.74
SO42- (mg/l) 0.63 0.41 0.08 0.25 0.17 0.14 0.28 0.41 0.75 0.37 0.49 0.51
SiO2 (mg/l) 0.98 0.51 0.63 0.47 1.61 0.59 0.80 0.68 0.35 1.00 2.18 1.05 Total iron (Fe) (mg/l) 0.14 0.01 0.29 0.18 0.05 0.07 0.12 0.06 0.08 0.70 3.43 1.06
CaCO3 (mg /l) 12.39 1.97 3.48 11.11 8.93 5.15 7.17 8.64 6.53 13.16 18.93 11.82

27
Table 3. Values of microbiological parameters of native and cultivated microbes.TC – total microbial count, CFUR2A – colony forming units on R2A agar, PHAC – photoautotrophic cell count, PHAC av. l. – average length of photoautotrophic cells, morphotype diversity index (Shannon Index), V – cell volume, DC – dividing cell count, DGGE NATIVE,R2A,R2A/8 – phylogenetic diversity of native and cultivated samples given in operational taxonomic units (OTU’s), EcoPlateNATIVE,R2A,R2A/8– functional diversity given in positive response numbers on Biolog Ecoplates.
Sampling points EDI EI 1 EI 2 EI 3 EI 4 EI 5 Mean EC 2 EC 3 EC 4 EC 5 Mean TC (x104 m L-1) 0.83±0.13 0.81±0.29 3.10±0.52 2.21±0.15 10.1±1.49 2.59±0.36 3.27 13.6±4.32 53.3±11.6 196±16.3 16.0±3.94 69.73
CFUR2A (x 103 m L-1) 3.99 4.92±2.72 3.46±1.72 2.14±1.37 3.98±0.41 2.46±1.10 3.49 2.41±0.43 10.8±1.14 5.77±2.39 3.01±0.98 5.50
CFUR2A/TC (%) 48.07 60.87 11.15 9.69 3.92 9.50 23.87 1.77 2.03 0.29 1.88 1.49
PHAC (x 103 m L-1) 0.95 0.97 3.95 3.89 9.13 6.08 4.16 47.20 17.40 17.20 39.50 30.33 PHAC av.l (µm) 3.18 7.88 8.44 13.37 15.27 13.07 10.20 12.60 5.05 11.66 10.29 9.90
V (µm3) 0.02 0.021 0.018 0.038 0.031 0.034 0.03 0.067 0.025 0.067 0.039 0.05 Shannon Index 0.359 0.348 0.496 0.569 0.662 0.736 0.53 0.768 0.431 0.94 0.593 0.68 DC (x 103 m L-1) 0.95 0.87 1.3 1.3 1.74 5.21 1.90 13.60 36.10 107.00 50.60 51.83
DC/TC (%) 11.3 10.7 4.2 5.9 1.7 20.1 8.98 10.0 6.8 5.4 31.6 13.45 PHAC/TC (%) 11.4 11.9 12.7 17.6 9.0 23.4 14.33 34.7 3.2 0.8 24.6 15.83
DGGENATIVE (OTU's) 10 5 8 11 12 10 9.33 16 11 19 11 14.25
DGGER2A (OTU's) 4 3 3 6 5 7 4.67 9 8 4 8 7.25
DGGER2A/8 (OTU's) 6 6 6 6 9 6 6.50 7 6 7 7 6.75 EcoPlate NATIVE (number
of positive responses) 2 3 6 1 15 6 5.50 26 18 13 18 18.75
EcoPlateR2A (number of positive responses) 0 14 16 3 20 22 12.50 17 16 20 23 19.00
EcoPlateR2A/ 8 (number of positive responses) 20 21 11 26 23 25 21.00 22 21 22 24 22.25

28
Table 4. Correlation coefficients (*p<0.05, **p<0.01) between ice samples’ biological parameters (TC – total microbial count, CFU/TC– colony forming units on R2A agar to total microbial count ratio, PHAC – photoautotrophic cell count, PHAC Av. L. - photoautotrophic cell average length, PHAC/TC – photoautotrophic cell count to total microbial count ratio, DC/TC – ratio of dividing cell count to total count, morphotype diversity index (Shannon Index), DGGE NATIVE – phylogenetic diversity of native samples by operational taxonomic units (OTU’s), EcoPlate– functional diversity of native samples by positive response numbers on Biolog Ecoplates) and distance from glacier terminus and chosen biological parameters and non-biological factors.
Surface Ice Distance TC PHAC/TC PHAC av.l DC/TC Shannon Index DGGE EcoPlate
PHAC av.l 0.814* 0.669 0.317 1.000 -0.188 0.860* 0.504 0.565 CFU/TC -0.756* -0.618 -0.324 -0.773* 0.271 -0.868* -0.704 -0.515
Shannon Index 0.974** 0.579 0.545 0.860* 0.119 1.000 0.644 0.552
EcoPlate 0.416 0.950** -0.343 0.565 -0.387 0.552 0.408 1.000 Chlorophyll a 0.686 0.808* 0.034 0.613 0.006 0.746 0.696 0.825*
Total seston 0.715 0.858* 0.028 0.705 -0.057 0.784* 0.529 0.913**
Mineral seston 0.661 0.853* -0.028 0.626 -0.045 0.732 0.575 0.906** TOC -0.076 0.555 -0.464 0.392 -0.943** 0.117 0.379 0.337
SUVA -0.674 -0.537 -0.281 -0.958** 0.229 -0.699 -0.336 -0.404 NO3
- 0.231 0.778* -0.338 0.647 -0.841* 0.419 0.574 0.578
Organic nitrogen 0.701 -0.116 0.787* 0.257 0.771* 0.581 -0.047 0.075 Organic phosphorus 0.804* 0.701 0.248 0.716 0.111 0.838* 0.342 0.810*
Mg2+ -0.009 0.134 -0.103 -0.025 -0.183 0.045 0.766* -0.084
SiO2 0.085 0.837* -0.599 0.224 -0.452 0.229 0.565 0.818* CaCO3 -0.009 0.134 -0.103 -0.025 -0.183 0.045 0.766* -0.084

29
Table 5. Correlation coefficients (*p<0.05, **p<0.01) between cryoconite hole biological parameters (TC – total microbial count, CFU/TC– colony forming units on R2A agar to total microbial count ratio, PHAC – photoautotrophic cell count, PHAC/TC – photoautotrophic cell count to total microbial count ratio morphotype diversity index (Shannon Index), DGGE – phylogenetic diversity of native samples by taxonomic operational units (OTU’s), EcoPlate – functional diversity of native samples by positive response numbers on Biolog EcoPlates) and distance from glacier terminus and chosen biological parameters and non-biological factors.
Cryoconite holes Distance TC CFU/TC PHAC/TC PHAC av.l Shannon Index DGGE EcoPlate
PHAC/TC -0.531 -0.713 0.745 1.000 0.432 0.012 -0.009 0.977** DGGE -0.417 0.662 -0.157 -0.009 0.691 0.953* 1.000 -0.153
Chlorophyll a 0.915* -0.014 -0.587 -0.145 0.077 -0.225 -0.502 -0.198 Total seston 0.890* -0.015 -0.574 -0.089 0.152 -0.170 -0.456 -0.155
DOC 0.120 -0.197 0.087 -0.512 -0.995** -0.789 -0.635 -0.322 POC -0.823 -0.758 0.978** 0.854 0.050 -0.174 -0.037 0.917*
SUVA -0.678 -0.767 0.879* 0.972** 0.269 -0.081 -0.033 0.989** NO3
- 0.899* 0.537 -0.914* -0.450 0.312 0.254 -0.005 -0.574 Total nitrogen 0.895* -0.103 -0.518 -0.109 0.012 -0.313 -0.580 -0.145
Organic nitrogen 0.896* -0.102 -0.520 -0.112 0.009 -0.315 -0.582 -0.147 Total phosphorus 0.830 0.754 -0.981** -0.843 -0.036 0.179 0.037 -0.909*
Organic phosphorus 0.857 0.729 -0.985** -0.812 -0.010 0.173 0.015 -0.883* Na+ -0.233 -0.946* 0.740 0.467 -0.582 -0.862 -0.780 0.632 Cl- -0.592 -0.905* 0.918* 0.913* 0.030 -0.341 -0.282 0.977**