Embed Size (px)
Citation preview

HBU JAJO * ̂
PERCEPTIONS OF THE ARKANSAS STUDENT ASSESSMENT PROGRAM BY
STATE LEGISLATORS, SUPERINTENDENTS, AND TEACHERS
DISSERTATION
Presented to the Graduate Council of the
North Texas State University in Partial
Fulfillment of the Requirements
For the Degree of
DOCTOR OF EDUCATION
By
Ed Higginbotham, B.S., M.S.E.
Denton, Texas
August, 1984

Higginbotham, Aubrey Edward, Jr., P e r c S E ^ of the
Arkansas S^dent assessment P r o ^ b* S ^ t e L^islato^s.
' " ^ nnr-t-or of Education (Adminis superintendents, and Teachers. Doctor
4- i qq a 209 PP• f 141 tables , trative Leadership), August, 1984, PP
bibliography, 66 titles.
The problem of this study was to compare the perceptions
o £ K a n s a s state legislators, superintendents, and teachers
toward the Arkansas Student Assessment Program. The purpose
w a s to generate data which would benefit educational planners
in Arkansas.
Hypotheses which focused on current national issues in
the statewide testing movement and on issues pertinent to
the Arkansas program were constructed, and a que
was developed to test the hypotheses. The questionnaire
was mailed to all Arkansas state legislators and to the
superintendent and a fourth-grade teacher in 100 randomly
u 1 A i ni-ricts Responses were received selected Arkansas school districts.
j- 70 npr cent of superinten from 50 per cent of legislators, 70 per
dents, and 74 per cent of teachers. The chi-square
statistic was applied to individual questions in
test for significance of difference between the groups,
the Kruskal-Wallace one-way analysis of variance by ranks
was applied to the hypotheses to test for significant
differences between groups. In examining individual

questions relating to legislators, superintendents, and
teachers, significant differences were found on twenty-
three of the forty items on the questionnaire. A signifi-
cant difference was found on each of the seven hypotheses,
as follows: (1) superintendents and teachers understand
the program better than legislators, (2, superintendents and
teachers view the program as more adequate than legislators,
(3) legislators and superintendents view the program as more
fair than teachers; (4) superintendents and teachers are
m o r e positive than legislators concerning the use of the
results; (5, legislators and superintendents more than
teachers feel that the program has a greater impact; (6)
legislators and superintendents are more positive about the
public relations aspect of the testing program than are
teachers; and (7) all three groups differ concerning improve
ments needed in the program.
in examining differences between large-school and small-
school superintendents, significant differences were found
on only two hypotheses. These differences revealed that
large-school superintendents were more positive concerning
whether the testing program was fair and that the testing
program has had a good effect on Arkansas education.
TABLE OF CONTENTS
Page
v
LIST OF TABLES
Chapter
I. INTRODUCTION .
Statement of the Problem purpose of the Study Hypotheses Definition of Terms Limitations Basic Assumptions Significance of the Study
16 II. SYNTHESIS OF RELATED LITERATURE
Backgroun^of^the^tatewide^esting Movement B r i e ! History of the Statewide Testing
BriefV0verview of Current Status of Statewide Testing
The anti-Testing Movement cf.a(.ewlae General Information Concerning Statewide
Testing Programs
III. PROCEDURES OF THE STUDY
The Populations Selection of the Samples Procedure for Analysis
IV,
55
PRESENTATION AND ANALYSIS OF DATA
Analysis of Each Item as Answered by Legislators, Superintendents, and
Hypotheses Related to Legislators, Superintendents, and Teachers
Analysis of Each Item as Answered by Large-School and Small-school Super intendents
59
i n

Chapter
Page
Hypotheses Related to Large-School and Small-School Superintendents i - Farh Item as Answered by Large-School and Small-School Teachers
H y p o t h e s e s Related to Large-School and Small-School Teachers
v SUMMARY, CONCLUSIONS, IMPLICATIONS, AND _ _ m
RECOMMENDATIONS
Summary Conclusions Implications Recommendat ions
185
APPENDIX 203
BIBLIOGRAPHY
IV
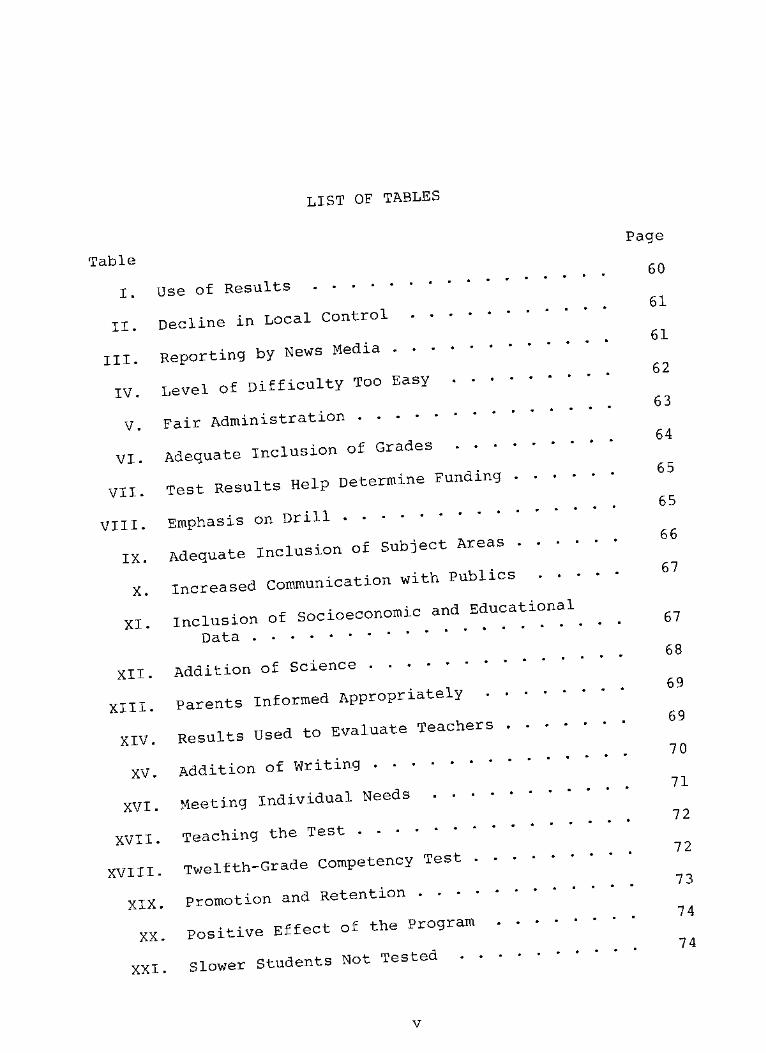
l i s t o f t a b l e s
Table
I. Use of Results
II. Decline in Local Control
III. Reporting by News Media
IV. Level of Difficulty Too Easy . • • •
V. Fair Administration .
VI. Adequate Inclusion of Grades . .
V I I - T e s t Results Help Determine Funding .
VIII. Emphasis on Drill
IX. Adequate Inclusion of Subject Areas .
Increased Communication with Publics X.
XI. Inclusion Data .
Xii# Addition of Science
XIII. Parents Informed Appropriately
XIV.
XV.
XVI.
XVII.
XVIII.
XIX.
XX.
XXI.
Results Used to Evaluate Teachers
Addition of Writing
Meeting Individual Needs . . • •
Teaching the Test
Twelfth-Grade Competency Test . .
promotion and Retention
Positive Effect of the Program .
Slower Students Not Tested
Page
60
61
61
62
63
64
65
65
66
67
of socioeconomic and Educational 67
68
69
69
70
71
72
72
73
74
74
v
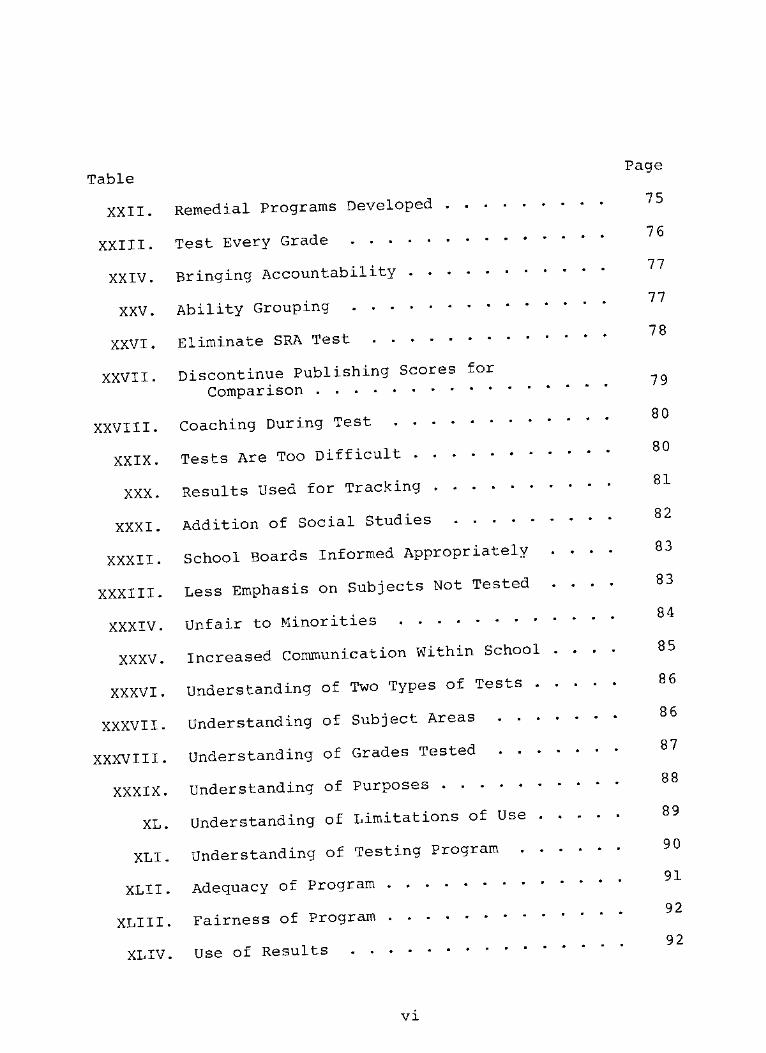
Table
XXII.
XXIII.
XXIV.
XXV.
XXVI.
XXVII.
XXVIII.
XXIX.
XXX.
XXXI.
XXXII.
XXXIII.
XXXIV.
XXXV.
XXXVI.
XXXVII.
XXXVIII.
XXXIX.
XL.
XLI.
XLII.
XLI 11
XL IV
Page
*7 R Remedial Programs Developed
j . . . . 76 Test Every Grade
77 Bringing Accountability
. . . 77 Ability Grouping
7 8 Eliminate SRA Test
Discontinue Publishing Scores for ^ Comparison
m , . . . 80 Coaching During Test
Tests Are Too Difficult
81 Results Used for Tracking
8 2
Addition of Social Studies
School Boards Informed Appropriately . . . .
Less Emphasis on Subjects Not Tested . . . . 83 . . 84
Unfair to Minorities
Increased Communication Within School . . . . 85
Understanding of Two Types of Tests 86
Understanding of Subject Areas ^6 87
Understanding of Grades Tested
8 8 Understanding of Purposes
Understanding of Limitations of Use 8 9
Q 0 Understanding of Testing Program
91 Adequacy of Program
92 Fairness of Program
. . 92 Use of Results
VI

Table
XLV. Educational Impact
Public Relations
Improvements
Use of Results
Decline in Local Control
Reporting by News Media
Level of Difficulty Too Easy
Fair Administration
Adequate Inclusion of Grades
Test Results Help Determine Funding . . . •
Emphasis on Drill
Adequate Inclusion of Subject Areas . . • •
Increased Communication with Publics . .
Inclusion of Socioeconomic and Educational
XLVI.
XLVII.
XLVIII•
XLIX.
L.
LI.
LII.
LIU.
LIV.
LV.
LVI.
LVII.
LVIII.
Page
93
Data
LIX. Addition of Science
LX. Parents Informed Appropriately
LXI. Results Used to Evaluate Teachers
LXII. Addition of Writing
LXIII• Meeting Individual Needs . . . .
LXIV. Teaching the Test
LXV. Twelfth-Grade Competency Test .
LXVI. Promotion and Retention
LXVII. Positive Effect of the Program
LXVIII. Slower Students Not Tested . •
94
95
96
97
98
98
99
100
101
101
102
103
104
105
105
106
107
108
108
109
110
110
111
Vll
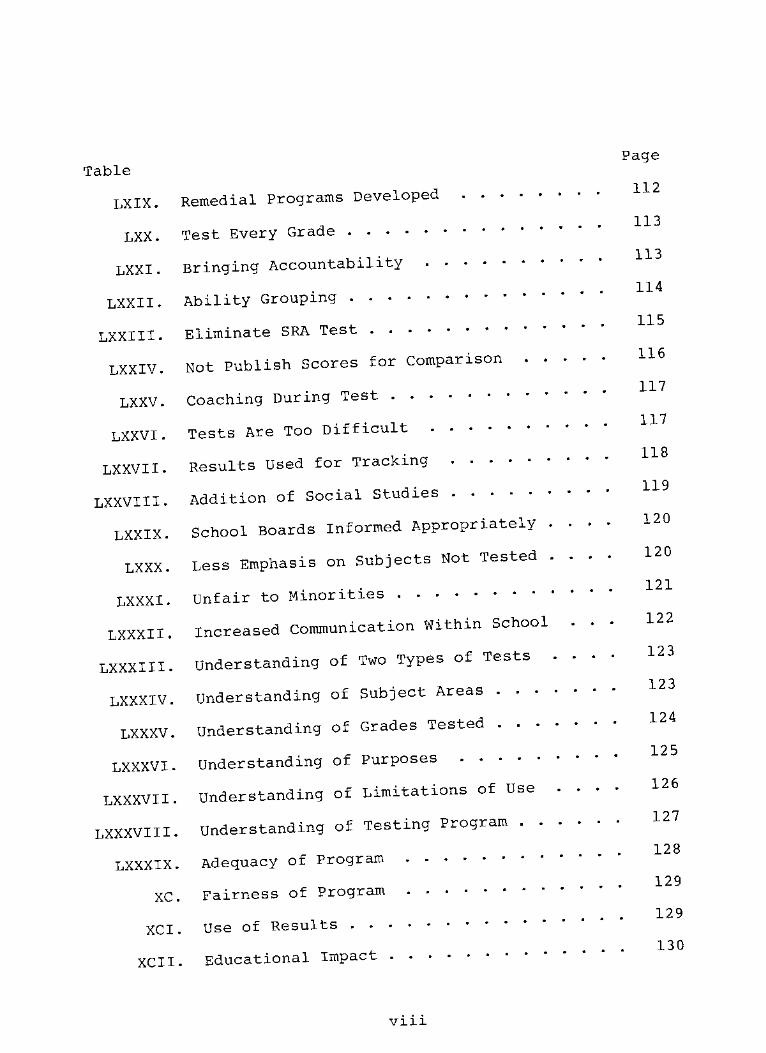
Table
LXIX.
LXX.
LXXI.
LXXII.
LXXIII•
LXXIV.
LXXV.
LXXVI.
LXXVII.
LXXVIII.
LXXIX.
LXXX.
LXXXI.
LXXXII.
LXXXIII.
LXXXIV.
LXXXV.
LXXXVI.
LXXXVII.
LXXXVIII.
LXXXIX.
XC.
XCI
XCH
Page
112 Remedial Programs Developed
113 Test Every Grade
113 Bringing Accountability
. . . 114 Ability Grouping
m . 115 Eliminate SRA Test
Not Publish Scores for Comparison 1 1 6
m , . . . 117 Coaching During Test
. csz. . . . . 117 Tgsts Are Too Difficult • •
118 Results Used for Tracking
119 Addition of Socia.1 Studies
School Boards Informed Appropriately . . . . 120
Less Emphasis on Subjects Not Tested . . . . I 2 0
. . . . 121 Unfair to Minorities
Increased Communication Within School . • • 122 TOO
Understanding of Two Types of Tests . . . .
1 23 Understanding of Subject Areas
Understanding of Grades Tested
125 Understanding of Purposes
Understanding of Limitations of Use . . . . 126
1 ?7 Understanding of Testing Program
128 Adequacy of Program
. . . . 129 Fairness of Program
. . . 129 Use of Results
130 Educational Impact
Vlll
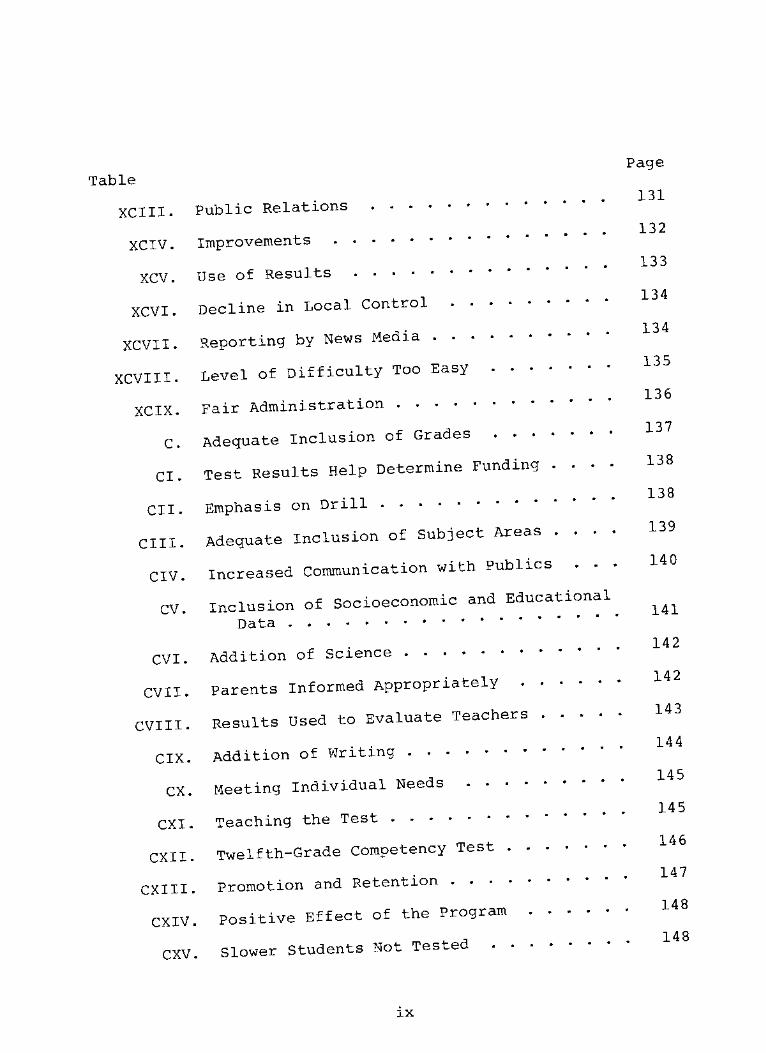
Table
XCIII. Public Relations
XCIV. Improvements
Use of Results
Decline in Local Control
Reporting by News Media
Level of Difficulty Too Easy
Fair Administration
Adequate Inclusion of Grades
Test Results Help Determine Funding . . .
CII. Emphasis on Drill
CIII. Adequate Inclusion of Subject Areas
CIV. Increased Communication with Publics . .
Inclusion of Socioeconomic and Educational
XCV.
XCVI.
XCVII.
XCVIII.
XCIX.
C.
CI.
CV.
CVI.
CVII.
Data
Addition of Science
Parents Informed Appropriately
CVIII. Results Used to Evaluate Teachers . . . •
CIX. Addition of Writing
CX. Meeting Individual Needs . . •
CXI. Teaching the Test
CXII. Twelfth-Grade Competency Test .
CXIII. Promotion and Retention .
CXIV. Positive Effect of the Program
CXV. Slower Students Not Tested . -
Page
1 3 1
132
133
134
134
135
136
137
138
138
139
140
141
142
142
143
144
145
145
146
147
148
148
IX

Table
CXVI.
CXVII.
CXVIII.
CXIX.
cxx.
CXXI.
CXXII.
CXXIII.
CXXIV.
cxxv.
CXXVI.
CXXVII.
CXXVIII.
CXXIX.
cxxx.
CXXXI.
CXXXII.
CXXXIII.
CXXXIV.
CXXXV.
CXXXVI.
CXXXVII.
CXXXVIII.
Page
Remedial Programs Developed 1 4 9
150 Test Every Grade
Bringing Accountability
151 Ability Grouping
1 52 Eliminate SRA Test
Not Publish Scores for Comparison 153
154 Coaching During Test
1 54
Tests Are Too Difficult
Results Used for Tracking 1 5 5
Addition of Social Studies 1 5 6
School Boards Informed Appropriately . . . . 157
Less Emphasis on Subjects Not Tested . . . . 157
158 Unfair to Minorities
Increased Communication Within School . . • 159
Understanding of Two Types of Tests . . . . 160
Understanding of Subject Areas 161
Understanding of Grades Tested 162
1 f\ ̂ Understanding of Purposes
Understanding of Limitations of Use . . . . 163
Understanding of Program I 6 5
165 Adequacy of Program
Fairness of Program 1 6 6
167 Use of Results
x
Table P a^ e
CXXXIX. Educational Impact 1 6 7
CXL. Public Relations 1 6 8
CXLI. Improvements
XI
CHAPTER I
INTRODUCTION
Historically American education has been a vibrant, ever-
changing part of the American scene. Three major, identifi-
able changes have occurred in the last three decades. The
fastest, most drastic change was the change which began with
the launching of the Sputnik satellite by the Soviets on
October 4, 1957. "Russia is ahead of America!! The Soviets
have beaten us into space!!" Almost over night the attention
of the American citizens focused on the urgent need for mathe-
matics and science training in the schools. Immediately rapid
and strategic changes in American education began taking shape.
From the federal government right on down through the states
to the local school districts, these sweeping changes were
carried out. American public education came out of this
period of change stronger and better than ever before.
Then a second change began to take place in American
education—a change that was so slow and subtle that it was
almost unnoticed—yet a change so significant that the
National Commission on Excellence in Education reported, "If
an unfriendly foreign power had attempted to impose on
America the mediocre educational performance that exists today,
we might well have viewed it as an act of war" (38, p. 1).
This second change was a gradual movement away from the
challenging academic program which emphasized mathematics
and science toward a more social orientation. Copperman
referred to it as a shift "away from vigorous, cognitive
learning which emphasized a demanding curriculum to psycho
logical objectives, such as maintaining self-esteem and
encouraging creativity and development of independence and
judgment" (4, p. 6).
Writing in a special edition magazine entitled American
Renewal, Finn stated,
We now ask the schools to forge good citizens, to feed hungry youngsters, to compensate for disadvantages in individual family backgrounds and overcome centuries-old prejudices, to instill values that perhaps not all hold sacred, to discipline the unruly and buttress the psyches of the unstable, to inculcate an appreciation of the arts, to transmit our common culture while preserv-ing each of its diverse elements, to confer equality upon youngsters with physical or mental handicaps, and to exalt the life of the mind in the eyes of adolescents whose outside activities are anything but exalted and whose bodies are ablaze with nonintellectual urgings. All these things and more we ask of our schools. We should not be surprised that they cannot do all of them, and we should be grateful that they do so much (5, p. 70)
A third distinctive change in American education is now
in progress—a movement back to a rigorous basic academic
program. This change is not as drastic, or immediate, or
organized as the change that began with the Sputnik launch;
yet neither is it as slow or as subtle as the change toward
the social and psychological objectives of the 1960s. Some
educators began to sound the alarm in the early 197 0s-
"Johnny can't read!! SAT scores are declining!! What do we
do? What is the answer?" The public, through their elected
representatives in state legislatures and through their state
boards of education all over the country began to answer,
"Back to the basicsl! Accountability!! Teach the basics and
then test to see if they have been learned!!" By the time the
report of the National Commission on Excellence in Education
was made public in May, 1983, all states had identified mastery
of the basic skills as the major goal of education (11, p. 10).
Thirty-seven states had already adopted some type of statewide
assessment program to test basic skills (10, p. 16).
Arkansas began its statewide assessment program in 1979,
with the passage of Act 666 by the 72nd General Assembly. Act
666 mandated a statewide testing program to (a) measure pupil
performance in the basic subjects taught generally in the
schools of the state; (b) provide data concerning the strengths
and weaknesses of the instructional programs of the various
school districts in the state; (c) provide information to
assist in planning education programs and identifying educa-
tional priorities; (d) provide teachers with diagnostic infor-
mation; and (e) assess how well districts and schools are
meeting state and school district educational goals and minimum
performance goals (1). The law further states that the score
reports from various districts shall be considered public docu-
ments and made available to the citizens of the various dis-
tricts (1) .

4
As might be expected with most large-scale mandated
change, the change is accompanied by controversy. Scriven,
for instance, has described basic skills testing as "the last
best hope for education" (13, p. 87), while Nader called it
"a complete fraud" (13, p. 87). On the national level, the
most intense battle was waged in Washington, D. C., in July,
1981. Trial-like hearings on minimum competency testing were
held for three days. The pros and cons were discussed for
more than twenty hours by such respected educational leaders
as James Popham, Ralph Tyler, Barbara Jordan, Robert Ebel,
Joseph Cronin, and Shirley Chisholm (8).
There has also been controversy within the state of
Arkansas, as evidenced by the following quotations from the
Arkansas Gazette.
Theoretically the standardized test scores aren^t to be used for making comparisons among school districts. In practice they are apt to be used for precisely that. The test scores are public information, published m news papers, and the superintendent of a district whose pupils consistently score poorly may find himself in the same position as a football coach whose teams score poorly.
Some teachers fear we're evaluating them. . . . That's not the idea.
It's not supposed to be the idea, but teachers, like administrators, suspect it'll work out that way.
*One'criticism*that teachers make of standardized testing is that it leads to "teaching to the test. That is the curriculum will become narrow and shallow, designed only to help students answer specific questions on a specific test, while education in the broader sense is neglected.
* They worry that test scores will be used to make invalid comparisons and reach invalid conclusions, an that testing takes time away from instruction (1 , p.
The Arkansas Education Association says state officials violated the intent of the law by not releas-ing socioeconomic data along with the scores of a standardized test for public school students last
month.
In the Newsletter the AEA also said, "contrary to popular opinion that Arkansas students are learning more, it is more likely Arkansas children are spending less time in the study of science, health, geography, and related nontest subjects" (2, pp. 1A, 4A).
Fourth graders in . . . county's three school dis-tricts took this same standardized test on learning skills and the scores ranged from 16 to 74. . . . Officials maintain that the scores don't really indicate that the children in the high scoring district . . ., know any more than in the low scoring district . . . or that the quality of education is any different. . . . He pointed out that the scores of children in . . . county, as in other parts of the state, nearly doubled from list year. . . . Teachers feel that too much emphasis is being placed on the tests . . . had no doubts that his teachers are just as good as those in the other districts and expects more significant gains will be seen in test scores next year (7, p. 16A) .
These controversial newspaper articles appeared during
the first two years of the Arkansas Student Assessment Pro-
gram. Positive strides have been made since that rather
unsettled beginning. Test scores have improved, and state-
wide mandated testing is not nearly as volatile an issue as
it once was. However, educational leaders in Arkansas have
formed some very definite, yet very diverse, opinions toward
the state mandated testing program. Up to this point no
formal research study has been done to assess the percep-
tions of various groups of educational leaders in Arkansas
concerning the Arkansas Student Assessment Program.

Statement of the Problem
The problem of this study was to compare the percep-
tions of Arkansas state legislators, superintendents, and
teachers toward the Arkansas Student Assessment Program.
Purpose of the Study
The overall purpose of the study was to assist educa-
tional planners in Arkansas by generating data concerning
the perception of state legislators, superintendents, and
teachers toward the Arkansas Student Assessment Program.
The specific purposes of the study were (a) to determine the
perceptions of Arkansas state legislators, superintendents,
and teachers toward the Arkansas Student Assessment Program;
(b) to determine the differences in the perceptions of the
three groups toward the Arkansas Student Assessment Program;
(c) to determine the difference in the perception of the
Arkansas Student Assessment Program by professional educators
(superintendents and teachers) according to the size of the
school district (ADA, or Average Daily Attendance); (d) to
determine the level of understanding of the Arkansas Student
Assessment Program by the three groups; (e) to provide
information to the state legislature, the Arkansas Department
of Education, and professional educators concerning the
beliefs held by the three groups toward the Arkansas Student
Assessment Program; (f) to encourage communication which can
lead to understanding of the assessment program and of
differing viewpoints toward the program; (g) to identify
aspects of the assessment program which need clarification;
(h) to identify one or more groups of educational leaders
who might need more information regarding the Arkansas
Student Assessment Program; and (i) to provide a basis for
modification of the Arkansas Student Assessment Program if
this were deemed advisable.
Hypotheses
The following hypotheses were formed in order to carry
out the purposes of this study.
Hypothesis 1.—There is no significant difference
between the groups in their understanding of the Arkansas
Student Assessment Program.
Hypothesis 2 .—There is no significant difference
between the groups in their perception of the adequacy of
the Arkansas Student Assessment Program.
Hypothesis 3.—There is no significant difference
between the groups in their perception of the fairness of
the Arkansas Student Assessment Program.
Hypothesis £.—There is no significant difference
between the groups in their perception of the use of the
results of the Arkansas Student Assessment Program.
Hypothesis 5.—There is no significant difference
between the groups in their perception of the educational
impact of the Arkansas Student Assessment Program.
8
Hypothesis 6.—There is no significant difference
between the groups in their perception of the public rela-
tions aspect of the Arkansas Student Assessment Program.
Hypothesis 7.—There is no significant difference
between the groups in their perception of the improvements
needed in the Arkansas Student Assessment Program.
Hypothesis 8.—There is no significant difference
between superintendents of large school districts and super-
intendents of small school districts in their perception of
the Arkansas Student Assessment Program.
8a. There is no significant difference between super-
intendents of small school districts and superintendents of
large school districts in their understanding of the Arkansas
Student Assessment Program.
8b. There is no significant difference between super-
intendents of large school districts and superintendents of
small school districts in their perception of the adequacy
of the Arkansas Student Assessment Program.
8c. There is no significant difference between super-
intendents of large school districts and superintendents of
small schools in their perception of the fairness of the
Arkansas Student Assessment Program.
8d. There is no significant difference between super-
intendents of large school districts and superintendents Of
small school districts in their perception of the use of the
results of the Arkansas Student Assessment Program.
8e. There is no significant difference between super-
intendents Q£ large school districts and superintendents of
small school districts in their perception of the educational
impact of the Arkansas Student Assessment Program.
8f. There is no significant difference between super-
intendents of large school districts and superintendents of
small school districts in their perception of the public
relations aspect of the Arkansas Student Assessment Program.
8g. There is no significant difference between super-
intendents of large school districts and superintendents of
small school districts in their perception of the improvements
needed in the Arkansas Student Assessment Program.
Hypothesis 9.—There is no significant difference
between teachers in large school districts and teachers in
small school districts in their perception of the Arkansas
Student Assessment Program.
9a. There is no significant difference between teachers
in large school districts and teachers in small school
districts in their understanding of the Arkansas Student
Assessment Program.
9b• There is no significant difference between
teachers in large school districts and teachers in small
school districts in their perception of the adequacy of the
Arkansas Student Assessment Program.
9c. There is no significant difference between
teachers in large school districts and teachers in small

10
school districts in their perception of the fairness of
the Arkansas Student Assessment Program.
9d. There is no significant difference between
teachers in large school districts and teachers in small
school districts in their perception of the use of the
results of the Arkansas Student Assessment Program.
9e. There is no significant difference between
teachers in large school districts and teachers in small
school districts in their perception of the educational
impact of the Arkansas Student Assessment Program.
9f. There is no significant difference between
teachers in large school districts and teachers in small
school districts in their perception of the public relations
aspect of the Arkansas Student Assessment Program.
9g. There is no significant difference between
teachers in large school districts and teachers m small
school districts in their perception of the improvements
needed in the Arkansas Student Assessment Program.
Definition of Terms
The following terms are defined for the purpose of this
study.
Mandated testing program.—A testing program which a
school district is compelled or ordered to institute. The
order generally comes from either the state legislature or
the state department of education.
11
Statewide testing program.—A testing program in which
tests are administered in all public school districts in the
state.
Arkansas Student Assessment Program. The basic skills
testing program mandated by Act 666 of the 72nd General
Assembly of the Arkansas State Legislature and administered
in all public school districts in Arkansas.
Minimum competency test.—A test which determines if a
student meets certain standards which have been set. These
are set by selecting and defining competencies necessary for
success and setting a score at the minimum level of accepted
proficiency.
Criterion referenced test.—A test which is constructed
to yield results that are directly interpretable in terms of
specified performance standards. It is not designed to reveal
an individual's standing within a group, but to indicate what
an individual can or cannot do with certain specified require-
ments .
Norm referenced test.--A test in which the score reveals
where the person stands in some population of people who have taken the test.
Basic skills.—Subject areas considered to be basic to
successful functioning in society, including but not limited
to reading, writing, and arithmetic.
12
Limitations
One limitation of this study is that the results are
valid only to the extent that the respondents honestly answer
each question. There is also the possibility that some
respondents are new to their positions and may not have
adequate information upon which to base their responses.
Basic Assumptions
It is assumed that perceptions of state legislators,
superintendents, and teachers toward the Arkansas Student
Assessment Program can accurately be measured and reported.
It is further assumed that randomly selected samples of
superintendents and teachers are representative of the popu-
lation.
Significance of the Study
The Arkansas Student Assessment Program is a controver-
sial issue in Arkansas education (2, 3, 6, 7, 9, 12). This
study is significant in that it identifies differences in
the way three groups of educational leaders state legis-
lators, superintendents, and teachers—view the Arkansas
Student Assessment Program; it also identifies differences
in the way that educators from small schools and educators
from large schools view the statewide testing program. This
program has been in existence since 1979, and no formal study
of the perceptions of various educational leaders has been
done; therefore there is a need for this study.

13
In 1979, the 72nd General Assembly of the Arkansas
Legislature passed Act 666, which mandated the statewide
testing program in Arkansas. What outcomes did the legis-
lators have in mind? Educational legislation might some-
times be passed with one set of ourcomes in mind, and the
legislation might produce an entirely different set of out-
comes; or the legislature might mandate one thing; the state
department of education might deliver another; and super-
intendents and teachers might expect something completely
different. Communication is a key ingredient to understand-
ing. This study is significant in that it could accomplish
the following:
1. Generate communication which can lead to under-standing of the program and of differing viewpoints.
2. Promote understanding by revealing the perceptions of three groups of educational leaders toward the Arkansas Student Assessment Program.
3. Identify parts of or aspects of the Arkansas Student Assessment Program which need clarification.
4. Identify one or more groups of educational leaders who need more information regarding the Arkansas Student Assessment Program.
5. Provide a basis for modification of the Arkansas Student Assessment Program if this were deemed advisable.
The following quotations are indicative of the signifi-
cance of the study. Wayne Hartsfield, Chairman of the
Arkansas State Board of Education, in a letter dated March 23,
1983, wrote, "I think this is a worthy research program for

14
our state, and the results should be of value to education
in our state."
The Honorable John Paul Capps, Speaker of the Arkansas
House of Representatives, in a letter dated March 23, 1983,
stated,
A study of this type would supply the legislature with the follow-up that would enable us to make any needed adjustments to the enabling legislation. To ̂ date we have received only the basic score information, which in itself is not sufficient for decision making of this scope.
Although this study pertains only to the state of
Arkansas, the results have implications for all states which
now have statewide testing programs. It could also be bene-
ficial to states which are contemplating beginning a state-
wide testing program.
CHAPTER BIBLIOGRAPHY
1. Arkansas State Legislature, Act 666 of 1979, Regular Session, 72nd General Assembly, March 30, 1979.
2. Associated Press, "A.E.A. Hits Lack of Data," Arkansas Gazette, September 6, 1981, pp. 1A, 4A.
3. , "Educators Blame Economic Attitudes," Arkansas"Gazette, September 6, 1981, pp. 1A, 4A.
4. Copperman, Paul, "The Crisis in Our Schools," Family Weekly, October 19, 1980, pp. 4-6.
5. Finn, Chester E., "A Call for Quality Education," American Renewal, Reprint from Life Magazine, March, 1981, Time, Inc., Chicago, Illinois, pp. 68-77.
6. Fulk, Marion, "White Affluent Girls Achieve Best Test Scores," Arkansas Gazette, July 29, 1982, p. 14A.
7. Hopkins, Jennifer, " . . . County Test Scores Create Stir, Not Gauge of Education, Officials Say," Arkansas Gazette, November 1, 1981, p. 16A.
8. Madaus, George F., "NIE Clarification Hearing: The Nega-tive Team's Case," Phi Delta Kappan, 63 (October, 1981), 92-94.
9. McCambell, Duane, "Merit Pay: Reward for Teachers or Scapegoat for Politicians," Search Daily Citizen, Searcy, Arkansas, June 21, 1983, p. 4.
10. National Commission on Excellence in Education, "A Nation at Risk," April, 1983.
11. Riegel, Rodney P. and Ned B. Lovell, Minimum Competency Testing, Phi Delta Kappan Fastback Number 137, Phi Delta Kappa Educational Foundation, Bloomington, Illinois, 1980.
12. Smith, Doug, "The Plan: Is Test Score or Learning Fore-most?" Arkansas Gazette, May 10, 1981, pp. 1F-2F.
13. Thurston, Paul and Ernest House, "The NIE Adversary Hear-ing on Minimum Competency Testing," Phi Delta Kappan, 63 (October, 1981), 87-89.
15

CHAPTER II
SYNTHESIS OF RELATED LITERATURE
A search of the literature reveals that there has been
a great deal of research done on the statewide testing move-
ments. Gorce states that "one of the most popular issues in
the educational journals over the last five years has been
Competency-Based Testing" (25, p. 370). Although there is
an abundance of literature concerning statewide testing in
general, a limited amount of research has been done on the
perception of statewide testing programs by various publics.
Horn (29), after reviewing the research for a Nevada study,
says that nothing is being done to assess opinions on state-
wide testing movements. He adds that this contention is
supported by Far West Lab, ERIC, Nevada State Department of
Education, and Education Commission of the states. He says
that,
. in reviewing the literature, it was discovered that none of the 36 states that have, as of January 1, 1979, enacted some form of competency-based testing have examined the views or opinions of any selected publics within their respective states (29, pp. 22-23).
Palmer, Milton, and Fears also found that
. although numerous concerns about the minimum competency approach were found in the literature, the research did not reveal any survey conducted to deter-mine teachers' attitudes about the program (40, p. 106)
16

17
Apparently researchers are beginning to see a need for this
type information, because a review of the latest research
did reveal a few studies concerned with the perceptions of
various publics toward statewide testing programs (7, 16, 19,
24, 29, 31, 40).
This review of the literature is limited to the follow-
ing areas: (1) An explanation of statewide testing, (2) Back-
ground of the statewide testing movement, (3) Brief history of
the statewide testing movement, (4) Brief overview of the
current status of movement, (5) The anti—testing movement,
and (6) General information concerning the statewide testing
movement.
Explanation of Statewide Testing
The statewide testing movement refers to state mandated
testing programs, mandated either by the state legislatures
or state boards of education. Statewide testing programs may
be referred to in the literature as competency testing pro-
grams, minimum competency testing programs, state assessment
programs, basic skills testing programs, or similar terms.
Differences in competency testing programs exist from state
to state. Beckham (9, p. 11) points out that competency
testing may refer only to having to pass a test in order to
receive a diploma, while in another instance it might have as
its purpose the identification of learning problems, with
emphasis on remediation. In yet another setting the statewide
18
testing program may be for the primary purpose of helping
with promotion-retention decisions; another state may see
the primary function of their statewide testing program as
the evaluation of the progress of school districts in attain-
ing educational goals. For the purpose of this study, all
state-mandated programs for testing basic skills are considered
under the general heading of Statewide Testing Programs.
Background of the Statewide Testing Movement
The statewide testing movement began as a result of a
perceived decline in the quality of education offered to
American students. Beckham (9/ p. 11) says that it is
generally agreed that the movement resulted from widespread
public dissatisfaction with the nation's schools. Allega-
tions of serious shortcomings in educational programs have
led to today's emphasis on measuring student achievement as
one indicator of the effectiveness of our schools. Naisbitt,
in his widely acclaimed book Megatrends, says, "the 1970's
were not the best years for the public school system, but
rather may have been the system's darkest hour" (35, p. 142).
Parnell (41, p. 12) sees the statewide testing movement
as a means to refocus education on the basics. He states
that the philosophy of "educating the whole child" began to
lead education into all sorts of social endeavors, resulting
in the schools becoming overextended and their mission becom-
ing increasingly unclear.

19
As a result of widespread public dissatisfaction, there
began to be an increasing demand for accountability in educa—
tion. Hugh Peck, of the Louisiana State Department of Educa-
tion, stated,
The issues of graduates who cannot read, write, or compute, of social promotion, of teachers who cannot or will not teach, and school administrators who cannot or will not administer, were raised in our state as they were in others. Our public needed renewed faith in their public schools (44, pp. 4-5).
Popham (49, p. 637) emphasizes that the public needs reassur-
ance of educators' effectiveness. Ebel (18) states that if
teachers and schools claim to be doing a good job, as most of
them do, then they should not be surprised if taxpayers ask,
"Where is the evidence?11 Rosenthal and Fuhrman (56) indicate
that the reason so many statewide testing programs have been
mandated is in order to achieve accountability for the money
being spent by school districts. Impara (30, p. 5) states
that the public wants some evidence about the quality of its
public schools. He says that citizens of a state have the
right to know specific information—about costs, time invest-
ment, policies, and student achievement; in the final analysis,
taxpayers must judge whether public education is giving the
public a reasonable return on its investment.
Brief History of the Statewide Testing Movement
Since there have been various forms of statewide test-
ing around for many years, there is some disagreement as to

20
when the movement actually began. The Mew York State Regent s
Examination, for instance, can be traced back over a century
(53, p. 6). For the purpose of this study, however, the
actual beginning of the modern statewide testing program for
assessing basic skills originated in the early 1970s (53,
p. 6). According to Riegel and Lovell (53), the first program
began in Oregon in 1972 "with the great hope that it would
improve the accountability and quality of education (53,
p. 14). State after state then began mandating statewide
testing programs, with nearly all activity occurring since
1976 (26, p. iii).
Brief Overview of Current Status of Statewide Testing
Although statewide testing programs have been discussed
in every state in the union (53, p. 34), at the present time
thirty-seven states (36, p. 16) have mandated programs.
According to Gorth (26, p. 2) these mandates are about
equally divided between state legislatures and state boards
of education. All programs test reading and math, and most
test either language arts or writing.
Atkinson (6) records the most frequently cited goals of
minimum competency testing programs as follows:
1. to make schools more accountable for their educa-tional programs,
2. to insure that students master specified skills, 3. to clarify the content of educational programs, 4. to identify students in need of remediation, 5. to provide motivation for students to acquire
skills required in life, and
21
6. to reorganize school resources based on the needs of students (6, p. 23).
Riegel and Lovell (53) have identified three major
themes appearing in states which have adopted statewide
testing programs.
1. The state has the duty to set up minimum^levels of proficiency in skills necessary to function as an adult citizen.
2. A written test is the most practical way to evaluate the achievement of these levels of proficiency.
3. Test results should be used in educational decision making (53, p. 10).
The Anti-Testing Movement
While state-mandated testing was growing so rapidly in
the 1970s, an anti-testing movement was also in full swing,
not only against the statewide testing programs, but also
against objective tests in general. California and New York
have banned group-administered intelligence tests (45, p. 30).
The National Education Association passed a resolution calling
for a moratorium on the use of standardized intelligence and
achievement tests in 1972; the National Association for
Advancement of Colored People issued a moratorium statement
in May, 1975; The Association for Childhood Education
International gave support to the moratorium in 1976; and
the Association for Supervision and Curriculum Development,
American Association of School Administrators, National
Association of Elementary School Principals, and the National
Council of Teachers of English, while not calling directly
22
for a moratorium, used particularly strong language in
agitating for a reconsideration of all uses of standardized
intelligence and achievement tests (4 5). Riegel and Lovell
(53) also indicate that the large education groups oppose
minimum competency testing unless it is tied to remediation,
local control, and increased funding. They see the impetus
for statewide testing programs coming not from educators, but
from legislators and the general public (53, p. 8). They go
on to explain that teachers and administrators are suspicious
that minimum competency testing will be used to evaluate them
unfairly, erode local control, and become a financial burden.
At the Twelfth Annual Conference on Large Scale Assess-
ment sponsored by the Commission of the States in the summer
of 1982, Gerald Bracey, Director of Research, Education and
Testing for the Virginia Department of Education, said,
Happily there appears to be a trend in Virginia and Florida, and perhaps across the nation, to turn away from the fruitless concept of minimum competency testing to potentially more meaningful conceptions of excellence (46, p. 157).
New Jersey then affirmed Bracey's prediction when Copperman,
the new commissioner of education, announced a moratorium on
basic skills testing in grades three and six (46, p. 157).
One of the nation's most highly respected testing com-
panies, Educational Testing Service, was criticized quite
severely by Owen (39) in the May, 1983, issue of Harper
Magazine. Owen indicated that Educational Testing Service is
in its last days--not just because of economics, but because

23
the public is beginning to wise up to the fact that standard-
ized tests do not really yield meaningful information. Owen
alludes to a group founded by Nader which published a 500-
plus page report accusing Educational Testing Service of mis-
representing its tests (39).
General Information Concerning Statewide Testing Programs
In looking at how various publics understand statewide
testing programs, Cooley (16) found that when he surveyed
superintendents and teachers in Louisiana, 97.1 per cent of
teachers and 98.3 per cent of superintendents felt that they
were aware of the minimum standards being tested. In a 1980
study, Rosenthal and Fuhrman (56) found that legislators also
had some understandings of educational programs. They found
that legislators taking key roles in educational policy-
making typically had educational backgrounds, and the number
of legislators who are teaching and former teachers has been
growing markedly in recent years (56, p. 5). Glasman (24)
found that legislators developing the strongest interest in
educational evaluation are those who propose the bills, and
that this interest develops out of having to defend the pro-
posed bill. She also found that this interest seldom
develops in the whole committee, and that skepticism, rather
than interest, exists among legislators, with regard to
evaluation.
24
Adequacy of statewide testing programs concerns the
grades tested, the subjects tested, and the level of dif-
ficulty of the tests. Pechman (43) feels that math should
not be included in testing programs below third grade. She
says that research shows that children do not attain the
logical framework for math until later. In research designed
to assist North Carolina officials to decide whether to add
writing to their statewide assessment, Brown (11) indicates
that because of the difficulty in accurately measuring writ-
ing, most states do not include it; but if it is determined
that writing can be measured with adequate validity and
reliability, the minimum competency skills in North Carolina
will be expanded to include writing, as well as reading and
math. In studying the perception of superintendents and high
school principals in New York State toward their statewide
test for high school graduation, the New York State Education
Department found that most school administrators found the
standards were either appropriate or too low (37). Palmer,
Milton and Fears (40) found that Florida teachers also con-
sidered their statewide testing standards set too low. A
study of attitudes of selected public school educators in
Tennessee (63) toward their statewide testing program
revealed that (1) principals, teachers, and superintendents
chose as their first priority the testing of grades three,
six, nine, and twelve; (2) teachers and principals felt that
reading, mathematics, and composition should be included in
25
the statewide test; and (3) superintendents selected reading,
mathematics and language as the subjects to be included.
Cooley (16), in his Louisiana study, found that super-
intendents chose to test in grades three, seven, ten, and
eleven; while teachers chose grades four, eight, and eleven.
Both teachers (71.4 per cent) and superintendents (75.4 per
cent) felt that only reading, mathematics, and writing should
be included in the statewide assessment. Both teachers (85.5
per cent) and superintendents (77.4 per cent) believe that the
Louisiana Statewide Assessment is too difficult.
Statewide testing programs have not escaped the scrutiny
of the courts concerning the fairness of the program. Several
states have been involved in litigation, including Florida,
Delaware, North Carolina, and Virginia. The major thrust of
the litigation up to this point has been the supposed racial
bias of the tests and the suits by the media to receive the
test results (26). The most recent litigation settlement
occurred in Florida in May, 1983, when a federal appeals court
upheld Florida's functional literacy test, allowing the state
to withhold diplomas from approximately 1,300 seniors who
failed the examination (5). Beckham stated that,
Due process standards guaranteed by the fourteenth amendment may be invoked in cases where minimum com-petency testing is implemented without adequate notice, phase-in, or concern for remediation of learners (9, p. 8) .
Beckham goes on to say, "Most challenges to mandatory test-
ing focus on allegations that the test discriminates against
26
a minority" (9, p. 16). He also cited Hobson v. Hansen
(1967), in which the court noted that the primary concern
was that "those consigned to the lower track were poor and
black, whereas those in the upper tracks were more affluent
and white" (9, p. 19). Another important area in which
litigation might occur is in the area of congruence between
that which is taught and the content of the minimum com-
petency test (9, p. 29).
Pechman noted the importance of fairness when she stated
that,
Issues relating to test security, consistency, and standardization of test administration, monitoring, and even the simple logistics associated with packaging and assuring the accuracy of the computer scanned test responses are all major concerns . . . even with experienced and specially trained test administrators, consistency of test implementation is hard to achieve (9, pp. 7-8).
One of the major concerns about the fairness of minimum
competency testing is that in some schools it might lead to
teaching to the test (45, p. 8). There is a fear that the
curriculum will become narrow and shallow, designed only to
help students answer specific questions on a specified test,
while education in the broader sense is neglected (60, p. 2F)
Ebel stated,
If the effectiveness of instruction is to be assessed on the basis of student performance on a test, the temptation is strong for the instructor to prepare students to handle the specific questions that will be included in the test. This is often called "teaching to the test." Obviously it is not an educationally beneficial procedure and, obviously it tends to spoil the test (18, p. 12).

27
A study of Florida teachers involved in competency testing
revealed that 50 per cent of teachers find themselves "teach-
ing to the test" (40, p. 107). Coburn (13), writing about
the Michigan statewide testing program, stated that some dis-
tricts with large proportions of less capable students begin
cramming for the tests. A few teachers have complained of
being requested by administrators to use previous year's tests
as a drill device. In a Tennessee study, 37 per cent of
principals and 33 per cent of teachers felt that teachers
should have a copy of the test at the beginning of the school
year and administer the test at the end of the year (63,
p. 74). In Gary, Indiana, it was found that teachers were
unfairly assisting their students; therefore classroom teachers
no longer administer tests to their own students (26, p. 27).
Prince (50) did a study of the Mississippi statewide
testing program. After finding abnormally high scores in some
school districts, he commented, "Could fear of adverse
publicity about scores have caused school personnel to submit
spurious scores to the SDE? The likelihood of this occurring
is high" (50, p. 81). He went on to say that,
Some violations of test security such as knowledge of specific material on the test by students or the trans-mission of the correct answers on the test to students seems likely in some grades in a few districts in order to have produced the numbers of extreme outliers found (50, p. 82).
In a report on the perceptions of California legislators
toward the statewide evaluation program in California,
28
Glasman (24) found that officials in the evaluation unit of
the state department of education believe that the depart-
ment' s credibility is low in the eyes of the legislature
because the state department admits to having manipulated
information in the past.
Perhaps the ultimate example of test score manipulation
occurred in New York City, when the reading test was given
and the results were received. Then the schools received an
urgent memo from the chancellor's office, ordering principals
to lock up the results and recall any test data released. A
new test was administered to more than half a million students.
The first test showed a decline in reading scores; the second
showed a spectacular rise in reading scores. Two questions
are asked.
Did the . . . administration want the system managed by their predecessors to look as bad as possible so that future test scores would demonstrate that read-ing had improved under their direction? . . . Is it possible to shop around for a test that will produce whatever result a school system wants to demonstrate (15, p. 79)?
Another area of statewide testing that some feel is
unfair is the reporting of results by school district with-
out including information about socioeconomic conditions or
education of adults in the district. Impara (30) states
that ". . - a test will not make such comparisons equitable
without extensive data on achievement correlates such as
socioeconomic levels, parents' education, consistency on
instructional content and method, and so on" (30, p. 7).
29
The importance of educational level of parents is confirmed
in a North Carolina study (38). A direct relationship was
observed between the number of students who passed both the
reading and mathematics competency tests and the educational
level of their parents. For example, on the reading test,
only 68 per cent of the students whose parents attained an
eighth-grade education or less scored at or above the cutoff
score, while the percentage of students who passed the test
and whose parents had between an eighth-grade and eleventh-
grade education was 83 per cent. When both were high school
graduates, 93 per cent passed the test and those whose
parents had more than a high school education, 98 per cent
passed the test.
Gillespie (23) mentions another area of possible unfair-
ness in statewide testing programs. She says that if special
education students are also tested, school districts including
more special education students in testing would be likely
to have lower district-level scores.
The literature contains more references to unfairness
because of race and socioeconomic level than to unfairness
in any other aspect of the statewide testing program.
We are in an era when "equal educational opportunity" is being affirmed as never before. That affirmation has brought with it increased understanding of the ways in which children of the poor, who include a large percentage of America's minorities, racial and ethnic, have been deprived of equal educational opportunities. The role that standardized tests have played in this process fills the literature and helps fuel the debate (45, p. 5).
30
In Arkansas in 1981, thirteen of the top fourteen scores
recorded by fourth graders were in school districts where
at least 92 per cent of the students were white. Conversely,
twelve of the lowest sixteen scores were in school districts
where at least 63 per cent of the students were black (4,
p. 1A). White girls from upper socioeconomic levels generally
had the highest scores on the Arkansas Minimum Performance
Test (22). Perrone accuses standardized tests of serving "to
justify the continued pre-eminence of the privileged in
American society" (45, p. 15).
Ahmann (1) says,
It hardly raises eyebrows to announce that young people coming from enriched environments succeed well in school while those from poor environments do not. What is unusual is the size of these differences. The achievement levels of those from the affluent suburb, for instance, are typically 6 percent to 10 percent above the national average in school-specific learning areas—learning areas such as science and mathematics strongly influenced by school participation. In con-trast, achievement levels of young Americans living in the inner city are often 10 percent to 15 percent below the national average in such learning areas. Sad to say, the differences between white and black respondents are even more extreme (1, p. 2A).
Ramsbotham (52) states that minority students have performed
more poorly on competency tests than other students, and
most states with minimum competency programs appear to devote
more effort to assessing the needs of disadvantaged students
than to meeting those needs. Erickson, executive director of
the Arkansas Education Association, expressed concern that
scores of Arkansas school districts are reported without
31
socioeconomic information which, according to Erickson,
would help explain the scores. The Arkansas Education
Association says, "state officials violated the intent of
the law by not releasing socioeconomic data along with the
scores of a standardized achievement test for public school
students" (3, p. 1A). Popham (47) states that indications
are that proportionally more minority students than others
are failing minimum competency tests, but that this does not
indicate unfairness; it reveals that
. . . minority students are currently receiving inadequate educations in far too many U.S. classrooms. . . . Minimum competency testing will reveal these inequities so that they can be rectified. After all, a doctor who assures a seriously ill patient that all is well does that patient no favor (47, p. 91).
Concerning the fairness of the Arkansas statewide testing
program, McCampbell states, " . . . while tests should demon-
strate which schools are doing the best job, in some cases,
many believe they have merely demonstrated which schools were
willing to cheat" (33, p. 4).
The literature contains a great deal of information
about the use of statewide testing programs. Impara (30)
says that an assessment program that is not used at all is
invalid, because it fails to meet the criterion of effective-
ness. He says that assessment is an educational tool; it
must be used to be justified. He goes on to say that one of
the expressed purposes of statewide assessment is to provide
information to decision-making bodies and the public. Mizell
32
(34) states that tests and test results should not be con-
sidered to be the exclusive property of the school or school
district. Roeber (54) cautions against non-use of the
results. He says that some educators seerr. to believe that
the only use to be made of the results is to report them to
the public. He says that districts with declining scores or
below average results try to shun publicity, hoping to avoid
the negative image such results will bring.
Regardless of the importance of reporting and using
results, there are indications that results are not always
reported completely or used properly. Sebring and Boruch
(58) state that their case studies and interviews revealed
that most states have little or no evidence regarding use of
statewide assessment reports. Roeber (54) states that local
educators often state their lack of training or the lack of
time or money as excuses for not using and reporting results. i
In a study of perceptions of statewide testing in California,
Glasman (24) says that state education department evaluators
become increasingly frustrated when their statewide evalua-
tion reports are not used as significant inputs in the
formatio"rTT>f "new policies. Impara (30), in relating the
results of a study of teacher attitudes toward the Michigan
statewide testing program, stated that "assessment informa-
tion transmitted to teachers results in recommendations they
felt they could not comply with physically or mentally, and

33
information which was irrelevant to their personal interests"
(30, p. 8).
In a survey of eighth-grade language arts teachers in
Missouri, Dowdy (17) found that 67 per cent of responding
teachers used the statewide testing results very little or
not at all. Results of research in Oregon (7) indicated
that less than one-third of the states who had statewide
testing programs could provide evidence of using the results
to make the kinds of decisions most frequently cited as
justification for initiating the programs. Cole (14) reported
on research done at two Pennsylvania universities; he said
that teachers form their own judgments about the ability and
achievement of their students independent of test results.
Concerning the various uses made of the results of state-
wide testing programs, Wall and Geppert (62) list the follow-
ing : f
(1) diagnose student skill deficiencies, (2) better assure the attainment of minimal standards by students before teaching more complex skills, (3) remediate students on identified skill weaknesses, (4) identify objectives that require reteaching, and (5) group students for instruction based on common skill needs (62, p. 53).
Riegel and Lovell (53) list the uses as f <3TSt>wS:
(1) measure the quality of education, (2) provide information to assist educational decision making, and (3) identify the effectiveness of instructional pro-grams and assist in the evaluation of school personnel (53, p. 11).
They add that four deliberate strategies have evolved
around accountability which include
3.4
(1) test performance is the basis for awarding diplomas, (2) test performance is the basis for grade-to-grade promotion, (3) test performance identifies students who need remedial instruction,' and (4) test performance is the basis for evaluating program effectiveness and for developing educational improvement plans (53, p. 11).
In Walters' (63) study of Tennessee educators' attitudes
toward the statewide testing program, those she polled
indicated that minimum competency testing should be used to
diagnose deficiencies, determine the need for remediation,
promote students from grade to grade, and determine eligi-
bility for high school graduation.
Concerning the use of statewide assessment results to
improve the local school, Greene (27) says that statewide test
results are useful in informing schools of their strengths
and weaknesses, which can aid in selecting curriculum
materials. Much of the literature on the use of statewide
testing results cautions that individual diagnosis is an
inappropriate use (27, 30, 40). Impara says that diagnosis
requires much more comprehensive and exhaustive evaluation
(30, p. 8) .
Host authors who have written on the subject of the use
of state assessment results for promotion and retention of
students indicate that if used at all in promotion-retention
decisions, the results of statewide assessments should be
used very carefully and not as the sole determinant. Con-
cerning this use of results, Impara states, "this use is
invalid. Measurement tools have not yet been developed which
3 5
are adequate as the sole source of decision-making about
individual children" (30, p. 8). Peckman states,
As educators we know that to base a child's promotion on a single test is entirely inappropriate, but there are many people--some educators and many parents and members of the community--who believe that a test can be so used and in this way, solve the social promotion problem (43, p. 5).
Gorth (26), in his study of statewide programs, says that
test results are taken into account in determining grade
promotion for all or some of the elementary grades, but it
is important to note that in no case do test results alone
determine decisions about grade promotion. In his study of
the perception of Louisiana educators toward the statewide
testing program, Cooley (16) recorded that 87.4 per cent said,
either definitely or to some extent, the results of the
Louisiana State Assessment Program should be the primary
criteria in determining promotion from one grade to the next.
Teachers were less in favor of this use than either super-
intendents or principals.
• Concerning the use of statewide assessment results in
tracking students, Cooley (16) found 50.2 per cent of educa-
tors in favor of this use and 32.4 per cent against it.
Superintendents overwhelmingly opposed the use, but the
majority of teachers and principals supported it. Pullin
(51, p. 21) expressed the fear that curricular match would
be a problem in using statewide testing results to track
students.
36
The requirement of passing a minimum competency test
in order to receive a high school diploma has stirred a
great deal of controversy in educational circles. Cooley
(16) found that 46.8 per cent of his respondents were in
favor of using test results for determining high school
graduation, while 53.2 per cent were opposed to it. Super-
intendents were overwhelmingly opposed, while principals were
in favor and teachers were slightly opposed. In a 1979 study
by Gorth and Perkins (26) almost half the state-mandated
programs surveyed required or would soon require that a
minimum level of achievement be attained before a high school
diploma is granted. Tennessee has decided to issue a double-
level diploma--one for students who graduate and pass the
proficiency test and a certificate of attendance to those
who meet all other requirements but fail the proficiency
test (46, p. 150). In a New York study (37) it was found
that many school administrators endorse the concept of a
minimum statewide standard for graduation but feel that the
standard should be higher. In Florida, 81.8 per cent of
teachers surveyed felt that students who failed the state-
wide test should not receive a regulae^ipjoma (40) . In a
Missouri study, Dowdy (17) found that 4 6 per cent of eighth-
grade language arts teachers polled felt that unacceptable
competency test scores should be used to withhold a diploma;
26 per cent disagreed. A poll of school board presidents,by
37
the National School Boards Association, found that 76 per
cent believed that every student should be required to pass
a minimum competency test as a prerequisite for graduation
(55). There are others, however, who believe that tying
statewide test scores to graduation is inappropriate. Elford
(20) feels that there is some merit to this use if used care-
fully and with other criteria; but he expresses the fear that
bright students who pass these minimum tests might become
self-satisfied, and the classical concept of the "educated
person" might dwindle. He also sees the possibility of some
marginal students dropping out of school rather than facing
the anxiety of the statewide test.
In 1978 the Florida legislature amended the Educational
Accountability Act, requiring students to pass a functional
literacy examination in order to receive their high school
diploma. As a result of more minority students' failing this
examination, a class action suit, Debra P. v. Turlington,
was filed. After several trials, Federal Judge George C. Carr
ruled against the minority students in May, 1982 (5). The
overriding issue in the plaintiff's appeal was whether a
state can deny a-diploma to students on the basis of an
examination over subject matter, some of which may not have
been taught thoroughly in the curriculum (48).
Pullin (51), an attorney who represented the students
in Debra P. v. Turlington, states that on the first adminis-
tration of the Florida Minimum Competency Test for Graduation
38
that 11,597 of the 41,724 students who failed the mathematics
portion of the test would have passed had the passing score
been reduced by a mere three questions. She says that
arbitrarily setting cut-off scores like this is a rather
delicate means of classifying people as being literate or
illiterate, or deciding who receives a high school diploma.
Concerning the use of statewide testing results in
teacher evaluation, Dowdy (17) says that results can be used
to prod unproductive teachers. Edelman (19) found that 38
per cent of third-grade teachers who responded to her ques-
tionnaire felt that test results were used in evaluation of
teachers. Impara (30) feels that statewide test results
should not be used to evaluate teachers. In the National
Institute of Education (NIE) Adversary Hearings on Minimum
Competency Testing held in Washington in July, 1981, both
sides agreed in advance that the evaluation of teachers 1
should not rely on minimum competency test scores (61, p. 87).
Another matter upon which both sides agreed in the NIE
Adversary Hearings was that statewide test results should not
be used to determine allocation of funds (61). However, both
Impara (30) STItP DCwdy (17) disagree. They both feel that
these tests will identify areas of greatest need and that
resources should be placed there.
One use of statewide assessment results which has caused
a great deal of controversy is the public comparison of test
39
results by school or by school district. The Alaska Depart-
ment of Education (2), in a 1980 report, explained that they
do not report results in such a way that comparisons can be
made. Each school receives its results along with the state-
wide results on each objective. School officials and teachers
know how their students have performed in relation to students
statewide, but not in relation to students in any other
individual school. Impara (30) states that
. . . statewide assessment should not be used to make school by school or district by district comparison . . . school and district comparisons are not only inappropriate but may be damaging to those involved in the comparisons (30, p. 7).
At this point in the statewide testing movement there
is a great divergence of opinion as to the impact of the
movement on education. Johnson (31) concluded that the
impact of the movement cannot be assessed at this time; it
will be several years before it can be known. Paramore (42)
and Gorce (25) found that competency testing had very little
effect in the schools.
Concerning some positive impacts of statewide testing
programs, Ebel (18) states that no school can show that it
is doing a good job without systematically auditing "Wie**
results it is getting. Popham (47) states that these tests,
although they are not perfect, are preferable to other less
objective ways of categorizing students, and these tests
establish honesty in promotion practices, restore meaning to
40
the high school diploma, eliminate basic skill deficiencies,
improve schools, and heighten public confidence in public
education. Ahmann (1) states that to be a professional is
to be accountable, and assessment procedures and findings
strengthen accountability efforts. He goes on to say that
the assessment movement and the accountability movement are
alive and strong, and education is the better for them. He
says it pays to gather systematically large amounts of high
quality information about all aspects of our educational
system. The more that is known, the better decisions can
be made—and the sooner improvements will be seen.
There are also indications that statewide testing pro-
grams have aided in curriculum development. Johnson (31)
found that test results were used to identify curriculum
area needs, for district self-evaluation, and the develop-
ment of specific changes in the curriculum. Brunton (12) i
found that the curriculum in Oregon schools had improved as
a result of the statewide testing program and more students
are taking advanced college preparatory courses. It has
also made students more accountable for their learning.
In his Nevada study, Horn— ('29) found that 59 per cent
of the legislators, 46 per cent of superintendents, and 38
per cent of teachers believed that the Nevada statewide
competency test has had a positive effect on students'
mastery of basic skills. Popham says,

41
In general, high quality MCT programs will have positive effects on students. These effects will be greater for low-achieving students, but even average and high-achieving students will profit. Minimum' competency tests will cause more students to master basic skills . . . will cause many students to develop more positive self concepts and more positive attitudes toward school (47, p. 91).
Palmer, Milton, and Fears (40), in their Florida study, state
that 76 per cent of the teachers polled agree that the state-
wide assessment -program identifies students who need assistance;
63.6 per cent agreed that students had made significant gains
in basic skills, while only 40 per cent thought students had
become more serious as a result of the program. In his
Mississippi study Prince (50) found that pupil response on the
statewide test had improved. In her Washington study, Johnson
(31) found that the mandatory testing program was perceived to
have increased learning of objectives and increased communica-
tion between the home and the school.
Much of the literature is negative toward the effects of
statewide testing of basic skills. One of the major concerns
is that the emphasis on basic skills will cause a narrowing of
the curriculum, with teachers emphasizing what is tested and
neglecting equally impo^ant material which is not tested
(53). Madaus says that "concentrating on MCT will only
increase the deterioration of these higher order skills" (32,
p. 93). Two reports by the National Council of Teachers of
English indicate that the preoccupation with minimum competency
testing is contributing to the decline in the teaching and
42
learning of critical reading and analytic skills (64).
Coburn (13) says that there is a general fear that many.
schools with a higher concentration of low-ability students
are emphasizing the attainment of scores on minimum skill
items to the exclusion of a balanced program and to the
detriment of higher ability students. Smith states that,
. . . one criticism that teachers make of standardized testing is that it leads to "teaching to the test." That is, the curriculum will become narrow and shallow, designed only to help students answer specific questions on a specific test, while education in the broader sense is neglected (59, p. IF).
Pechman (43) expresses her concern that the objective of state-
wide testing of basic skills may backfire and cause the com-
prehensive curriculum to give way to the "thirty objective
curriculum," with the public schools providing a dull
unnourishing diet--making the curriculum too narrow for able
students. Palmer, Milton, and Fears (40) found that teachers
who responded in a Florida survey found themselves spending
less time on subjects not covered in the tests. Gorce (25),
in his study of North Central Association schools, compared
those which were engaged in competency-based testing with
those whictu were not, and concluded that,
Because of the .pressure placed upon the basic courses in all areas of the curriculum, there was a definite narrowing of the.curriculum. . . . the worst fear of those opposed to CBT were also realized. Many courses and parts of courses were eliminated, especially in social studies, the abstract, the electives, the non-basic, the innovative, the esoteric, and the arts (25, pp. 373-374).
43
Another criticism of competency-based testing programs
is that students will begin to view the minimum standards as
ideals and perform at a lower level than that of which they
are capable (53). Palmer, Milton, and Fears (40) found that
37.8 per cent of their respondents feared that the minimum
competencies may become maximum competencies. In the "Nation
at Risk" report by the National Commission on Excellence in
Education, the committee stated that "we should expect schools
to have genuinely high standards rather than minimum ones" (36,
p. 9). The committee states further that "minimum competency
examinations (now required in thirty seven states) fall short
of what is needed, as the 'minimum' tends to become the
'maximum,' thus lowering educational standards for all" (36,
p. 16).
Another concern expressed by some is that basic skills
testing will be emphasized to the point that teachers will 4
become uninteresting, uncreative drill masters. Bracey (10)
says that the basics, as currently taught, force teachers to
regress even more than usual into an effectual didactic mode
of teaching, and the teacher will risk educational malpractice
suitr^*if"this mode is not used. He goes on to- saf that this
type teaching makes the learner increasingly dependent on the
teacher. Palmer, Milton, and Fears (40) found that 45.9 per
cent of their responding teachers in Florida believe their
teaching has become more mechanical.
44
Another possible negative impact of minimum competency
testing is that in expecting all students to reach certain
minimum levels, less attention will be given to individual
student needs. Serow and Davies (59) state that because
students begin their educations with enormous differences
in background and ability, education cannot be expected to
produce uniform results. Madaus (32) fears that those boys
and girls who fail the test will be labeled as incompetent,
functionally illiterate, and less than adequate and that
their self-esteem will be terribly damaged. He further
states that this may increase the dropout rate, because some
marginal students may decide not to face the possible humil-
iation of taking the minimum competency test. Atkinson (6)
points out that students who are slow learners or who are
test-anxious, or who move into a new school district (with
a different set of minimum competencies), or children of i
migrant workers, will be placed at a disadvantage in minimum
competency testing programs.
The diminishing of local control of school systems is
another possible negative impact about which some are con-
cerned. Atkinson (6) states that o p p o n e n t m i n i m u m
competency testing programs have charged that these programs
will result in the increasing bureaucratization and central-
ization of public schools. Madaus (32), in the Minimum
Competency Testing "Trial" Hearings in Washington, D. C.,
45
argued that "local control of the curriculum, a hallmark of
U. S. education, is being eroded by MCT, which is moving us
toward a de facto state curriculum" (32, p. 93). After a
National Education Association study in Florida, the NEA
viewed with alarm the erosion of local control that comes
with statewide minimum competency testing (53). In his
Pennsylvania study, Baldassare (7) indicated that school
districts expressed the concern that the statewide testing
program could be used as a means to standardize curriculum
and threaten the autonomy of each district's educational
program.
Perhaps the one aspect of statewide testing programs
which has caused the most concern among educators is the
public display of test results in such a way that schools
can be compared. Rudman (57) cautions about reporting scores
publicly. He says, "Don't report scores building by building
. . . Don't look to neighboring school districts for ranking
comparisons" (57, p. 19).
Barnes, Moriarty, and-Murphy (8) state that the public
generally assumes test results are reflective of the quality
of the school, but that_this is an invalid assumption, since
so many variables exist. They go on to say that school dis-
tricts or states typically report scores selectively rather
than to report all scores. They say that it is the job of
educators to inform the public, to anticipate criticism, and
to have a definite plan of action to propose for correcting

46
any weaknesses which might appear as a result of the test.
They also caution that comprehensive reports containing
details of test scores are inappropriate for the press and
are likely to produce consequences that are less than worth-
while. Pechman (4 3) expresses concern about the public
relations aspect of the Louisiana program.
We are hard pressed to keep a reasonable calm about the test, especially with the political interest and pressure associated with it. All the administrative directives and supervisory platitudes about curriculum will have difficulty countering the intimidating public relations that has accompanied the state test (43, p. 5).
Also in Louisiana, the Cooley study (16) found that 34 per
cent of the superintendents in his study were pleased with
the way the news media reports the results of the statewide
testing program, while 63 per cent were displeased. In the
teachers' response, 35 per cent were pleased, 31 per cent
were displeased, and 33 per cent were not sure. In response
to the question, "Do you think the data given to the neys
media by the state department should be presented in such a
way that comparisons between schools can be made?", 27 per
cent of superintendents answered "definitely" or "to some
extent" and 64 pex cent answered "not at all." In teachers'
response to the same question, 44 per cent responded
"definitely" or "to some extent," while 38.5 per cent
responded "not at all." Baldassare (7) stated that news-
paper articles contributed significantly to the controversy
surrounding the Pennsylvania statewide assessment program,

47
and he states that newspaper articles contributed signifi-
cantly to the criticism of state assessment programs on a
national basis.
Roeber, Donovan, and Cole (55), in reporting on a
Michigan study, asked,
How can a state agency release statewide testing results without damaging a local district's position within the community? . . . Each year the release of statewide test results triggered almost simultaneous reports in newspapers across Michigan. Articles with neat "box scores" compared•black to white districts, rich to poor. With increasing regularity, it seemed, such comparisons triggered outcries from teachers and administrators (55, p. 273).
The literature contains limited studies in which people
are asked to suggest improvements in statewide testing pro-
grams. In Nevada, Horn (29) framed a question, "Competency
testing in Nevada would be better if . . ." The most
frequent answer dealt with the need for a Nevada test made
by Nevadans for Nevadans with specific teacher input. Other
answers concerned the tests being used to threaten, pressure,
and harass teachers, the test being used for diagnostic
purposes, and the tests being constructed locally. In his
study of the Mississippi statewide testing program, Prince
"(50) made the following recommendations for improvement. "•"*
1. The practicality of state-developed achievement tests should be investigated.
2. Test items should be based on specific curricular offerings of Mississippi schools.
3. Item analysis should be made available to each school for diagnostic purposes.
4. The assessment should cover all twelve grades of all school districts.
5. Random sampling should be considered.

48
6. Background information on students should be used to distribute non-school effects on student scores.
7. Representative but different samples of a school population should be sampled each year.
8. Independent test monitors should be used.
9. Adequate funds should be provided (50, p. 83).
Cooley (16) asked how the public relations aspect of the
Louisiana State Assessment Program could be improved.
Superintendents responded as follows: 36 per cent said
"Better handling-of test data"; 27.3 per cent said "Better
communication" and 18.1 per cent said "Positive attitude
by media." Teachers responded to the same question as
follows: 40 per cent said "Positive attitudes by media";
40 per cent said "Involving parents in the process"; and
11 per cent said "Better communication" (16, p. 77).

CHAPTER BIBLIOGRAPHY
1. Ahraann, Stanley, How Much Are Our Young People Learning? The Story of the National Assessment^ Phi Delta Kappa Fastback Number 68, Phi Delta Kappa Educa-tional Foundation, Bloomington, Indiana, 1976
2. Alaska Department of Education, "Alaska Statewide Assess-ment: A Comparison of the 1977 and 1979 Results," Juneau, 1980.
3. Associated Press, "AEA Hits Lack of Data," Arkansas Gazette, September 6, 1981, 1A, 4A.
"Educators Blame Economic Attitudes," Arkansas Gazette, September 6, 1981, 1A, 4A
"Ruling Upholds Skills Test Used in Florida Schools; Bias Argument Reported," Arkansas Gazette, May 5, 1983, 1A.
6. Atkinson, Donald R., "State Mandated Minimum Competency Testing Programs: Implications for School Counsel-ors," The School Counselor, 29 (September, 1981), 22-27.
7. Baldassare, Louis J., "Overt Controversies about Pennsylvania's Educational Quality Assessment Pro-gram," unpublished doctoral dissertation, College of Education, University of Pittsburgh, Pittsburgh, Pennsylvania, 1978.
8. Barnes, Ronald E., Karen Moriarty, and John Murphy, "Reporting Test Results: The Missing Key in Most Testing Programs," National Association of Secondary School Principals Bulletin, 66 (November, 1982), 14-20. *
9. Beckham, Joseph, Legal Implications of Minimum Competency Testing, Phi Delta Kappa Fastback Number 138, Phi Delta Kappa Educational Foundation, Bloomington, Indiana, 1980.
10. Bracey, Gerald W., "On the Compelling Need to go Beyond Minimum Competency," paper presented at the annual NAEP Conference on Large Scale Assessment, Boulder, Colorado, June 8, 1982.
49

50
11. Brown, William J., "Considerations in Conducting Large-Scale Writing Assessments as Part of Minimum Com-petency Testing," North Carolina Department of Public Instruction, Raleigh, North Carolina, April, 1982.
12. Brunton, Max L., "Is Competency Testing Accomplishing any Breakthrough in Achievement?," paper presented at the annual meeting of the Association for Supervisors and Curriculum Development, Anaheim, California, March 20-23, 1982.
13. Coburn, Terrence G., "Statewide Assessment and Curriculum Planning: One State's Experience," Arithmetic Teacher, 27 (November, 1979), 14-20.
14. Cole, Robert W., "A New Recipe for a Kettle of Fish," Phi Delta Kappan, 62 (May, 1981), 618.
15. Cook, Ann, Herb Mack and Deborah Neier, "New York's Great Reading Score Scandal," The National Elementary Principal, 59 (January, 1980), 77-80.
16. Cooley, Carl, "Perceptions of the Louisiana State Assess-ment Program by Superintendents, Principals, and Teachers," unpublished doctoral dissertation, North Texas State University, Denton, Texas, 1981.
17. Dowdy, Betty J., "Is the BEST Always the Best?," School and Community, 67 (October, 1980), 16-17, 59.
18. Ebel, Robert, The Uses of Standardized Testing, Phi' Delta Kappa Fastback Number 93, The Phi Delta Kappa Educational Foundation, Bloomington, Indiana, 1977.
19. Edelman, Joyce, "The Impact of the Mandated Testing Program on Classroom Practices: Teacher Perspec-tives," Education, 1002 (Fall, 1981), 56-59.
20. Elford^ George, "A Review of Policy Issues Related to Competency Testing for High School Graduation," paper presented at the annual meeting of the New England Educational Research Organization, Man-chester, New Hampshire, May 4-7, 1977.
21. Finn, Chester E., "A Call for Quality Education," American Renewal, Time, Inc., Chicago, Reprint from Life Magazine, March, 1981.
22. Fulk, Marion, "White Affluent Girls Achieve Best Test Scores," Arkansas Gazette, July 29, 1982.
51
23. Gillespie, Ellen B., "Implications of the Louisiana Basic Skills Test for Special Education Students," paper presented at the annual meeting of the American Educational Research Association and the National Council on Measurement in Education. New York, 1982.
24. Glasman, Naftaly S., "State Perceptions on State-Wide Evaluation in California," paper presented at the annual meeting of the National Conference of Pro-fessors of Educational Administration, Seattle, Washington, August 16-21, 1981.
25. Gorce, Martin J., "Competency—Based Testing: Some Results," NCA Quarterly, 57 (Winter, 1983), 370-375. "
26. Gorth, William P. and Mary R. Perkins, "A Study of Minimum Competency Testing Programs. Final Summary and Analysis Report," National Evaluation Systems, Inc., Amherst, Massachusetts.
27. Greene, Leroy F., "The State Assessment Question—An Answer," Compact, 11 (Summer, 1977), 5-8.
28. Hopkins, Jennifer, ". . . County Test Scores Create Stir: Not Gauge of Education, Officials Say," Arkansas Gazette, November 1, 1981, 16A.
29. Horn, Nicholas J., "Competency Based Testing in Nevada: Perceptions of Legislators, School District Super-intendents, Local School Board Presidents, and ' Third-Grade Teachers," unpublished doctoral disser-tation, University of Nevada, Las Vegas, August, 1980.
30. Impara, James C., "Valid and Invalid Uses of Statewide Assessment," Educational Technology, 18 (September, 1978), 5-9.
31. Jo'TmsorT, Maryanne, "An Analysis of Administrator Per-ceptions of Mandatory Evaluation Programs in Elementary and Secondary Schools," unpublished doctoral dissertation, College of Education, Washing-ton State University, Pullman, Washington.
32. Madaus, George F., "NIE Clarification Hearing: The Negative Team's Case," Phi Delta Kappan, 63 (October, 1981), 92-94.

52
33. McCampbell, Duane, "Merit Pay: Reward for Teachers or Scapegoat for Politicians," Searcy Daily Citizen, Searcy, Arkansas, June 21, 1983, p. 4.
34. Mizell, M. Hayes, "Parents'/Advocates' Strategies to Assure the Appropriate Use of Tests in Public Elementary and Secondary Schools," ERIC Document ED 195 55G.
35. Naisbitt, John, Megatrends, New York, Warner Books, Inc.. 1982.
36. National Commission on Excellence in Education, "A Nation at Risk," April, 1983.
37. New York State Education Department, "A Report to the Board of Regents on the Basic Competency Testing Program," Albany Division of Educational Testing, May, 1978.
38. North Carolina State Department of Public Instruction, "Report of Student Performance, 197 8," North Carolina Competency Test Program, Raleigh, North Carolina, 1978.
39. Owen, David, "1983 The Last Days of ETS," Harpers, 266 (May, 1983), 21-35.
40. Palmer, Princess, Sande Milton, and Linda Fears, "Florida's Minimum Competency Program: A Survey of Teachers' Opinions," The High School Journal, 66 (December, 1982-January, 1983), 104-109.
41. Parnell, Dole, The Case for Competency Based Education, Phi Delta Kappa Fastback Number 118, The Phi Delta Kappa Educational Foundation, Bloomington,•Indiana, 1978.
42. Parramore, Barbara M. and others, "Effects of Mandatory Competency Testing in North Carolina: The Class of 1980," paper presented at the annual-meeting of the Evaluation Research Society, Washington, D. C., November 19-22, 1980.
43. Pechman, Ellen, "The Effects of Promotional Testing on a Large City School System," paper presented at the annual meeting of the American Educational Research Association, New York, 1982.
53
44 Peck, Hugh X., Ths Role of Basic Skills Testing in Louisiana," paper presented at the annual meeting of the National Council on Measurement in Education, New York, March 20-22, 1982.
45. Perrone, Vito, The Abuses of Standardized Testing, Phi Delta Kappa Fastback Number 92, Phi Delta Kappa Educational Foundation, Bloomington, Indiana, 1977.
Pipho, Chris, "Variety Marks State Efforts in Testing," phi Delta Kappan, 64 (November, 1982), 157-158.
46,
47. Popham, W. James, "The Case for Minimum Competency Testing," Phi Delta Kappan, 63 (October, 1981). 89-91.
48. Popham, W. James and Elaine Lindheim, "Implications of a Landmark Ruling in Florida's Minimum Competency Test," Phi Delta Kappan, 63 (September, 1981), 18-20.
, "Minimum Competency Tests Spur Instructional Improvement," Phi Delta Kappan, 62 (May, 1981), 637-639.
50. Prince, Julian D., "A Study of the Mississippi Educa-tional Assessment Program as Operated by the Mississippi State Department of Education During the 1977-1978 Academic Years," University of Mississippi, 1980.
51. Pullin, Diana, "Minimum Competency Testing and the Demand for Accountability," Phi Delta Kappan, 63 (September, 1981), 20-22.
52. Ramsbotham, Ann and others, "The Status of Minimum Competency Programs in Twelve Southern States: A Report of the Southwestern Public Education Program," Southwestern Public Education Program, Jackson, Mississippi, April, 1980.
53. Riegel, Rodney P. arid Ned B. Lovell, Minimum Competency Testing, Phi Delta Kappa Fastback Number 137, Phi Delta Kappa Educational Foundation, Bloomington, Indiana, 1980.
54. Roeber, Edward D., "Teaching Local Educators to Use and Report State Assessment Results," ERIC Document ED 211 570, 1980.
54
55. Roeber, Edward D., David L. Donovan, and Richard T. Cole, "Telling the Statewide Testing Story and Living to Tell it Again," Phi Delta Kappan,*62 (December, 1980), 273-274.
56. Rosenthal, Alan and Susan Fuhrraan, "State Legislatures and Educational Policy: An Overview," Educational Horizons, 61 (Fall, 1982), 4-9. ~
57. Rudman, Herbert C., "Uses and Abuses of Standardized Testing, paper delivered at annual meeting of North Central Association of Colleges and Schools, Chicago, Illinois, March 23, 1983.
58. Sebring, Penny A. and Robert F. Boruch, "Beyond the Use of NAEP: Lessons for Increasing the Use of State and Local Assessment Results," paper presented at the National Assessment of Educational Progress Conference on Large Scale Assessment, Boulder, Colorado, June 7-10, 1982.
59. Serow, Robert C. and James J. D.vies, "Resources and Outcomes of Minimum Competency Testing as Measures of Equality-of Educational Opportunity," American Educational Research Journal, 19 (Winter, 1982) , 529-539.
60. Smith, Doug, "The Plan: Is Test Score or Learning Fore-most?," Arkansas Gazette, May 10, 1981, IF, 2F.
61. Thurston, Paul and Ernest House, "The NIE Adversary Hearing on Minimum Competency Tksting," Phi Delta Kappan, 63 (October, 1981), 87-89.
62. Wall, Janet and William J. Geppert, "Initiating School Change Through a Statewide Testing Program in Mathe-matics," School Science and Mathematics, 81 (Januarv. 1981), 51^4:
63. Walters, Judy Ann J'An Analysis of the Attitudes of Selected Public School Educators in Tennessee Toward Minimum Competency Testing," unpublished doctoral dissertation, College of Education, East Tennessee State University, Johnson City, Tennessee, 1980.
64. Walton, Susan and Thomas Toch, "Competency Tests Linked to Decline in Analytic Skills," Education Week, 1 (December 8, 1982), 1, 17.
CHAPTER III
PROCEDURES OF THE STUDY
A questionnaire was developed to examine the perceptions
of state legislators, superintendents, and fourth-grade
teachers toward the Arkansas Student Assessment Program. The
survey items were developed from the review of the related
literature. Items which seemed to be of most significance
nationally and items which seemed to be particularly pertinent
to the statewide testing program in Arkansas were included in
the questionnaire. The questionnaire was then presented to
the doctoral advisory committee, the Arkansas State Department
of Education, the Speaker of the Arkansas House of Representa-
tives, and the president of the Arkansas State Board of Educa-
tion for suggestions and corrections. After the questionnaire
was refined, it was field tested, using a committee of three
school superintendents, three fourth-grade teachers, and three
state legislators.
~ -frfter further refinement, the questionnaire was then _
mailed to all legislators, superintendents, and teachers
selected for the study. The questionnaire was mailed first
class and included a stamped, addressed return envelope. Two
weeks later, a follow-up letter and a second questionnaire
were mailed to those who did not respond; and two weeks later
55
56
another follow-up letter and questionnaire were mailed to
those who did not respond. A 70 per cent response was .
received from superintendents (N = 70), 74 per cent from
teachers (N = 74), and a 50 per cent response from legisla-
tors (N = 67) .
The Arkansas Department of Education collects informa-
tion on ADA (Average Daily Attendance) from every school
district in the state. The ADA was taken from state depart-
ment records and recorded for the 100 schools chosen for the
study.
The Population
The population for this study consisted of all super-
intendents and all fourth-grade teachers in Arkansas public
schools. Fourth-grade teachers were chosen because that is
the grade in which the norm referenced test is administered
each year; these are the scores which the media publishes
each spring. The population for this study also included
all Arkansas state legislators.
Selection of the Samples
Of the 372 public school districts j_n Arkansas, 100
were selected for this study. Each school district was
assigned a number, and a table of random numbers was used
to select the 100 participating districts. The superinten-
dents from each of the 100 school districts was included in

57
the sample. In school districts which have more than one
fourth-grade teacher, each teacher was assigned a number and
a table of random numbers was used to select the teacher to
be included in the sample. Superintendents are listed in a
publication of the Arkansas Department of Education, and the
Department furnished the names of fourth-grade teachers in
the schools selected for the study. The entire population
of the Arkansas State Legislature was included in this study.
Procedure for Analysis of Data
Respondents answered the first thirty-five questions
"agree," "uncertain," and "disagree"; the last five questions
were answered "yes," "uncertain," and "no." In analyzing
responses to individual questions, the "uncertain" answers
were disregarded, and the chi-square statistic was applied to
the data to determine if significant differences existed
between the groups on each question. The .05 level of sig-
nificance was used.
In order to test the hypotheses, the responses which
related to each hypothesis were grouped, and the "uncertain"
responses were included. In scoring ragfoases to Hypotheses
1, 8a, and 9a, "yes" answers were given a value of 3;
"uncertain" answers were assigned a value of 2; and "no"
answers were given a value of 1. In scoring responses to
questions which pertain to the remainder of the hypotheses,
responses which were positive toward the Arkansas Student
58
Assessment Program as it now exists were given a score of 3;
responses marked "uncertain" were given a score of 2; and
responses which were negative toward the present program, or
which indicated a need for change, were given a value of 1.
A total score was then computed for each individual on each
hypothesis. A Kruskal-Wallis one—way analysis of variance
by ranks was applied to the data for each hypothesis. The
.05 level of confidence was used to determine significance
of difference between the groups.
CHAPTER IV
PRESENTATION AND ANALYSIS OF DATA
The presentation and analysis of data is divided into
the following divisions: (1) analysis of each item as
answered by legislators, superintendents, and teachers,
(2) hypotheses related to legislators, superintendents, and
teachers, (3) analysis of each item as answered by large-
school and small-school superintendents, (4) hypotheses
related to large-school and small=school superintendents,
(5) analysis of each- item as answered by large-school and
small-school teachers, and (6) hypotheses related to large-
school and small-school teachers.
• In this study Arkansas state legislators, superintendents,
and fourth-grade teachers were surveyed to determine the'ir
attitudes toward the Arkansas statewide testing program. A
questionnaire was mailed to all state legislators and to a
random sample of 100 public school superintendents and fourth-
grade teacE'ersResponses were received from 7 0 (70 per cemt)
superintendents, 74 (74 per cent) teachers and 67 (50 per
cent) legislators.
Analysis of Each Item as Answered by Legislators, Superintendents, and Teachers
The first item on the questionnaire stated, "Results of
the Arkansas Student Assessment Program are being used
59
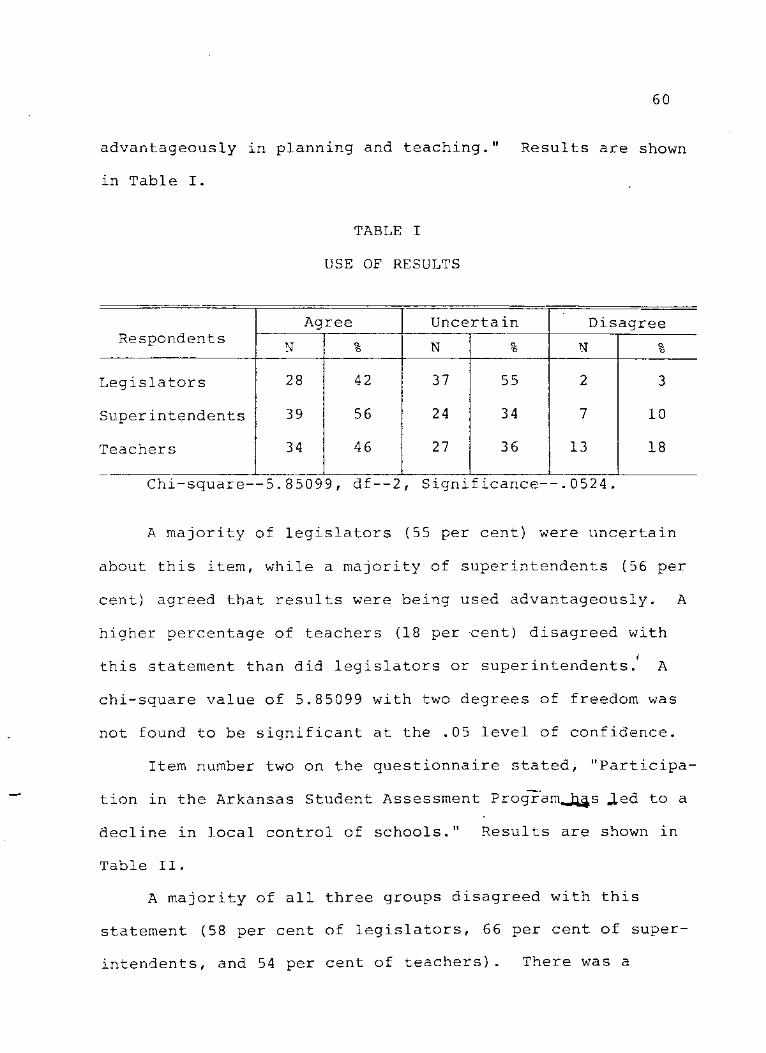
60
advantageously in planning and teaching." Results are shown
in Table I.
TABLE I
USE OF RESULTS
Respondents Agree Uncertain Disagree
Respondents N % N % N %
Legislators 28 42 37 55 2 3
Superintendents 39 56 24 34 7 10
Teachers 34 46 27 36 13 18
Chi-square--5 . 85099 , df—2, Significance--.0524.
A majority of legislators (55 per cent) were uncertain
about this item, while a majority of superintendents (56 per
cent) agreed that results were being used advantageously. A
higher percentage of teachers (18 per -cent) disagreed with
this statement than did legislators or superintendents/ A
chi-square value of 5.85099 with two degrees of freedom was
not found to be significant at the .05 level of confidence.
Item number two on the questionnaire stated, "Participa-
tion in the Arkansas Student Assessment Program Jr^s Jed to a
decline in local control of schools." Results are shown in
Table II.
A majority of all three groups disagreed with this
statement (58 per cent of legislators, 66 per cent of super-
intendents, and 54 per cent of teachers). There was a
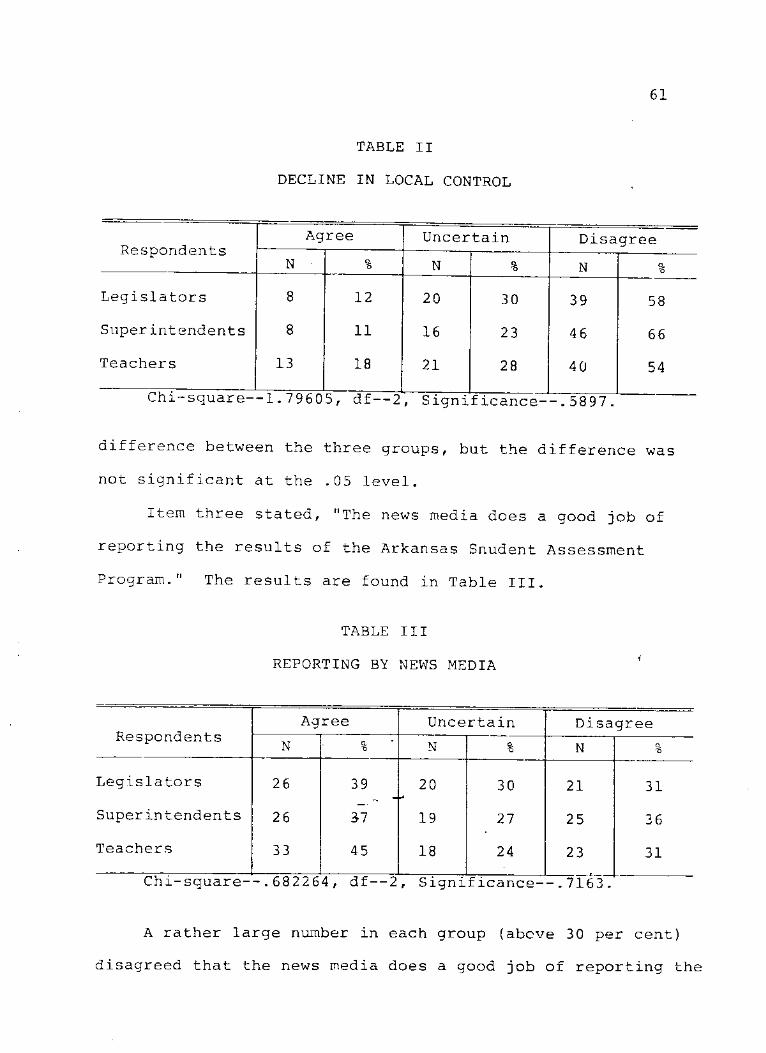
TABLE II
DECLINE IN LOCAL CONTROL
61
Respondents Agree Uncertain Disagree
Respondents N % N % N g. "o
Legislators 8 12 20 30 39 58
Superintendents 8 11 16 23 46 66
Teachers 13 18 21 28 40 54
Chi-square—1.79605, df—2, Significance--.5897
difference between the three groups, but the difference was
not significant at the .05 level.
Item three stated, "The news media does a good job of
reporting the results of the Arkansas Snudent Assessment
Program." The results are found in Table III.
TABLE III
REPORTING BY NEWS MEDIA '
Respondents Agree Uncertain Disagree
Respondents N % ' N % N o
"o
Legislators 26 39 20 30 21 31
Superintendents 26 37 19 27 25 36
Teachers 33 45 18 24 23 31
Chi-square--.682264, df—2, Significance--.7163
A rather large number in each group (above 30 per cent)
disagreed that the news media does a good job of reporting the

62
results. The difference between the three groups was not
significant at the .05 level of confidence. More teachers
(45 per cent) than either legislators or superintendents
agreed that the news media does a good job of reporting
results.
Item 4 states, "The level of difficulty of the Arkansas
Student Assessment Program tests is too easy." Responses to
question 4 are found in Table IV.
TABLE IV
LEVEL OF DIFFICULTY TOO EASY
-7.85814, df—2
Respondents Agree Unce rtain j Disagree
Respondents N % N a
"6 ! N O. "O
Legislators 6 9 4 8 7 2 13 1 9
Superintendents 3 4 2 3 33 4 4 63
Teachers 7 9 1 4 1 9 53 7 2 <
, Significance—.0194
Teachers overwhelmingly disagreed with this statement
(72 per cent); superintendents also disagreed (63 per cent);
while a large majority of legislators (72 per cent) were
uncertain. The difference between the groups was signifi-
cant at the .0194 level.
Item 5 states, "In a large majority of schools the
Arkansas Student Assessment Program is administered fairly."
Results are shown in Table V.
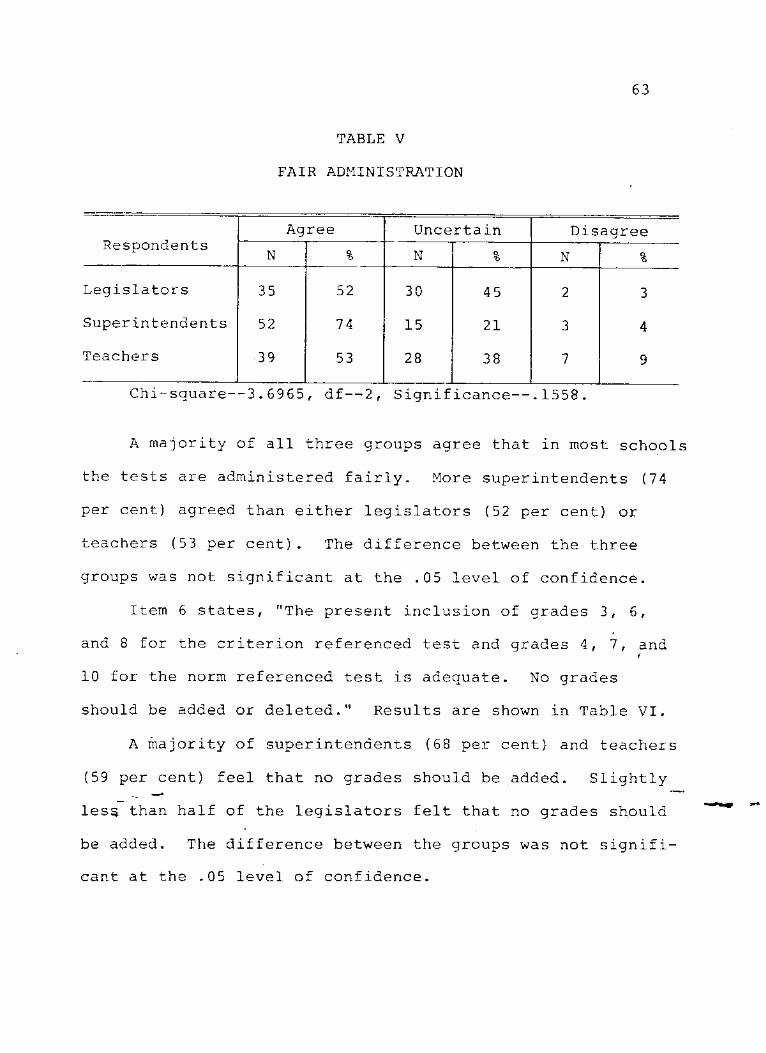
TABLE V
FAIR ADMINISTRATION
63
Respondents Agree Uncertain Disagree
Respondents N % N % N %
Legislators 35 52 30 45 2 3
Superintendents 52 74 15 21 3 4
Teachers 39 53 28 38 7 9
Chi-square—3.6965, df--2, Significance—.1558.
A majority of all three groups agree that in most schools
the tests are administered fairly. More superintendents (74
per cent) agreed than either legislators (52 per cent) or
teachers (53 per cent). The difference between the three
groups was not significant at the .05 level of confidence.
Item 6 states, "The present inclusion of grades 3, 6,
and 8 for the criterion referenced test and grades 4, 7, and i
10 for the norm referenced test is adequate. No grades
should be added or deleted." Results are shown in Table VI.
A majority of superintendents (68 per cent) and teachers
(59 per cent) feel that no grades should be added. Slightly
less than half of the legislators felt that no grades should
be added. The difference between the groups was not signifi-
cant at the .05 level of confidence.
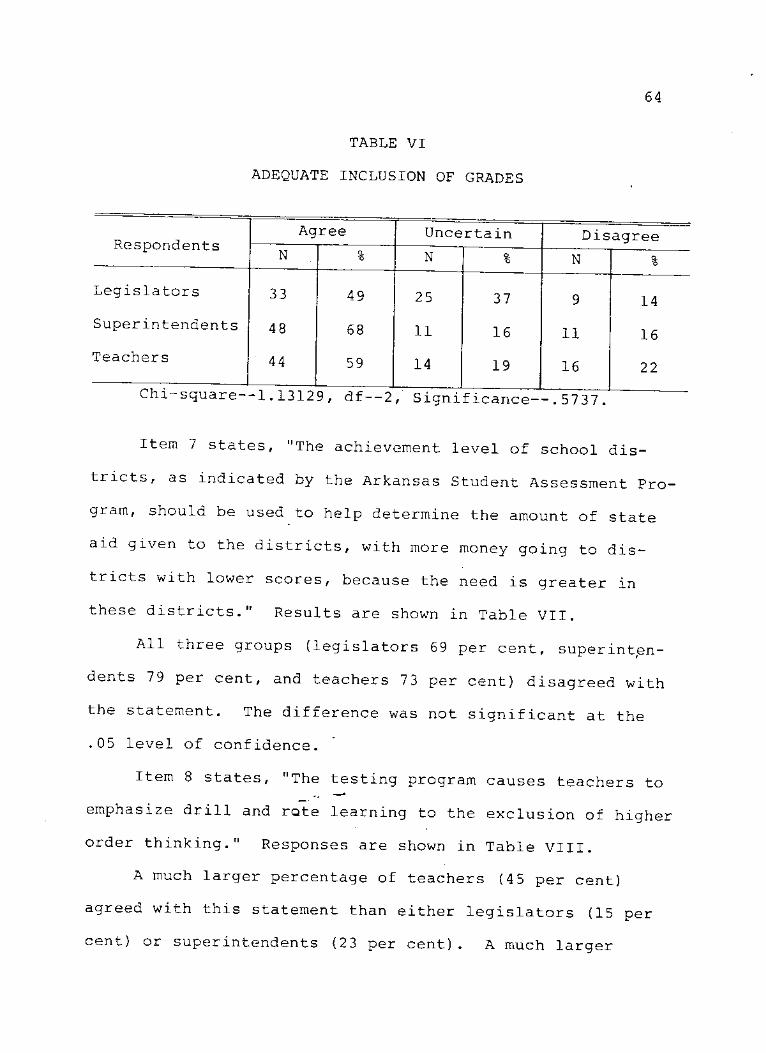
64
TABLE VI
ADEQUATE INCLUSION OF GRADES
Respondents
Legislators
Superintendents
Teachers
Agree
N
33
48
44
49
68
59
Uncertain
N
25
11
14
37
16
19
Disagree
N
9
11
16
14
16
22
Chi-square—1.13129, df—2, Significance—.5737.
Item 7 states, 'The achievement level of school dis-
tricts, as indicated by the Arkansas Student Assessment Pro-
gram, should be used to help determine the amount of state
aid given to the districts, with more money going to dis-
tricts with lower scores, because the need is greater in
these districts." Results are shown in Table VII.
All three groups (legislators 69 per cent, superinten-
dents 79 per cent, and teachers 73 per cent) disagreed with
the statement. The difference was not significant at the
.05 level of confidence.
Item 8 states, "The testing program causes teachers to
emphasize drill and rote learning to the exclusion of higher
order thinking." Responses are shown in Table VIII.
A much larger percentage of teachers (45 per cent)
agreed with this statement than either legislators (15 per
cent) or superintendents (23 per cent). A much larger
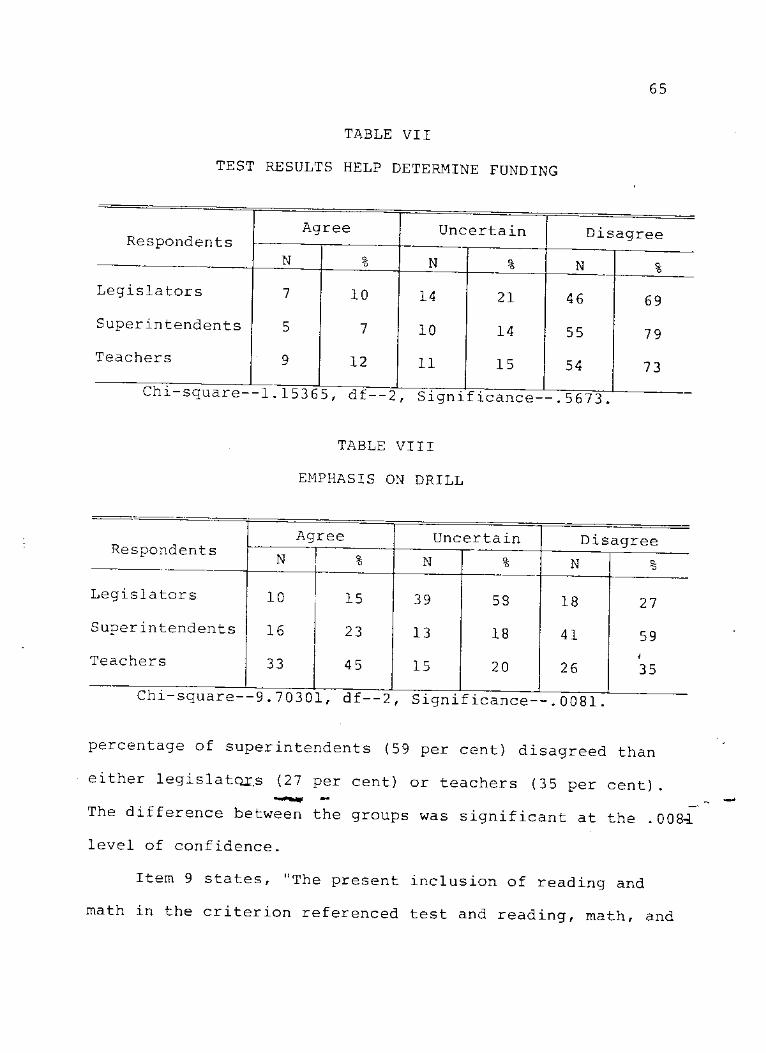
65
TABLE VII
TEST RESULTS HELP DETERMINE FUNDING
Respondents
Legislators
Superintendents
Teachers
Agree
N
7
5
9
10
7
12
Uncertain
N
14
10
11
21
14
15
Disagree
N
46
55
54
Chi square 1.15365, df--2, Significance—.5673.
69
79
73
TABLE VIII
EMPHASIS ON DRILL
Respondents Agree Uncertain Disagree
Respondents N ! % N o
"o N %
Legislators 10 15 39 53 18 27
Superintendents 16 23 13 18 41 59
Teachers 33 45 15 20 26 <
35
Chi square 9.70301, df--2, Significance— 0081,
percentage of superintendents (59 per cent) disagreed than
either legislators (27 per cent) or teachers (35 per cent)
The difference between the groups was significant at the .0084
level of confidence.
Item 9 states, "The present inclusion of reading and
math in the criterion referenced test and reading, math, and
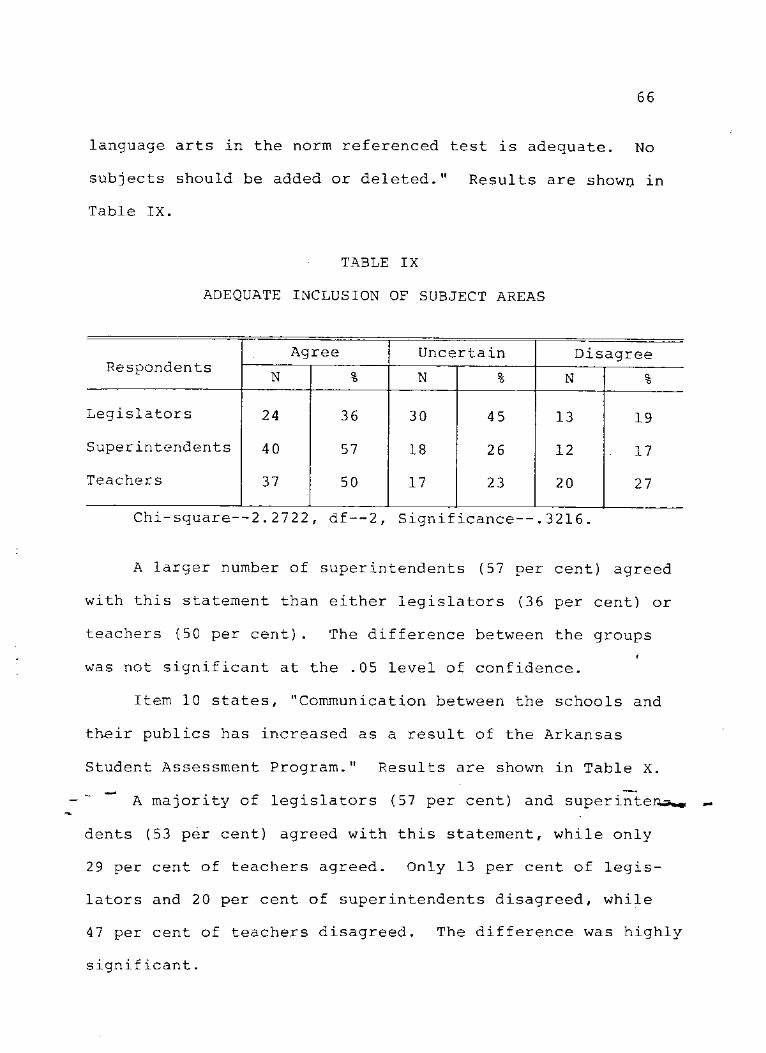
66
language arts in the norm referenced test is adequate. No
subjects should be added or deleted." Results are showrjt in
Table IX.
TABLE IX
ADEQUATE INCLUSION OF SUBJECT AREAS
Respondents Agree Uncertain Disagree
Respondents N % N % N %
Legislators 24 36 30 45 13 19
Superintendents 40 57 18 26 12 17
Teachers 37 50 17 23 20 27
Chi-square--2.2722 , df--2, Significance—.3216.
A larger number of superintendents (57 per cent) agreed
with this statement than either legislators (36 per cent) or
teachers (50 per cent). The difference between the groups
was not significant at the .05 level of confidence.
Item 10 states, "Communication between the schools and
their publics has increased as a result of the Arkansas
Student Assessment Program." Results are shown in Table X.
A majority of legislators (57 per cent) and superintend,
dents (53 per cent) agreed with this statement, while only
29 per cent of teachers agreed. Only 13 per cent of legis-
lators and 20 per cent of superintendents disagreed, while
47 per cent of teachers disagreed. The difference was highly
significant.
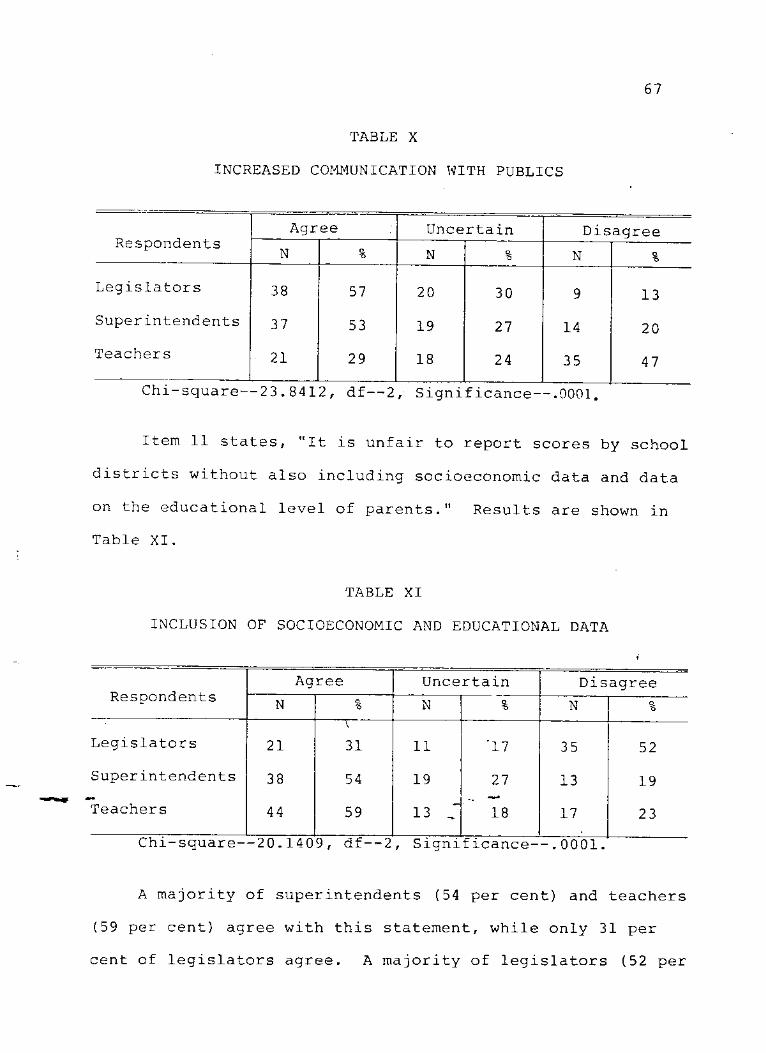
67
TABLE X
INCREASED COMMUNICATION WITH PUBLICS
Respondents Agree Uncertain Disagree
Respondents N % N o
'o N %
Legislators 38 57 20 30 9 13
Superintendents 37 53 19 27 14 20
Teachers 21 29 18 24 35 47
Chi-square--23.8412, df—2, Significance--.0001
Item 11 states, "It is unfair to report scores by school
districts without also including socioeconomic data and data
on the educational level of parents." Results are shown in
Table XI.
TABLE XI
INCLUSION OF SOCIOECONOMIC AND EDUCATIONAL DATA
Respondents Agree Uncertain Disagree
Respondents N o "o N % N g. "o
Legislators 21
V
31 11 '17 35 52
Superintendents 38 54 19 27 13 19
Teachers 44 59 13 -f 18 17 23
Chi-square--20.1409, df--2, Significance--.0001
A majority of superintendents (54 per cent) and teachers
(59 per cent) agree with this statement, while only 31 per
cent of legislators agree. A majority of legislators (52 per
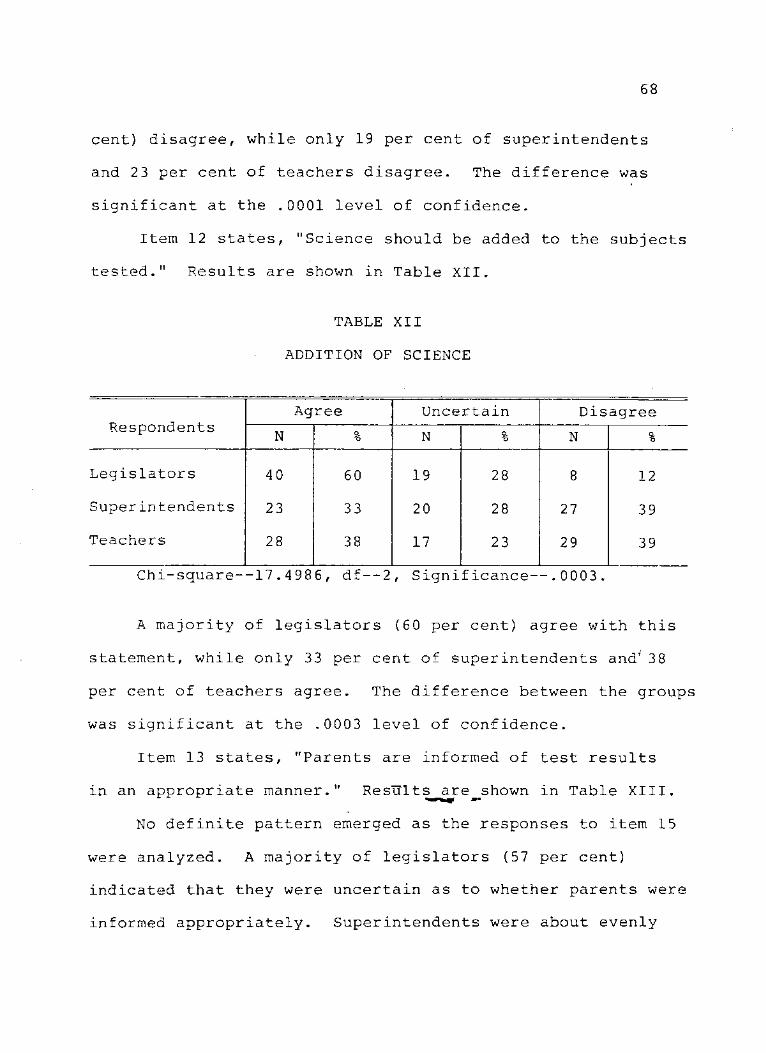
68
cent) disagree, while only 19 per cent of superintendents
and 23 per cent of teachers disagree. The difference was
significant at the .0001 level of confidence.
Item 12 states, "Science should be added to the subjects
tested." Results are shown in Table XII.
TABLE XII
ADDITION OF SCIENCE
Respondents Agree Uncertain Disagree
Respondents N o
*o N % N %
Legislators 40 60 19 28 8 12
Superintendents 23 33 20 28 27 39
Teachers 28 38 17 23 29 39
Chi-square--17.4986, df--2, Significance--.0003,
A majority of legislators (60 per cent) agree with this
statement, while only 33 per cent of superintendents and* 38
per cent of teachers agree. The difference between the groups
was significant at the .0003 level of confidence.
Item 13 states, "Parents are informed of test results
in an appropriate manner." Results^are shown in Table XIII.
No definite pattern emerged as the responses to item 15
were analyzed. A majority of legislators (57 per cent)
indicated that they were uncertain as to whether parents were
informed appropriately. Superintendents were about evenly
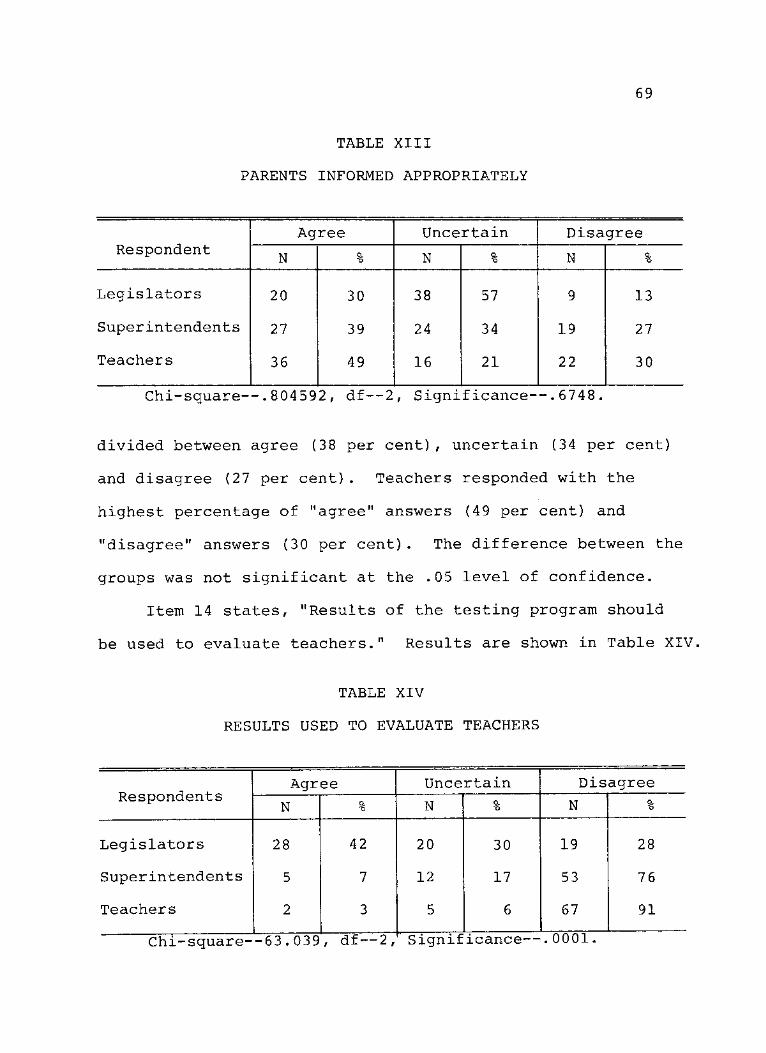
69
TABLE XIII
PARENTS INFORMED APPROPRIATELY
Respondent Agree Uncertain Disagree
Respondent N o. "o N Q. 'O N a
-o
Legislators 20 30 38 57 9 13
Superintendents 27 39 24 34 19 27
Teachers 36 49 16 21 22 30
Chi-square—.804592, df—2, Significance—.6748.
divided between agree (38 per cent), uncertain (34 per cent)
and disagree (27 per cent). Teachers responded with the
highest percentage of "agree" answers (49 per cent) and
"disagree" answers (30 per cent). The difference between the
groups was not significant at the .05 level of confidence.
Item 14 states, "Results of the testing program should
be used to evaluate teachers." Results are shown in Table XIV.
TABLE XIV
RESULTS USED TO EVALUATE TEACHERS
Respondents Agree Uncertain Disagree
Respondents N o,
"o N o. *6 N %
Legislators 28 42 20 30 19 28
Superintendents 5 7 12 17 53 76
Teachers 2 3 5 6 67 91
Chi-square--63.039 , d f — 2 , 'Significance— .0001.
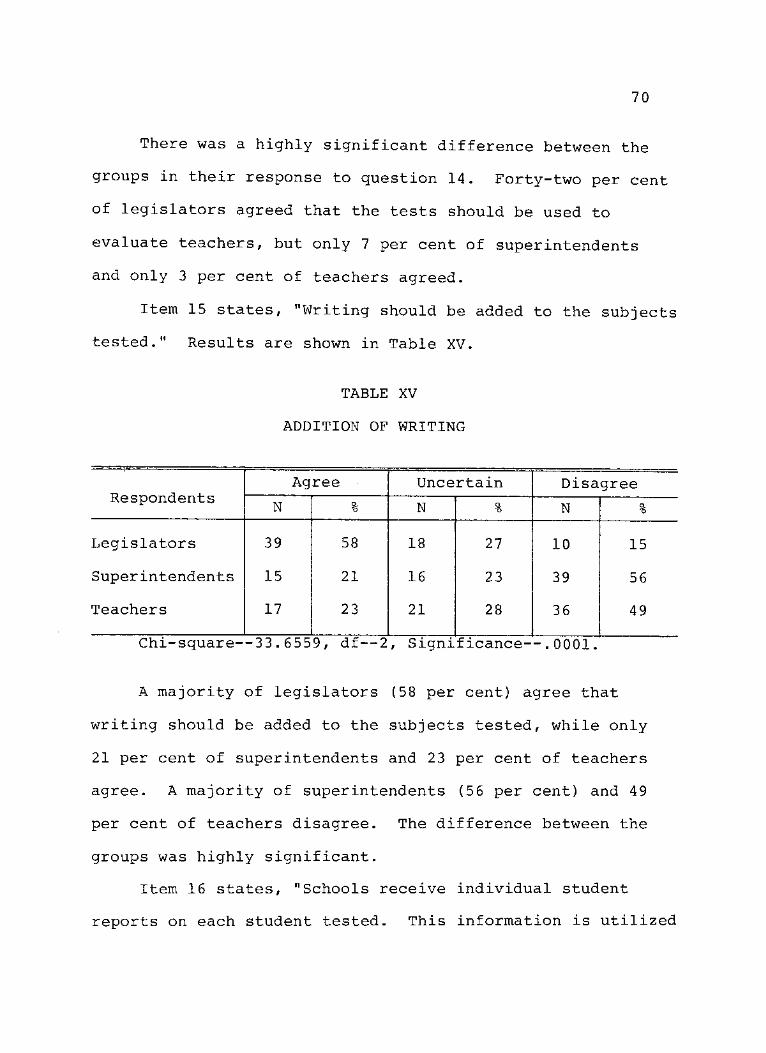
70
There was a highly significant difference between the
groups in their response to question 14. Forty-two per cent
of legislators agreed that the tests should be used to
evaluate teachers, but only 7 per cent of superintendents
and only 3 per cent of teachers agreed.
Item 15 states, "Writing should be added to the subjects
tested." Results are shown in Table XV.
TABLE XV
ADDITION OF WRITING
Respondents Agree Uncertain Disagree
Respondents N a
o N % N o. "o
Legislators 39 58 18 27 10 15
Superintendents 15 21 16 23 39 56
Teachers 17 23 21 28 36 49
Chi-square—33.6559, df—2, Significance—.0001
A majority of legislators (58 per cent) agree that
writing should be added to the subjects tested, while only
21 per cent of superintendents and 23 per cent of teachers
agree. A majority of superintendents (56 per cent) and 49
per cent of teachers disagree. The difference between the
groups was highly significant.
Item 16 states, "Schools receive individual student
reports on each student tested. This information is utilized
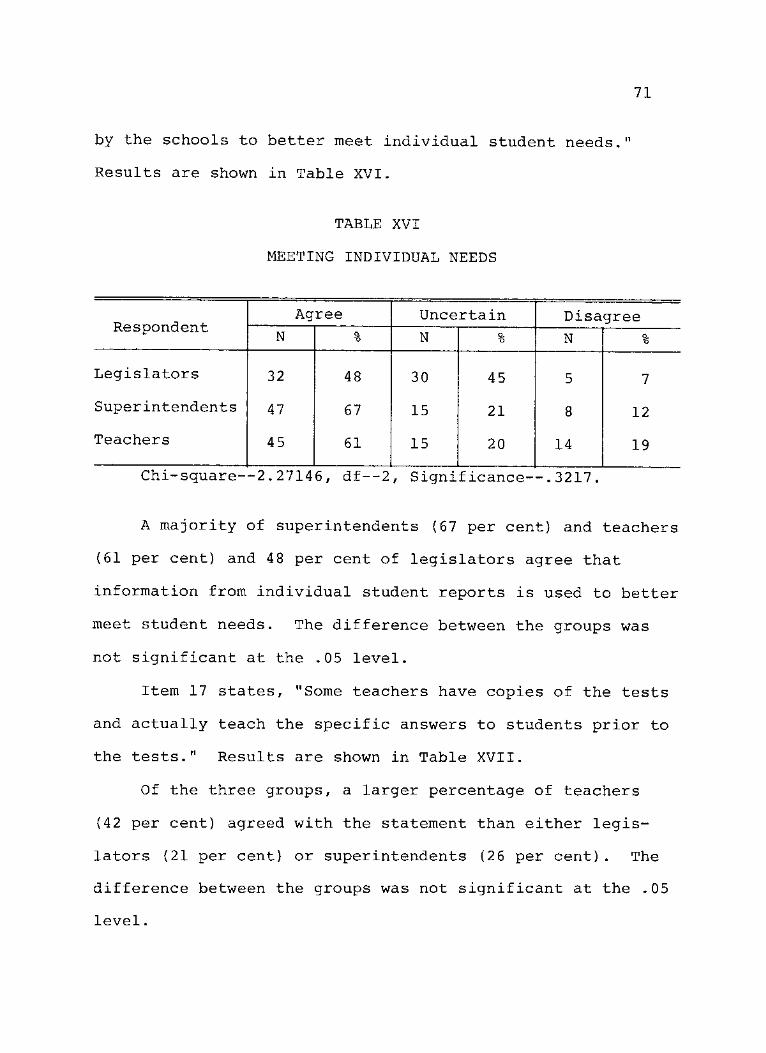
71
by the schools to better meet individual student needs."
Results are shown in Table XVI.
TABLE XVI
MEETING INDIVIDUAL NEEDS
Respondent Agree Uncertain Disagree
Respondent N g. x> N % N Q.
*o
Legislators 32 48 30 45 5 7
Superintendents 47 67 15 21 8 12
Teachers 45 61 15 20 14 19
Chi-square—2.27146, df—2, Significance—.3217.
A majority of superintendents (67 per cent) and teachers
(61 per cent) and 48 per cent of legislators agree that
information from individual student reports is used to better
meet student needs. The difference between the groups was
not significant at the .05 level.
Item 17 states, "Some teachers have copies of the tests
and actually teach the specific answers to students prior to
the tests." Results are shown in Table XVII.
Of the three groups, a larger percentage of teachers
(42 per cent) agreed with the statement than either legis-
lators (21 per cent) or superintendents (26 per cent). The
difference between the groups was not significant at the .05
level.
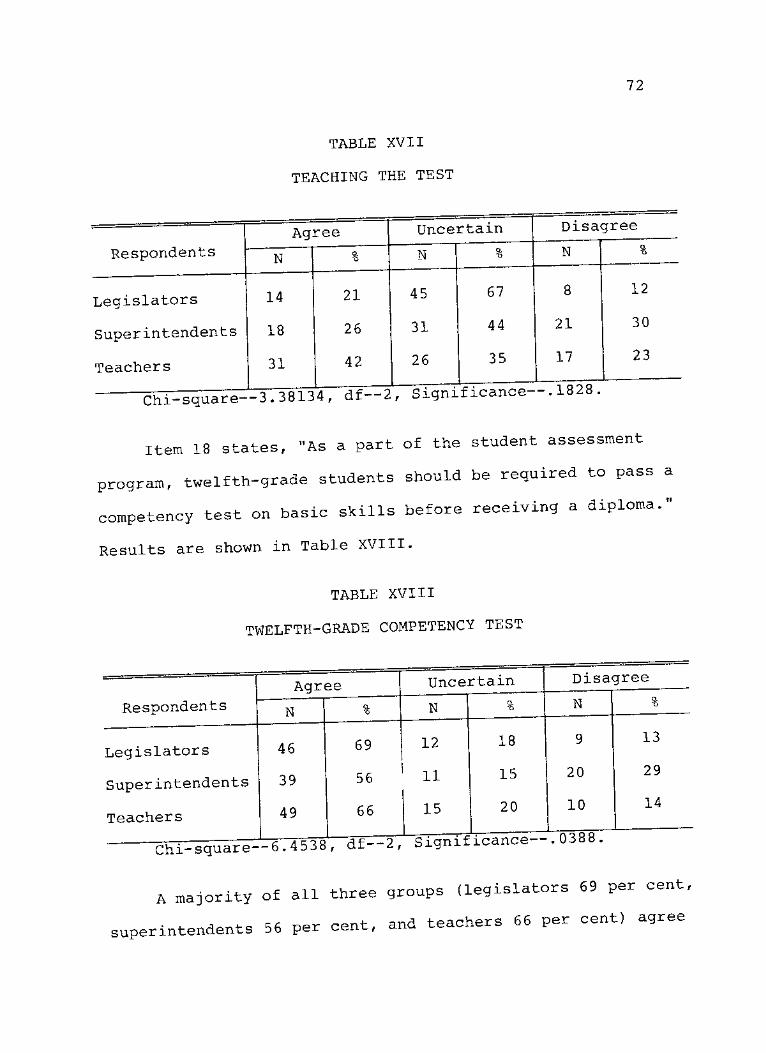
72
TABLE XVII
TEACHING THE TEST
Legislators
Superintendents
Teachers
Chi-square — 3.38134, df~2, Significance—.1828
Item 18 states, "As a part of the student assessment
program, twelfth-grade students should be required to pass a
competency test on basic skills before receiving a diploma."
Results are shown in Table XVIII.
TABLE XVIII
TWELFTH-GRADE COMPETENCY TEST
Respondents
Agree
N
Legislators
Super intendents
Teachers
46
39
49
69
56
66
Uncertain
N
Disagree
12
11
15
18
15
20
N
9
20
10
13
29
14
— 6.4538, df—2, Significance—. u^88 Chi-square
A majority of all three groups (legislators 69 per cent,
superintendents 56 per cent, and teachers 66 per cent) agree
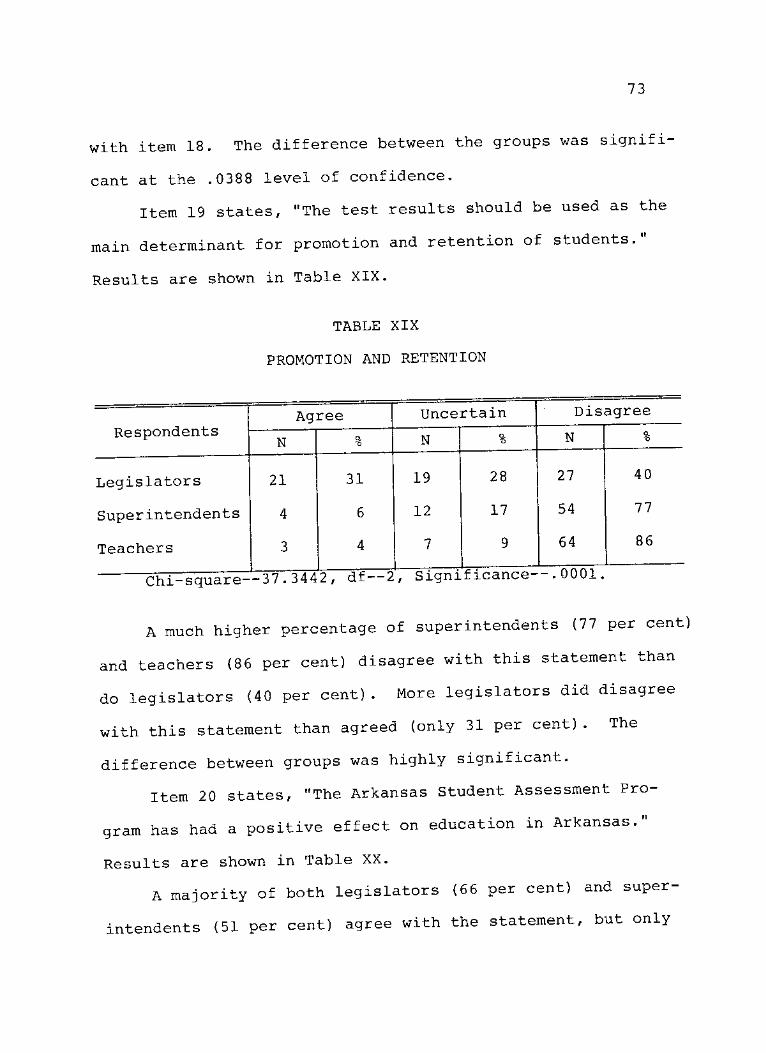
73
with item 18. The difference between the groups was signifi-
cant at the .0388 level of confidence.
Item 19 states, "The test results should be used as the
main determinant for promotion and retention of students.
Results are shown in Table XXX.
TABLE XIX
PROMOTION AND RETENTION
Respondents
Legislators
Superintendents
Teachers
Agree
N
21
4
3
31
6
4
Uncertain
N
19
12
7
28
17
9
Disagree
N
27
54
64
40
77
86
Chi—square—37.3442, df 2, Significance- .0001.
A much higher percentage of superintendents (77 per cent)
and teachers (86 per cent) disagree with this statement than
do legislators (40 per cent). More legislators did disagree
with this statement than agreed (only 31 per cent). The
difference between groups was highly significant.
Item 20 states, "The Arkansas Student Assessment Pro-
gram has had a positive effect on education in Arkansas.
Results are shown in Table XX.
A majority of both legislators (66 per cent) and super-
intendents (51 per cent) agree with the statement, but only
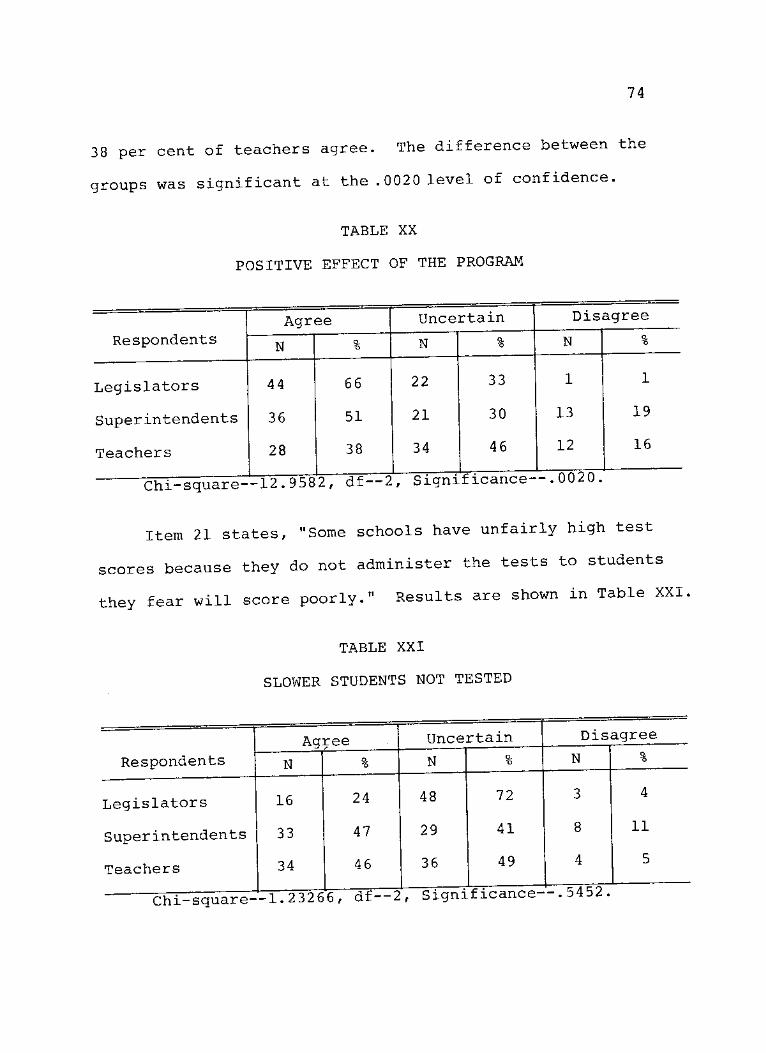
74
38 per cent of teachers agree. The difference between the
groups was significant at the .0020 level of confidence.
TABLE XX
POSITIVE EFFECT OF THE PROGRAM
Respondents
Legislators
Superintendents
Teachers
Agree
N
44
36
28
66
51
38
Uncertain
N
22
21
34
33
30
46
Disagree
N
1
13
12
1
19
16
Chi-square—12.9582, df—2, Significance—. 0020.
Item 21 states, "Some schools have unfairly high test
scores because they do not administer the tests to students
they fear will score poorly." Results are shown in Table XXI.
TABLE XXI
SLOWER STUDENTS NOT TESTED
Respondents Agree Uncertain Dis. agree
Respondents N Q. "o N % N %
Legislators 16 24 48 72 3 4
Superintendents 33 47 29 41 8 11
Teachers 34 46 36 49 4 5
Chi-square--1.23266, dt—2 :, Significance-'•".5452.
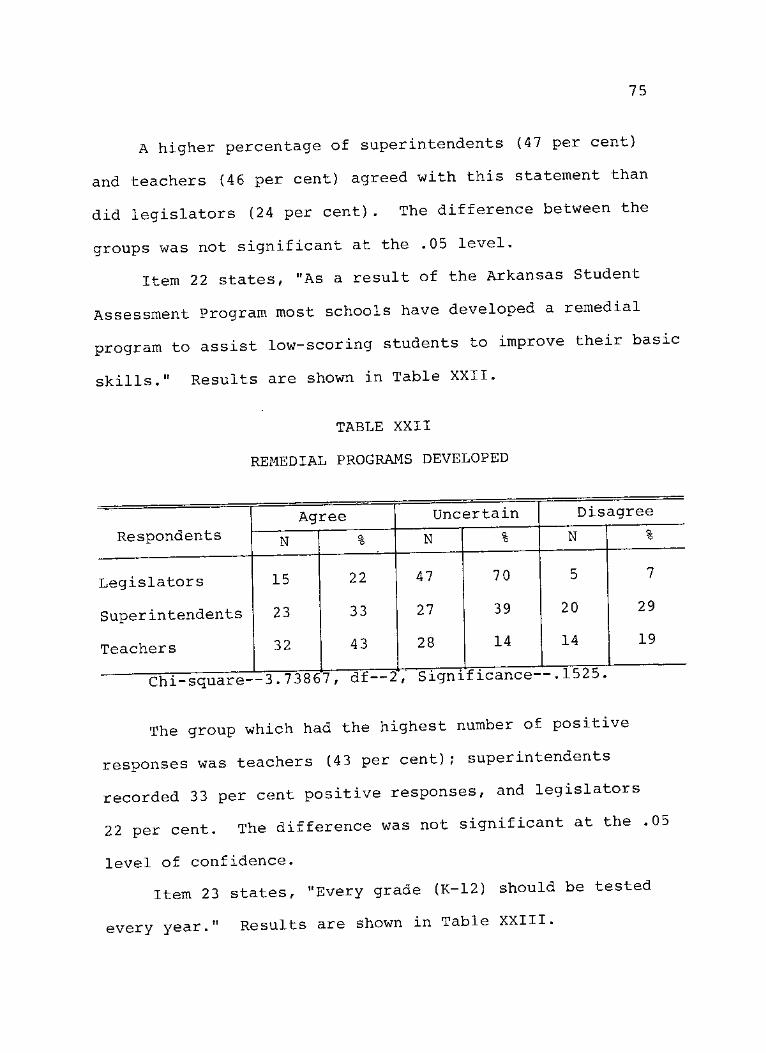
75
A higher percentage of superintendents (47 per cent)
and teachers (46 per cent) agreed with this statement than
did legislators (24 per cent). The difference between the
groups was not significant at the .05 level.
Item 22 states, "As a result of the Arkansas Student
Assessment Program most schools have developed a remedial
program to assist low-scoring students to improve their basic
skills." Results are shown in Table XXII.
TABLE XXII
REMEDIAL PROGRAMS DEVELOPED
Respondents Agree Uncertain Dis. agree
Respondents N o, "o N % N Q.
15
Legislators 15 22 47 70 5 7
Superintendents 23 33 27 39 20 29
Teachers 32
n no c
43
n A -F 9
28
Q i rrn i
14
fi nance-
14
-.1525.
19
The group which had the highest number of positive
responses was teachers (43 per cent); superintendents
recorded 33 per cent positive responses, and legislators
22 per cent. The difference was not significant at the .05
level of confidence.
Item 23 states, "Every grade (K-12) should be tested
every year." Results are shown in Table XXIII.
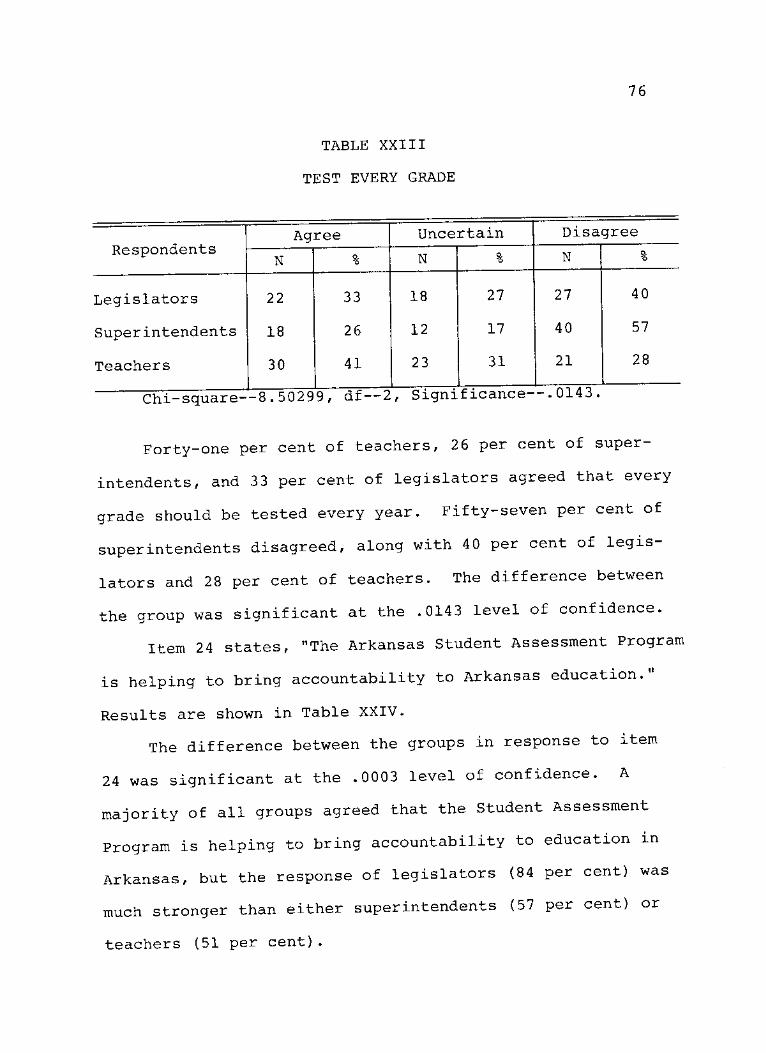
TABLE XXIII
TEST EVERY GRADE
76
Respondents Agree Uncertain Disagree
Respondents N % N O.
*6 N Q. "O
Legislators 22 33 18 27 27 40
Superintendents 18 26 12 17 40 57
Teachers 30 41 23 31 21 28
Chi-square—8.50299/ df—2, Significance .0143.
Forty-one per cent of teachers, 26 per cent of super-
intendents, and 33 per cent of legislators agreed that every
grade should be tested every year. Fifty-seven per cent of
superintendents disagreed, along with 40 per cent of legis-
lators and 28 per cent of teachers. The difference between
the group was significant at the .0143 level of confidence.
Item 24 states, "The Arkansas Student Assessment Program
is helping to bring accountability to Arkansas education."
Results are shown in Table XXIV.
The difference between the groups in response to item
24 was significant at the .0003 level of confidence. A
majority of all groups agreed that the Student Assessment
Program is helping to bring accountability to education in
Arkansas, but the response of legislators (84 per cent) was
much stronger than either superintendents (57 per cent) or
teachers (51 per cent).
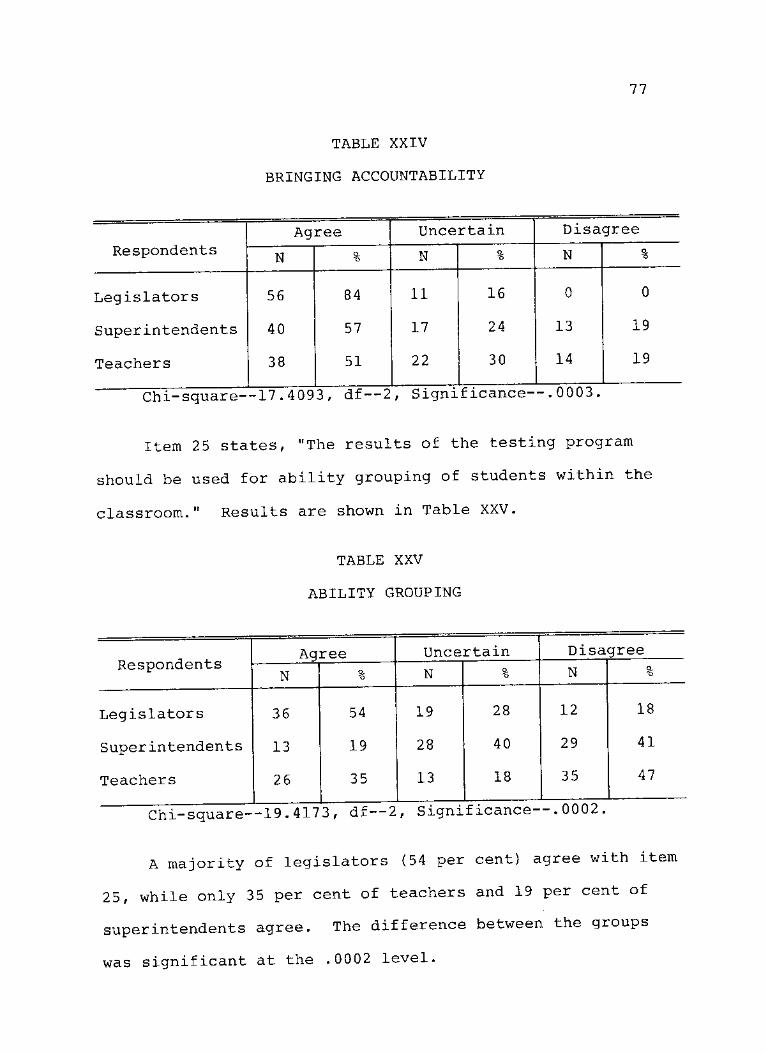
77
TABLE XXIV
BRINGING ACCOUNTABILITY
Respondents Agree Uncertain Disagree
Respondents N o "o N % N %
Legislators 56 84 11 16 0 0
Superintendents 40 57 17 24 13 19
Teachers 38 51 22 30 14 19
Chi-square—17.4093, df—-2, Significance-
Item 25 states, "The results of the testing program
should be used for ability grouping of students within the
classroom." Results are shown in Table XXV.
TABLE XXV
ABILITY GROUPING
Respondents
Legislators
Super intendents
Teachers
Agree
N
36
13
26
54
19
35
Uncertain
N
19
28
13
28
40
18
Disagree
N
12
29
35
18
41
47
Chi-square—19.4173, df—2, Significance—. 0002.
A majority of legislators (54 per cent) agree with item
25, while only 35 per cent of teachers and 19 per cent of
superintendents agree. The difference between the groups
was significant at the .0002 level.

78
Item 26 states, "The SRA (Science Research Associates)
Test, the results of which are published in newspapers, and
which the public often uses to compare achievement in school
districts, should not be given as a part of the Arkansas
Student Assessment Program." Results are shown in Table XXVI
TABLE XXVI
ELIMINATE SRA TEST
Respondents Agree Uncertain Disagree
Respondents N Q. "O N Q, "O N %
Legislators 8 12 32 48 27 40
Superintendents 14 20 18 18 38 54
Teachers 28 38 21 21 25 34
Chi-square—11.0331, df—2, Significance
There was a significant difference (the .0045 level of
confidence) between the three groups in their responses to
item 26. A majority of superintendents (54 per cent) dis-
agree. Thirty-four per cent of teachers disagree that the
SRA Test should not be given, and 40 per cent of legislators
disagree. Only teachers have more who favor discontinuing
the SRA Test than who oppose discontinuation.
Item 27 states, "The news media should not publish
scores so that comparisons between school districts can be
made." Results are shown in Table XXVII.
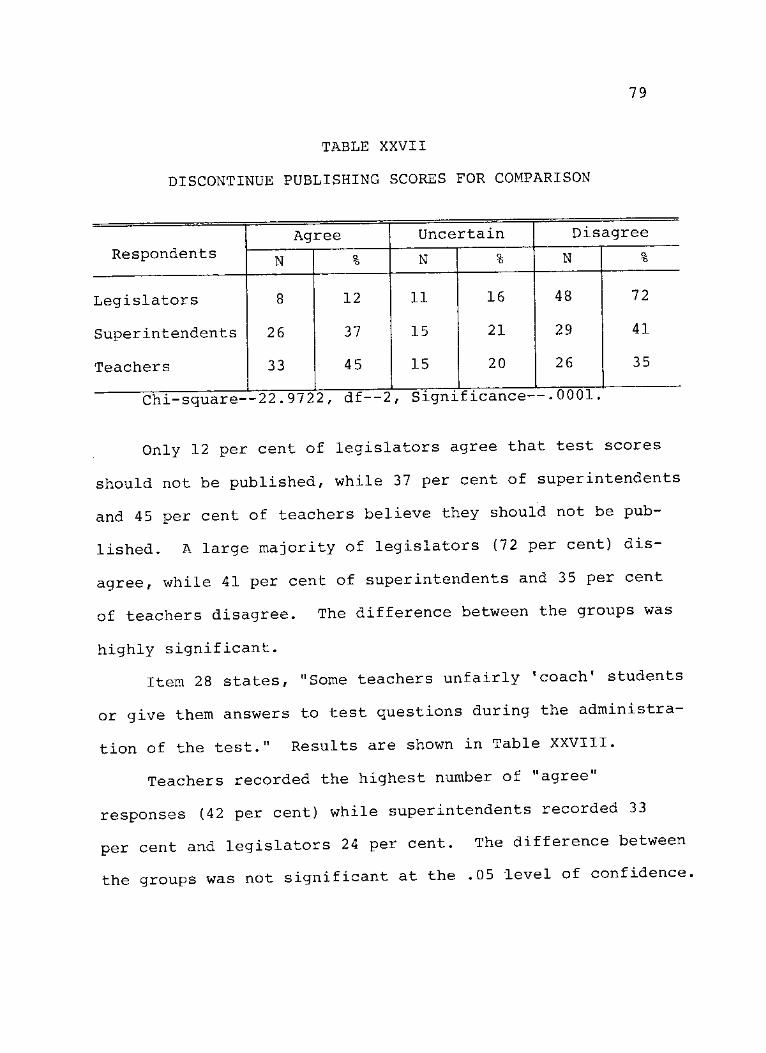
79
TABLE XXVII
DISCONTINUE PUBLISHING SCORES FOR COMPARISON
Respondents Agree Uncertain Disagree
Respondents N o, "o N % N Q. "O
Legislators 8 12 11 16 48 72
Superintendents 26 37 15 21 29 41
Teachers 33 45 1 5
20 26 35
Chi-square—22.9722, df—2, Significance—
Only 12 per cent of legislators agree that test scores
should not be published, while 37 per cent of superintendents
and 45 per cent of teachers believe they should not be pub-
lished. A large majority of legislators (72 per cent) dis-
agree, while 41 per cent of superintendents and 35 per cent
of teachers disagree. The difference between the groups was
highly significant.
Item 28 states, "Some teachers unfairly 'coach' students
or give them answers to test questions during the administra-
tion of the test." Results are shown in Table XXVIII.
Teachers recorded the highest number of "agree"
responses (42 per cent) while superintendents recorded 33
per cent and legislators 24 per cent. The difference between
the groups was not significant at the .05 level of confidence.

80
TABLE XXVIII
COACHING DURING TEST
Respondents Agree Uncertain Disagree
Respondents N Q. N % N a *o
Legislators 16 24 47 70 4 6
Superintendents 23 33 35 50 12 17
Teachers 31 42 42 46 9 12
Chi-square—1.85832, df—2, Significance--
Item 29 states, "The Arkansas Student Assessment Program
Tests are too difficult." Results are shown in Table XXIX.
TABLE XXIX
TESTS ARE TOO DIFFICULT
Respondents Agree Uncertain Disagree
Respondents N % N % N %
Legislators 1 1 28 42 38 57
Superintendents 1 1 17 24 52 74
Teachers 4 5 21 28 49 66
Chi-square—2.47359, df—2, Significance—
A majority of all three groups disagreed with the state-
ment of item 29 that the tests are too difficult. The
largest percentage of "disagree" answers was given by super-
intendents (74 per cent) with teachers (66 per cent) next and
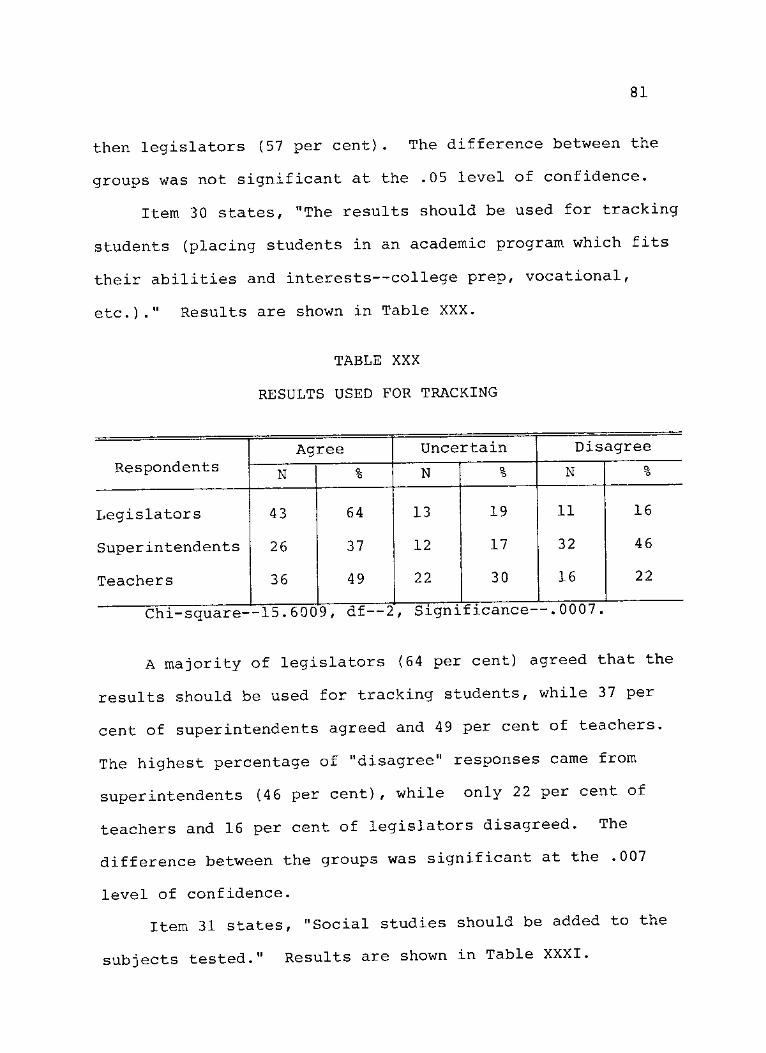
81
then legislators (57 per cent). The difference between the
groups was not significant at the .05 level of confidence.
Item 30 states, "The results should be used for tracking
students (placing students in an academic program which fits
their abilities and interests—college prep, vocational,
etc.)." Results are shown in Table XXX.
TABLE XXX
RESULTS USED FOR TRACKING
Respondents Agree
N
Uncertain
N
Disagree
N
Legislators
Superintendents
Teachers
43
26
36
64
37
49
13
12
22
19
17
30
11
32
16
16
46
22
Chi-square—15.6009, df—2, Significance .0007.
A majority of legislators (64 per cent) agreed that the
results should be used for tracking students, while 37 per
cent of superintendents agreed and 49 per cent of teachers.
The highest percentage of "disagree" responses came from
superintendents (46 per cent), while only 22 per cent of
teachers and 16 per cent of legislators disagreed. The
difference between the groups was significant at the .007
level of confidence.
Item 31 states, "Social studies should be added to the
subjects tested." Results are shown in Table XXXI.
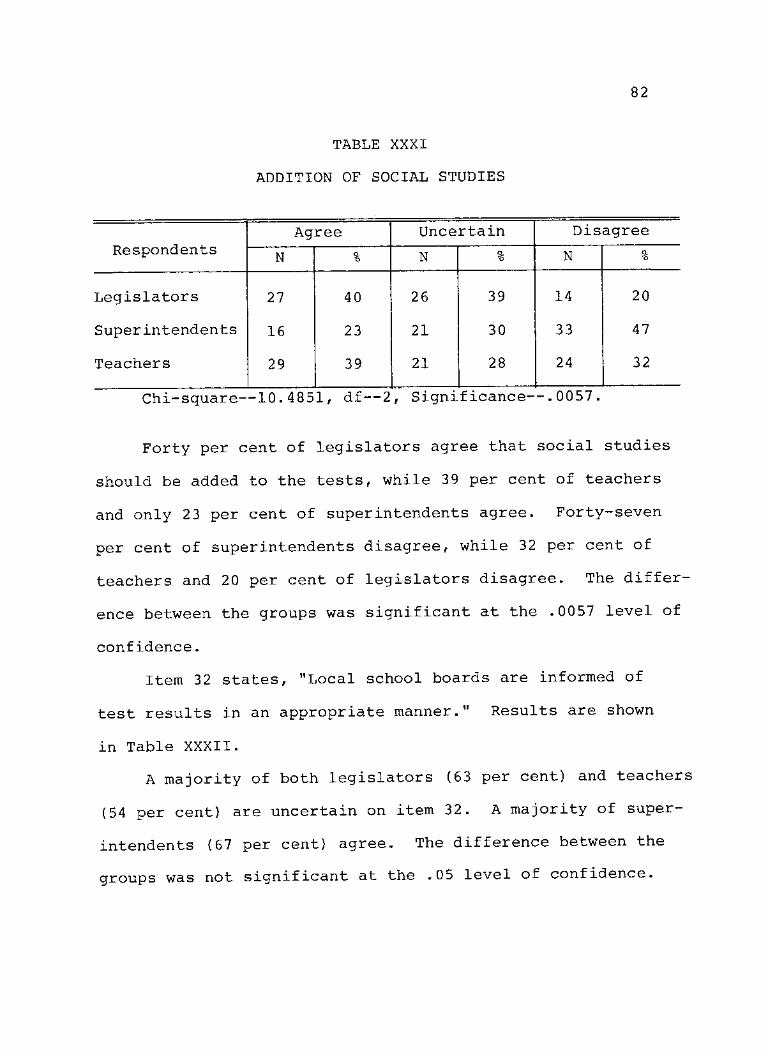
TABLE XXXI
ADDITION OF SOCIAL STUDIES
82
Respondents Agree Uncertain Disagree
Respondents N % N o. x> N a
"O
Legislators 27 40 26 39 14 20
Superintendents 16 23 21 30 33 47
Teachers 29 39 21 28 24 32
Chi-square—10.4851, df—2, Significance—.0057.
Forty per cent of legislators agree that social studies
should be added to the tests, while 39 per cent of teachers
and only 23 per cent of superintendents agree. Forty-seven
per cent of superintendents disagree, while 32 per cent of
teachers and 20 per cent of legislators disagree. The differ-
ence between the groups was significant at the .0057 level of
confidence.
Item 32 states, "Local school boards are informed of
test results in an appropriate manner." Results are shown
in Table XXXII.
A majority of both legislators (63 per cent) and teachers
(54 per cent) are uncertain on item 32. A majority of super-
intendents (67 per cent) agree. The difference between the
groups was not significant at the .05 level of confidence.

83
TABLE XXXII
SCHOOL BOARDS INFORMED APPROPRIATELY
Respondents Agree Uncertain Disagree
Respondents N a "O N Q, "o N %
Legislators 21 31 42 63 4 6
Superintendents 47 67 16 23 7 10
Teachers 25 34 40 54 9 12
Chi-square—2.67694, df—2, Significance
Item 33 states, "As a result of the Arkansas Student
Assessment Program, there has been a decline in emphasis
placed on subjects not tested." Results are shown in Table
XXXIII.
TABLE XXXIII
LESS EMPHASIS ON SUBJECTS NOT TESTED
Respondents Agree Uncertain Disagree
Respondents N o, "o N Q. "o N a
"o
Legislators 8 12 45 67 14 20
Superintendents 13 19 19 27 38 54
Teachers 19 26 22 30 33 45
Chi-square—1.67796, df—2, Significance- .5642
A majority of superintendents (54 per cent) disagree
with the statement in item 33. Forty-five per cent of
teachers and 20 per cent of legislators disagree. Only 12

84
per cent of legislators, 19 per cent of superintendents, and
26 per cent of teachers agree. The difference between the
groups was not significant at the .05 level of confidence.
Item 34 states, "The Arkansas Student Assessment Pro-
gram is unfair to minority students." Results are shown in
Table XXXIV.
TABLE XXXIV
UNFAIR TO MINORITIES
Respondents Agree Uncertain Disagree
Respondents N % N % N %
Legislators 6 9 19 28 42 63
Superintendents 3 4 17 24 50 71
Teachers 16 22 18 24 40 54
Chi-square—11.2814, df—2, Significance—
A majority of all three groups (legislators 63 per cent,
superintendents 71 per cent, and teachers 54 per cent) dis-
agree with the statement in item 34. The most agreement is
found with teachers (22 per cent) rather than legislators
(9 per cent) or superintendents (4 per cent). The difference
between the groups was significant at the .0040 level of
confidence.
Item 35 states, "A positive result of the Arkansas
Student Assessment Program has been increased communication
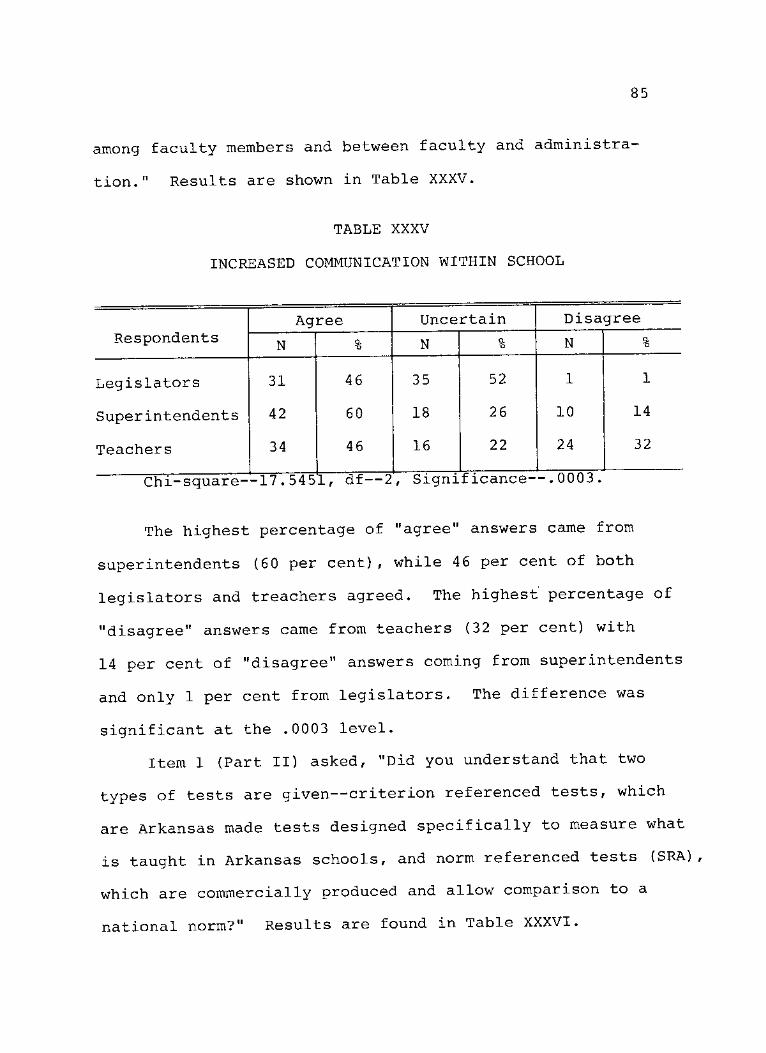
85
among faculty members and between faculty and administra-
tion." Results are shown in Table XXXV.
TABLE XXXV
INCREASED COMMUNICATION WITHIN SCHOOL
Respondents Agree Uncertain Disagree
Respondents N o, *o N a
"o N Q. "6
Legislators 31 46 35 52 1 1
Superintendents 42 60 18 26 10 14
Teachers 34 46 16 22 24 32
Chi-square—17.5451, df—2
The highest percentage of "agree" answers came from
superintendents (60 per cent), while 46 per cent of both
legislators and treachers agreed. The highest percentage of
"disagree" answers came from teachers (32 per cent) with
14 per cent of "disagree" answers coming from superintendents
and only 1 per cent from legislators. The difference was
significant at the .0003 level.
Item 1 (Part II) asked, "Did you understand that two
types of tests are given—criterion referenced tests, which
are Arkansas made tests designed specifically to measure what
is taught in Arkansas schools, and norm referenced tests (SRA),
which are commercially produced and allow comparison to a
national norm?" Results are found in Table XXXVI.
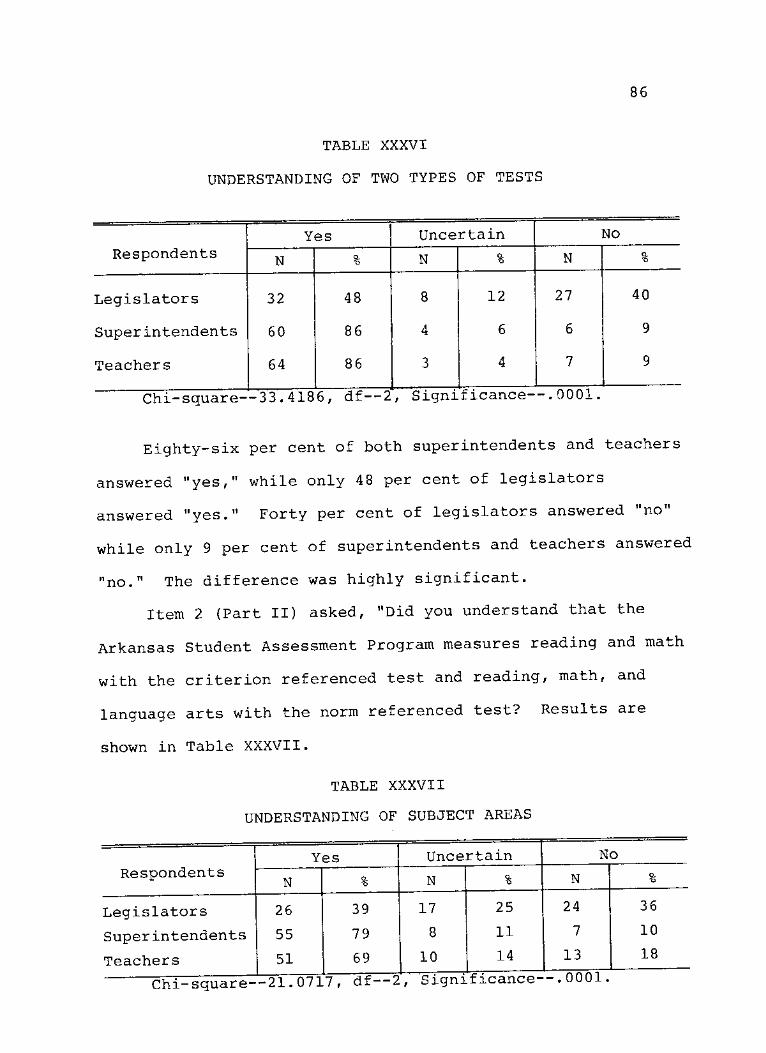
86
TABLE XXXVI
UNDERSTANDING OF TWO TYPES OF TESTS
Respondents Yes Uncertain No
Respondents N Q, "6 N % N a "O
Legislators 32 48 8 12 27 40
Superintendents 60 86 4 6 6 9
Teachers 64 86 3 4 7 9
Chi-square—33.4186, df—2, Significance--
Eighty-six per cent of both superintendents and teachers
answered "yes," while only 48 per cent of legislators
answered "yes." Forty per cent of legislators answered "no"
while only 9 per cent of superintendents and teachers answered
"no." The difference was highly significant.
Item 2 (Part II) asked, "Did you understand that the
Arkansas Student Assessment Program measures reading and math
with the criterion referenced test and reading, math, and
language arts with the norm referenced test? Results are
shown in Table XXXVII.
TABLE XXXVII
UNDERSTANDING OF SUBJECT AREAS
Respondents Yes Uncertain No
Respondents N Q.
"o N o, "O N %
Legislators 26 39 17 25 24 36
Super intendents 55 79 8 11 7 10
Teachers 51 69 10 14 13 18
Chi-square--21.0717, df—2 Significance--.0001.
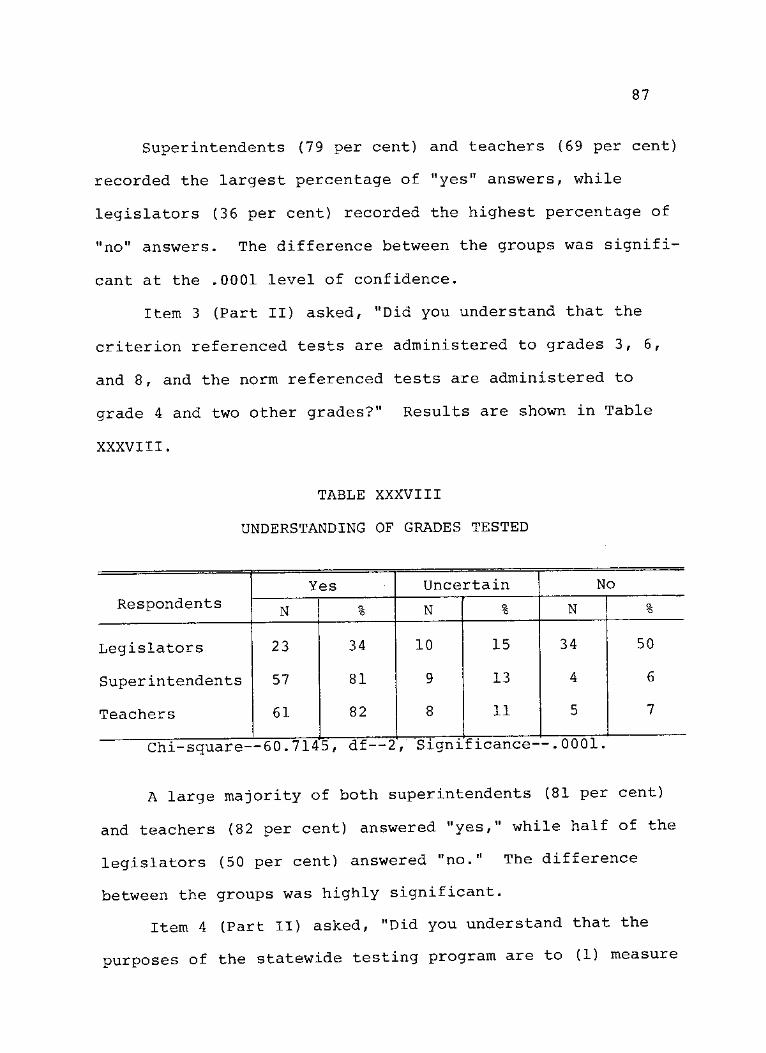
87
Superintendents (79 per cent) and teachers (69 per cent)
recorded the largest percentage of "yes" answers, while
legislators (36 per cent) recorded the highest percentage of
"no" answers. The difference between the groups was signifi-
cant at the .0001 level of confidence.
Item 3 (Part II) asked, "Did you understand that the
criterion referenced tests are administered to grades 3, 6,
and 8, and the norm referenced tests are administered to
grade 4 and two other grades?" Results are shown in Table
XXXVIII.
TABLE XXXVIII
UNDERSTANDING OF GRADES TESTED
Respondents Yes Uncertain No
Respondents N g. *o N % N %
Legislators 23 34 10 15 34 50
Superintendents 57 81 9 13 4 6
Teachers 61 82 8 11 5 7
Chi-square—60.7145, df—2, Significance-- 0001.
A large majority of both superintendents (81 per cent)
and teachers (82 per cent) answered "yes," while half of the
legislators (50 per cent) answered "no.1 The difference
between the groups was highly significant.
Item 4 (Part II) asked, "Did you understand that the
purposes of the statewide testing program are to (1) measure
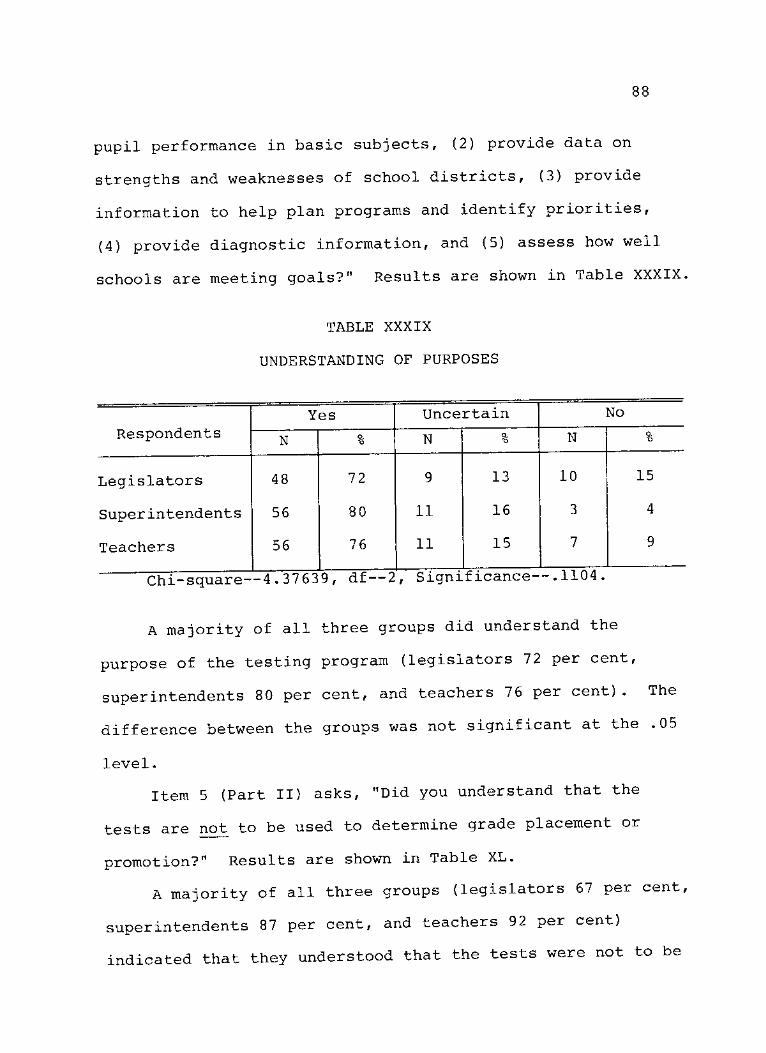
88
pupil performance in basic subjects, (2) provide data on
strengths and weaknesses of school districts, (3) provide
information to help plan programs and identify priorities,
(4) provide diagnostic information, and (5) assess how well
schools are meeting goals?" Results are shown in Table XXXIX.
TABLE XXXIX
UNDERSTANDING OF PURPOSES
Respondents Yes Uncertain No
Respondents N % N Q, S N %
Legislators 48 72 9 13 10 15
Superintendents 56 80 11 16 3 4
Teachers 56 76 11 15 7 9
Chi-square—4. 37639, df—2," Significance—
A majority of all three groups did understand the
purpose of the testing program (legislators 72 per cent,
superintendents 80 per cent, and teachers 76 per cent). The
difference between the groups was not significant at the .05
level.
Item 5 (Part II) asks, "Did you understand that the
tests are not to be used to determine grade placement or
promotion?" Results are shown in Table XL.
A majority of all three groups (legislators 67 per cent,
superintendents 87 per cent, and teachers 92 per cent)
indicated that they understood that the tests were not to be
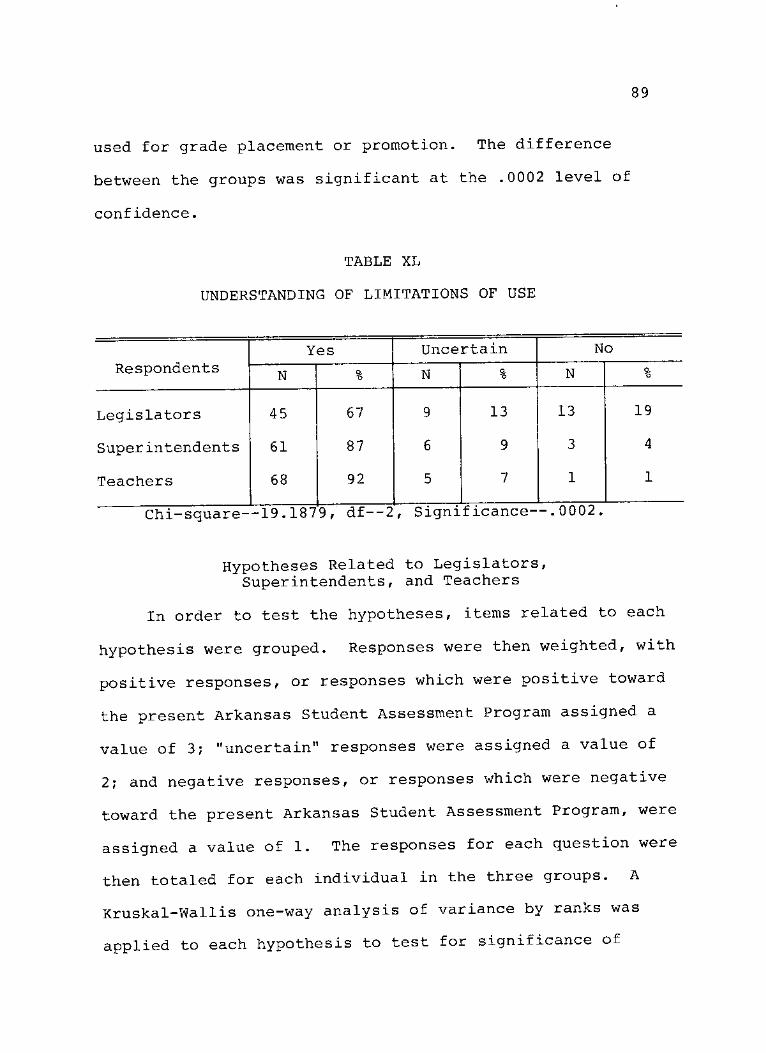
89
used for grade placement or promotion. The difference
between the groups was significant at the .0002 level of
confidence.
TABLE XL
UNDERSTANDING OF LIMITATIONS OF USE
Respondents Yes Uncertain No
Respondents N Q, "O N Q. 'O N %
Legislators 45 67 9 13 13 19
Superintendents 61 87 6 9 3 4
Teachers 68 92 5 7 1 1
Chi-square—19.1879, df—2, Significance-
Hypotheses Related to Legislators, Superintendents, and Teachers
In order to test the hypotheses, items related to each
hypothesis were grouped. Responses were then weighted, with
positive responses, or responses which were positive toward
the present Arkansas Student Assessment Program assigned a
value of 3; "uncertain" responses were assigned a value of
2; and negative responses, or responses which were negative
toward the present Arkansas Student Assessment Program, were
assigned a value of 1. The responses for each question were
then totaled for each individual in the three groups. A
Kruskal-Wal1is one-way analysis of variance by ranks was
applied to each hypothesis to test for significance of
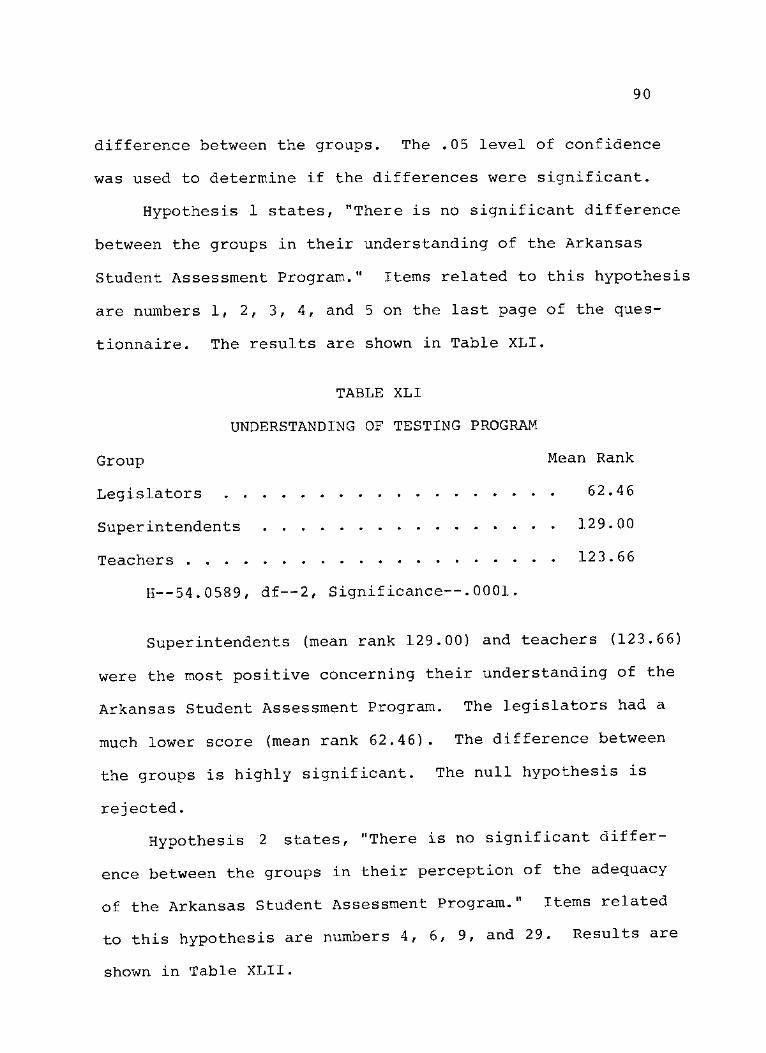
90
difference between the groups. The .05 level of confidence
was used to determine if the differences were significant.
Hypothesis 1 states, "There is no significant difference
between the groups in their understanding of the Arkansas
Student Assessment Program." Items related to this hypothesis
are numbers 1, 2, 3, 4, and 5 on the last page of the ques-
tionnaire. The results are shown in Table XLI.
TABLE XLI
UNDERSTANDING OF TESTING PROGRAM
Group Mean Rank
Legislators 62.46
Superintendents 129.00
Teachers 123.66
H—54.0589, df—2, Significance—.0001.
Superintendents (mean rank 129.00) and teachers (123.66)
were the most positive concerning their understanding of the
Arkansas Student Assessment Program. The legislators had a
much lower score (mean rank 62.46). The difference between
the groups is highly significant. The null hypothesis is
rejected.
Hypothesis 2 states, "There is no significant differ-
ence between the groups in their perception of the adequacy
of the Arkansas Student Assessment Program." Items related
to this hypothesis are numbers 4, 6, 9, and 29. Results are
shown in Table XLII.

91
TABLE XLII
ADEQUACY OF PROGRAM
Group Mean Rank
Legislators 83.81
Superintendents 123.24
Teachers 109.78
H—15.2400, df—2, Significance—.0005.
Superintendents (mean rank, 123.24) and teachers (mean
rank, 109.78) were the most positive in their responses con-
cerning the adequacy of the Arkansas Student Assessment Pro-
gram, while legislators (mean rank, 83.81) had the lowest
score of the three groups. The difference between the groups
was significant at the .0005 level of confidence. The null
hypothesis is rejected.
Hypothesis 3 states, "There is no significant differ-
ence between the groups in their perception of the fairness
of the administration of the Arkansas Student Assessment
Program or in the fairness of the reporting of the results."
Items related to this hypothesis are numbers 5, 11, 17, 21,
28, and 34. Responses are shown in Table XLIII.
Legislators (mean rank, 119.32) were the most positive
in their responses toward the fairness of the Arkansas
Student Assessment Program, while teachers (mean rank, 86.11)
were the least positive toward the fairness of the program.
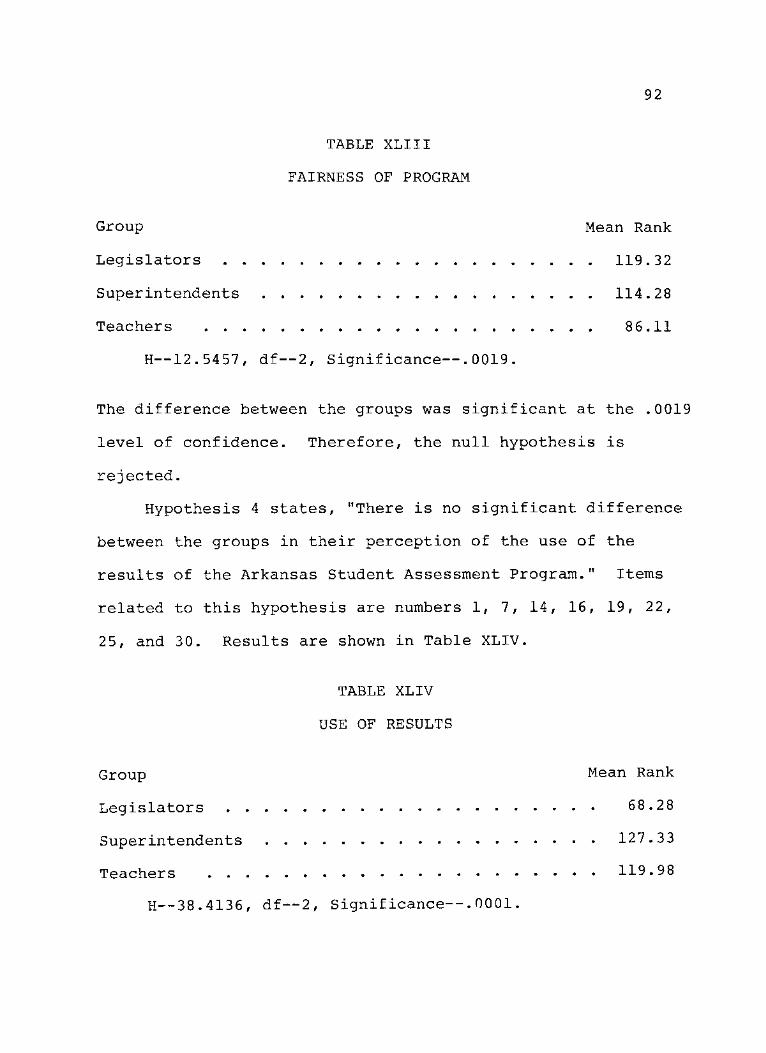
92
TABLE XLIII
FAIRNESS OF PROGRAM
Group Mean Rank
Legislators 119.32
Superintendents 114.28
Teachers 86.11
H—12.5457, df—2, Significance—.0019.
The difference between the groups was significant at the .0019
level of confidence. Therefore, the null hypothesis is
rejected.
Hypothesis 4 states, "There is no significant difference
between the groups in their perception of the use of the
results of the Arkansas Student Assessment Program." Items
related to this hypothesis are numbers 1, 7, 14, 16, 19, 22,
25, and 30. Results are shown in Table XLIV.
TABLE XLIV
USE OF RESULTS
Group Mean Rank
Legislators 68.28
Superintendents 127.33
Teachers 119.98
H—38.4136, df—2, Significance—.0001.

93
Superintendents (mean rank, 127.33) and teachers (mean
rank, 119.98) had somewhat higher scores than legislators
(mean rank, 68.28) in their attitudes toward positive use of
the results of the testing program. The difference between
the groups was highly significant; therefore, the null
hypothesis is rejected.
Hypothesis 5 states, "There is no significant difference
between the groups in their perception of the educational
impact of the Arkansas Student Assessment Program." Items
related to this hypothesis are numbers 2, 8, 20, 24, 33, and
35. Results are shown in Table XLV.
TABLE XLV
EDUCATIONAL IMPACT
Groups M© a n R a n k
Legislators 113.13
Superintendents 117.39
Teachers 88.78
H—9.3632, df—2, Significance—.0093.
Superintendents (mean rank, 117.39) and legislators
(mean rank, 113.13) recorded responses which were most posi-
tive toward the educational impact of the Arkansas Student
Assessment Program, while teachers (mean rank, 88.78) recorded
the lowest scores. The difference was significant at the
.0093 level of confidence, so the null hypothesis is
rejected.
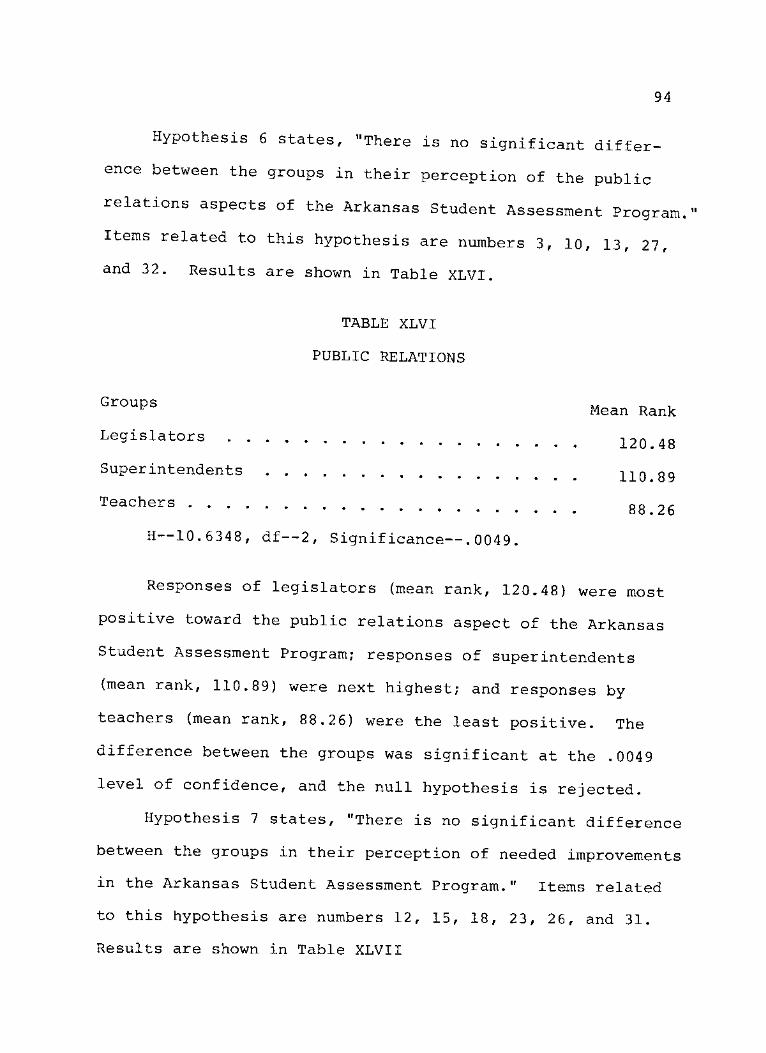
94
Hypothesis 6 states, "There is no significant differ-
ence between the groups in their perception of the public
relations aspects of the Arkansas Student Assessment Program."
Items related to this hypothesis are numbers 3, 10, 13, 27,
and 32. Results are shown in Table XLVI.
TABLE XLVI
PUBLIC RELATIONS
G r O U p S Mean Rank
Legislators 1 2 0 < 4 8
Superintendents 2.10 39
Teachers 88.26
H—10.6348, df—2, Significance—.0049.
Responses of legislators (mean rank, 120.48) were most
positive toward the public relations aspect of the Arkansas
Student Assessment Program; responses of superintendents
(mean rank, 110.89) were next highest; and responses by
teachers (mean rank, 88.26) were the least positive. The
difference between the groups was significant at the .0049
level of confidence, and the null hypothesis is rejected.
Hypothesis 7 states, "There is no significant difference
between the groups in their perception of needed improvements
in the Arkansas Student Assessment Program." Items related
to this hypothesis are numbers 12, 15, 18, 23, 26, and 31.
Results are shown in Table XLVII
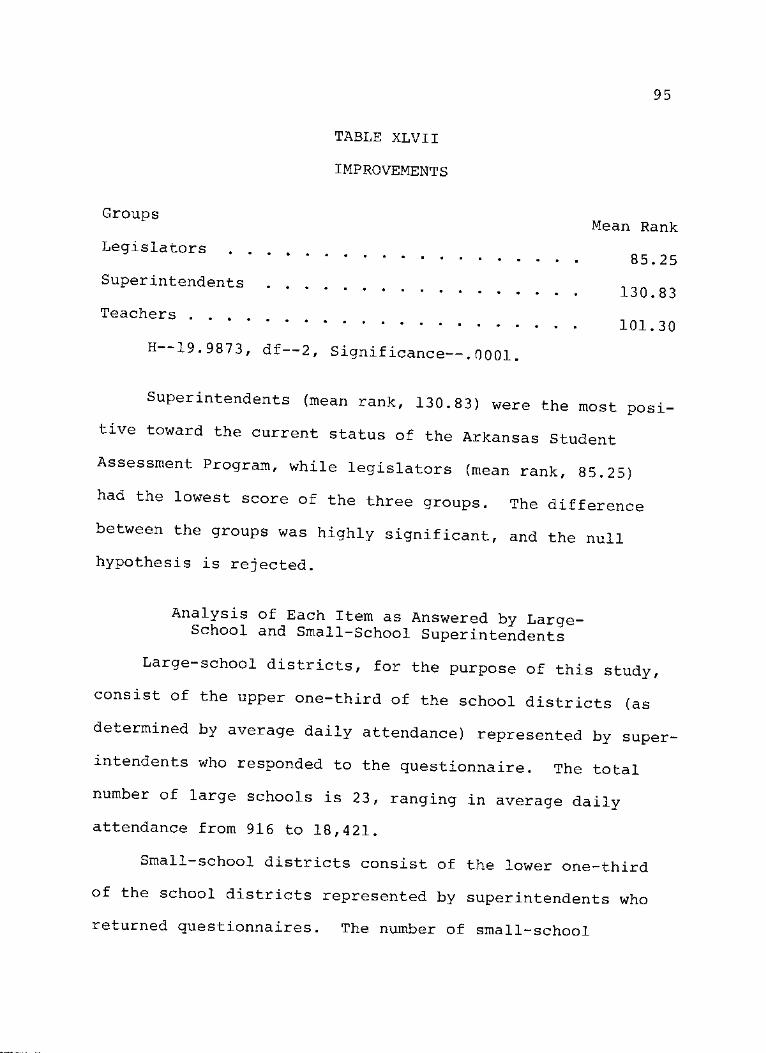
95
TABLE XLVII
IMPROVEMENTS
Groups Mean Rank
Legislators . . . . 85.25
Superintendents . . . 130.83
Teachers . . . . 101.30
H- 19.9873, df 2, Significance—. 0001,
Superintendents (mean rank, 130.83) were the most posi-
tive toward the current status of the Arkansas Student
Assessment Program, while legislators (mean rank, 85.25)
had the lowest score of the three groups. The difference
between the groups was highly significant, and the null
hypothesis is rejected.
Analysis of Each Item as Answered by Large-School and Small-School Superintendents
Large-school districts, for the purpose of this study,
consist of the upper one-third of the school districts (as
determined by average daily attendance) represented by super-
intendents who responded to the questionnaire. The total
number of large schools is 23, ranging in average daily
attendance from 916 to 18,421.
Small-school districts consist of the lower one-third
of the school districts represented by superintendents who
returned questionnaires. The number of small-school
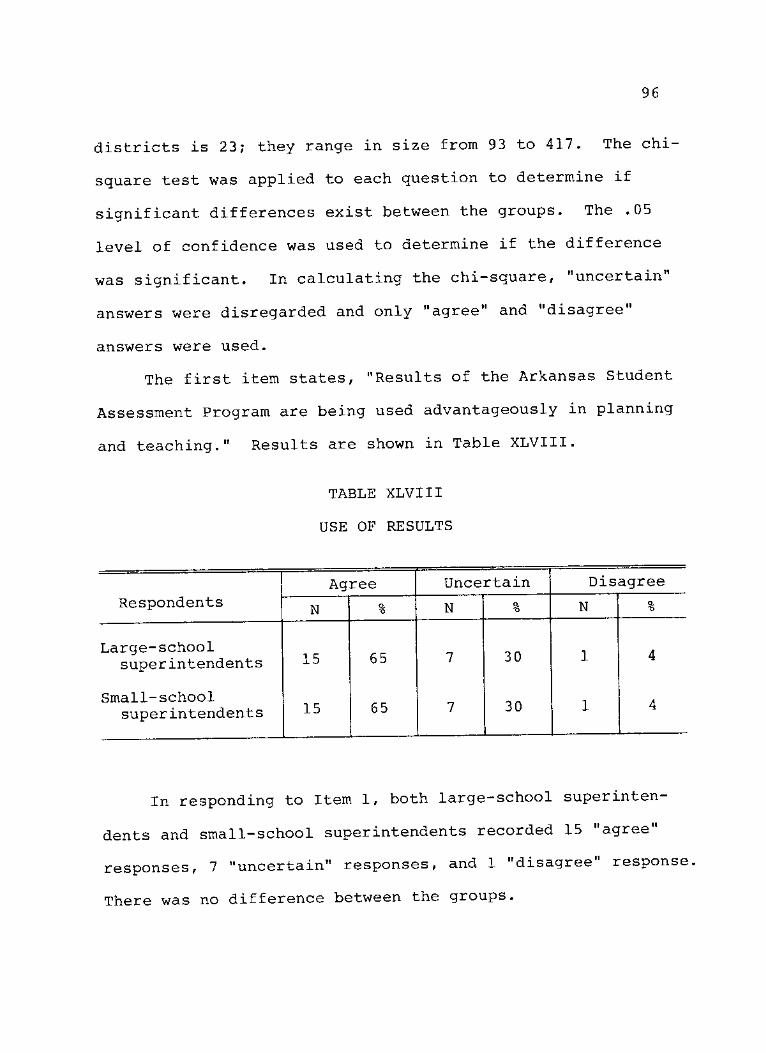
96
districts is 23; they range in size from 93 to 417. The chi-
square test was applied to each question to determine if
significant differences exist between the groups. The .05
level of confidence was used to determine if the difference
was significant. In calculating the chi-square, "uncertain"
answers were disregarded and only "agree" and "disagree"
answers were used.
The first item states, "Results of the Arkansas Student
Assessment Program are being used advantageously in planning
and teaching." Results are shown in Table XLVIII.
TABLE XLVIII
USE OF RESULTS
Agree Uncertain Disagree Respondents N % N % N %
Large-school superintendents 15 65 7 30 1 4
Small-school superintendents 15 65 7 30 1 4
In responding to Item 1, both large—school superinten
dents and small-school superintendents recorded 15 "agree"
responses, 7 "uncertain" responses, and 1 "disagree" response,
There was no difference between the groups.

97
Item 2 states, "Participation in the Arkansas Student
Assessment Program has led to a decline in local control of
schools." Results are shown in Table XLIX.
TABLE XLIX
DECLINE IN LOCAL CONTROL
Respondents Agree
N
Uncertain
N
Disagree
N
Large-school superintendents
Small-school superintendents 39
21
12
91
52
Chi-square—1.06257, df—1, Significance -. 3033,
A majority of both large-school superintendents and
small-school superintendents disagree that participation in
the Arkansas Student Assessment Program has led to a decline
in local control of schools. Large-school superintendents
(91 per cent) disagreed to a greater extent than small-
school superintendents (52 per cent). Many small-school
superintendents (39 per cent) were undecided. The differ-
ence between the groups was not significant at the .05 level,
Item 3 states, "The news media does a good job of
reporting the results of the Arkansas Student Assessment
Program." Results are shown in Table L.
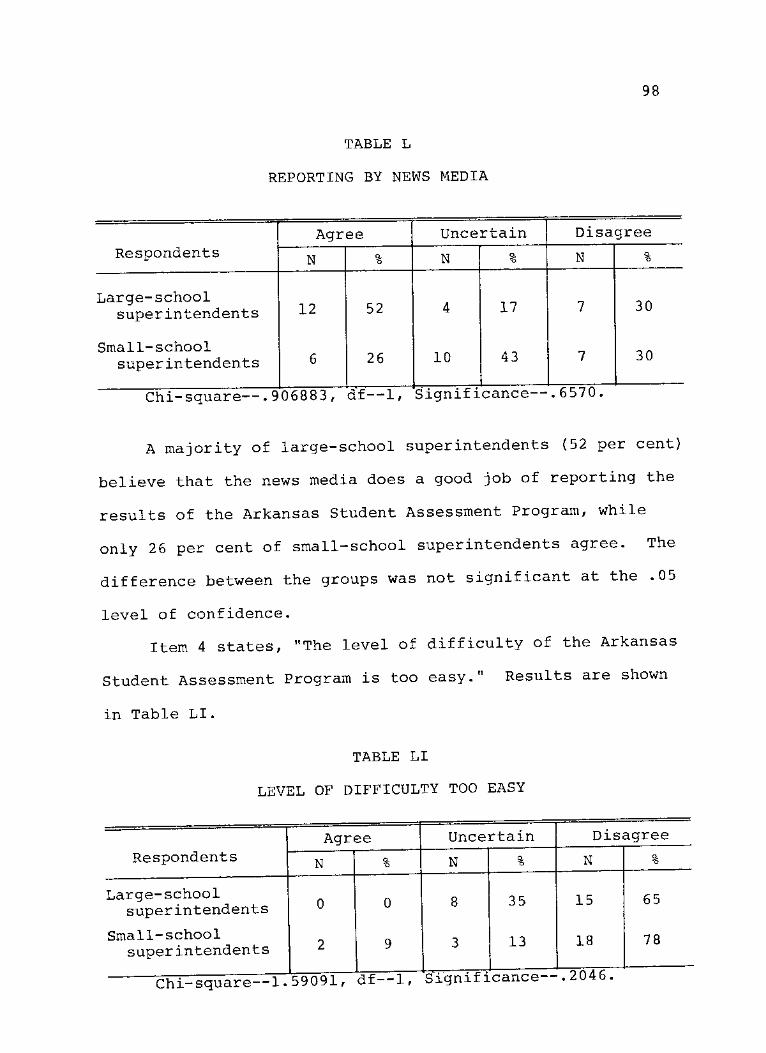
TABLE L
REPORTING BY NEWS MEDIA
98
Agree Uncertain Disagree Respondents N O.
'O N o. "o N %
Large-school superintendents 12 52 4 17 7 30
Small-school superintendents 6 26 10 43 7 30
Chi-square--.906883, df—1, Significance -
A majority of large-school superintendents (52 per cent)
believe that the news media does a good job of reporting the
results of the Arkansas Student Assessment Program, while
only 2 6 per cent of small-school superintendents agree. The
difference between the groups was not significant at the .05
level of confidence.
Item 4 states, "The level of difficulty of the Arkansas
Student Assessment Program is too easy." Results are shown
in Table LI.
TABLE LI
LEVEL OF DIFFICULTY TOO EASY
Respondents
Large-school superintendents
Small-school superintendents
Agree
N
0
2
0
9
Uncertain
N
8
3
35
13
Disagree
N
15
18
65
78
Chi-square—1.59091, d f — 1 , Significance—. 2046.
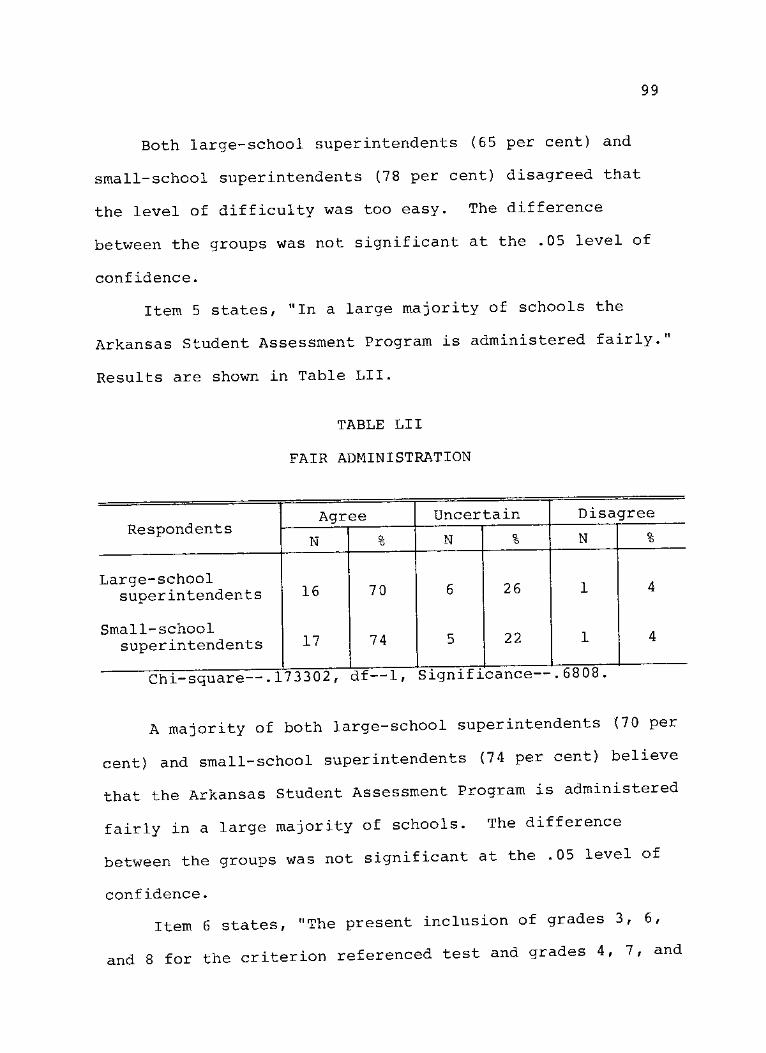
99
Both large-school superintendents (65 per cent) and
small-school superintendents (78 per cent) disagreed that
the level of difficulty was too easy. The difference
between the groups was not significant at the .05 level of
confidence.
Item 5 states, "In a large majority of schools the
Arkansas Student Assessment Program is administered fairly."
Results are shown in Table LII.
TABLE LII
FAIR ADMINISTRATION
Respondents Agree Uncertain Disagree
Respondents N a "o N % N %
Large-school superintendents 16 70 6 26 1 4
Small-school superintendents 17 74 5 22 1 4
Chi-square—. 173302, df—1, Significance
A majority of both large-school superintendents {70 per
cent) and small-school superintendents (74 per cent) believe
that the Arkansas Student Assessment Program is administered
fairly in a large majority of schools. The difference
between the groups was not significant at the .05 level of
confidence.
Item 6 states, "The present inclusion of grades 3, 6,
and 8 for the criterion referenced test and grades 4, 7, and
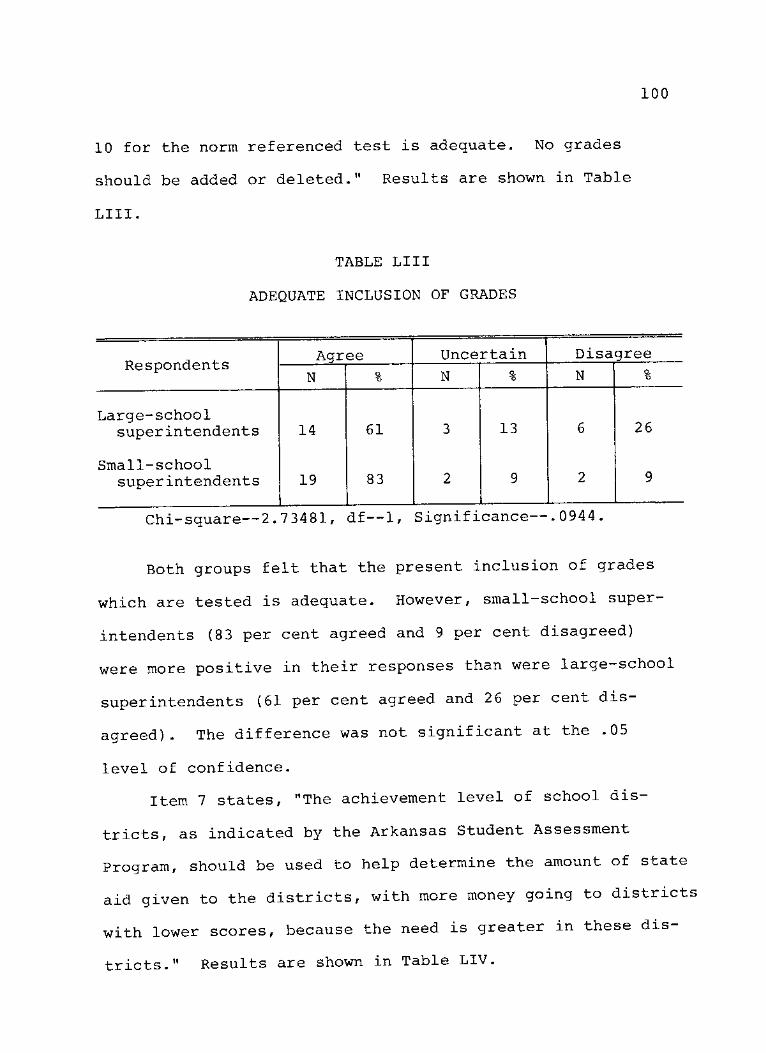
100
10 for the norm referenced test is adequate. No grades
should be added or deleted." Results are shown in Table
LIII.
TABLE LIII
ADEQUATE INCLUSION OF GRADES
Respondents Agree Uncertain Disagree
Respondents N % N % N %
Large-school superintendents 14 61 3 13 6 26
Small-school superintendents 19 83 2 9 2 9
Chi-square—2.73481, df—1, Significance—.0944.
Both groups felt that the present inclusion of grades
which are tested is adequate. However/ sroall-school super-
intendents (83 per cent agreed and 9 per cent disagreed)
were more positive in their responses than were large-school
superintendents (61 per cent agreed and 2 6 per cent dis-
agreed) . The difference was not significant at the .05
level of confidence.
Item 7 states, "The achievement level of school dis-
tricts, as indicated by the Arkansas Student Assessment
Program, should be used to help determine the amount of state
aid given to the districts, with more money going to districts
with lower scores, because the need is greater in these dis-
tricts." Results are shown in Table LIV.
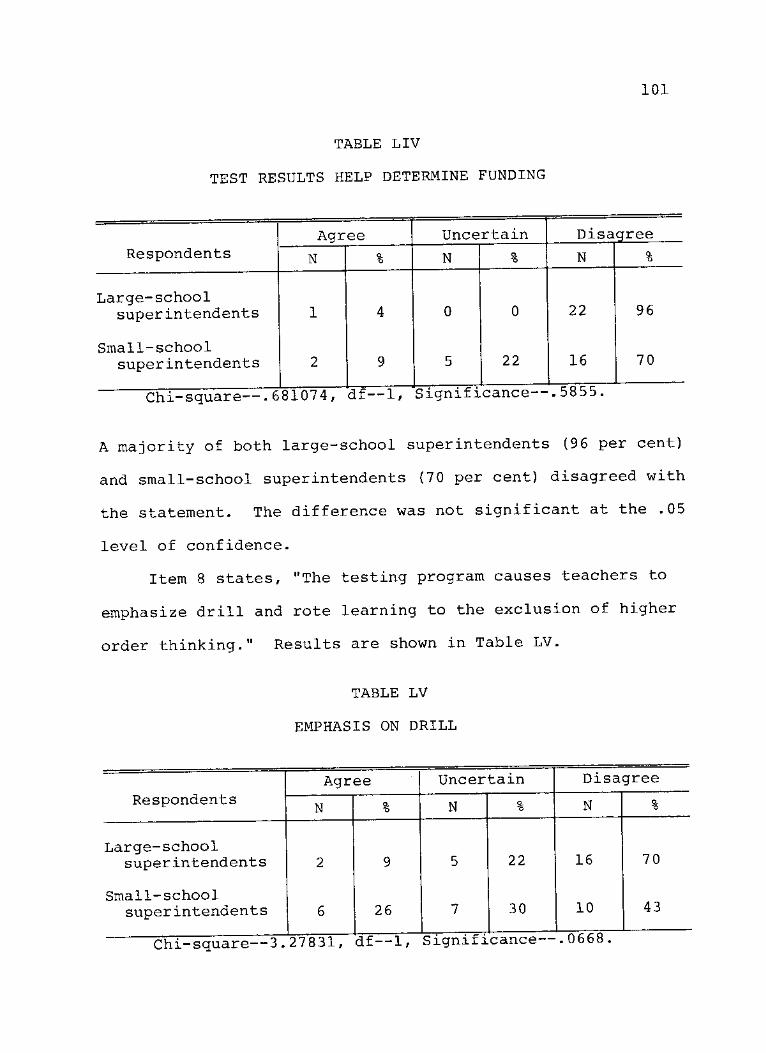
101
TABLE LIV
TEST RESULTS HELP DETERMINE FUNDING
Respondents Agree Uncertain Disagree
Respondents N % N % N %
Large-school 22 96 super intendents 1 4 0 0 22 96
Small-school superintendents 2 9 5 22 16 70
Chi-square—.681074, df—1, Significance
A majority of both large-school superintendents (96 per cent)
and small-school superintendents (70 per cent) disagreed with
the statement. The difference was not significant at the .05
level of confidence.
Item 8 states, "The testing program causes teachers to
emphasize drill and rote learning to the exclusion of higher
order thinking." Results are shown in Table LV.
TABLE LV
EMPHASIS ON DRILL
Respondents Agree Uncertain Disagree
Respondents N % N Q. "o N %
Large-school 16 70 superintendents 2 9 5 22 16 70
Small-school 10 43 superintendents 6 26 7 30 10 43
Chi-square—3. 27831, df—1, Significance— .0668.
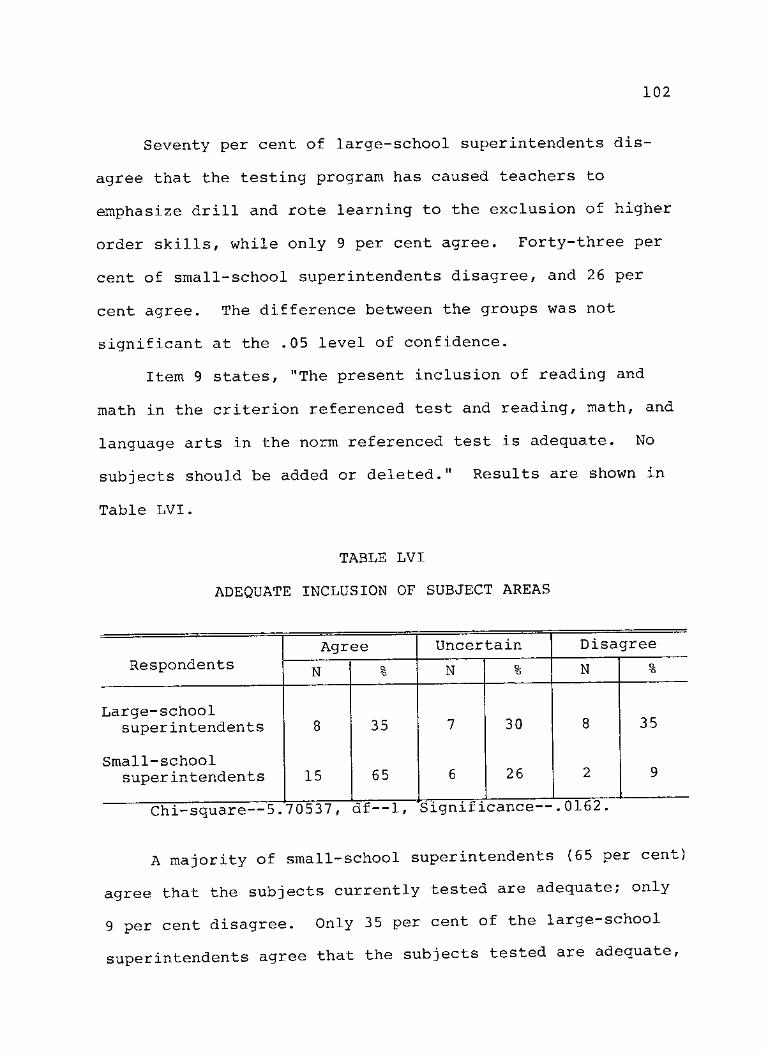
102
Seventy per cent of large-school superintendents dis-
agree that the testing program has caused teachers to
emphasize drill and rote learning to the exclusion of higher
order skills, while only 9 per cent agree. Forty-three per
cent of small-school superintendents disagree, and 26 per
cent agree. The difference between the groups was not
significant at the .05 level of confidence.
Item 9 states, "The present inclusion of reading and
math in the criterion referenced test and reading, math, and
language arts in the norm referenced test is adequate. No
subjects should be added or deleted." Results are shown in
Table LVI.
TABLE LVI
ADEQUATE INCLUSION OF SUBJECT AREAS
Agree Uncertain Disagree Respondents N Q. 'O N % N a
"O
Large-school superintendents 8 35 7 30 8 35
Small-school superintendents 15 65 6 26 2 9
Chi-square—5.70537, df—1, Significance-
A majority of small-school superintendents (65 per cent)
agree that the subjects currently tested are adequate; only
9 per cent disagree. Only 35 per cent of the large-school
superintendents agree that the subjects tested are adequate,
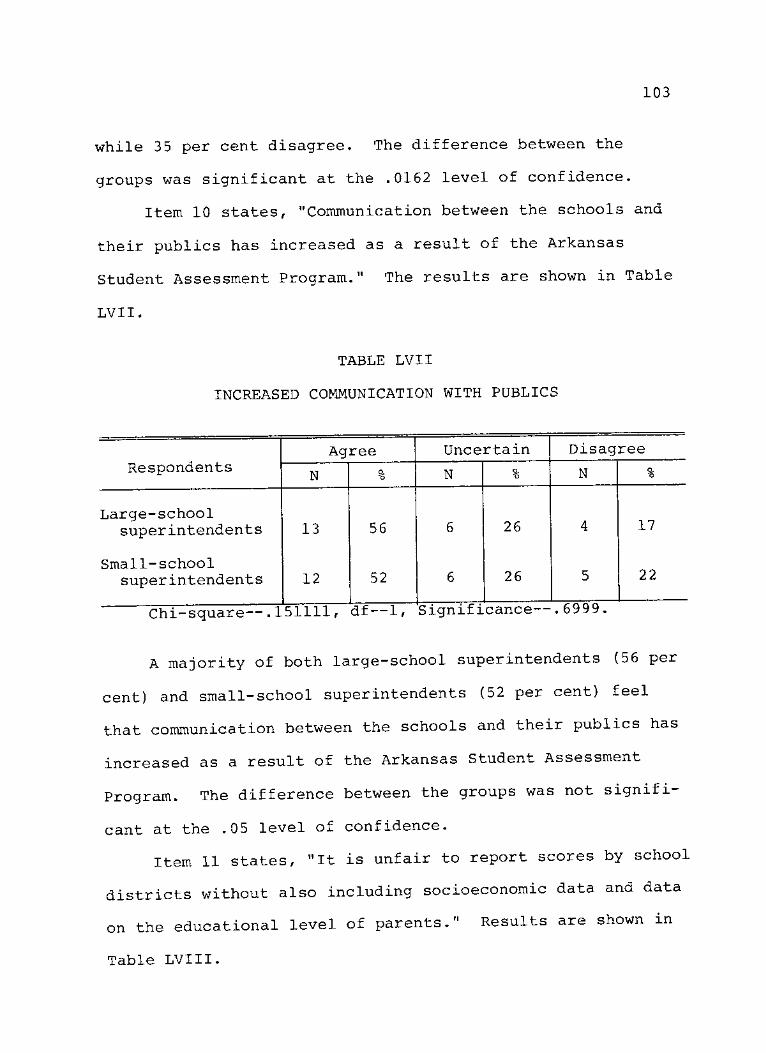
103
while 35 per cent disagree. The difference between the
groups was significant at the .0162 level of confidence.
Item 10 states, "Communication between the schools and
their publics has increased as a result of the Arkansas
Student Assessment Program." The results are shown in Table
LVII.
TABLE LVII
INCREASED COMMUNICATION WITH PUBLICS
Agree Uncertain Disagree Respondents N Q. "o N % N Q. "O
Large-school superintendents 13 56 6 26 4 17
Small-school superintendents 12 52 6 26 5 22
Chi-square—.151111, df—1, Significance
A majority of both large-school superintendents (56 per
cent) and small-school superintendents (52 per cent) feel
that communication between the schools and their publics has
increased as a result of the Arkansas Student Assessment
Program. The difference between the groups was not signifi-
cant at the .05 level of confidence.
Item 11 states, "It is unfair to report scores by school
districts without also including socioeconomic data and data
on the educational level of parents." Results are shown m
Table LVIII.

104
TABLE LVIII
INCLUSION OF SOCIOECONOMIC AND EDUCATIONAL DATA
Agree Uncertain Disagree Respondents N % N Q, "O N %
Large-school superintendent 9 39 9 39 5 22
Small-school superintendent 16 70 5 22 2 9
Chi-square—2.7893, df—1, Significance—
Most small-school superintendents (70 per cent) agree
that it is unfair to report scores by school district with-
out including socioeconomic data and data on the educational
level of parents. Only 9 per cent disagree. However, only
39 per cent of large-school superintendents believe that this
is an unfair practice, and 22 per cent disagree. The differ-
ence between the two groups was not significant at the .05
level of confidence.
Item 12 states, "Science should be added to the subjects
tested." Results are shown in Table LIX.
Concerning adding science to the subjects tested, large-
school superintendents are about equally divided. Ten (43
per cent) agreed and 9 (39 per cent) disagreed, while 5 (22
per cent) small-school superintendents agreed and 10 (43 per
cent) disagreed. The difference was not significant at the
.05 level of confidence.

TABLE LIX
ADDITION OF SCIENCE
105
Agree Uncertain Disagree Respondents N Q. 'o N % N %
Large-school superintendents 10 43 4 17 9 39
Small-school super intendents 5 22 8 35 10 43
Chi-square—1.26624, d£—1/ Significance
Item 13 states, "Parents are informed ef test results
in an appropriate manner." Results are shown in Table LX.
TABLE LX
PARENTS INFORMED APPROPRIATELY
Respondents
Large-school superintendents
Small-school superintendents
Agree N
10
6
43
26
Uncertain N
12
22
52
Disagree N
35
22
Chi-square—.281664, df—1, Significance—. 6025.
Forty-three per cent of large—school superintendents
felt that parents were informed in an appropriate manner,
while only 26 per cent of small-school superintendents
agreed. A majority of small-school superintendents (52 per
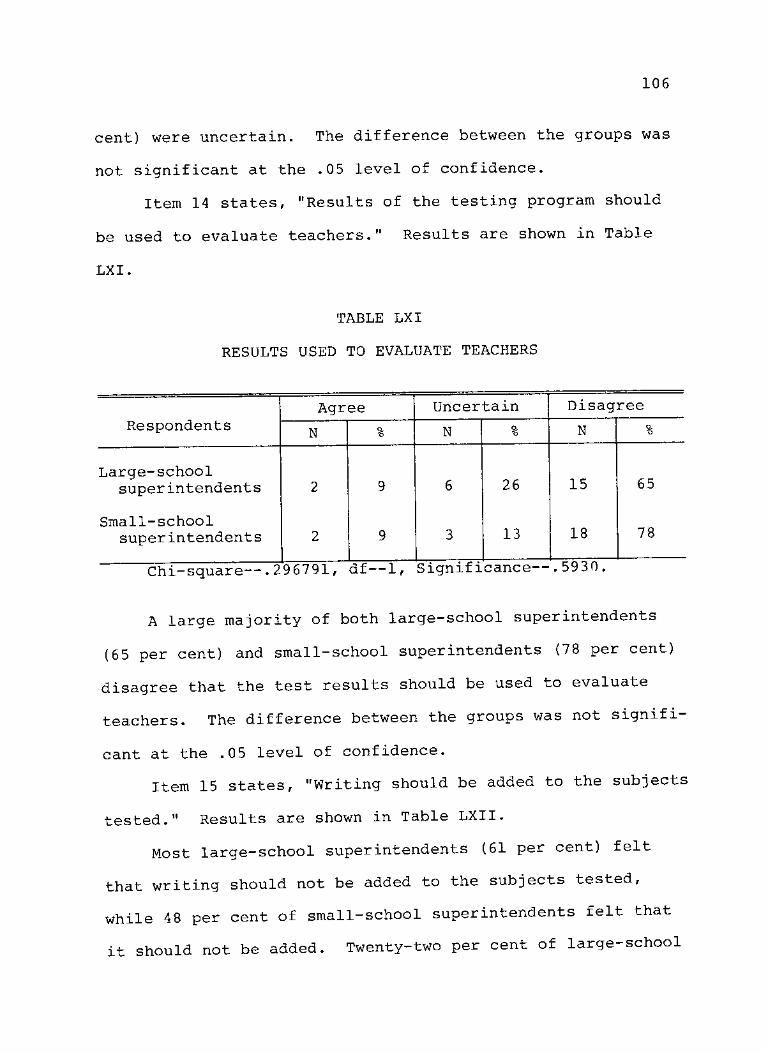
106
cent) were uncertain. The difference between the groups was
not significant at the .05 level of confidence.
Item 14 states, "Results of the testing program should
be used to evaluate teachers." Results are shown in Table
LXI.
TABLE LXI
RESULTS USED TO EVALUATE TEACHERS
Respondents Agree Uncertain Disagree
Respondents N q, "O N Q, *o N %
Large-school 26 15 65 super intendents 2 9 6 26 15 65
Small-school 18 78 superintendents 2 9 3 13 18 78
Chi-square—.296791, df—1, Significance
A large majority of both large-school superintendents
(65 per cent) and small-school superintendents (78 per cent)
disagree that the test results should be used to evaluate
teachers. The difference between the groups was not signifi-
cant at the .05 level of confidence.
Item 15 states, "Writing should be added to the subjects
tested." Results are shown in Table LXII.
Most large-school superintendents (61 per cent) felt
that writing should not be added to the subjects tested,
while 48 per cent of small-school superintendents felt that
it should not be added. Twenty-two per cent of large-school
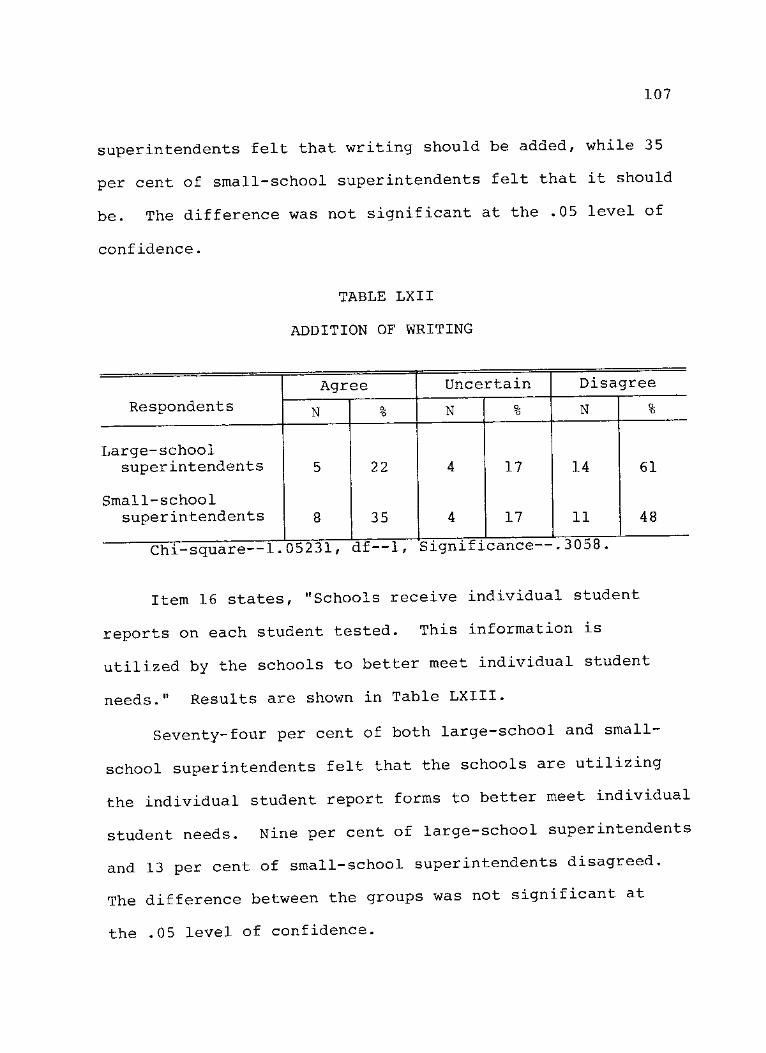
107
superintendents felt that writing should be added, while 35
per cent of small-school superintendents felt that it should
be. The difference was not significant at the .05 level of
confidence.
TABLE LXII
ADDITION OF WRITING
Agree Uncertain Disagree
Respondents N o, 'o N % N Q.
"o
Large-school super intendents 5 22 4 17 14 61
Small-school superintendents 8 35 4 17 11
"3 ft KR
48
Item 16 states, "Schools receive individual student
reports on each student tested. This information is
utilized by the schools to better meet individual student
needs." Results are shown in Table LXIII.
Seventy-four per cent of both large—school and small-
school superintendents felt that the schools are utilizing
the individual student report forms to better meet individual
student needs. Nine per cent of large-school superintendents
and 13 per cent of small-school superintendents disagreed.
The difference between the groups was not significant at
the .05 level of confidence.
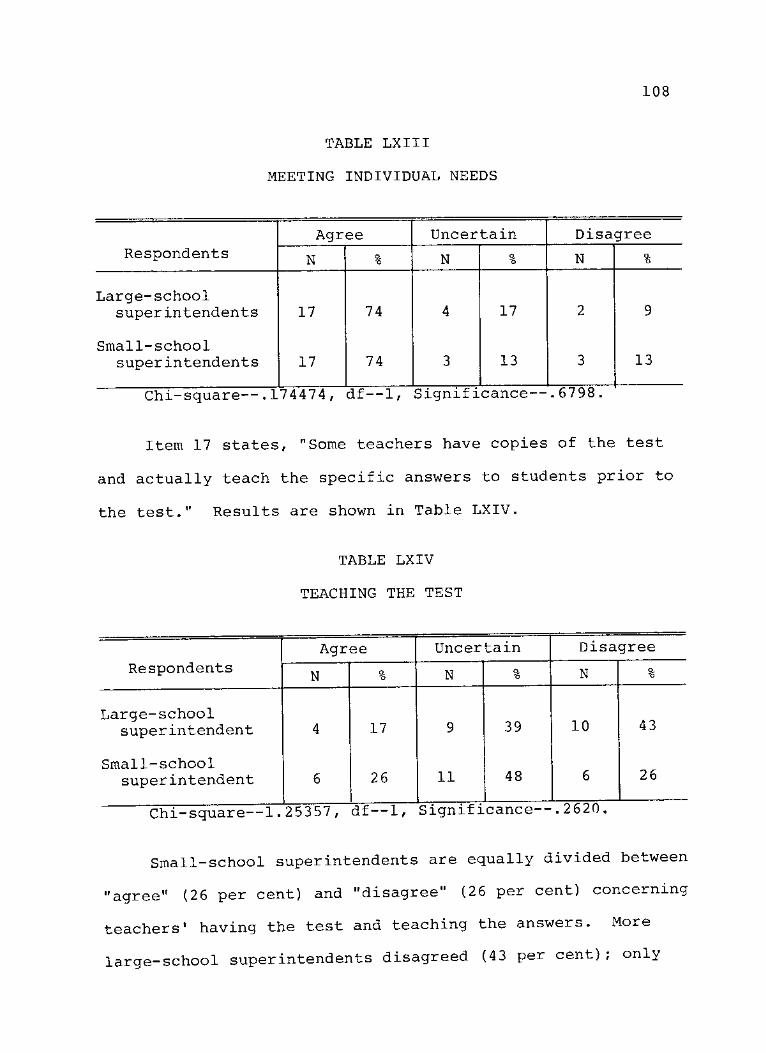
TABLE LXIII
MEETING INDIVIDUAL NEEDS
108
Agree Uncertain Disagree Respondents N Q. *6 N % N %
Large-school superintendents 17 74 4 17 2 9
Small-school super intendents 17 74 3 13 3 13
Chi-square—.174474, df—1, Significance—.6798
Item 17 states, "Some teachers have copies of the test
and actually teach the specific answers to students prior to
the test." Results are shown in Table LXIV.
TABLE LXIV
TEACHING THE TEST
Agree Uncertain Disagree Respondents N % N % N Q, "O
Large-school superintendent 4 17 9 39 10 43
Small-school super intendent 6 26 11 48 6 26
Chi-square-
Small-school superintendents are equally divided between
"agree" (26 per cent) and "disagree" (26 per cent) concerning
teachers' having the test and teaching the answers. More
large-school superintendents disagreed (43 per cent); only

109
17 per cent agreed. The difference between the groups was
not significant at the .05 level of confidence.
Item 18 states, "As a part of the Student Assessment
Program, twelfth-grade students should be required to pass a
competency test on basic skills before receiving a diploma."
Results are shown in Table LXV.
TABLE LXV
TWELFTH-GRADE COMPETENCY TEST
Respondents Agree Uncertain Disagree
Respondents N Q. "O N % N O.
"O
Large-school superintendents 10 43 3 13 10 43
Small-school superintendents 15 65 5 22 3 13
Chi-square—4.67692, df—1, Significance—.0288
Large-school superintendents were evenly divided between
"agree" (43 per cent) and "disagree" (43 per cent) concerning
the requirement that twelfth-grade students pass a basic
skills test before graduation. A majority of small-school
superintendents (65 per cent) agreed. The difference was
significant at the .0288 level of confidence.
Item 19 states, "The test results should be used as the
main determinant for promotion and retention of students."
Results are shown in Table LXVI.
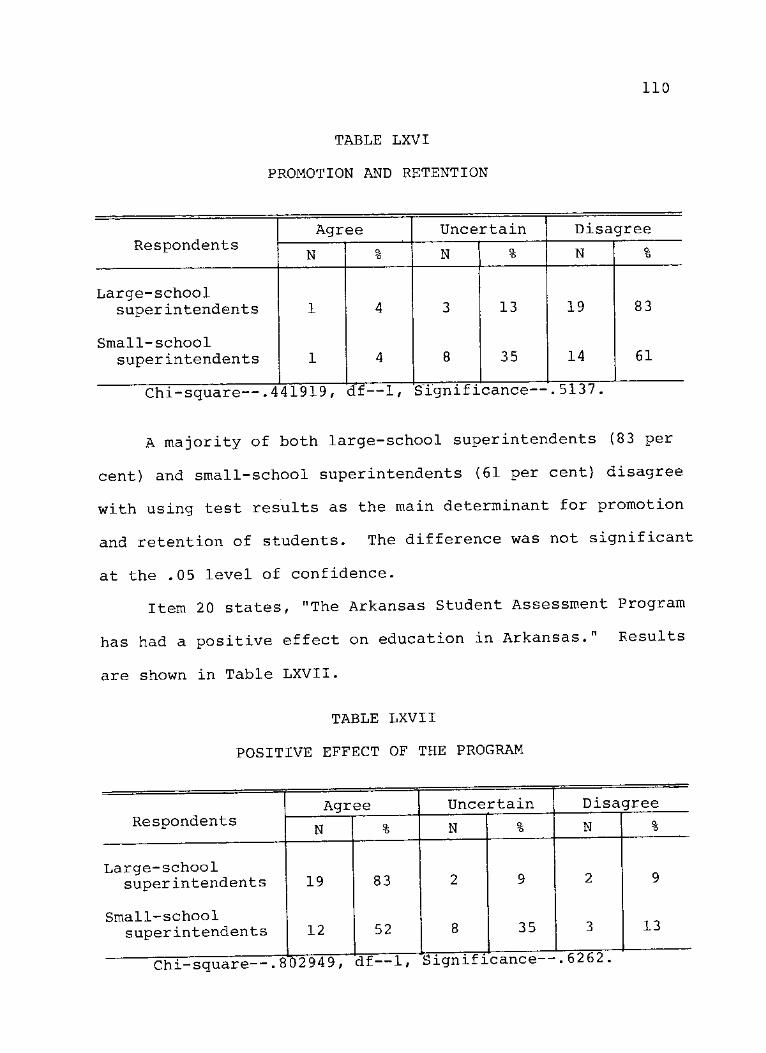
TABLE LXVI
PROMOTION AND RETENTION
110
Respondents Agree Uncertain Disagree
Respondents N % N Q.
"o N Q. "o
Large-school superintendents 1 4 3 13 19 83
Small-school superintendents 1 4 8 35 14 61
Chi-square—.441919, df—1, Significance—
A majority of both large-school superintendents (83 per
cent) and small-school superintendents (61 per cent) disagree
with using test results as the main determinant for promotion
and retention of students. The difference was not significant
at the .05 level of confidence.
Item 20 states, "The Arkansas Student Assessment Program
has had a positive effect on education in Arkansas." Results
are shown in Table LXVII.
TABLE LXVII
POSITIVE EFFECT OF THE PROGRAM
Agree Uncertain Disagree Respondents
N O. *6 N % N a
"O
Large-school superintendents 19 83 2 9 2 9
Small-school superintendents 12 52 8 35 3 13
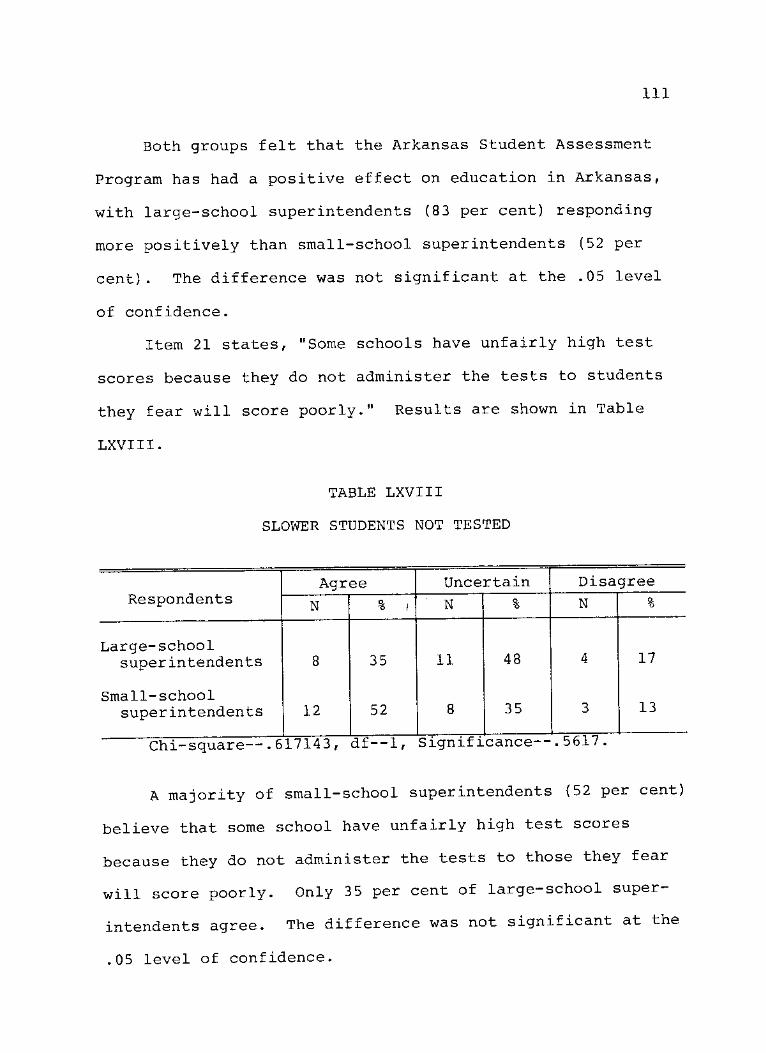
Ill
Both groups felt that the Arkansas Student Assessment
Program has had a positive effect on education in Arkansas,
with large-school superintendents (83 per cent) responding
more positively than small-school superintendents (52 per
cent). The difference was not significant at the .05 level
of confidence.
Item 21 states, "Some schools have unfairly high test
scores because they do not administer the tests to students
they fear will score poorly." Results are shown in Table
LXVIII.
TABLE LXVIII
SLOWER STUDENTS NOT TESTED
Respondents Agree Uncertain Disagree
Respondents N % / N % N %
Large-school superintendents 8 35 11 48 4 17
Small-school super intendents 12 52 8 35 3 13
Chi-square--.617143, df—1, Significance
A majority of small—school superintendents (52 per cent)
believe that some school have unfairly high test scores
because they do not administer the tests to those they fear
will score poorly. Only 3 5 per cent of large-school super-
intendents agree. The difference was not significant at the
.05 level of confidence.

112
Item 22 states, "As a result of the Arkansas Student
Assessment Program, most schools have developed a remedial
program to assist low-scoring students to improve their
basic skills." Results are shown in Table LXIX.
TABLE LXIX
REMEDIAL PROGRAMS DEVELOPED
Respondents Agree Uncertain Disagree
Respondents N % N % N o
"o
Large-school super intendents 8 35 9 39 6 26
Small-school superintendents 8 35 10 43 5 22
Chi-square—.053946, df—1, Significance—.8115
There was a great deal of similarity between the
responses of the two groups concerning the development of a
remedial program to help low-scoring students. Among large-
school superintendents, 8 (35 per cent) agreed that most
schools have set up a remedial program, while 6 (26 per cent)
disagreed. Among small-school superintendents, 8 (35 per
cent) agreed and 5 (22 per cent) disagreed. The difference
was not significant at the .05 level of confidence.
Item 23 states, "Every grade should be tested every
year." Results are shown in Table LXX.
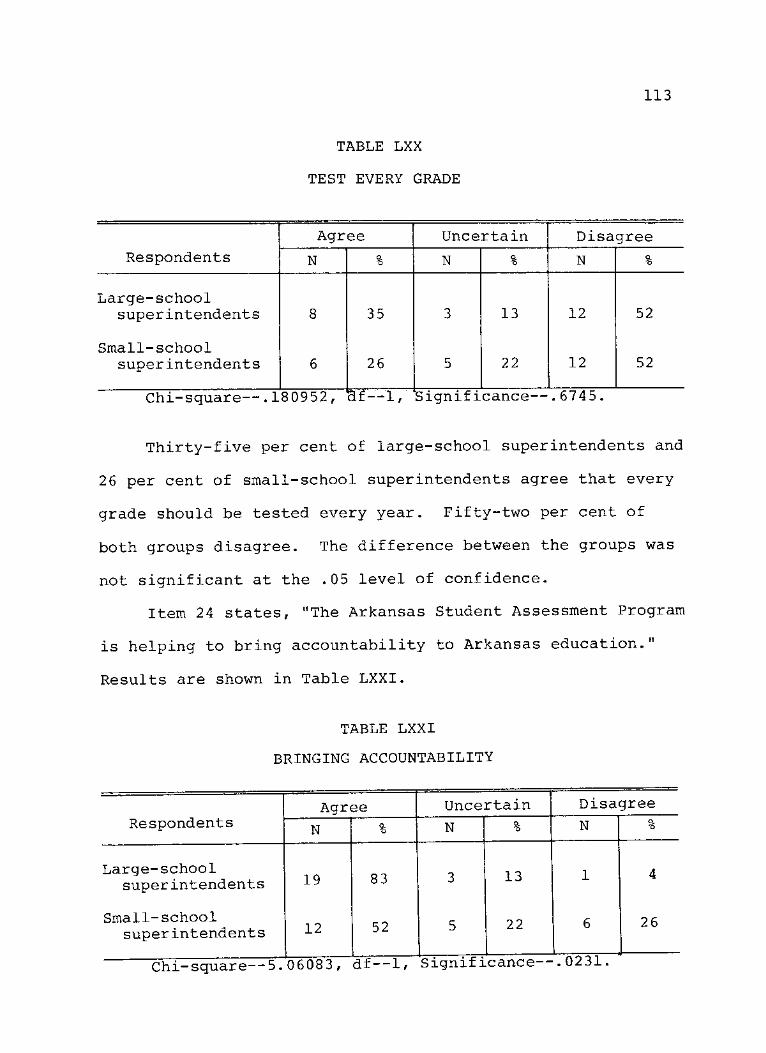
TABLE LXX
TEST EVERY GRADE
113
Agree Uncertain Disagree Respondents N a
*6 N Q, *8 N Q. *o
Large-school superintendents 8 35 3 13 12 52
Small-school superintendents 6 26 5 22 12 52
Chi-square—.180952, Hf—1,
Thirty-five per cent of large-school superintendents and
26 per cent of small-school superintendents agree that every
grade should be tested every year. Fifty-two per cent of
both groups disagree. The difference between the groups was
not significant at the .05 level of confidence.
Item 24 states, "The Arkansas Student Assessment Program
is helping to bring accountability to Arkansas education."
Results are shown in Table LXXI.
TABLE LXXI
BRINGING ACCOUNTABILITY
Agree Uncertain Disagree Respondents N q. "6 N % N %
Large-school superintendents 19 83 3 13 1 4
Small-school superintendents 12 52 5 22 6 26
Chi-square—5. 06083, df—1, Significance— •.0231.
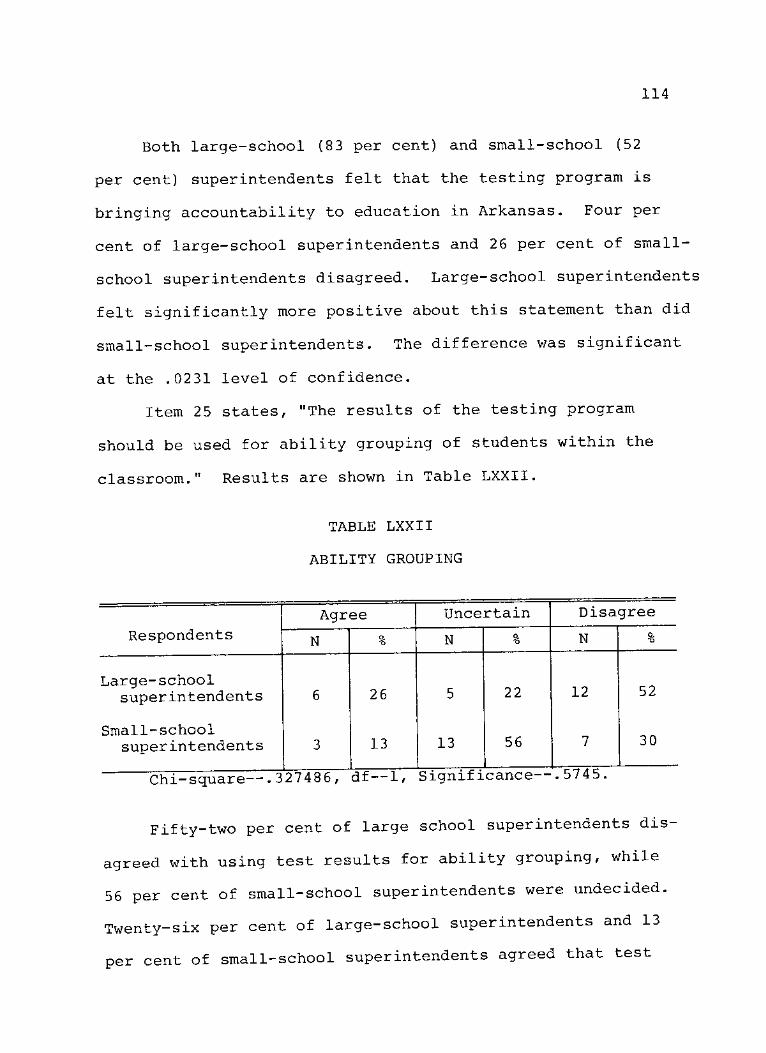
114
Both large-school (83 per cent) and small-school (52
per cent) superintendents felt that the testing program is
bringing accountability to education in Arkansas. Four per
cent of large-school superintendents and 26 per cent of small-
school superintendents disagreed. Large-school superintendents
felt significantly more positive about this statement than did
small-school superintendents. The difference was significant
at the .0231 level of confidence.
Item 25 states, "The results of the testing program
should be used for ability grouping of students within the
classroom." Results are shown in Table LXXII.
TABLE LXXII
ABILITY GROUPING
Respondents
Large-school superintendents
Small-school super intendents
Agree
N
26
13
Uncertain
N
13
22
56
Disagree
N
12
7
52
30
Chi-square—. 327486, df—1, Significance—. 5745.
Fifty-two per cent of large school superintendents dis
agreed with using test results for ability grouping, while
56 per cent of small-school superintendents were undecided.
Twenty-six per cent of large-school superintendents and 13
per cent of small-school superintendents agreed that test
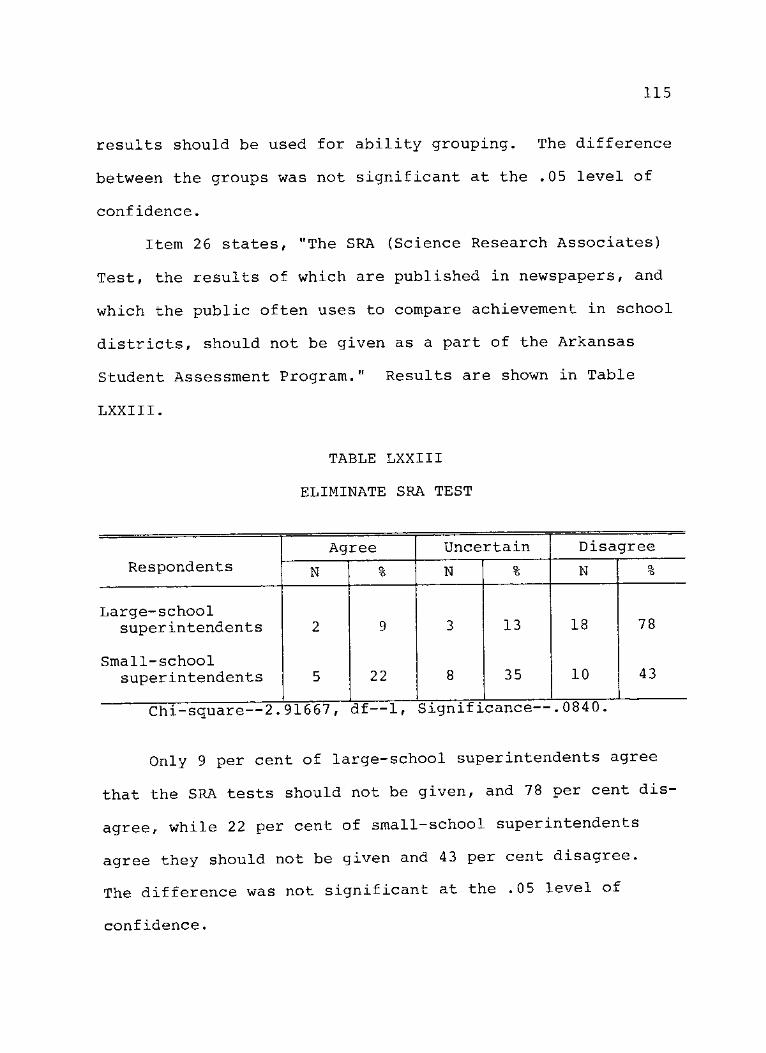
115
results should be used for ability grouping. The difference
between the groups was not significant at the .05 level of
confidence.
Item 26 states, "The SRA (Science Research Associates)
Test, the results of which are published in newspapers, and
which the public often uses to compare achievement in school
districts, should not be given as a part of the Arkansas
Student Assessment Program." Results are shown in Table
LXXIII.
TABLE LXXIII
ELIMINATE SRA TEST
Agree Uncertain Disagree Respondents N o,
"o N % N Q. "O
Large-school superintendents 2 9 3 13 18 78
Small-school superintendents 5 22 8 35 10 43
Chi-square—2.91667, df—1, Significance-
Only 9 per cent of large-school superintendents agree
that the SRA tests should not be given, and 78 per cent dis-
agree, while 22 per cent of small-school superintendents
agree they should not be given and 43 per cent disagree.
The difference was not significant at the .05 level of
confidence.

116
Item 27 states, "The news media should not publish scores
so that comparisons between school districts can be made."
Results are shown in Table LXXIV.
TABLE LXXIV
NOT PUBLISH SCORES FOR COMPARISON
Respondents Agree Uncertain Disagree
Respondents N o. N Q. 'O N Q. "O
Large-school super intendents 7 30 5 22 11 48
Small-school superintendents 8 35 6 26 9 39
Chi-square—.23829, df—1, Significance—.6315
Neither large-school superintendents (agree 30 per cent,
disagree 48 per cent) nor small-school superintendents (agree
35 per cent, disagree 39 per cent) have a majority of responses
in either category. The difference between the groups was not
significant at the .05 level of confidence.
Item 28 states, "Some teachers unfairly 'coach' students,
or give them answers to the test questions during the adminis-
tration of the test." Results are shown in Table LXXV.
A large percentage of both large- (56 per cent) and
small- (48 per cent) school superintendents are uncertain
about whether some teachers "coach" students during the test
administration. Among large-school superintendents, 22 per
cent agree and 22 per cent disagree, while among small-school
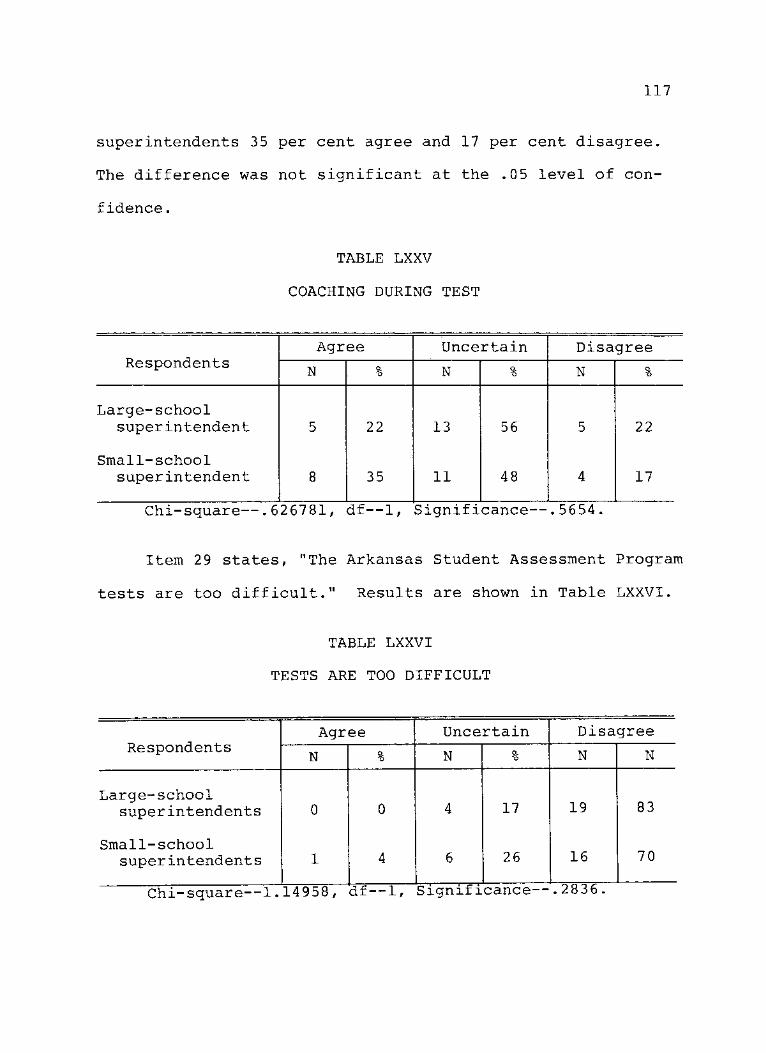
117
superintendents 35 per cent agree and 17 per cent disagree.
The difference was not significant at the .05 level of con-
fidence.
TABLE LXXV
COACHING DURING TEST
Respondents Agree Uncertain Disagree
Respondents N a "O N Q . "O N %
Large-school superintendent 5 22 13 56 5 22
Small-school superintendent 8 35 11 48 4 17
Chi-square—.626781, df—1, Significance—.5654,
Item 29 states, "The Arkansas Student Assessment Program
tests are too difficult." Results are shown in Table LXXVI.
TABLE LXXVI
TESTS ARE TOO DIFFICULT
Respondents Agree Uncertain Disagree
Respondents N % N O,
"O N N
Large-school 17 19 83 superintendents 0 0 4 17 19 83
Small-school 70 superintendents 1 4 6 26 16 70
Chi-square—1. 14958,
i—1
1 1 Significance— .2836.

118
Nineteen (83 per cent) large-school superintendents dis-
agree that the tests are too difficult, while 16 (70 per cent)
of small-school superintendents disagree. The difference was
not significant at the .05 level of confidence.
Item 30 states, "The results should be used for tracking
students (placing students in an academic program which fits
their abilities and interests—college prep, vocational,
etc.)." Results are shown in Table LXXVII.
TABLE LXXVII
RESULTS USED FOR TRACKING
Respondents Agree Uncertain Disagree
Respondents N o,
•6 N o. *o N Q. 'O
Large-school superintendents 7 30 1 4 15 65
Small-school superintendents 8 35 5 22 10 43
Chi-square—. 673401, df—1, Significance—
Large-school superintendents (30 per cent agree and 65
pgj- c e nt disagree) were more negative toward using the test
results to track students than were the small—school super-
intendents (35 per cent agree and 43 per cent disagree). The
difference, however, was not significant at the .05 level of
confidence.
Item 31 states, "Social studies should be added to the
subjects tested." Results are shown in Table LXXVIII.
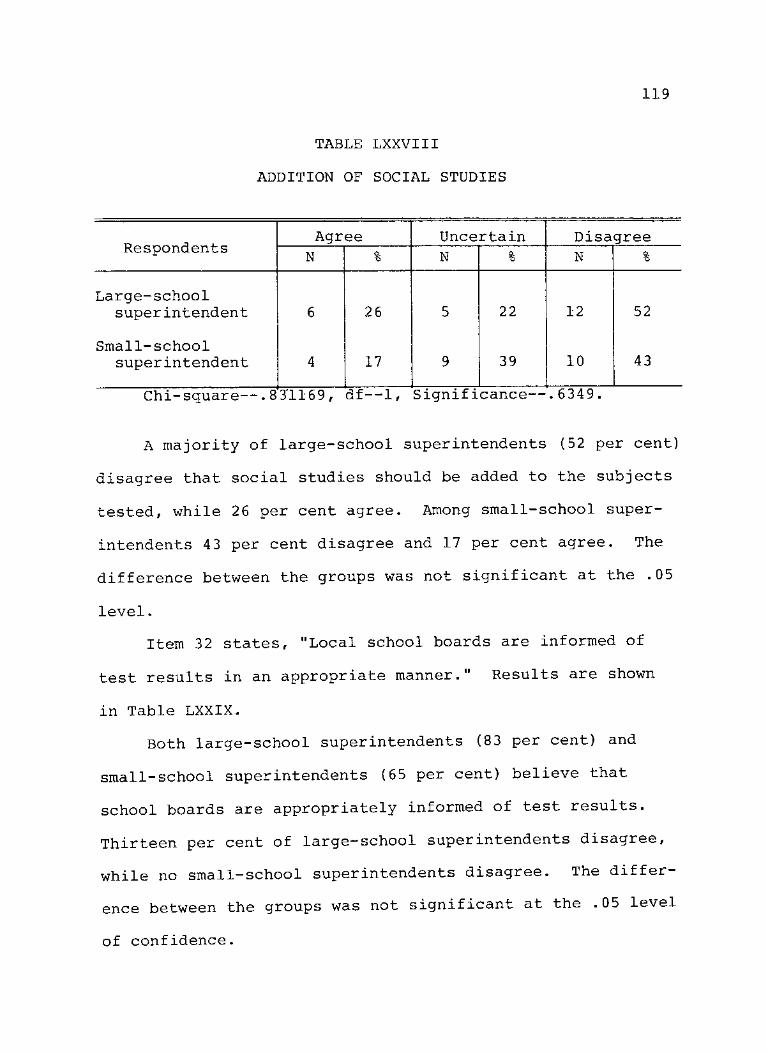
TABLE LXXVIII
ADDITION OF SOCIAL STUDIES
119
Respondents Agree Uncertain Disagree
Respondents N % N a
"6 N %
Large-school super intendent 6 26 5 22 12 52
Small-school superintendent 4 17 9 39 10 43
Chi-square—. 83'1169, df—1, Significance—.6349
A majority of large-school superintendents (52 per cent)
disagree that social studies should be added to the subjects
tested, while 26 per cent agree. Among small-school super-
intendents 43 per cent disagree and 17 per cent agree. The
difference between the groups was not significant at the .05
level.
Item 32 states, "Local school boards are informed of
test results in an appropriate manner." Results are shown
in Table LXXIX.
Both large-school superintendents (83 per cent) and
small-school superintendents (65 per cent) believe that
school boards are appropriately informed of test results.
Thirteen per cent of large-school superintendents disagree,
while no small—school superintendents disagree. The differ-
ence between the groups was not significant at the .05 level
of confidence.
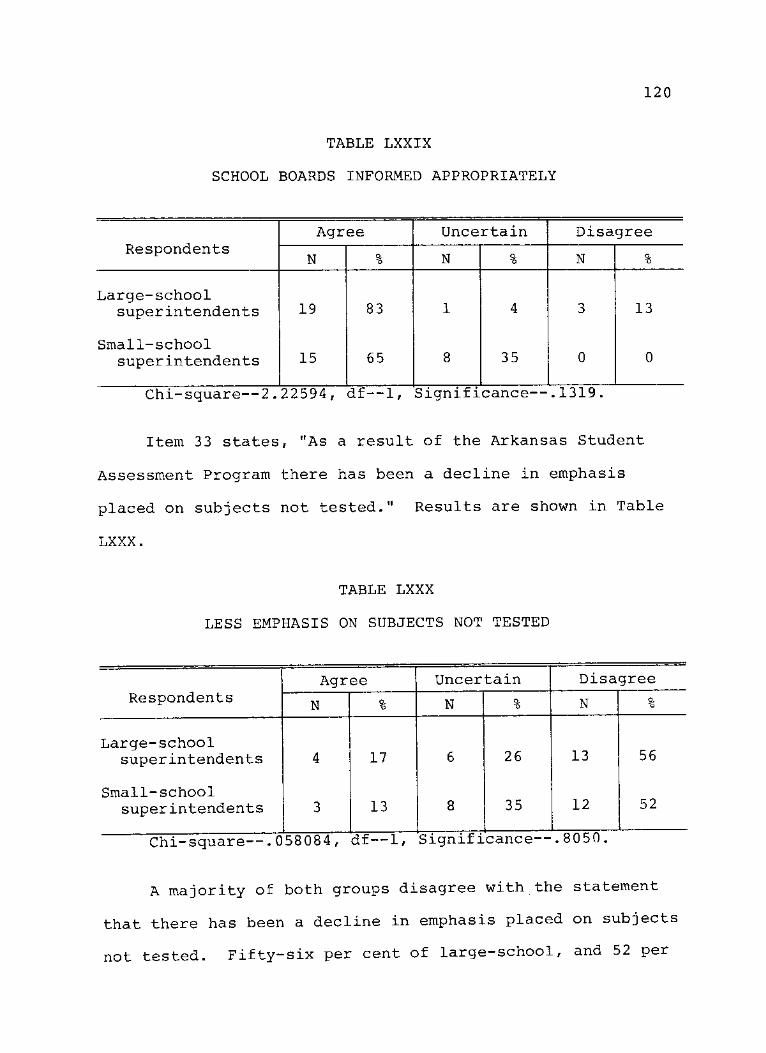
TABLE LXXIX
SCHOOL BOARDS INFORMED APPROPRIATELY
120
Respondents Agree Uncertain Disagree
Respondents N Q. "O N Q.
*o N %
Large-school superintendents 19 83 1 4 3 13
Small-school superintendents 15 65 8 35 0 0
Chi-square—2.22594, df—1, Significance—.1319
Item 33 states, "As a result of the Arkansas Student
Assessment Program there has been a decline in emphasis
placed on subjects not tested." Results are shown in Table
LXXX.
TABLE LXXX
LESS EMPHASIS ON SUBJECTS NOT TESTED
Respondents Agree Uncertain Disagree
Respondents N a "o N % N Q.
*o
Large-school 26 13 56 superintendents 4 17 6 26 13 56
Small-school 12 52 super intendents 3 13 8 35 12 52
Chi-square—. 058084, df—1, Significance—
A majority of both groups disagree with the statement
that there has been a decline in emphasis placed on subjects
not tested. Fifty-six per cent of large-school, and 52 per
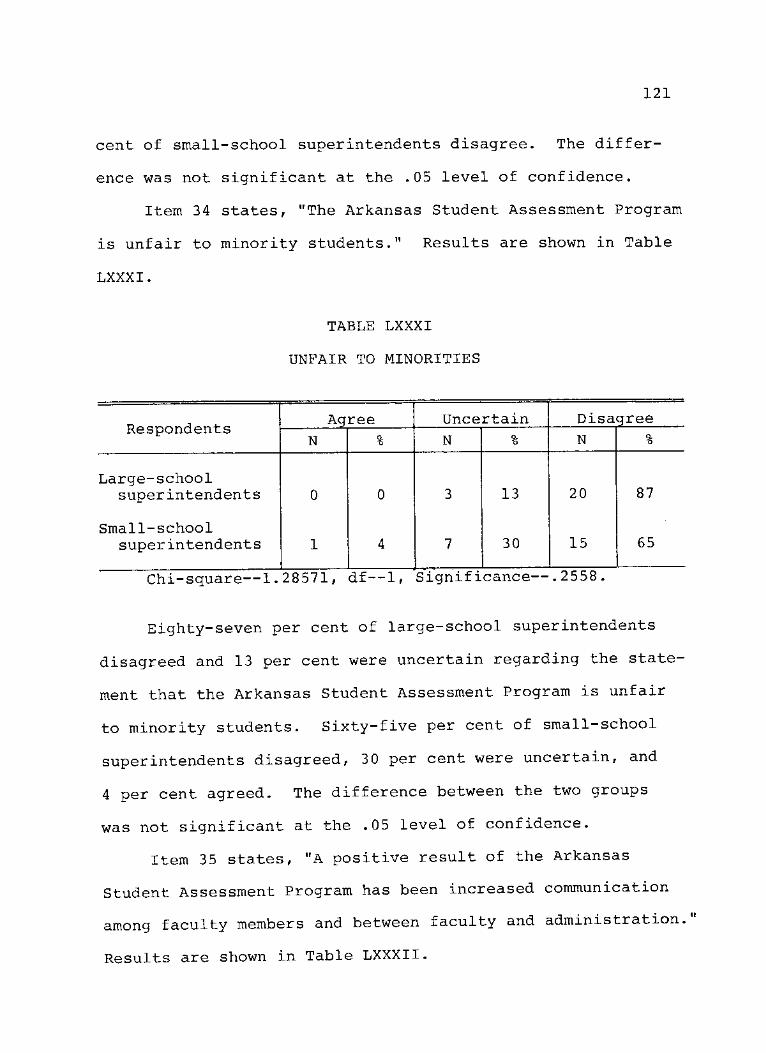
121
cent of small-school superintendents disagree. The differ-
ence was not significant at the .05 level of confidence.
Item 34 states, "The Arkansas Student Assessment Program
is unfair to minority students." Results are shown in Table
LXXXI.
TABLE LXXXI
UNFAIR TO MINORITIES
Respondents Agree Uncertain Disagree
Respondents N a
'O N O. "O N O.
Large-school superintendents 0 0 3 13 20 87
Small-school superintendents 1 4 7 30 15 65
Chi-square—1.28571, df—1, Significance—.2558
Eighty-seven per cent of large-school superintendents
disagreed and 13 per cent were uncertain regarding the state-
ment that the Arkansas Student Assessment Program is unfair
to minority students. Sixty-five per cent of small-school
superintendents disagreed, 30 per cent were uncertain, and
4 per cent agreed. The difference between the two groups
was not significant at the .05 level of confidence.
Item 35 states, "A positive result of the Arkansas
Student Assessment Program has been increased communication
among faculty members and between faculty and administration.
Results are shown in Table LXXXII.
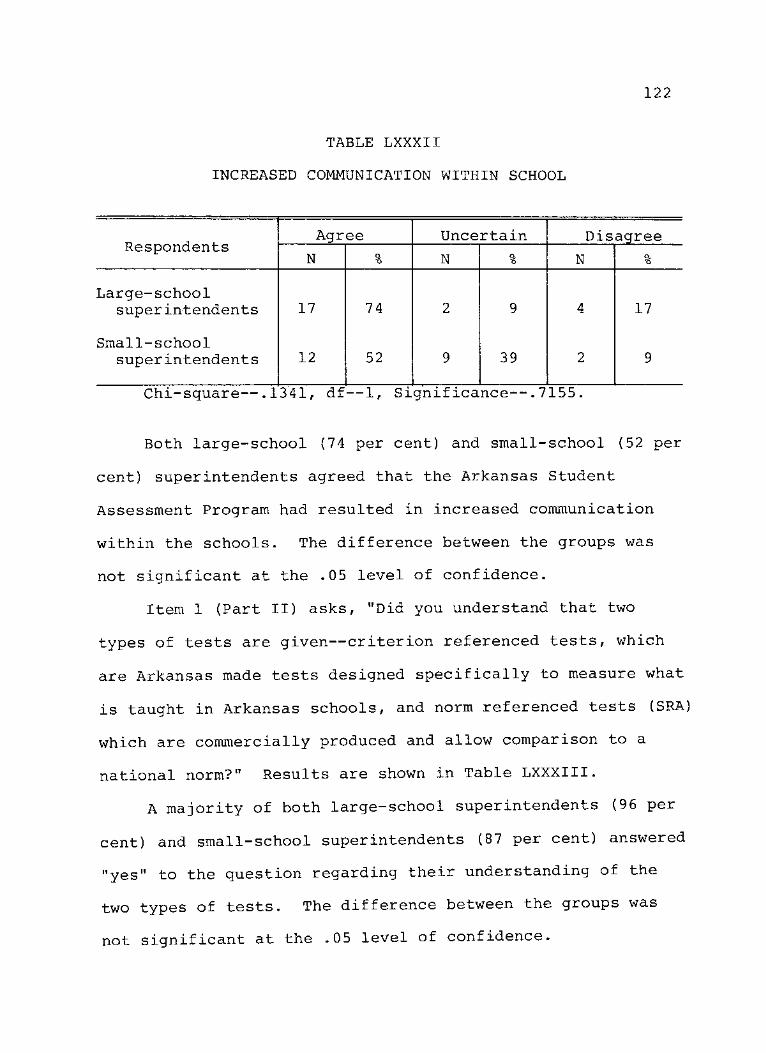
122
TABLE LXXXII
INCREASED COMMUNICATION WITHIN SCHOOL
Respondents Agree Uncertain Disagree
Respondents N o,
"o N Q. -Q N %
Large-school superintendents 17 74 2 9 4 17
Small-school superintendents 12 52 9 39 2 9
Chi-square—.1341, df—1, Significance—.7155.
Both large-school (74 per cent) and small-school (52 per
cent) superintendents agreed that the Arkansas Student
Assessment Program had resulted in increased communication
within the schools. The difference between the groups was
not significant at the .05 level of confidence.
Item 1 (Part II) asks, "Did you understand that two
types of tests are given—criterion referenced tests, which
are Arkansas made tests designed specifically to measure what
is taught in Arkansas schools, and norm referenced tests (SRA)
which are commercially produced and allow comparison to a
national norm?" Results are shown in Table LXXXIII.
A majority of both large-school superintendents (96 per
cent) and small-school superintendents (87 per cent) answered
"yes" to the question regarding their understanding of the
two types of tests. The difference between the groups was
not significant at the .05 level of confidence.
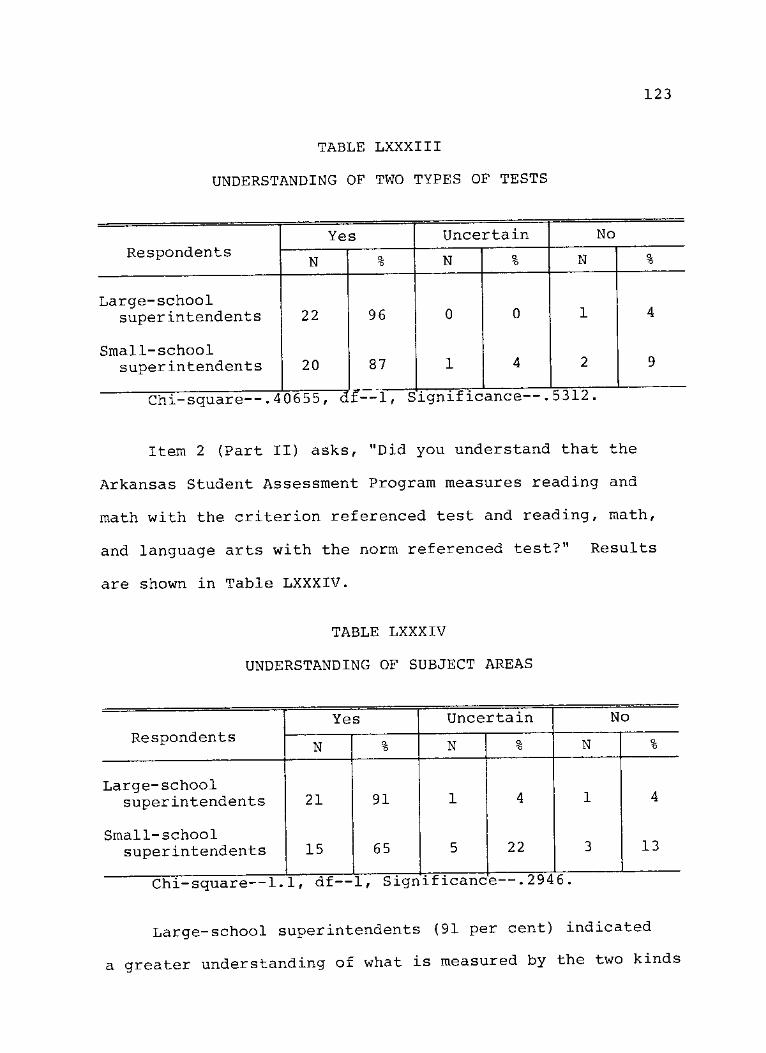
123
TABLE LXXXIII
UNDERSTANDING OF TWO TYPES OF TESTS
Respondents Yes Uncertain No
Respondents N % N % N a
*5
Large-school superintendents 2 2 9 6 0 0 1 4
Small-school superintendents 2 0 8 7 1 4 2 9
Chi-square—.40655, df—1, Significance
Item 2 (Part II) asks, "Did you understand that the
Arkansas Student Assessment Program measures reading and
math with the criterion referenced test and reading, math,
and language arts with the norm referenced test?" Results
are shown in Table LXXXIV.
TABLE LXXXIV
UNDERSTANDING OF SUBJECT AREAS
Respondents Yes Uncertain No
Respondents N a *6 N Q. "o N a *6
Large-school super intendents 21 91 1 4 1 4
Small-school 13 superintendents 15 65 5 22 3 13
Chi-square—1.1, df—1, Significance—.2946
Large-school superintendents (91 per cent) indicated
a greater understanding of what is measured by the two kinds

124
of tests than did small-school superintendents (65 per cent)
The difference was not significant at the .05 level of con-
fidence.
Item 3 (Part II) asks, "Did you understand that the
criterion referenced tests are administered to grades 3, 6,
and 8; and the norm referenced tests are administered to
grade 4 and two other grades?" Results are shown in Table
LXXXV.
TABLE LXXXV
UNDERSTANDING OF GRADES TESTED
Respondents Yes Uncertain No
Respondents N o,
"O N Q. "O N %
Large-school super intendents 22 96 1 4 0 0
Small-school superintendents 18 78 2 9 3 15
Chi-square—3.37857, df—1, Significance—.0628
Large-school superintendents (96 per cent) indicated a
greater understanding of the grades to which the tests are
administered than did small-school superintendents (74 per
cent). The difference was not significant at the .05 level
of confidence.
Item 4 (Part II) asks, "Did you understand that the
purposes of the statewide testing program were to (1) measure
pupil performance in basic subjects, (2) provide data on
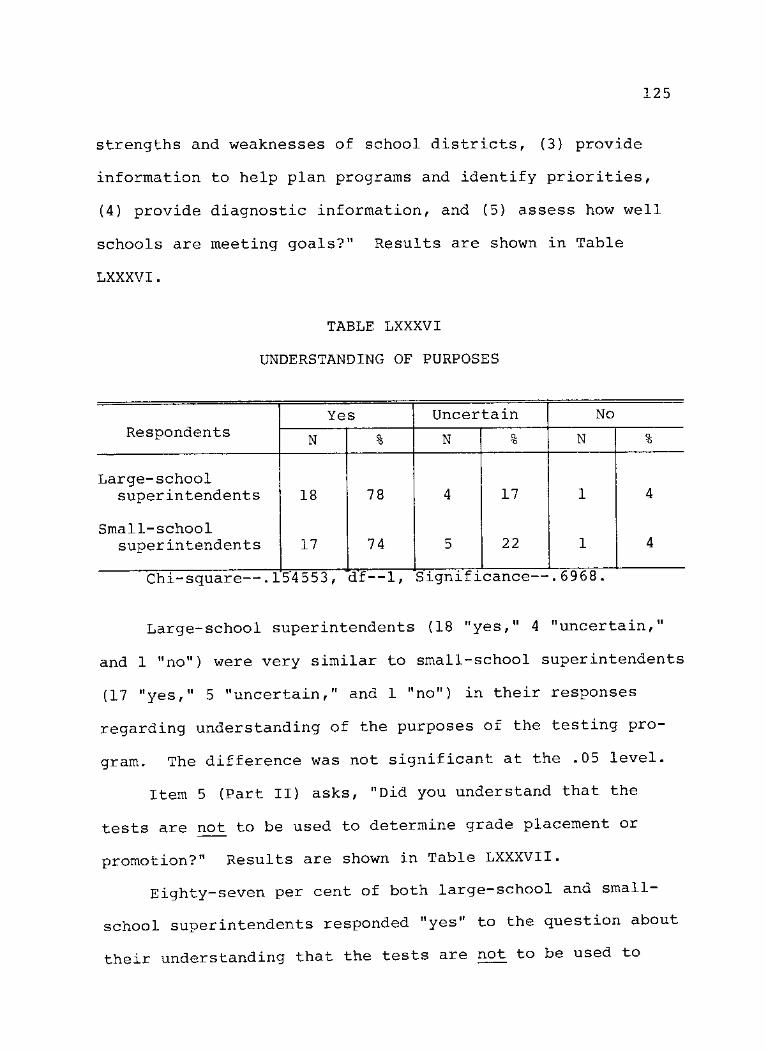
125
strengths and weaknesses of school districts, (3) provide
information to help plan programs and identify priorities,
(4) provide diagnostic information, and (5) assess how well
schools are meeting goals?" Results are shown in Table
LXXXVI.
TABLE LXXXVI
UNDERSTANDING OF PURPOSES
Respondents Yes Uncertain No
Respondents N % N a "o N %
Large-school superintendents 18 78 4 17 1 4
Small-school super intendents 17 74 5 22 1 4
Chi-square—. 15'4553, df—1, Significance—.6968
Large-school superintendents (18 "yes," 4 "uncertain,"
and 1 "no") were very similar to small-school superintendents
(17 "yes," 5 "uncertain," and 1 "no") in their responses
regarding understanding of the purposes of the testing pro-
gram. The difference was not significant at the .05 level.
Item 5 (Part II) asks, "Did you understand that the
tests are not to be used to determine grade placement or
promotion?" Results are shown in Table LXXXVII.
Eighty—seven per cent of both large-school and small-
school superintendents responded "yes" to the question about
their understanding that the tests are not to be used to

126
determine grade placement or promotion. No large-school
superintendents, and only 1 small-school superintendent,
answered negatively. The difference between the groups was
not significant at the .05 level of confidence.
TABLE LXXXVII
UNDERSTANDING OF LIMITATIONS OF USE
Yes Uncertain No Respondents N 0- N % N o.
"o
Large-school superintendents 20 87 3 13 0 0
Small-school superintendents 2 0 87 2 9 1 4
Chi-square—.976191, df—1, Significance—
Hypotheses Related to Large-School Superintendents and Small-School Superintendents
In order to test these hypotheses, responses were
assigned a value. Positive responses, or responses which
were positive toward the current Arkansas Student Assess-
ment Program, were assigned a value of 3; uncertain
responses were assigned a value of 2, and negative responses,
or responses negative toward the current Arkansas Student
Assessment Program as it now exists, were assigned a value
of 1. Questions relating to each hypothesis were grouped,
and a total score for each respondent on each hypothesis was

127
calculated. A Kruskal-Wallis one-way analysis of variance
by ranks was run on each hypothesis. The .05 level of sig-
nificance was used to determine if differences between groups
were significant.
Hypothesis 8a states, "There is no significant differ-
ence between superintendents of large school districts and
superintendents of small school districts in their under-
standing of the Arkansas Student Assessment Program." Items
related to this hypothesis are numbers 1, 2, 3, 4, and 5 on
the last page of the questionnaire. Results are shown in
Table LXXXVIII.
TABLE LXXXVIII
UNDERSTANDING OF TESTING PROGRAM
Groups Mean Rank
Large-school superintendents 25.93
Small-school superintendents 21.07
H—1.8601, df—1, Significance—.1726.
Large-school superintendents (mean rank, 25.93) indi-
cated a greater understanding of the Arkansas Student
Assessment Program than did small—school superintendents
(mean rank, 21.07). The difference between the groups was
not significant at the .05 level of confidence; therefore,
the null hypothesis is accepted.

128
Hypothesis 8b states, "There is no significant differ-
ence between superintendents of large school districts and
superintendents of small school districts in their perception
of the adequacy of the Arkansas Student Assessment Program."
Items related to this hypothesis are numbers 4, 6, 9, and 29.
Results are shown in Table LXXXIX.
TABLE LXXXIX
ADEQUACY OF PROGRAM
Groups Mean Rank
Large-school superintendents 19.89
Small-school superintendents 27.11
H—3.5016, df—1, Significance—.0613.
Small-school superintendents (mean rank, 27.11) recorded
more positive responses toward the adequacy of the present
Arkansas Student Assessment Program than did large-school
superintendents (mean rank, 19.89). However, the difference
was not significant at the .05 level of confidence. The null
hypothesis, therefore, is accepted.
Hypothesis 8c states, "There is no significant differ-
ence between superintendents of large school districts and
superintendents of small school districts in their perception
of the fairness of the Arkansas Student Assessment Program."
Items related to this hypothesis are numbers 5, 11, 17, 21,
28, and 34. Results are shown in Table XC.
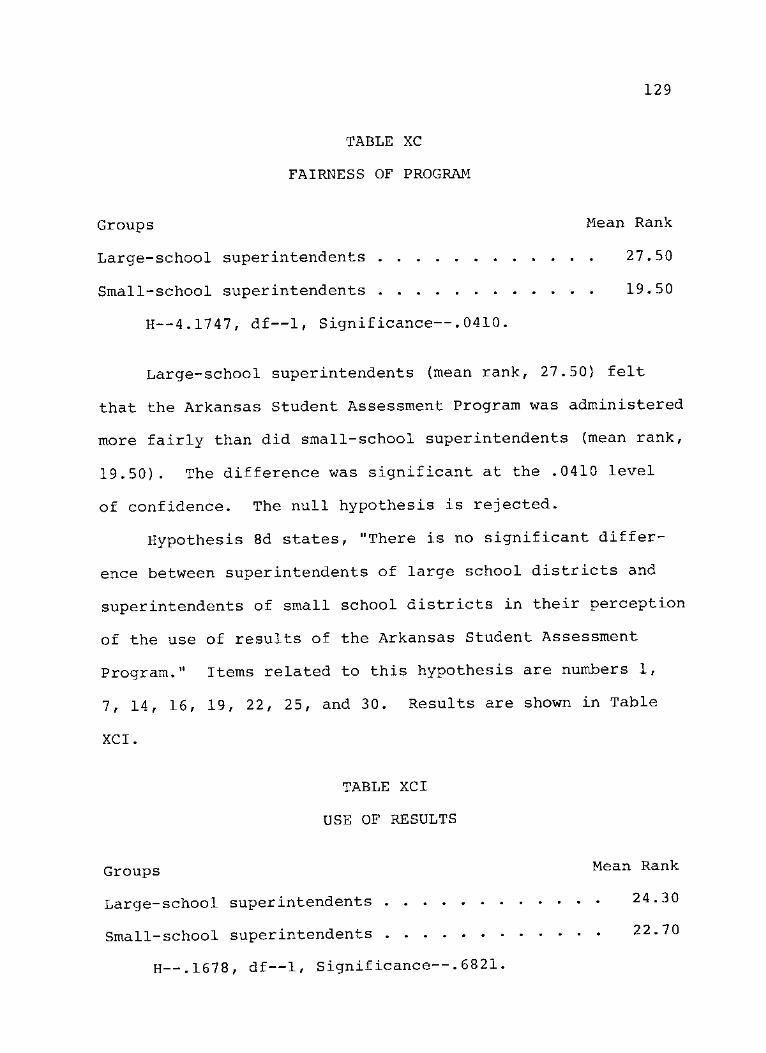
129
TABLE XC
FAIRNESS OF PROGRAM
Groups Mean Rank
Large-school superintendents 27.50
Small-school superintendents 19.50
H—4.1747, df—1, Significance--.0410.
Large-school superintendents (mean rank, 27.50) felt
that the Arkansas Student Assessment Program was administered
more fairly than did small-school superintendents (mean rank,
19.50). The difference was significant at the .0410 level
of confidence. The null hypothesis is rejected.
Hypothesis 8d states, "There is no significant differ-
ence between superintendents of large school districts and
superintendents of small school districts in their perception
of the use of results of the Arkansas Student Assessment
Program." Items related to this hypothesis are numbers 1,
7, 14, 16, 19, 22, 25, and 30. Results are shown in Table
XCI.
TABLE XCI
USE OF RESULTS
Groups Mean Rank
Large-school superintendents 24.30
Small-school superintendents 22.70
H—.1678, df—1, Significance—.6821.
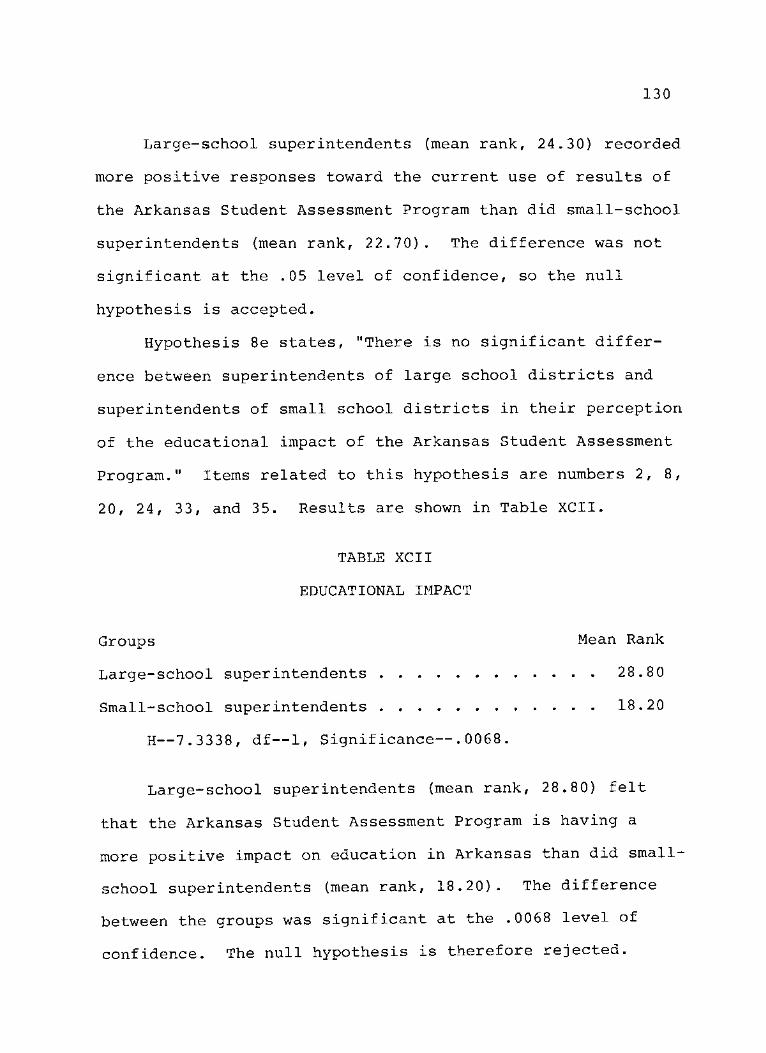
130
Large-school superintendents (mean rank, 24.30) recorded
more positive responses toward the current use of results of
the Arkansas Student Assessment Program than did small-school
superintendents (mean rank, 22.70). The difference was not
significant at the .05 level of confidence, so the null
hypothesis is accepted.
Hypothesis 8e states, "There is no significant differ-
ence between superintendents of large school districts and
superintendents of small school districts in their perception
of the educational impact of the Arkansas Student Assessment
Program." Items related to this hypothesis are numbers 2, 8,
20, 24, 33, and 35. Results are shown in Table XCII.
TABLE XCII
EDUCATIONAL IMPACT
Groups Mean Rank
Large-school superintendents 28.80
Small-school superintendents 18.20
H — 7.3338, df—1, Significance—. 0068.
Large-school superintendents (mean rank, 28.80) felt
that the Arkansas Student Assessment Program is having a
more positive impact on education in Arkansas than did small-
school superintendents (mean rank, 18.20). The difference
between the groups was significant at the .0068 level of
confidence. The null hypothesis is therefore rejected.
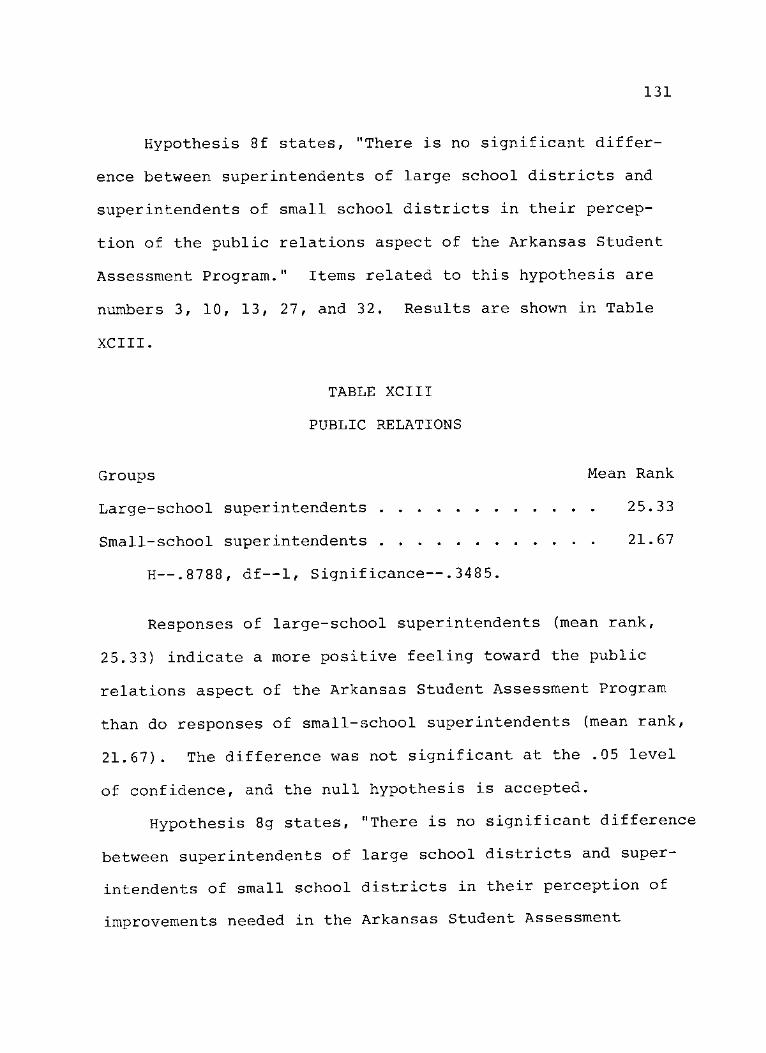
131
Hypothesis 8f states, "There is no significant differ-
ence between superintendents of large school districts and
superintendents of small school districts in their percep-
tion of the public relations aspect of the Arkansas Student
Assessment Program." Items related to this hypothesis are
numbers 3, 10, 13, 27, and 32. Results are shown in Table
XCIII.
TABLE XCIII
PUBLIC RELATIONS
Groups Mean Rank
Large-school superintendents 25.33
Small-school superintendents 21.67
H—.8788, df—1, Significance—.3485.
Responses of large-school superintendents (mean rank,
25.33) indicate a more positive feeling toward the public
relations aspect of the Arkansas Student Assessment Program
than do responses of small-school superintendents (mean rank,
21.67). The difference was not significant at the .05 level
of confidence, and the null hypothesis is accepted.
Hypothesis 8g states, "There is no significant difference
between superintendents of large school districts and super-
intendents of small school districts in their perception of
improvements needed in the Arkansas Student Assessment
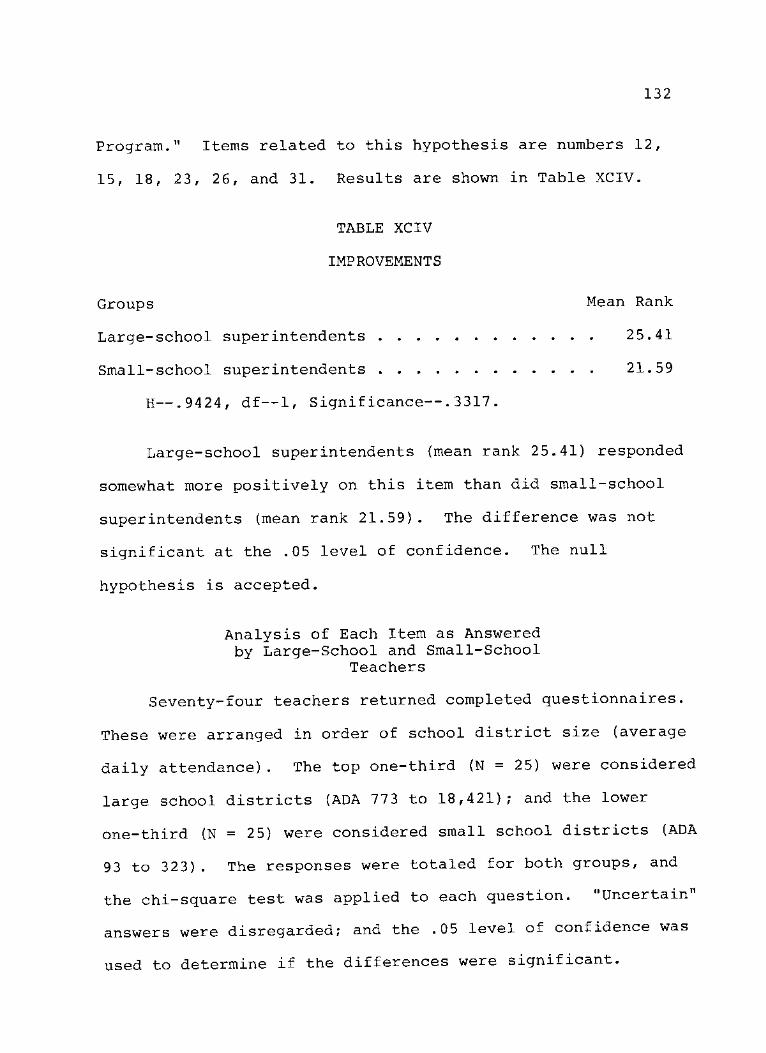
132
Program." Items related to this hypothesis are numbers 12,
15, 18, 23, 26, and 31. Results are shown in Table XCIV.
TABLE XCIV
IMPROVEMENTS
Groups Mean Rank
Large-school superintendents 25.41
Small-school superintendents 21.59
H—.9424, df—1, Significance—.3317.
Large-school superintendents (mean rank 25.41) responded
somewhat more positively on this item than did small-school
superintendents (mean rank 21.59). The difference was not
significant at the .05 level of confidence. The null
hypothesis is accepted.
Analysis of Each Item as Answered by Large-School and Small-School
Teachers
Seventy-four teachers returned completed questionnaires.
These were arranged in order of school district size (average
daily attendance). The top one-third (N = 25) were considered
large school districts (ADA 773 to 18,421); and the lower
one-third (N = 25) were considered small school districts (ADA
93 to 323). The responses were totaled for both groups, and
the chi-square test was applied to each question. "Uncertain"
answers were disregarded; and the .05 level of confidence was
used to determine if the differences were significant.
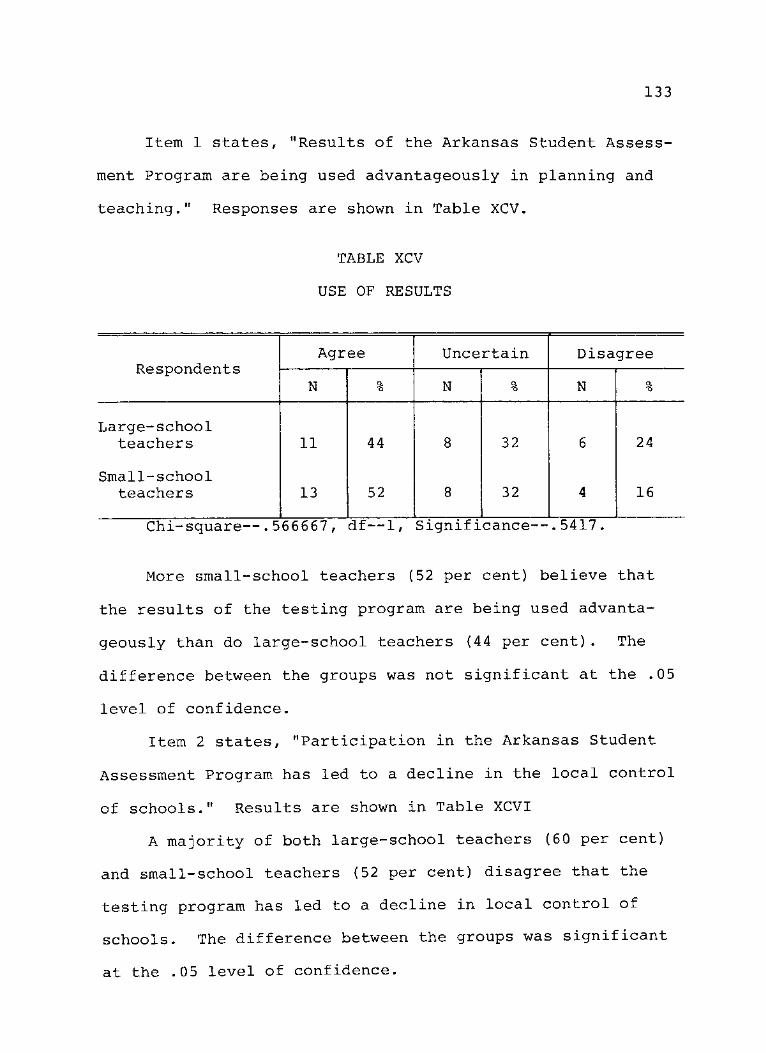
133
Item 1 states, "Results of the Arkansas Student Assess-
ment Program are being used advantageously in planning and
teaching." Responses are shown in Table XCV.
TABLE XCV
USE OF RESULTS
Respondents Agree Uncertain Disagree
Respondents N % N % N %
Large-school teachers 11 44 8 32 6 24
Small-school teachers 13 52 8 32 4 16
Chi-square—.566667, df—1, Significance—.5417
More small-school teachers (52 per cent) believe that
the results of the testing program are being used advanta-
geously than do large-school teachers (44 per cent). The
difference between the groups was not significant at the .05
level of confidence.
Item 2 states, "Participation in the Arkansas Student
Assessment Program has led to a decline in the local control
of schools." Results are shown in Table XCVI
A majority of both large-school teachers (60 per cent)
and small-school teachers (52 per cent) disagree that the
testing program has led to a decline in local control of
schools. The difference between the groups was significant
at the .05 level of confidence.
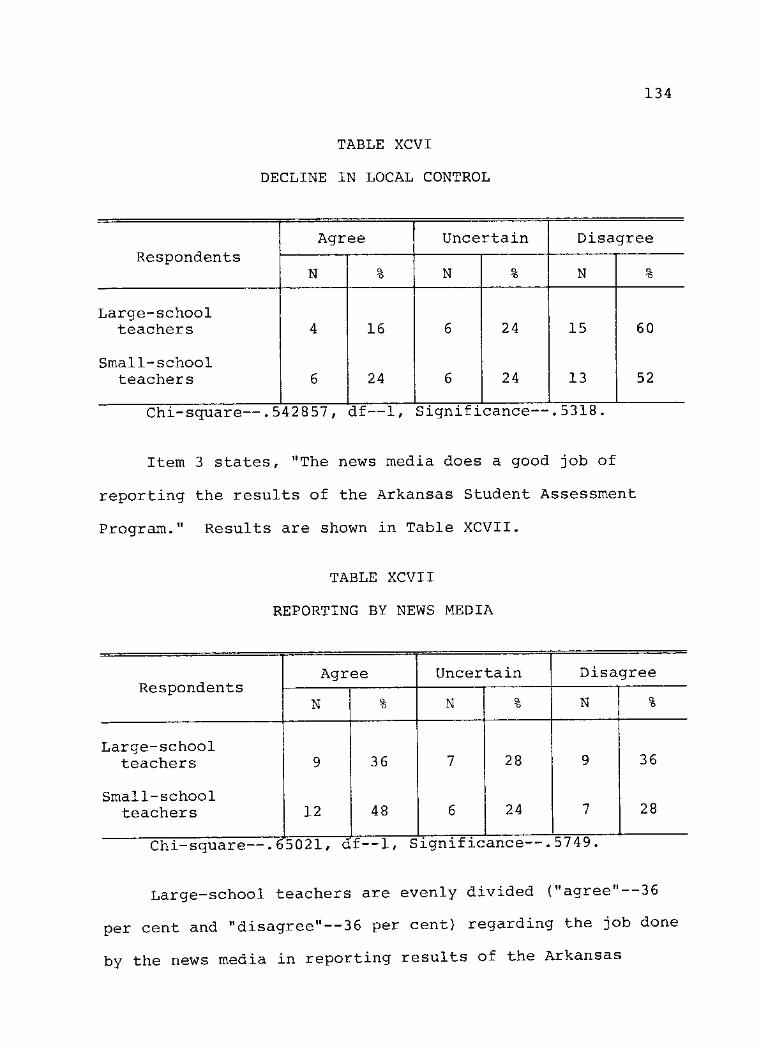
TABLE XCVI
DECLINE IN LOCAL CONTROL
134
Respondents Agree Uncertain Disagree
Respondents N Q. 'O N Q.
"6 N O. *5
Large-school teachers 4 16 6 24 15 60
Small-school teachers 6 24 6 24 13 52
Chi-square—.542857, df—1, Significance—.5318
Item 3 states, "The news media does a good job of
reporting the results of the Arkansas Student Assessment
Program." Results are shown in Table XCVII.
TABLE XCVII
REPORTING BY NEWS MEDIA
Respondents Agree Uncertain Disagree
Respondents N % N % N Q. *o
Large-school teachers 9 36 7 28 9 36
Small-school teachers 12 48 6 24 7 28
Chi-square—.65021, <if—1, Significance—.5749
Large-school teachers are evenly divided ("agree"—36
per cent and "disagree"—36 per cent) regarding the job done
by the news media in reporting results of the Arkansas
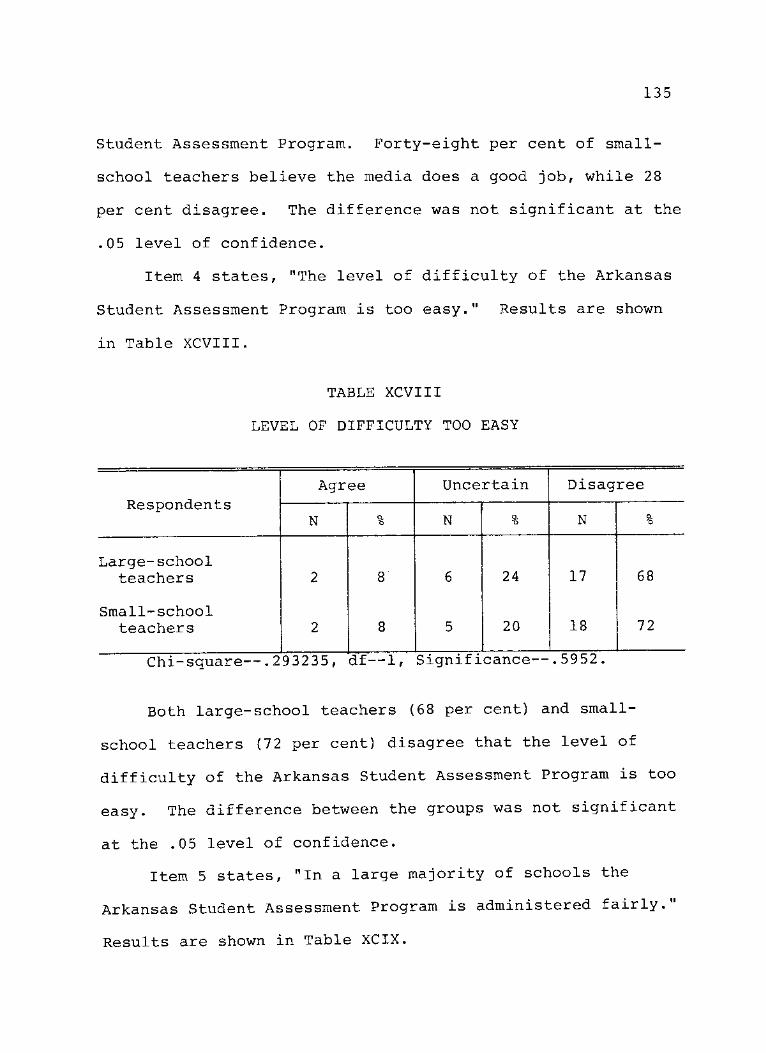
135
Student Assessment Program. Forty-eight per cent of small-
school teachers believe the media does a good job, while 28
per cent disagree. The difference was not significant at the
.05 level of confidence.
Item 4 states, "The level of difficulty of the Arkansas
Student Assessment Program is too easy." Results are shown
in Table XCVIII.
TABLE XCVIII
LEVEL OF DIFFICULTY TOO EASY
Respondents Agree Uncertain Disagree
Respondents N Q. "O N o.
*o N %
Large-school teachers 2 8 6 24 17 68
Small-school teachers 2 8 5 20 18 72
Chi-square—.293235, df—1, Significance—.5952
Both large-school teachers (68 per cent) and small-
school teachers (72 per cent) disagree that the level of
difficulty of the Arkansas Student Assessment Program is too
easy. The difference between the groups was not significant
at the .05 level of confidence.
Item 5 states, "In a large majority of schools the
Arkansas Student Assessment Program is administered fairly."
Results are shown in Table XCIX.
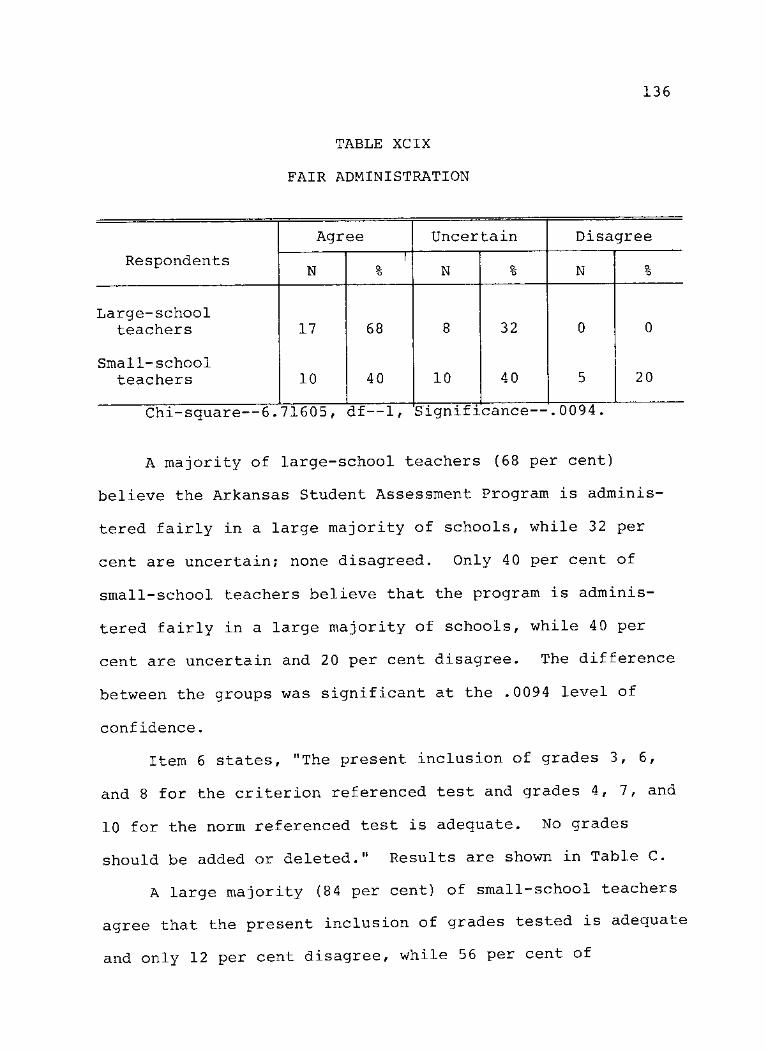
TABLE XCIX
FAIR ADMINISTRATION
136
Agree Uncertain Disagree
Respondents N
! % N % N o.
'o
Large-school teachers 17 68 8 32 0 0
Small-school teachers 10 40 10 40 5 20
Chi-square—6.71605, df—1,
A majority of large-school teachers (68 per cent)
believe the Arkansas Student Assessment Program is adminis-
tered fairly in a large majority of schools, while 32 per
cent are uncertain; none disagreed. Only 40 per cent of
small-school teachers believe that the program is adminis-
tered fairly in a large majority of schools, while 40 per
cent are uncertain and 20 per cent disagree. The difference
between the groups was significant at the .0094 level of
confidence.
Item 6 states, "The present inclusion of grades 3, 6,
and 8 for the criterion referenced test and grades 4, 7, and
10 for the norm referenced test is adequate. No grades
should be added or deleted." Results are shown in Table C.
A large majority (84 per cent) of small-school teachers
agree that the present inclusion of grades tested is adequate
and only 12 per cent disagree, while 56 per cent of
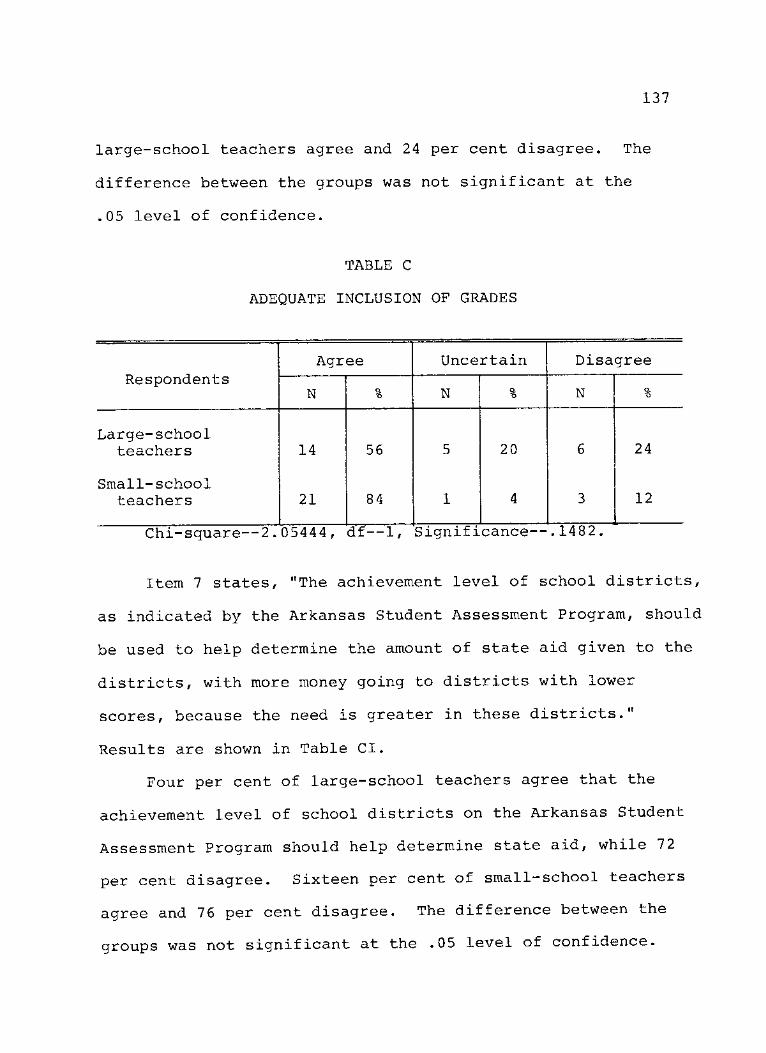
137
large-school teachers agree and 24 per cent disagree. The
difference between the groups was not significant at the
.05 level of confidence.
TABLE C
ADEQUATE INCLUSION OF GRADES
Respondents Agree Uncertain Disagree
Respondents N Q. "6 N % N a
•o
Large-school teachers 14 56 5 20 6 24
Small-school teachers 21 84 1 4 3 12
Chi-square—2.05444, df—1, Significance—.1482
Item 7 states, "The achievement level of school districts,
as indicated by the Arkansas Student Assessment Program, should
be used to help determine the amount of state aid given to the
districts, with more money going to districts with lower
scores, because the need is greater in these districts."
Results are shown in Table CI.
Four per cent of large-school teachers agree that the
achievement level of school districts on the Arkansas Student
Assessment Program should help determine state aid, while 72
per cent disagree. Sixteen per cent of small-school teachers
agree and 76 per cent disagree. The difference between the
groups was not significant at the .05 level of confidence.
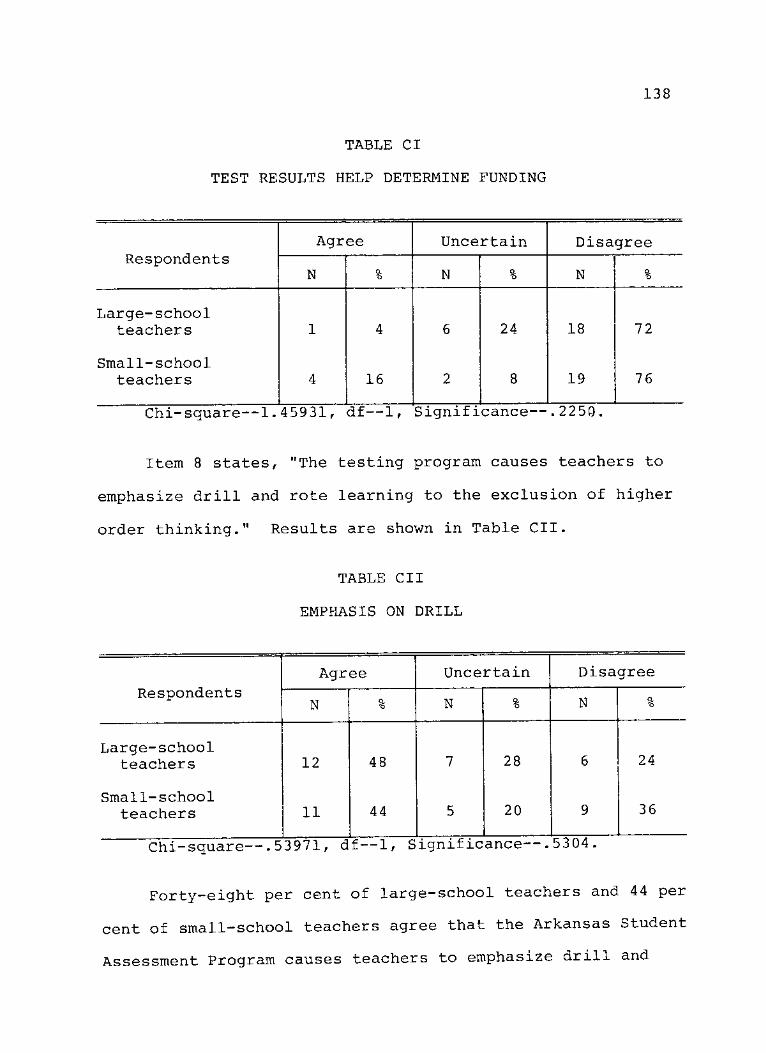
TABLE CI
TEST RESULTS HELP DETERMINE FUNDING
138
Respondents Agree Uncertain Disagree
Respondents N Q. *6 N % N %
Large-school teachers 1 4 6 24 18 72
Small-school teachers 4 16 2 8 19 76
Chi-square—1.45931, df—1, Significance—.2250
Item 8 states, "The testing program causes teachers to
emphasize drill and rote learning to the exclusion of higher
order thinking." Results are shown in Table CII.
TABLE CII
EMPHASIS ON DRILL
Respondents Agree Uncertain Disagree
Respondents N Q. "O N Q. "O N a
"o
Large-school teachers 12 48 7 28 6 24
Small-school teachers 11 44 5 20 9 36
Chi-square—.53971, df—1, Significance—.5304.
Forty-eight per cent of large-school teachers and 44 per
cent of small—school teachers agree that the Arkansas Student
Assessment Program causes teachers to emphasize drill and
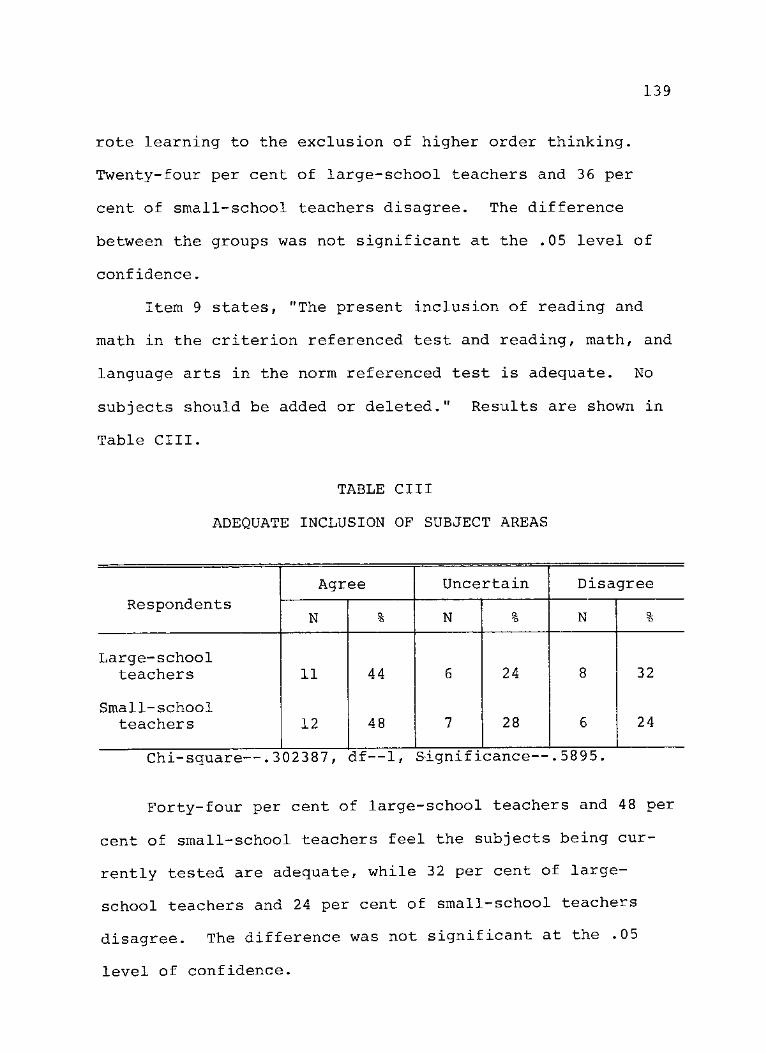
139
rote learning to the exclusion of higher order thinking.
Twenty-four per cent of large-school teachers and 36 per
cent of small-school teachers disagree. The difference
between the groups was not significant at the .05 level of
confidence.
Item 9 states, "The present inclusion of reading and
math in the criterion referenced test and reading, math, and
language arts in the norm referenced test is adequate. No
subjects should be added or deleted." Results are shown in
Table CIII.
TABLE CIII
ADEQUATE INCLUSION OF SUBJECT AREAS
Respondents Agree Uncertain Disagree
Respondents N % N % N %
Large-school teachers 11 44 6 24 8 32
Small-school teachers 12 48 7 28 6 24
Chi-square—.302387, df—1, Significance—.5895
Forty-four per cent of large-school teachers and 48 per
cent of small-school teachers feel the subjects being cur-
rently tested are adequate, while 32 per cent of large-
school teachers and 24 per cent of small-school teachers
disagree. The difference was not significant at the .05
level of confidence.

140
Item 10 states, "Communication between the schools and
their publics has increased as a result of the Arkansas
Student Assessment Program." Results are shown in Table CIV.
TABLE CIV
INCREASED COMMUNICATION WITH PUBLICS
Agree Uncertain Disagree Respondents
N a N % N Q. "6
Large-school teachers 6 24 10 40 9 36
Small-school teachers 9 36 6 24 10 40
Chi-square—.184598, df—1, Significance—.6716
Slightly more large-school teachers (36 per cent) and
small-school teachers (40 per cent) disagree that the
Arkansas Student Assessment Program has led to increased
communication with their publics than agree (24 per cent of
large—school teachers and 36 per cent of small-school
teachers). However, the difference between the groups was
not significant at the .05 level of confidence.
Item 11 states, "It is unfair to report scores by school
districts without also including socioeconomic data and data
on the educational level of parents." Results are shown in
Table CV.
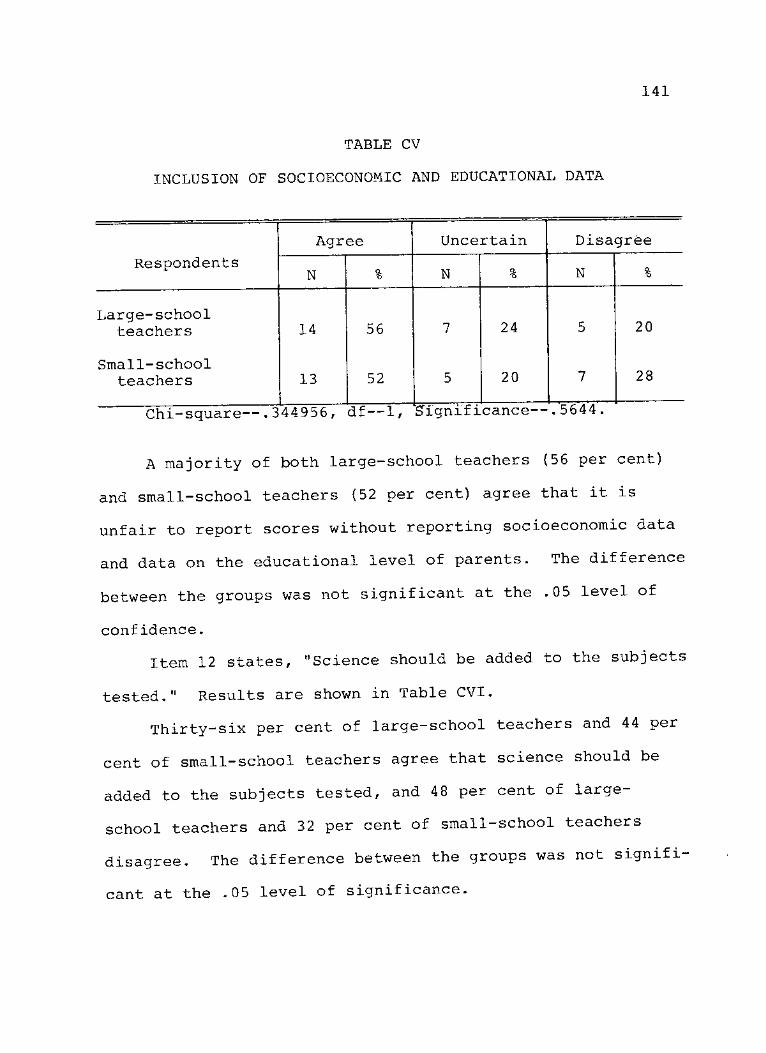
141
TABLE CV
INCLUSION OF SOCIOECONOMIC AND EDUCATIONAL DATA
Agree Uncertain Disagree
Respondents N a 15 N o.
"5 N %
Large-school teachers 14 56 7 24 5 20
Small-school teachers 13 52 5 20 7 28
Chi-square—.344956, df—1, Significance—.5644
A majority of both large—school teachers (56 per cent)
and small-school teachers (52 per cent) agree that it is
unfair to report scores without reporting socioeconomic data
and data on the educational level of parents. The difference
between the groups was not significant at the .05 level of
confidence.
Item 12 states, "Science should be added to the subjects
tested." Results are shown in Table CVI.
Thirty-six per cent of large-school teachers and 44 per
cent of small-school teachers agree that science should be
added to the subjects tested, and 48 per cent of large-
school teachers and 32 per cent of small-school teachers
disagree. The difference between the groups was not signifi-
cant at the .05 level of significance.
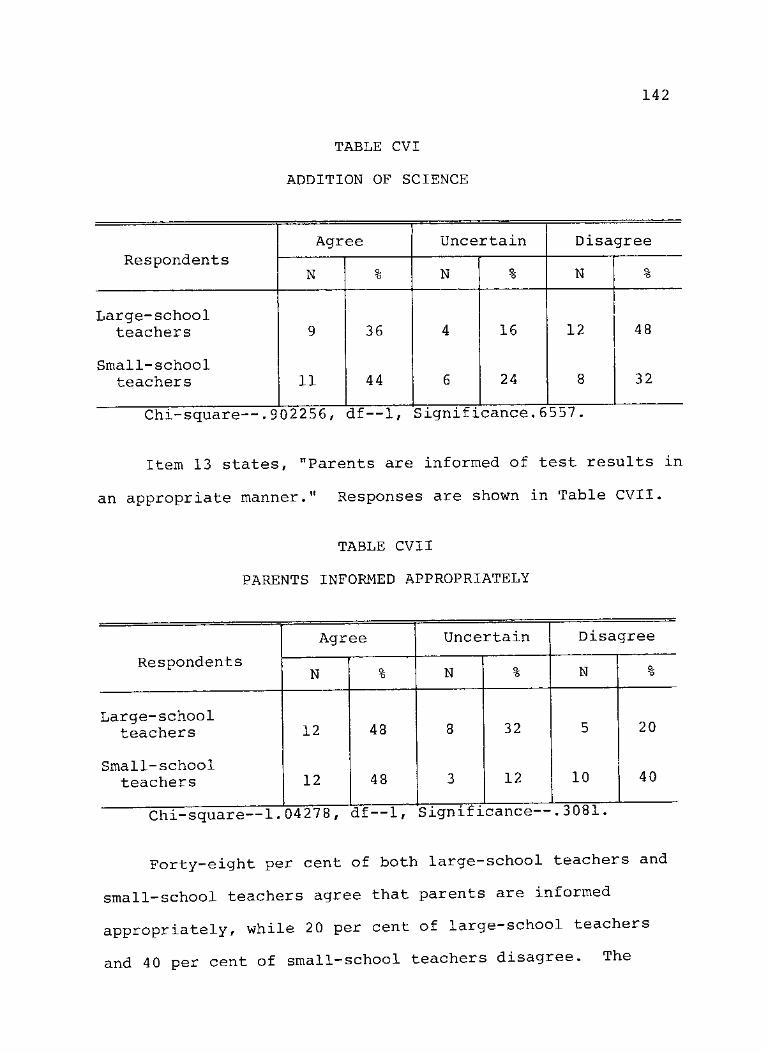
TABLE CVI
ADDITION OF SCIENCE
142
Respondents Agree Uncertain Disagree
Respondents N O.
"O N O "O N a
*o
Large-school teachers 9 36 4 16 12 48
Small-school teachers 11 44 6 24 8 32
Chi-square—.902256, df—1, Significance.6557
Item 13 states, "Parents are informed of test results in
an appropriate manner." Responses are shown in Table CVII.
TABLE CVII
PARENTS INFORMED APPROPRIATELY
Agree Uncertain Disagree
Respondents N O.
*o N o, *o N a
"O
Large-school teachers 12 48 8 32 5 20
Small-school teachers 12 48 3 12 10 40
Chi-square—1. 04278, df—1, Significance-
Forty—eight per cent of both large—school teachers and
small-school teachers agree that parents are informed
appropriately, while 20 per cent of large—school teachers
and 40 per cent of small-school teachers disagree. The
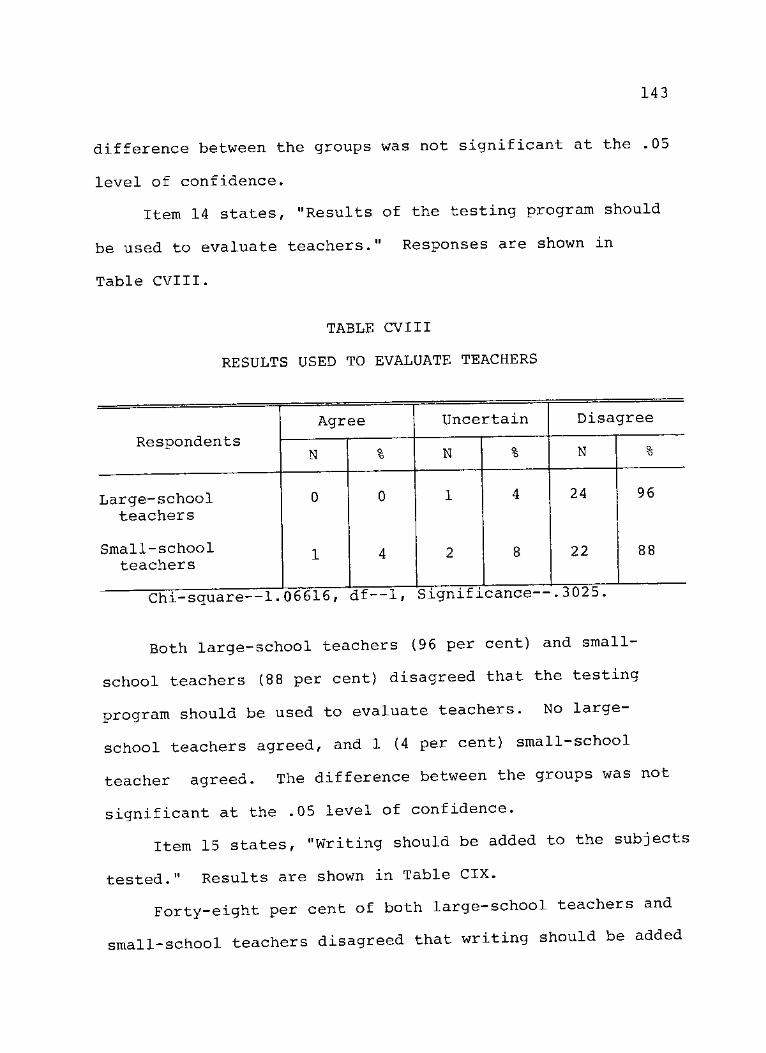
143
difference between the groups was not significant at the .05
level of confidence.
Item 14 states, "Results of the testing program should
be used to evaluate teachers." Responses are shown in
Table CVIII.
TABLE CVIII
RESULTS USED TO EVALUATE TEACHERS
Respondents Agree Uncertain Disagree
Respondents N o.
"o N % N %
Large-school teachers
0 0 1 4 24 96
Small-school teachers
1 4 2
C* A r r w -i -P 1
8
n 2 r i r « Q — —
22 88
Both large-school teachers (96 per cent) and small-
school teachers (88 per cent) disagreed that the testing
program should be used to evaluate teachers. No large-
school teachers agreed, and 1 (4 per cent) small-school
teacher agreed. The difference between the groups was not
significant at the .05 level of confidence.
Item 15 states, "Writing should be added to the subjects
tested." Results are shown in Table CIX.
Forty-eight per cent of both large-school teachers and
small-school teachers disagreed that writing should be added

144
to the subjects tested. Sixteen per cent of large school
teachers and 24 per cent of small-school teachers agreed.
The difference was not significant at the .05 level of
confidence.
TABLE CIX
ADDITION OF WRITING
Respondents
Agree
N
Uncertain
N
Disagree
N
Large-school teachers
Small-school teachers
16
24
36
28
12
12
48
48
Chi-square— .283333, df—1, Significance—. b014.
Item 16 states, "Schools receive individual student
reports on each student tested. This information is
utilized by the schools to better meet individual student
needs." Results are shown in Table CX.
Sixty-eight per cent of small-school teachers agree that
the individual student reports are used to better meet indi-
vidual student needs, while only 14 per cent of large-school
teachers agree. Thirty-six per cent of large-school teachers
disagree, while only 12 per cent of small-school teachers
disagree. The difference was significant at the .0362 level
of confidence.
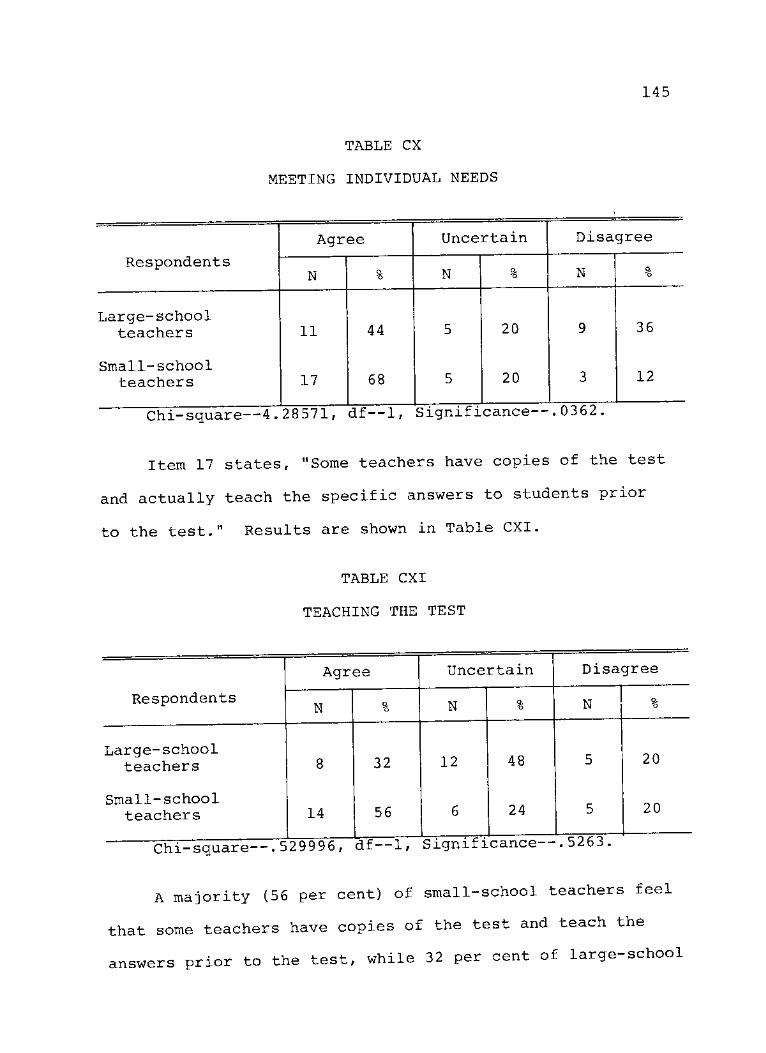
145
TABLE CX
MEETING INDIVIDUAL NEEDS
Respondents
Large-school teachers
Smal1-school teachers
Agree
N
11
17
44
68
Uncertain
N
5
5
20
20
Disagree
N
9
3
Chi-square—4.28571, df—1, Significance—
36
12
0362
Item 17 states, "Some teachers have copies of the test
and actually teach the specific answers to students prior
to the test." Results are shown in Table CXI.
TABLE CXI
TEACHING THE TEST
Respondents
Large-school teachers
Small-school teachers
Agree
N
14 1
32
56
Uncertain
N
12 48
24
Disagree
N
20
20
Chi-square—. 529996, df—1, Signif icance—. 5263.
A majority (56 per cent) of small-school teachers feel
that some teachers have copies of the test and teach the
answers prior to the test, while 32 per cent of large school
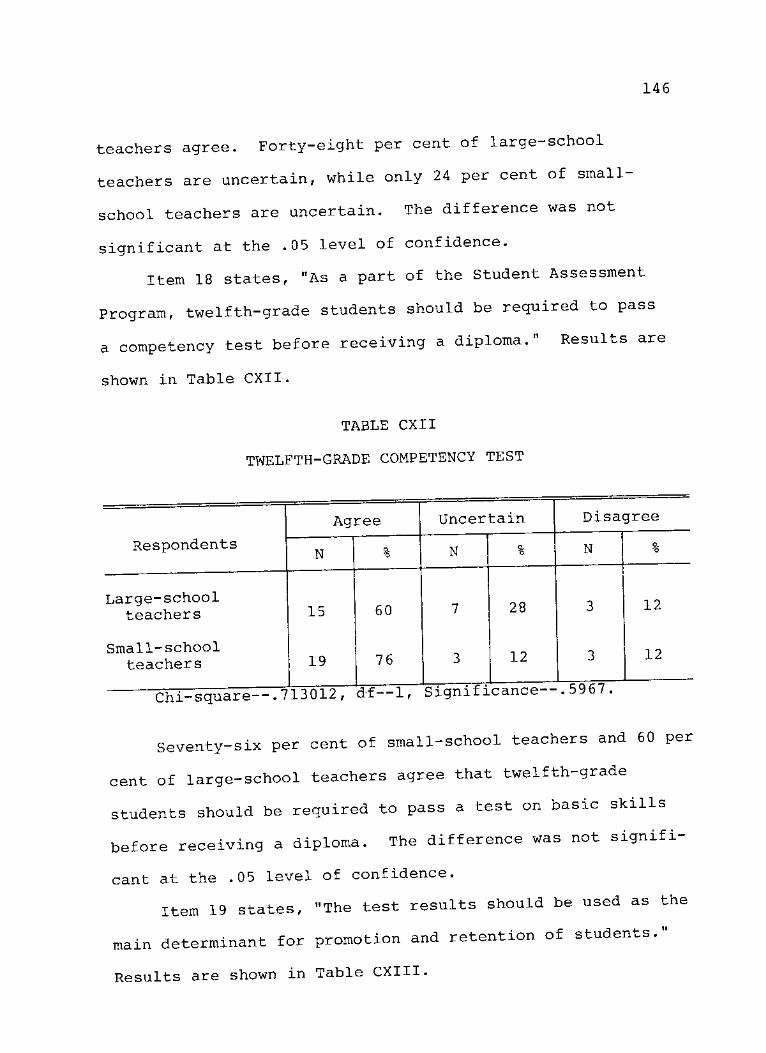
146
teachers agree. Forty-eight per cent of large-school
teachers are uncertain, while only 24 per cent of small-
school teachers are uncertain. The difference was not
significant at the .05 level of confidence.
Item 18 states, "As a part of the Student Assessment
Program, twelfth-grade students should be required to pass
a competency test before receiving a diploma." Results are
shown in Table CXII.
TABLE CXII
TWELFTH-GRADE COMPETENCY TEST
Respondents
Agree
N
Large-school teachers
Small-school teachers
15
19
60
76
Uncertain
N
28
12
Disagree
N
12
12
Chi-square—. 713012, df—1, Significance—. by67 .
Seventy-six per cent of small-school teachers and 60 per
cent of large-school teachers agree that twelfth-grade
students should be required to pass a test on basic skills
before receiving a diploma. The difference was not signifi-
cant at the .05 level of confidence.
Item 19 states, "The test results should be used as the
main determinant for promotion and retention of students."
Results are shown in Table CXIII.
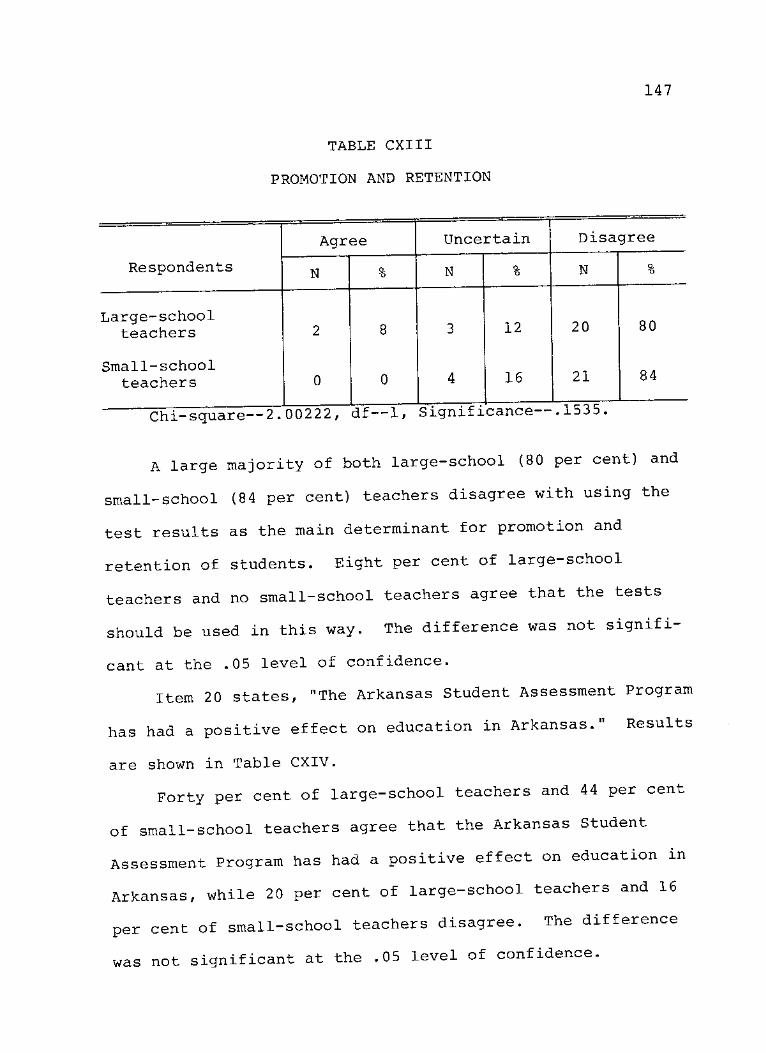
TABLE CXIII
PROMOTION AND RETENTION
147
Respondents
Large-school teachers
Small-school teachers
Agree
N
Uncertain
N
3
4
12
16
Disagree
N
20
21
80
84
Chi-square—2. 00222, df—1, Significance—. 1535.
A large majority of both large-school (80 per cent) and
small-school (84 per cent) teachers disagree with using the
test results as the main determinant for promotion and
retention of students. Eight per cent of large-school
teachers and no small-school teachers agree that the tests
should be used in this way. The difference was not signifi-
cant at the .05 level of confidence.
Item 20 states, "The Arkansas Student Assessment Program
has had a positive effect on education in Arkansas. Results
are shown in Table CXIV.
Forty per cent of large-school teachers and 44 per cent
of small-school teachers agree that the Arkansas Student
Assessment Program has had a positive effect on education in
Arkansas, while 20 per cent of large-school teachers and 16
per cent of small-school teachers disagree. The difference
was not significant at the .05 level of confidence.
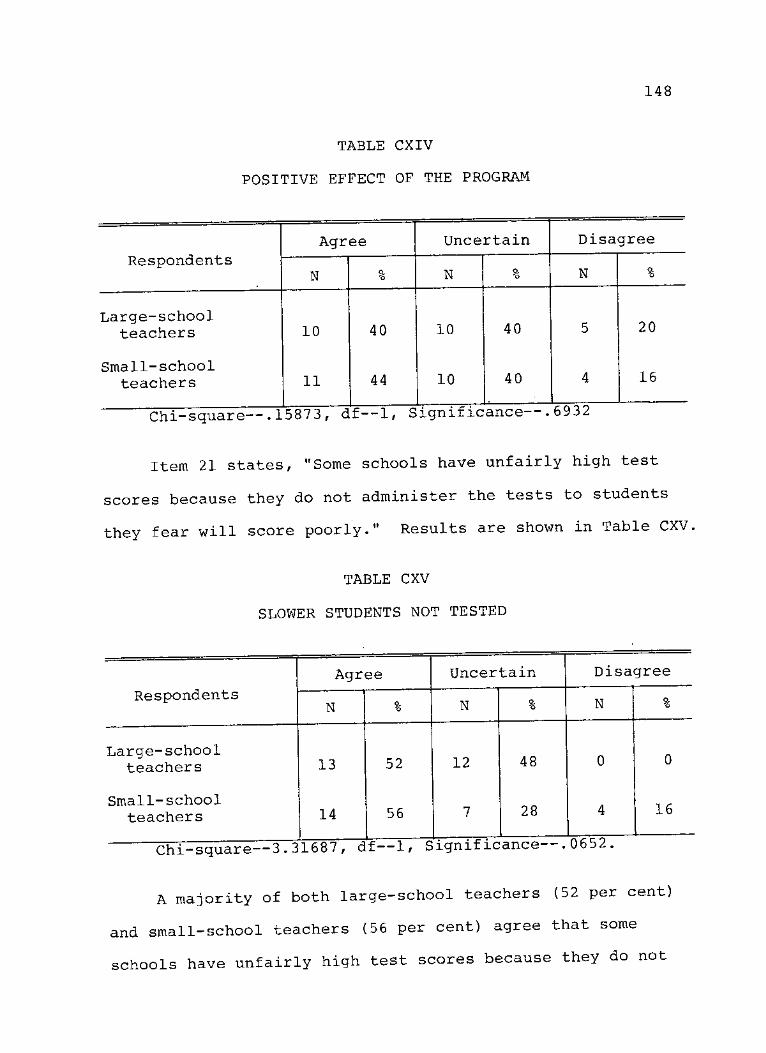
TABLE CXIV
POSITIVE EFFECT OF THE PROGRAM
148
Respondents Agree
N
Uncertain
N
Disagree
N
Large-school teachers
Small-school teachers
10
11
40
44
10
10
40
40
20
16
Chi-square--. 15873, df—1, Significance—. 6932
Item 21 states, "Some schools have unfairly high test
scores because they do not administer the tests to students
they fear will score poorly." Results are shown in Table CXV.
TABLE CXV
SLOWER STUDENTS NOT TESTED
Respondents
Large-school teachers
Small-school teachers
Agree
N
13
14
52
56
Uncertain
N
12
7
48
28
Disagree
N
16
Chi—square—3.31687, df—1, Significance .0652.
A majority of both large-school teachers (52 per cent)
and small-school teachers (56 per cent) agree that some
schools have unfairly high test scores because they do not

149
administer the test to students they fear will score poorly.
Only 16 per cent of small-school teachers and no large-
school teachers disagree. The difference between the groups
was not significant at the .05 level of confidence.
Item 22 states, "As a result of the Arkansas Student
Assessment Program most schools have developed a remedial
program to assist low-scoring students to improve their
basic skills." Results are shown in Table CXVI.
TABLE CXVI
REMEDIAL PROGRAMS DEVELOPED
Respondents Agree Uncertain Disagree
Respondents N Q. "O N a
"6 N %
Large-school teachers 9 36 11 44 5 20
Small-school teachers 16 64 4 16 5 20
Chi-square—.583333, df—1, Significance—.5484
A majority of small-school teachers (64 per cent) agree
that most schools have set up remedial programs as a result
of the Arkansas Student Assessment Program; however, only
36 per cent of large-school teachers agree. Twenty per cent
of both groups disagree. The difference between the groups
was not significant at the .05 level of confidence.
Item 23 states, "Every grade (k-12) should be tested
every year." Results are shown in Table CXVII.
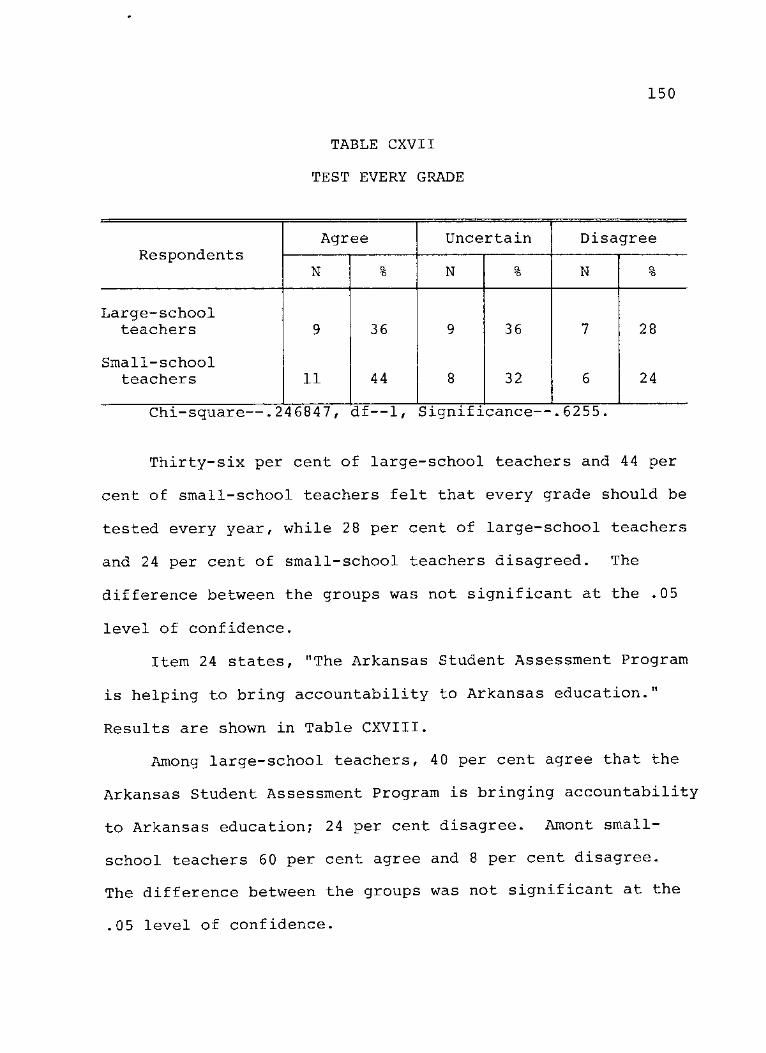
TABLE CXVII
TEST EVERY GRADE
150
Respondents Agree Uncertain Disagree
Respondents N % N Q. "O N Q. "O
Large-school teachers 9 36 9 36 7 28
Small-school teachers 11 44 8 32 6 24
Chi-square—.246847, df—1, Significance—.6255
Thirty-six per cent of large-school teachers and 44 per
cent of small-school teachers felt that every grade should be
tested every year, while 28 per cent of large-school teachers
and 24 per cent of small-school teachers disagreed. The
difference between the groups was not significant at the .05
level of confidence.
Item 24 states, "The Arkansas Student Assessment Program
is helping to bring accountability to Arkansas education."
Results are shown in Table CXVIII.
Among large-school teachers, 40 per cent agree that the
Arkansas Student Assessment Program is bringing accountability
to Arkansas education; 24 per cent disagree. Amont small-
school teachers 60 per cent agree and 8 per cent disagree.
The difference between the groups was not significant at the
.05 level of confidence.
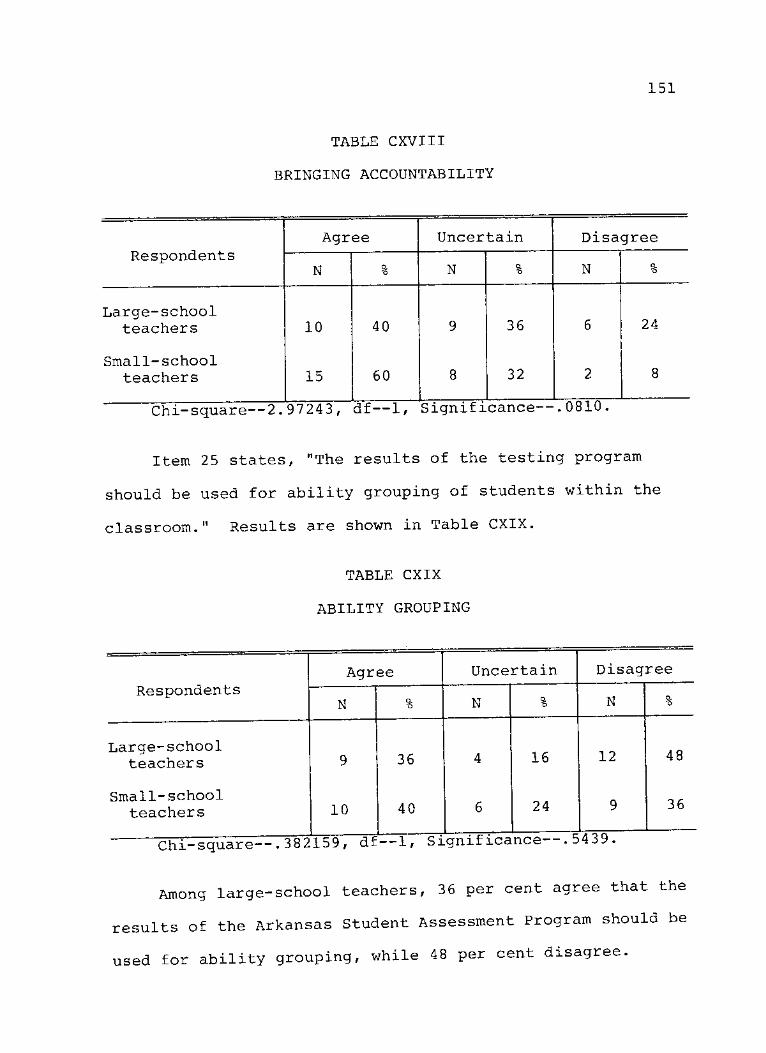
TABLE CXVIII
BRINGING ACCOUNTABILITY
151
Respondents Agree Uncertain Disagree
Respondents N % N % N Q. "6
Large-school teachers 10 40 9 36 6 24
Small-school teachers 15 60 8 32 2 8
Chi-square—2. 97243, df~l, Significance—
Item 25 states, "The results of the testing program
should be used for ability grouping of students within the
classroom." Results are shown in Table CXIX.
TABLE CXIX
ABILITY GROUPING
Respondents Agree Uncertain Disagree
Respondents N O,
"O N o, "8 N %
Large-school teachers 9 36 4 16 12 48
Small-school teachers 10 40 6 24 9 36
Chi-square—.382159, dr--l, bigniricanoe .au?.
Among large-school teachers, 36 per cent agree that the
results of the Arkansas Student Assessment Program should be
used for ability grouping, while 48 per cent disagree.
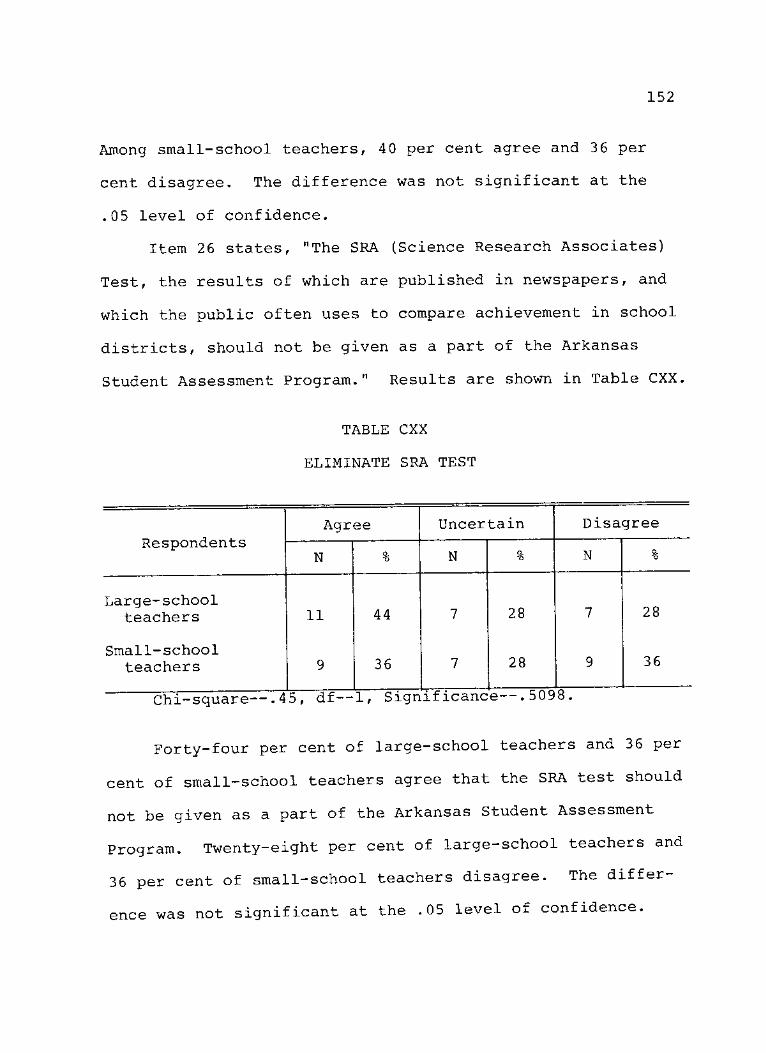
152
Among small-school teachers, 40 per cent agree and 3 6 per
cent disagree. The difference was not significant at the
.05 level of confidence.
Item 26 states, "The SRA (Science Research Associates)
Test, the results of which are published in newspapers, and
which the public often uses to compare achievement in school
districts, should not be given as a part of the Arkansas
Student Assessment Program." Results are shown in Table CXX.
TABLE CXX
ELIMINATE SRA TEST
Respondents Agree Uncertain Disagree
Respondents N % N o.
*o N Q. "O
Large-school teachers 11 44 7 28 7 28
Small-school teachers 9 36 7 28 9 36
Chi-square-
Forty—four per cent of large-school teachers and 36 per
cent of small-school teachers agree that the SRA test should
not be given as a part of the Arkansas Student Assessment
Program. Twenty-eight per cent of large-school teachers and
36 per cent of small-school teachers disagree. The differ-
ence was not significant at the .05 level of confidence.
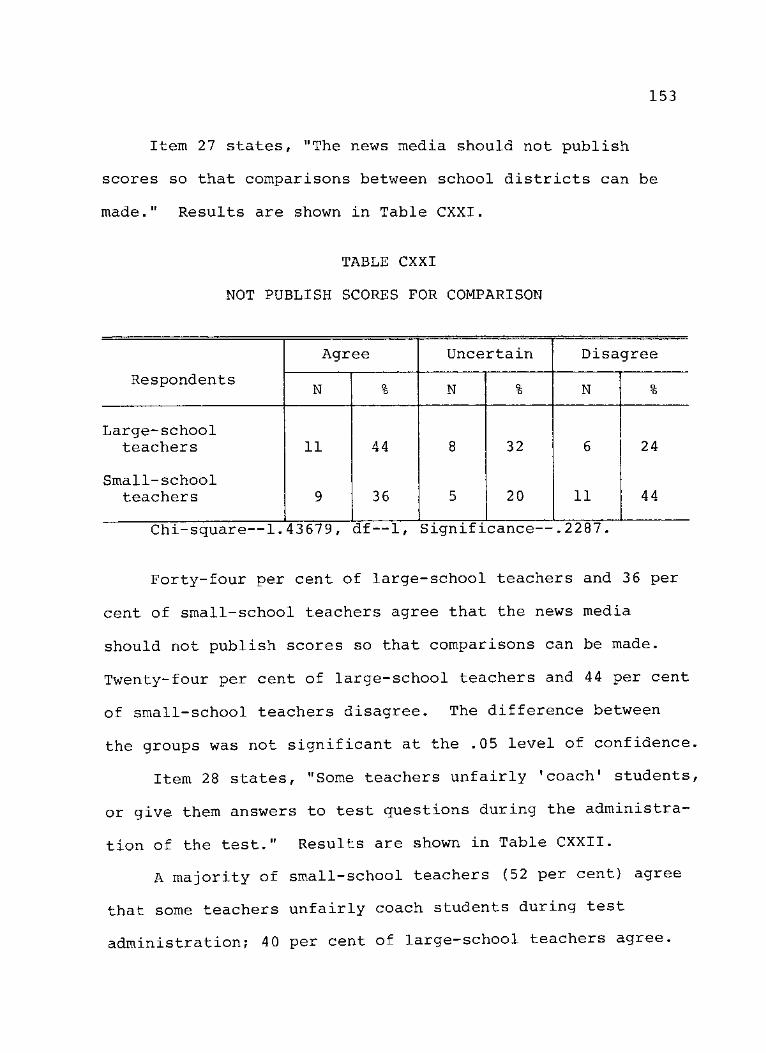
153
Item 27 states, "The news media should not publish
scores so that comparisons between school districts can be
made." Results are shown in Table CXXI.
TABLE CXXI
NOT PUBLISH SCORES FOR COMPARISON
Agree Uncertain Disagree
Respondents N Q, "O N % N a
"O
Large-school teachers 11 44 8 32 6 24
Small-school teachers 9 36 5 20 11 44
Chi-square—1.43679, df—1, Significance—.2287
Forty-four per cent of large-school teachers and 36 per
cent of small-school teachers agree that the news media
should not publish scores so that comparisons can be made.
Twenty-four per cent of large-school teachers and 44 per cent
of small-school teachers disagree. The difference between
the groups was not significant at the .05 level of confidence.
Item 28 states, "Some teachers unfairly 'coach1 students,
or give them answers to test questions during the administra-
tion of the test." Results are shown in Table CXXII.
A majority of small-school teachers (52 per cent) agree
that some teachers unfairly coach students during test
administration; 40 per cent of large—school teachers agree.
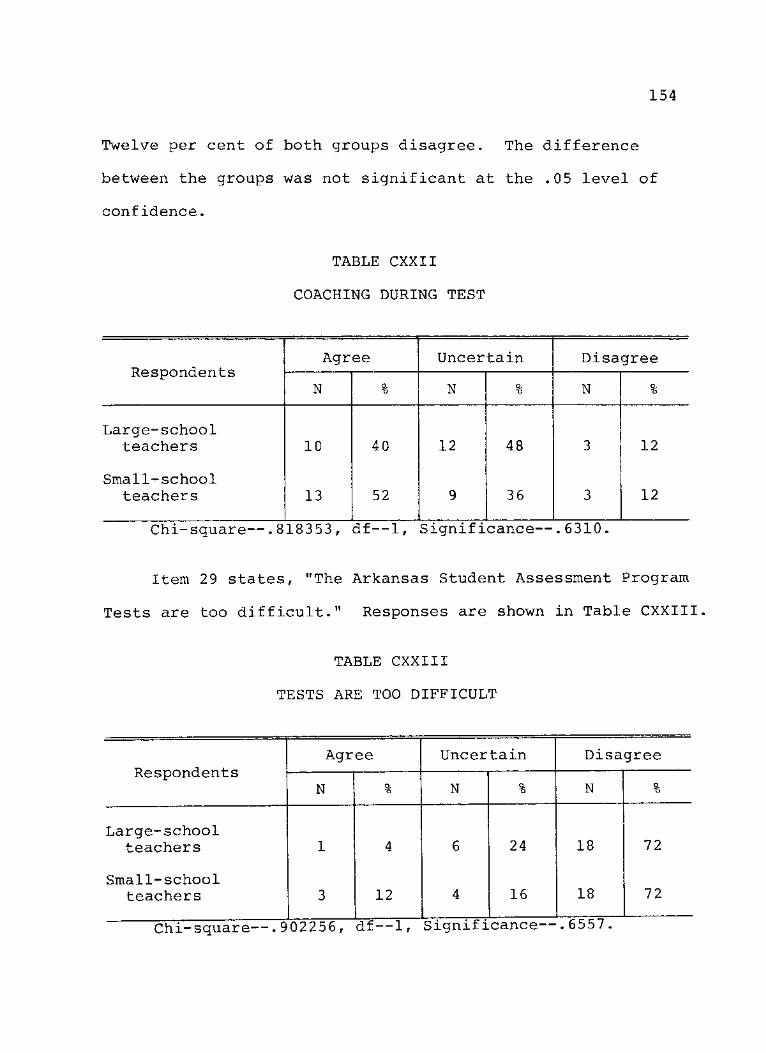
154
Twelve per cent of both groups disagree. The difference
between the groups was not significant at the .05 level of
confidence.
TABLE CXXII
COACHING DURING TEST
Respondents Agree Uncertain Disagree
Respondents N % N Q. *6 N a
"O
Large-school teachers 10 40 12 48 3 12
Small-school teachers 13 52 9 36 3 12
Chi-square—.818353, df—1, Significance—.6310
Item 29 states, "The Arkansas Student Assessment Program
Tests are too difficult." Responses are shown in Table CXXIII,
TABLE CXXIII
TESTS ARE TOO DIFFICULT
Respondents Agree Uncertain Disagree
Respondents N % N % N %
Large-school teachers 1 4 6 24 18 72
Small-school teachers 3 12 4 16 18 72
Chi-square—.902256, df—1, Significance—

155
A majority of both large—school (72 per cent) and small-
school (72 per cent) teachers disagree that the tests are too
difficult. Four per cent of large-school teachers and 12 per
cent of small-school teachers agree that the tests are too
difficult. The difference between the groups was not signifi-
cant at the .05 level of confidence.
Item 30 states, "The results should be used for tracking
students (placing students in an academic program which fits
their abilities and interests—college prep, vocational, etc.).11
Results are shown in Table CXXIV.
TABLE CXXIV
RESULTS USED FOR TRACKING
Agree Uncertain Disagree Respondents
N % N Q. t) N o, *o
Large-school teachers 12 48 7 28 6 24
Small-school teachers 12 48 9 36 4 16
Chi-square—.283333, df—1, Significance—.6014,
Forty-eight per cent of both large-school and small-
school teachers agree that the results should be used for
tracking students. Twenty-four per cent of large-school
teachers and 16 per cent of small-school teachers disagree.
The difference between the groups was not significant at the
.05 level of confidence.
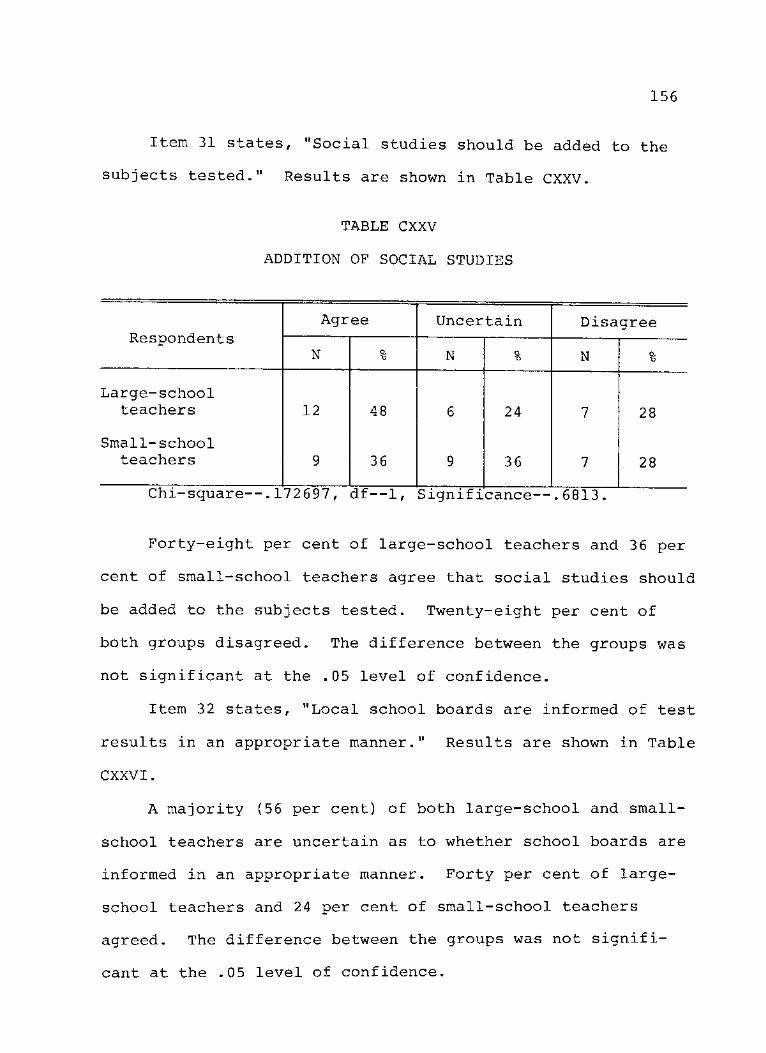
156
Item 31 states, "Social studies should be added to the
subjects tested." Results are shown in Table CXXV.
TABLE CXXV
ADDITION OF SOCIAL STUDIES
Respondents Agree Uncertain Disagree
Respondents N O,
"O N % N o, "O
Large-school teachers 12 48 6 24 7 28
Small-school teachers 9 36 9 36 7 28
Chi-square—.172697, df—1, Significance—.6813
Forty-eight per cent of large-school teachers and 36 per
cent of small-school teachers agree that social studies should
be added to the subjects tested. Twenty-eight per cent of
both groups disagreed. The difference between the groups was
not significant at the .05 level of confidence.
Item 32 states, "Local school boards are informed of test
results in an appropriate manner." Results are shown in Table
CXXVI.
A majority (56 per cent) of both large-school and small-
school teachers are uncertain as to whether school boards are
informed in an appropriate manner. Forty per cent of large-
school teachers and 24 per cent of small-school teachers
agreed. The difference between the groups was not signifi-
cant at the .05 level of confidence.
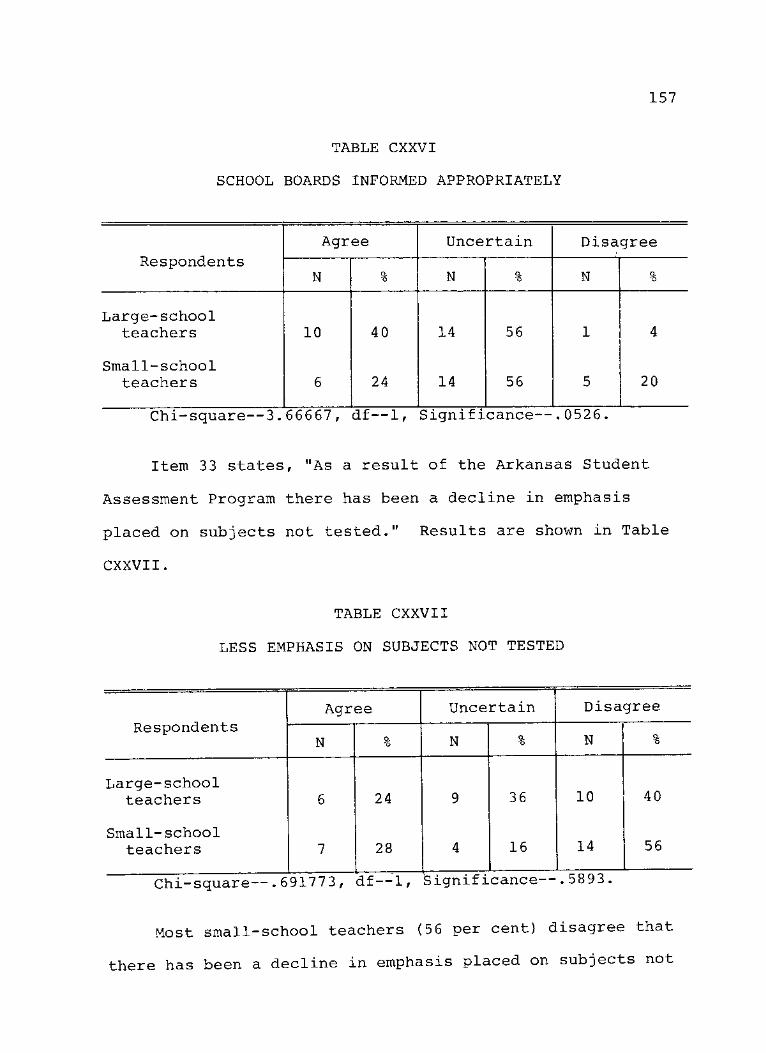
157
TABLE CXXVI
SCHOOL BOARDS INFORMED APPROPRIATELY
Respondents Agree Uncertain Disagree
Respondents N % N Q.
'O N %
Large-school teachers 10 40 14 56 1 4
Small-school teachers 6 24 14 56 5 20
Chi-square—3.66667, df—1, Significance—.0526
Item 33 states, "As a result of the Arkansas Student
Assessment Program there has been a decline in emphasis
placed on subjects not tested." Results are shown in Table
CXXVII.
TABLE CXXVII
LESS EMPHASIS ON SUBJECTS NOT TESTED
Respondents Agree Uncertain Disagree
Respondents N Q.
"6 N Q. "O N %
Large-school teachers 6 24 9 36 10 40
Small-school teachers 7 28 4 16 14 56
Chi-square—.691773, d£—1, Significance—
Most small-school teachers (56 per cent) disagree that
there has been a decline in emphasis placed on subjects not
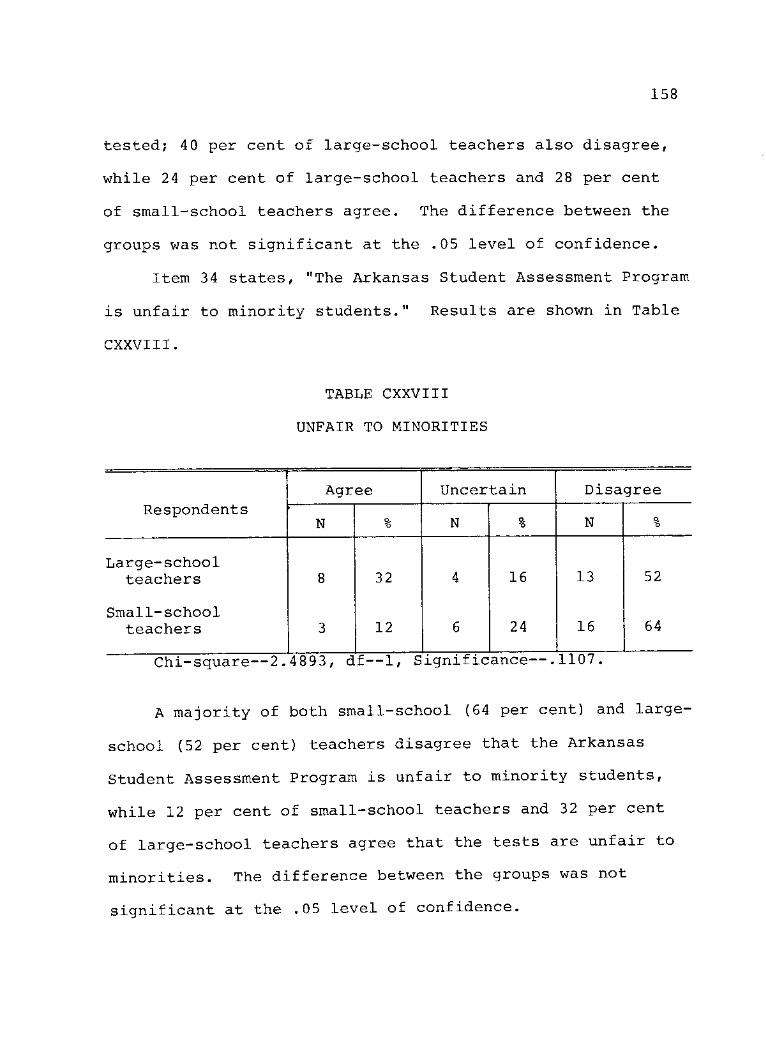
158
tested; 40 per cent of large-school teachers also disagree,
while 24 per cent of large-school teachers and 28 per cent
of small-school teachers agree. The difference between the
groups was not significant at the .05 level of confidence.
Item 34 states, "The Arkansas Student Assessment Program
is unfair to minority students." Results are shown in Table
CXXVIII.
TABLE CXXVIII
UNFAIR TO MINORITIES
Agree Uncertain Disagree Respondents
N Q. "o N % N %
Large-school teachers 8 32 4 16 13 52
Small-school teachers 3 12 6 24 16 64
Chi-square—2.4893, df—1, Significance—.1107
A majority of both small-school (64 per cent) and large-
school (52 per cent) teachers disagree that the Arkansas
Student Assessment Program is unfair to minority students,
while 12 per cent of small-school teachers and 32 per cent
of large-school teachers agree that the tests are unfair to
minorities. The difference between the groups was not
significant at the .05 level of confidence.
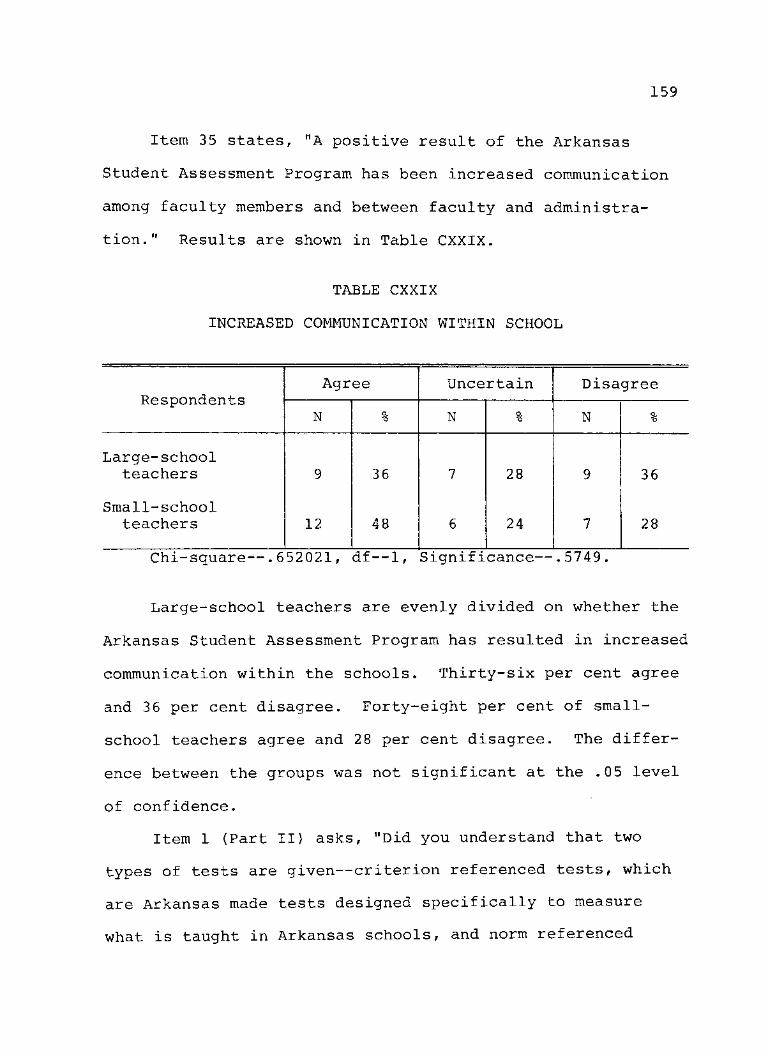
159
Item 35 states, "A positive result of the Arkansas
Student Assessment Program has been increased communication
among faculty members and between faculty and administra-
tion." Results are shown in Table CXXIX.
TABLE CXXIX
INCREASED COMMUNICATION WITHIN SCHOOL
Respondents Agree Uncertain Disagree
Respondents N o.
"o N q, "6 N %
Large-school teachers 9 36 7 28 9 36
Small-school teachers 12 48 6 24 7 28
Chi-square—.652021, df—1, Significance—.5749.
Large-school teachers are evenly divided on whether the
Arkansas Student Assessment Program has resulted in increased
communication within the schools. Thirty-six per cent agree
and 36 per cent disagree. Forty-eight per cent of small-
school teachers agree and 28 per cent disagree. The differ-
ence between the groups was not significant at the .05 level
of confidence.
Item 1 (Part II) asks, "Did you understand that two
types of tests are given—criterion referenced tests, which
are Arkansas made tests designed specifically to measure
what is taught in Arkansas schools, and norm referenced

160
tests (SRA), which are commercially produced and allow com-
parison to a national norm?" Results are shown in Table
CXXX.
TABLE CXXX
UNDERSTANDING OF TWO TYPES OF TESTS
Respondents Yes Uncertain No
Respondents N % N % N Q. "6
Large-school teachers 23 92 0 0 2 8
Small-school teachers 21 84 0 0 4 16
Chi-square—.757576, df—1, Significance—.6117
Ninety-two per cent of large-school teachers and 84 per
cent of small-school teachers answered "yes," they did under-
stand that two types of tests are given. Eight per cent of
large-school teachers and 16 per cent of small-school
teachers answered "no." The difference between the groups
was not significant at the .05 level of confidence.
Item 2 (Part II) asks, "Did you understand that the
Arkansas Student Assessment Program measures reading, math,
and language arts with the norm referenced test? Results
are shown in Table CXXXI.
A large majority of both large-school teachers (80 per
cent) and small-school teachers (7 6 per cent) indicated that
they did understand the subjects which the tests measured.
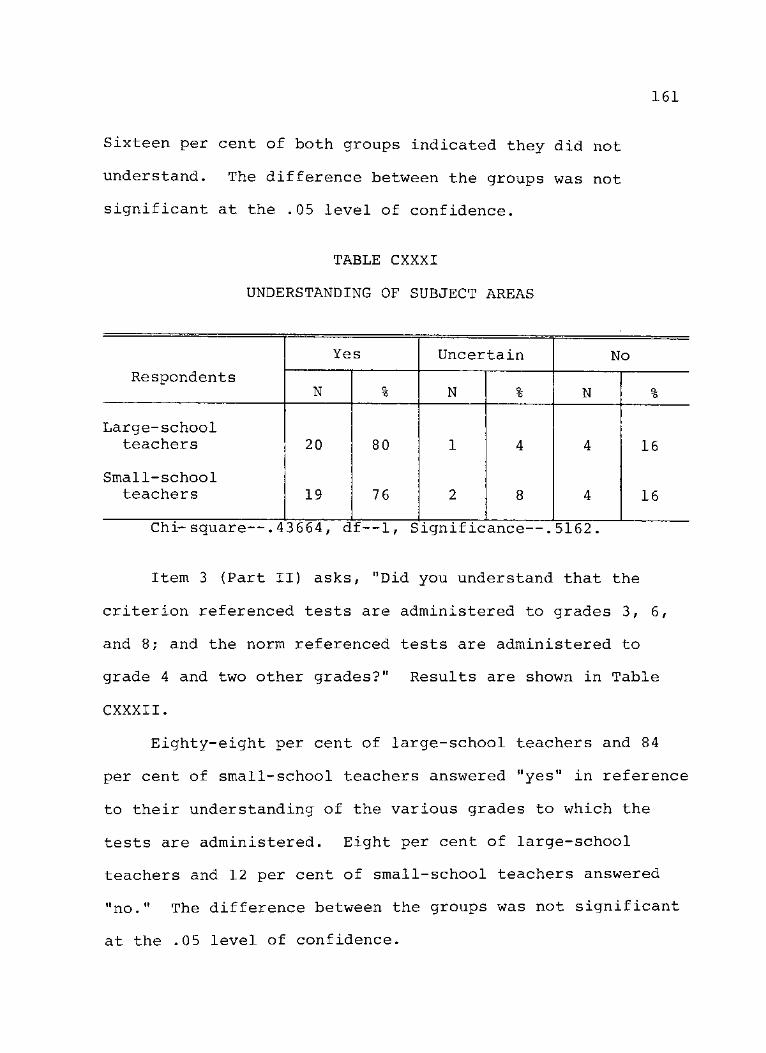
161
Sixteen per cent of both groups indicated they did not
understand. The difference between the groups was not
significant at the .05 level of confidence.
TABLE CXXXI
UNDERSTANDING OF SUBJECT AREAS
Respondents
Yes Uncertain No Respondents
N o •"o N a
"6 N a "O
Large-school teachers 20 80 1 4 4 16
Small-school teachers 19 76 2 8 4 16
Chi—square—.43664, df—1, Significance—.5162.
Item 3 (Part II) asks, "Did you understand that the
criterion referenced tests are administered to grades 3, 6,
and 8; and the norm referenced tests are administered to
grade 4 and two other grades?" Results are shown in Table
CXXXII.
Eighty-eight per cent of large-school teachers and 84
per cent of small-school teachers answered "yes" in reference
to their understanding of the various grades to which the
tests are administered. Eight per cent of large-school
teachers and 12 per cent of small-school teachers answered
"no." The difference between the groups was not significant
at the .05 level of confidence.
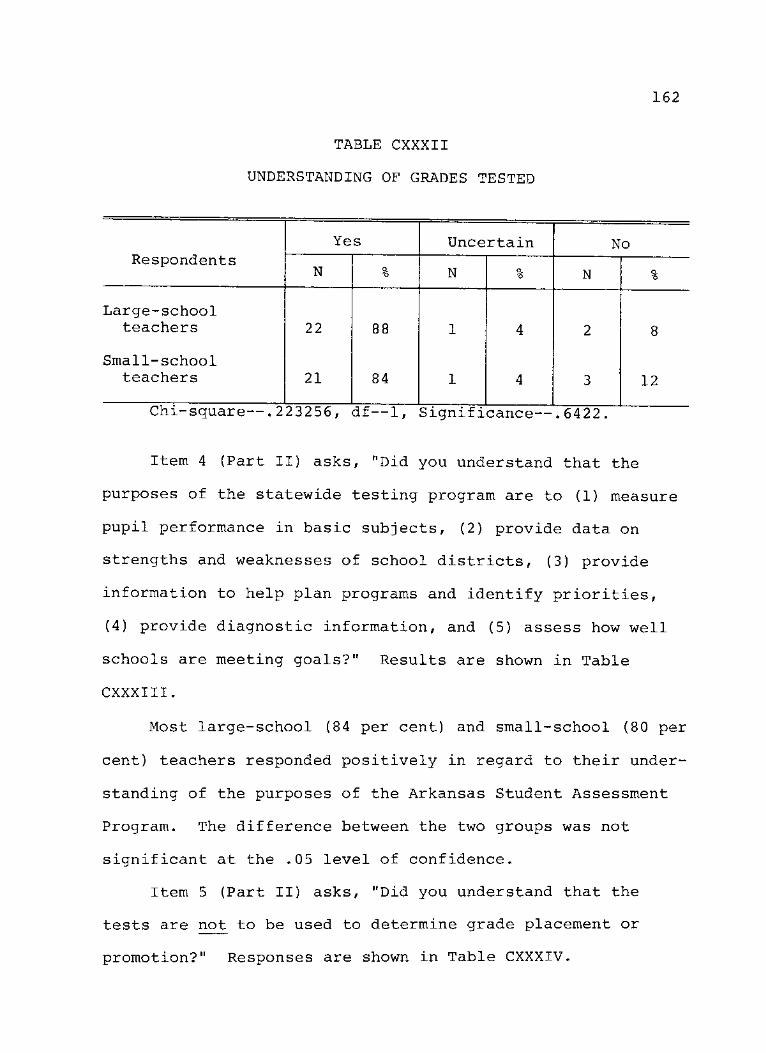
TABLE CXXXII
UNDERSTANDING OF GRADES TESTED
162
Respondents Yes Uncertain No
Respondents N a
*6 N a "O N a
"o
Large-school teachers 22 88 1 4 2 8
Small-school teachers 21 84 1 4 3 12
—.223256, df—1, Significance—.6422
Item 4 (Part II) asks, "Did you understand that the
purposes of the statewide testing program are to (1) measure
pupil performance in basic subjects, (2) provide data on
strengths and weaknesses of school districts, (3) provide
information to help plan programs and identify priorities,
(4) provide diagnostic information, and (5) assess how well
schools are meeting goals?" Results are shown in Table
CXXXIII.
Most large-school (84 per cent) and small-school (80 per
cent) teachers responded positively in regard to their under-
standing of the purposes of the Arkansas Student Assessment
Program. The difference between the two groups was not
significant at the .05 level of confidence.
Item 5 (Part II) asks, "Did you understand that the
tests are not to be used to determine grade placement or
promotion?" Responses are shown in Table CXXXIV.
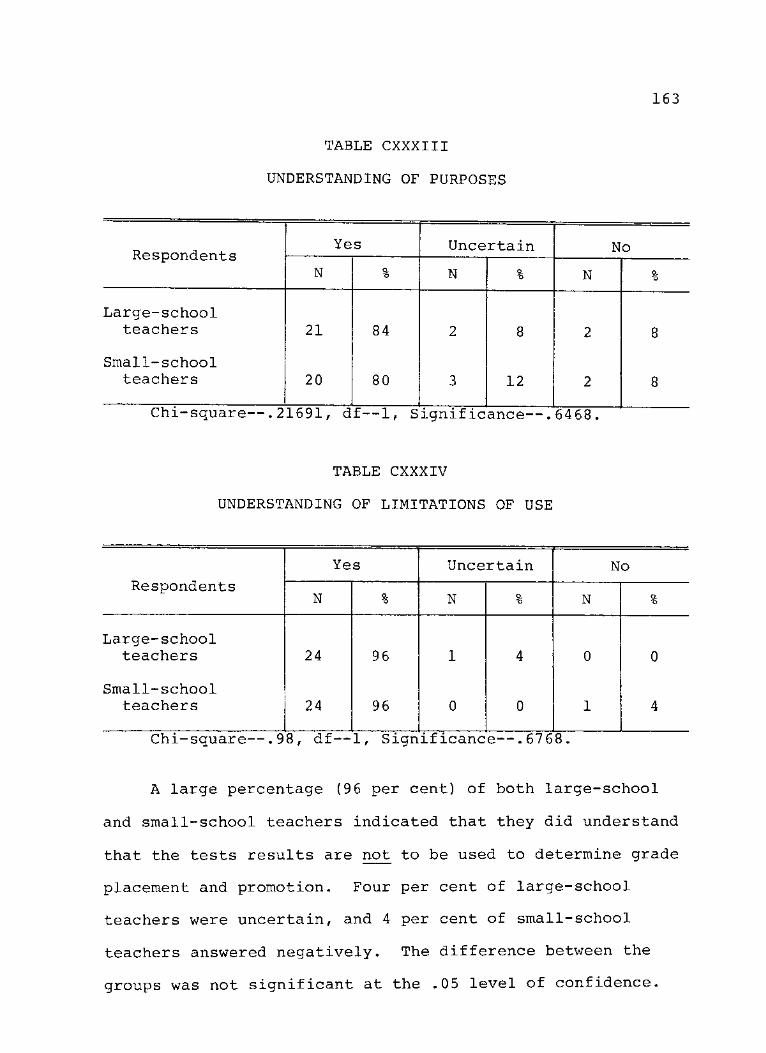
163
TABLE CXXXIII
UNDERSTANDING OF PURPOSES
Respondents Yes Uncertain No Respondents
N o. "o N g. "o N %
Large-school teachers 21 84 2 8 2 8
Small-school teachers 20 80 3 12 2 8
—.21691, df—1, Significance—.6468,
TABLE CXXXIV
UNDERSTANDING OF LIMITATIONS OF USE
Respondents Yes Uncertain No
Respondents N a N o,
*6 N %
Large-school teachers 24 96 1 4 0 0
Small-school teachers 24 96 0 0 1 4
Chi-square—.98, df—1, Significance—.67 68,
A large percentage (96 per cent) of both large-school
and small-school teachers indicated that they did understand
that the tests results are not to be used to determine grade
placement and promotion. Four per cent of large-school
teachers were uncertain, and 4 per cent of small-school
teachers answered negatively. The difference between the
groups was not significant at the .05 level of confidence.

164
Hypotheses Related to Large-School and Small-School Teachers
In order to test these hypotheses, responses were
assigned a value. Positive responses, or responses which
were positive toward the current Arkansas Student Assessment
Program were assigned a 3; "uncertain" responses were assigned
a value of 2; and negative responses, or responses which were
negative toward the present Arkansas Student Assessment Pro-
gram as it now exists, were assigned a value of 1. Questions
relating to each hypothesis were grouped, and a total score
for each respondent on each hypothesis was calculated. A
Kruskal-Wallis one-way analysis of variance by ranks was then
run on each hypothesis. The .05 level of confidence was used
to determine significance.
Hypothesis 9a states, "There is no significant differ-
ence between teachers in large school districts and teachers
in small school districts in their understanding of the
Arkansas Student Assessment Program." Items related to this
hypothesis are numbers 1, 2, 3, 4, and 5 on the last page of
the questionnaire. Results are shown in Table CXXXV.
Large-school teachers (mean rank, 26.86) seemed to have
a better understanding of the Arkansas Student Assessment
Program than did small-school teachers (mean rank, 24.14);
however, the difference between the groups was not signifi-
cant at the .05 level of confidence. The null hypothesis is
accepted.
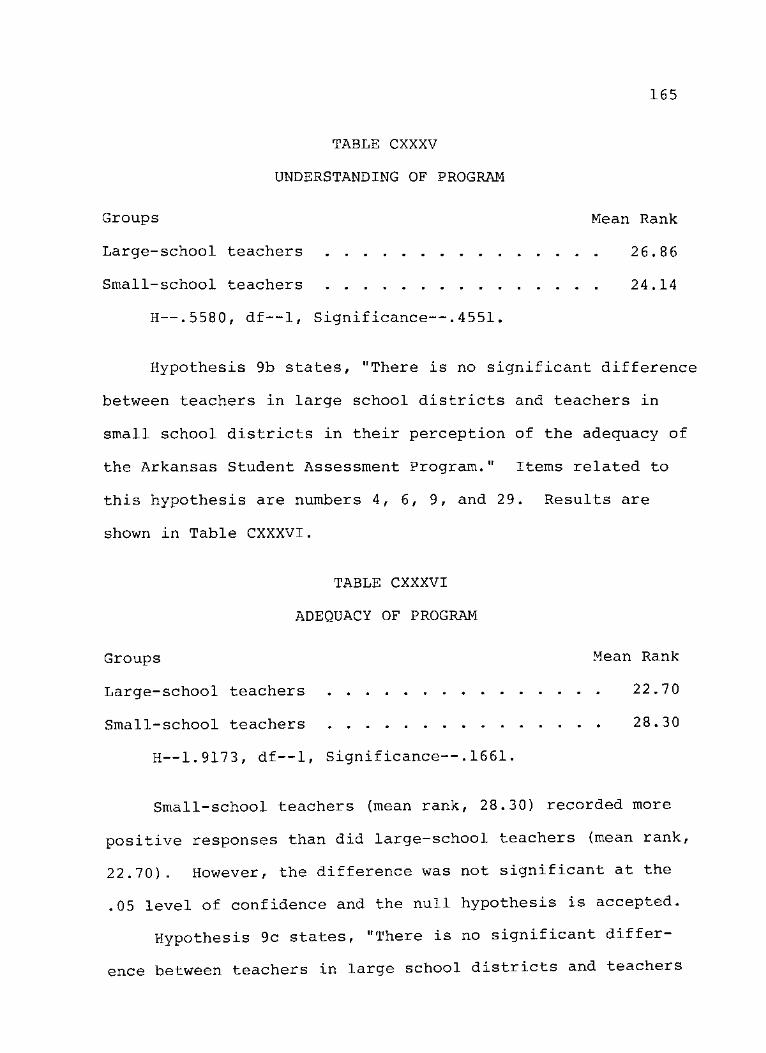
165
TABLE CXXXV
UNDERSTANDING OF PROGRAM
Groups Mean Rank
Large-school teachers 26.86
Small-school teachers 24.14
H—.5580, df—1, Significance—.4551.
Hypothesis 9b states, "There is no significant difference
between teachers in large school districts and teachers in
small school districts in their perception of the adequacy of
the Arkansas Student Assessment Program." Items related to
this hypothesis are numbers 4, 6, 9, and 29. Results are
shown in Table CXXXVI.
TABLE CXXXVI
ADEQUACY OF PROGRAM
Groups Mean Rank
Large-school teachers 22.70
Small-school teachers 28.30
H—1.9173, df—1, Significance—.1661.
Small-school teachers (mean rank, 28.30) recorded more
positive responses than did large-school teachers (mean rank,
22.70). However, the difference was not significant at the
.05 level of confidence and the null hypothesis is accepted.
Hypothesis 9c states, "There is no significant differ-
ence between teachers in large school districts and teachers
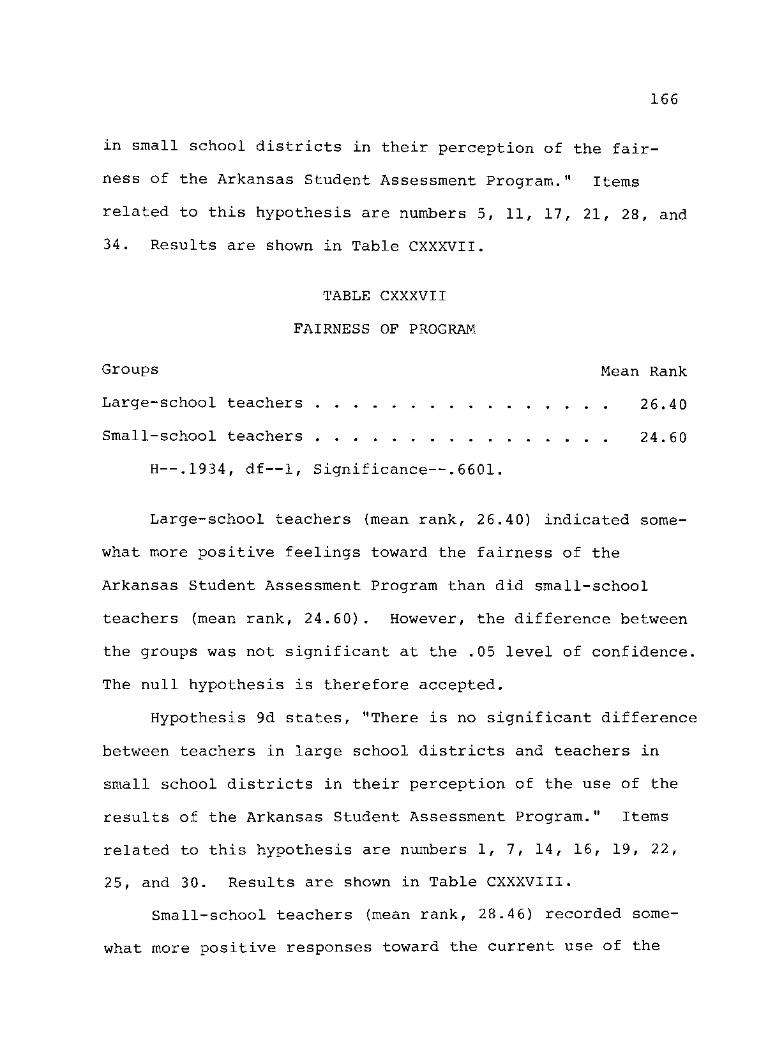
166
in small school districts in their perception of the fair-
ness of the Arkansas Student Assessment Program." Items
related to this hypothesis are numbers 5, 11, 17, 21, 28, and
34. Results are shown in Table CXXXVII.
TABLE CXXXVII
FAIRNESS OF PROGRAM
Groups Mean Rank
Large-school teachers 26.40
Small-school teachers 24.60
H—.1934, df—1, Significance—.6601.
Large-school teachers (mean rank, 26.40) indicated some-
what more positive feelings toward the fairness of the
Arkansas Student Assessment Program than did small-school
teachers (mean rank, 24.60). However, the difference between
the groups was not significant at the .05 level of confidence.
The null hypothesis is therefore accepted.
Hypothesis 9d states, "There is no significant difference
between teachers in large school districts and teachers in
small school districts in their perception of the use of the
results of the Arkansas Student Assessment Program." Items
related to this hypothesis are numbers 1, 7, 14, 16, 19, 22,
25, and 30. Results are shown in Table CXXXVIII.
Small-school teachers (mean rank, 28.46) recorded some-
what more positive responses toward the current use of the
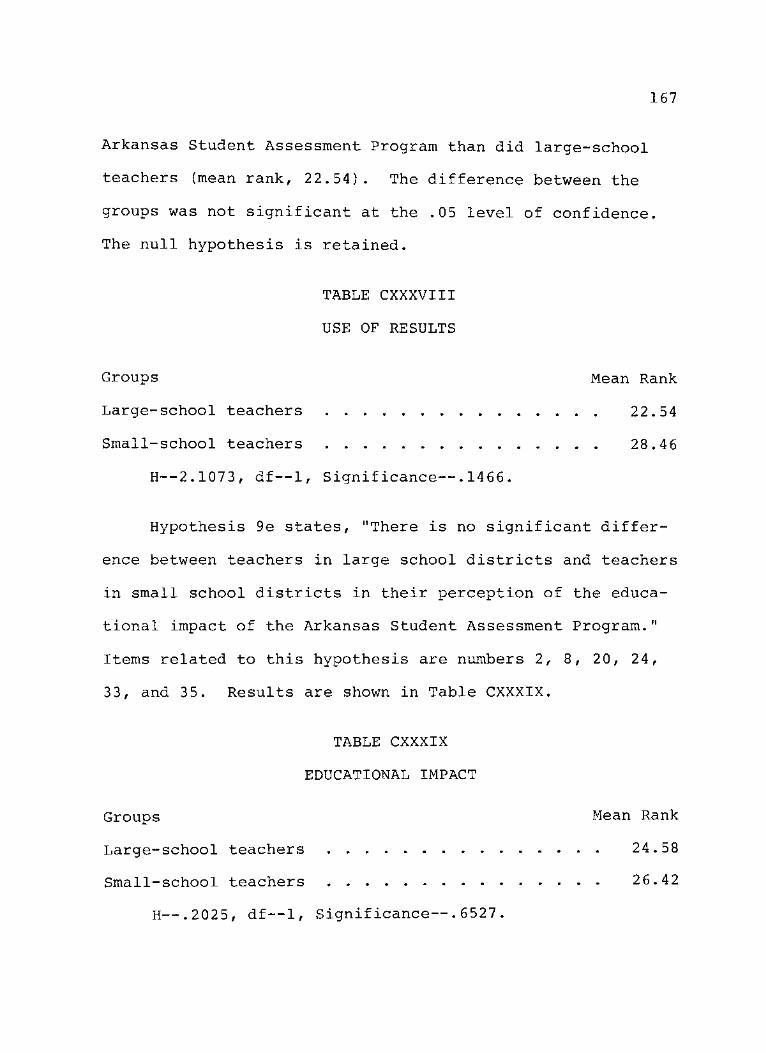
167
Arkansas Student Assessment Program than did large-school
teachers (mean rank, 22.54). The difference between the
groups was not significant at the .05 level of confidence.
The null hypothesis is retained.
TABLE CXXXVIII
USE OF RESULTS
Groups Mean Rank
Large-school teachers 22.54
Small-school teachers 28.46
H--2.1073, df—1, Significance—.1466.
Hypothesis 9e states, "There is no significant differ-
ence between teachers in large school districts and teachers
in small school districts in their perception of the educa-
tional impact of the Arkansas Student Assessment Program."
Items related to this hypothesis are numbers 2, 8, 20, 24,
33, and 35. Results are shown in Table CXXXIX.
TABLE CXXXIX
EDUCATIONAL IMPACT
Groups Mean Rank
Large-school teachers 24.58
Small-school teachers 26.42
H—.2025, df—1, Significance—.6527.
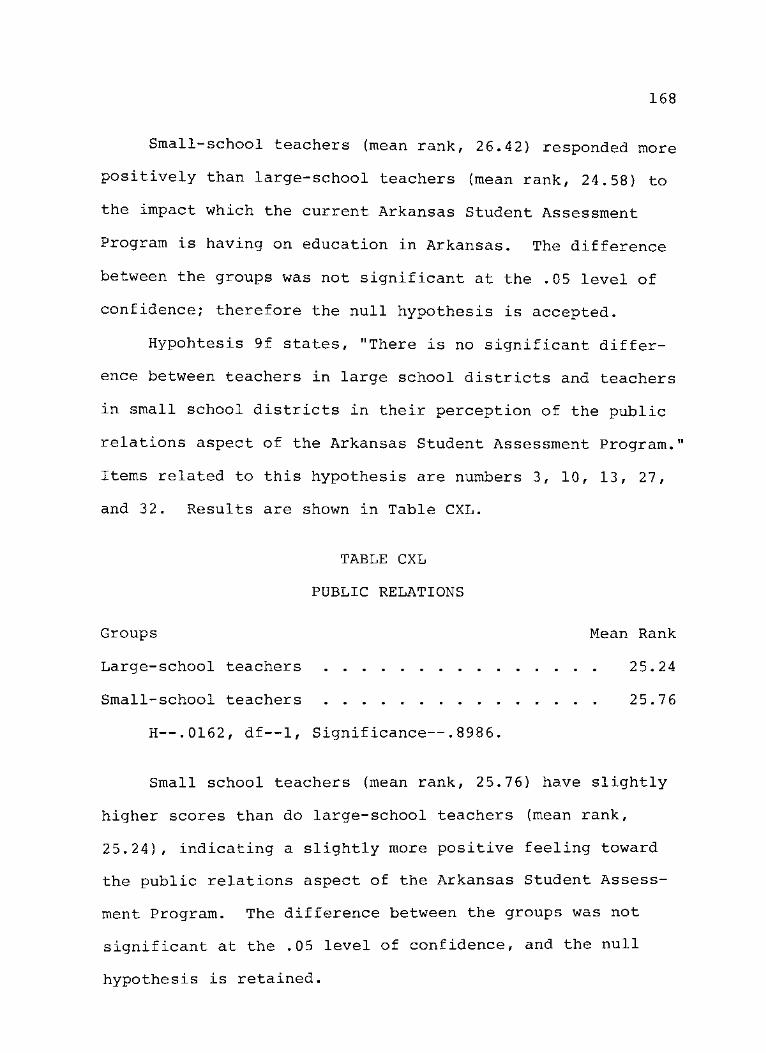
168
Small-school teachers (mean rank, 26.42) responded more
positively than large-school teachers (mean rank, 24.58) to
the impact which the current Arkansas Student Assessment
Program is having on education in Arkansas. The difference
between the groups was not significant at the .05 level of
confidence; therefore the null hypothesis is accepted.
Hypohtesis 9f states, "There is no significant differ-
ence between teachers in large school districts and teachers
in small school districts in their perception of the public
relations aspect of the Arkansas Student Assessment Program."
Items related to this hypothesis are numbers 3, 10, 13, 27,
and 32. Results are shown in Table CXL.
TABLE CXL
PUBLIC RELATIONS
Groups Mean Rank
Large-school teachers 25.24
Small-school teachers 25.76
H—.0162, df—1, Significance—.8986.
Small school teachers (mean rank, 25.76) have slightly
higher scores than do large-school teachers (mean rank,
25.24), indicating a slightly more positive feeling toward
the public relations aspect of the Arkansas Student Assess-
ment Program. The difference between the groups was not
significant at the .05 level of confidence, and the null
hypothesis is retained.
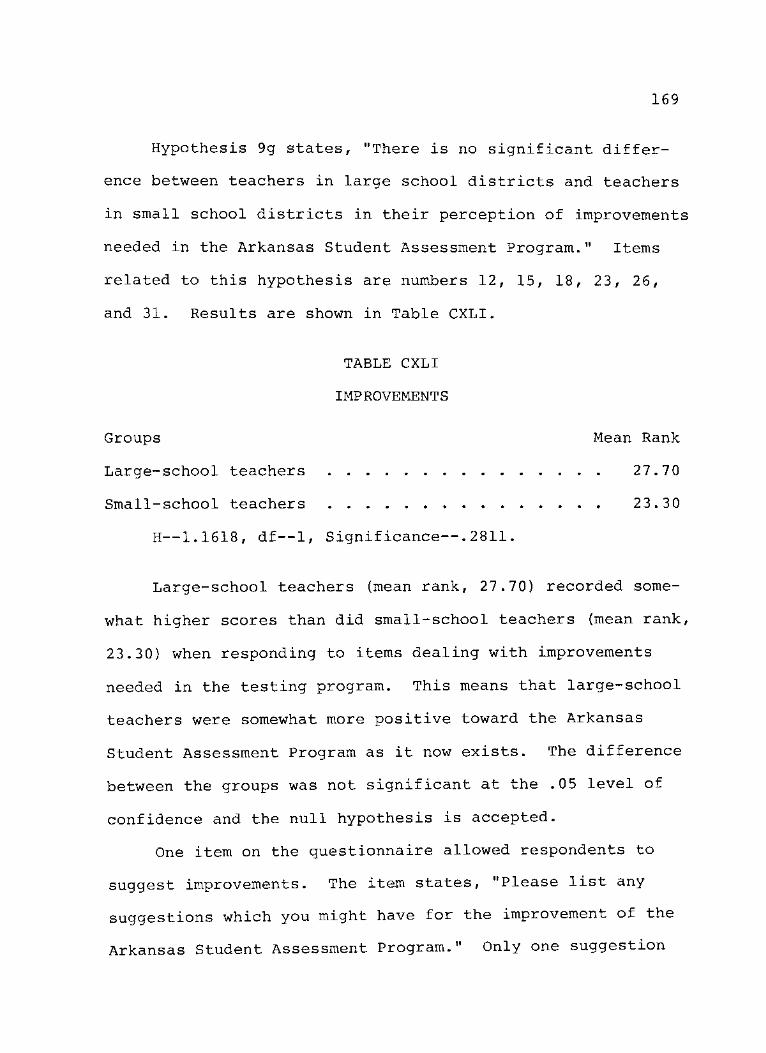
169
Hypothesis 9g states, "There is no significant differ-
ence between teachers in large school districts and teachers
in small school districts in their perception of improvements
needed in the Arkansas Student Assessment Program." Items
related to this hypothesis are numbers 12, 15, 18, 23, 26,
and 31. Results are shown in Table CXLI.
TABLE CXLI
IMPROVEMENTS
Groups Mean Rank
Large-school teachers 27.70
Small-school teachers 23.30
H—1.1618, df—1, Significance—.2811.
Large-school teachers (mean rank, 27.70) recorded some-
what higher scores than did small-school teachers (mean rank,
23.30) when responding to items dealing with improvements
needed in the testing program. This means that large-school
teachers were somewhat more positive toward the Arkansas
Student Assessment Program as it now exists. The difference
between the groups was not significant at the .05 level of
confidence and the null hypothesis is accepted.
One item on the questionnaire allowed respondents to
suggest improvements. The item states, "Please list any
suggestions which you might have for the improvement of the
Arkansas Student Assessment Program." Only one suggestion

170
was received from legislators; twenty-one suggestions were
received from superintendents; and twenty-five suggestions
were received from teachers. The following suggestions were
reported by two or more respondents.
1. The suggestion made most often was, "Stronger guide-
lines should be established for administering the tests at
the local level, or the tests should be administered by an
unbiased 'testing officer.'" This was suggested thirteen
times by superintendents and five times by teachers.
2. "Do not report scores in newspapers so that com-
parisons of school districts can be made." This was suggested
by four teachers and three superintendents.
3. "Test all grade levels." This was suggested by three
teachers and one legislator.
4. "More teacher inservice on administration and use of
the tests." This suggestion was made by one teacher and one
superintendent.
5. "Parents should be mailed test results and adequate
explanation." This was suggested by two teachers.
CHAPTER V
SUMMARY, CONCLUSIONS, IMPLICATIONS,
AND RECOMMENDATIONS
Summary
The summary is presented in six parts: (a) individual
items related to legislators, superintendents, and teachers,
(b) hypotheses related to legislators, superintendents, and
teachers, (c) individual items related to superintendents of
large and small school districts, (d) hypotheses related to
superintendents of large and small school districts, (3)
individual items related to teachers in large and small
school districts, and (f) hypotheses related to teachers in
large and small school districts.
Individual Items Related to Legislators, Superintendents, and Teachers
Responses by legislators, superintendents, and teachers
indicated a great deal of positive feeling toward the
Arkansas Student Assessment Program. A majority of super-
intendents (56 per cent) believe that the results of the
program are being used advantageously? a majority of super-
intendents (67 per cent) and teachers (61 per cent) believe
the program is helping to meet individual needs; a majority
of legislators (66 per cent) and superintendents (51 per
171

172
cent) believe the program has had a positive effect on
Arkansas education; and a majority of all three groups
(legislators 84 per cent, superintendents 57 per cent, and
teachers 51 per cent) believe the program is bringing
accountability to education in Arkansas.
Although there is a great deal of positive feeling in
all three groups, there is also some negative feeling, and
there are differences between the groups.
Using the chi-square statistic and the .05 level of
confidence, a significant difference between the groups was
found on 23 of the 40 items on the questionnaire. Most of
the differences appear to be between legislators and educa-
tors, and most of these differences lie in two major areas—
understanding of the Arkansas Student Assessment Program and
the expansion of the testing program.
The last five items on the questionnaire asked respon-
dents if they understood various aspects of the Arkansas
Student Assessment Program prior to receiving the question-
naire. On each question, responses by legislators indicated
less understanding of the program than responses by either
superintendents or teachers. Differences on four of the five
items were significant.
The other major difference between legislators and
educators was in the area of expanding the testing program
or expanding the use of the results of the program. Eleven
173
items in which a significant difference was found dealt
with either expanding or limiting the program (items number
12, 14, 15, 18, 19, 23, 25, 26, 27, 30, and 31). With only
one exception, legislators favored the expansion of the
testing program to a greater extent than either superinten-
dents or teachers. These items included adding science to
the subjects tested (item 12), expanding the use to include
teacher evaluation (item 14), adding writing (item 15),
adding a twelfth-grade competency test (item 18), using test
results as the main determinant for promotion and retention
(item 19), using the results for ability grouping (item 25),
disagreeing with elimination of SRA tests (item 26), dis-
agreeing with the discontinuing of the publication of scores
so that comparisons could be made (item 27), using results
for tracking students (item 30), and adding social studies
(item 31). The only exception to this pattern was found in
item 23, which stated that every grade should be tested every
year. Teachers had a higher percentage "agree" response to
this item than did legislators.
In summarizing the significantly different responses in
which the major difference appears to be between superinten-
dents and teachers, the teachers were generally more negative
in their responses than were superintendents. This is true
in item 8, which states that the testing program has led to
drill and rote learning to the exclusion of higher order
174
thinking (45 per cent of teachers and 23 per cent of super-
intendents agree while 35 per cent of teachers and 59 per
cent of superintendents disagree); item 10, which states
that the program has led to increased communication with the
school's publics (29 per cent of teachers agree and 47 per
cent disagree, while 53 per cent of superintendents agree and
20 percent disagree); item 20, which states that the program
has had a positive effect on education (38 per cent of
teachers agree and 16 per cent disagree; and while 51 per
cent of superintendents agree and 19 per cent disagree); item
26, which states that the SRA test should be eliminated (38
per cent of teachers and 20 per cent of superintendents
agree and 34 per cent of teachers and 54 per cent of super-
intendents disagree); and item 35, which states that the
program has led to increased communication within schools
(46 per cent of teachers and 60 per cent of superintendents
agree, while 32 per cent of teachers and 14 per cent of
superintendents disagree).
Item 18 produced an interesting response. A majority
of all three groups (legislators 69 per cent, superintendents
56 per cent, and teachers 66 per cent) agreed that twelfth-
grade students should be required to pass a competency test
on basic skills before receiving a high school diploma.
When respondents were invited to make suggestions for
the improvement of the Arkansas Student Assessment Program,
175
the two most frequently-made suggestions were, "See that the
tests are uniformly administered" and "Do not report scores
so that comparisons between school districts can be made."
Hypotheses Related to Legislators,
Superintendents, and Teachers
In testing the hypotheses, questions relating to each
hypothesis were grouped, and a value of 3, 2, or 1 was
assigned to each response. A score was then tabulated for
each respondent on each hypothesis. A Kruskal-Wallace one-
way analysis of variance by ranks was then run on each
hypothesis. A significant difference between the groups was
found on each of the seven hypotheses. On hypothesis 1 —
understanding the program, 2—adequacy of the program, and
4— U Se of results, the major difference appears to be between
legislators and educators. On hypothesis 3—fairness of the
program, 5—educational impact, and 6—public relations, the
major difference appears to be between teachers and the two
other groups. On hypothesis 7—improvements needed, there
are rather large differences between all three groups.
On hypothesis 1 legislators (mean rank, 62.46) indicated
less understanding than either superintendents (mean rank,
129) or teachers (mean rank, 123.66). On hypothesis 2
legislators (mean rank, 83.81) viewed the Arkansas Student
Assessment Program as being less adequate than either super-
intendents (mean rank, 123.24) or teachers (mean rank, 109.78)
176
On hypothesis 3 teachers (mean rank, 86.11) viewed the
Arkansas Student Assessment Program as being less fair than
did either legislators (mean rank, 119.32) or superintendents
(mean rank, 114.28). On hypothesis 4 legislators (mean rank,
68.28) felt less positive about the current use of the results
of the testing program than did either superintendents (mean
rank, 127.33) or teachers (mean rank, 119.98).
On hypothesis 5, teachers (mean rank, 86.78) felt that
the Arkansas Student Assessment Program has made less impact
on education in Arkansas than did either legislators (mean
rank, 113.13) or superintendents (mean rank, 117.39). On
hypothesis 6 teachers (mean rank, 88.26) were less positive
about the public relations aspect of the testing program than
were legislators (mean rank, 120.48) or superintendents (mean
rank, 110.89).
On hypothesis 7 (improvements) there is quite a differ-
ence between all three groups. Superintendents (mean rank,
130.83) were the most satisfied with the program as it is now.
Legislators (mean rank, 85.25) wanted the most improvements
in the program; and teachers (mean rank, 101.30) fell between
superintendents and legislators.
Individual Items Related to Superintendents of Large and Small School Districts
Superintendents who responded to the questionnaire were
divided into two groups—superintendents of large school

177
districts (average daily attendance 916 to 18,421, N = 23)
and superintendents of small school districts (average daily
attendance 93 to 417, N = 23). When the chi-square statistic
was applied to each item on the questionnaire and the .05
level of significance was used, a significant difference was
found between the groups on three of the forty items.
Two of the items (numbers 9 and 18) on which a signifi-
cant difference was found had to do with expanding the test.
On item 9, small-school superintendents wanted to keep the
tests as they are, while large-school superintendents were
more inclined to expand the test. Item 9 states that the
inclusion of the present subject matter being tested is
adequate. Sixty-five per cent of small-school superinten-
dents agreed and 9 per cent disagreed; and 35 per cent of
large—school superintendents agreed, and 35 per cent disagreed.
On item 18, small-school superintendents were more inclined
to have seniors pass a test before graduation (65 per cent
think seniors should pass a competency test before gradua-
tion) , while only 43 per cent of large-school superintendents
agree. Item 24 also produced an interesting difference.
Item 24 states that the Arkansas Student Assessment Program
is helping to bring accountability to Arkansas education.
Eighty-three per cent of large-school superintendents agreed
and 4 per cent disagreed, while only 52 per cent of small-
school superintendents agreed and 26 per cent disagreed.

178
Hypotheses Related to Superintendents of Large and Small School Districts
In analyzing the differences between the two groups on
each of the seven hypotheses, significant differences were
found on two of the hypotheses and in each case large—school
superintendents were more positive toward the program.
Hypothesis 8c states, "There is no significant difference
between superintendents of large school districts and super-
intendents of small school districts in their perception of
the fairness of the Arkansas Student Assessment Program."
Large-school superintendents (mean rank, 27.50) have a
greater feeling of fairness about the program than do small-
school superintendents (mean rank, 19.50). Hypothesis 8e
states, "There is no significant difference between super-
intendents of large school districts and superintendents of
small school districts in their perception of the educational
impact of the Arkansas Student Assessment Program." Large-
school superintendents (mean rank, 28.80) felt that the
program had a more positive impact than did small-school
superintendents (mean rank, 18.20).
Individual Items Related to Teachers in Large and Small School Districts
In order to examine differences between teachers in
large and small school districts, teachers who responded to
the questionnaire were divided into two groups those teach-
ing in large school districts (upper one-third of the sample;
179
average daily attendance 773 to 18,421; N = 25) and those
teaching in small school districts (lower one-third of the
sample; average daily attendance 93 to 323; N = 25). When
the chi-square statistic was applied to each question, and
the .05 level of confidence was used, significant differences
between the groups were apparent on two items. One of these
items (number 5) had to do with the fairness of the test.
Item 5 states that in a majority of schools, the Arkansas
Student Assessment Program is administered fairly. Sixty-
eight per cent of large-school teachers agreed, and none dis-
agreed. Only 40 per cent of small-school teachers agreed, and
20 per cent disagreed.
Item number 16 also produced interesting differences.
Item 16 states that schools utilize individual student
reports to better meet individual student needs. Small-
school teachers (68 per cent "agree" and 12 per cent "dis-
agree") felt that the individual score reports were being
used to meet individual student needs; large-school teachers
(44 per cent "agree" and 36 per cent "disagree") were not as
positive in their responses.
Hypotheses Related to Teachers in Large and Small School Districts
In examining the differences between the two groups on
the seven hypotheses, no significant differences were found.
Responses of teachers from large and small school districts
were similar on each hypothesis.

180
Conclusions
The following conclusions were drawn from the examina-
tion of the data.
1. A great deal of difference exists between the per-
ceptions of legislators and educators toward the Arkansas
Student Assessment Program.
2. Some differences exist between the perceptions of
superintendents and teachers toward the Arkansas Student
Assessment Program.
3. Superintendents and teachers have a better under-
standing of the testing program than do legislators.
4. Legislators would change the Arkansas Student
Assessment Program more than superintendents or teachers
would.
5. Teachers would change the testing program more than
superintendents would.
6. A majority of both superintendents and teachers
believe the tests are administered fairly in most schools.
7. Legislators would change the use of the results of
the program more than would superintendents or teachers.
8. Teachers would change the use of results more than
superintendents would.
9. Teachers are not as positive in their perception
of the educational impact of the Arkansas Student Assessment
Program as are legislators and superintendents.
181
10. Teachers are not as positive toward the public
relations aspect of the testing program as are legislators
and superintendents.
11. There should be uniform administration of tests,
and the results should not be reported so that comparisons
between school districts can be made.
12. Some differences exist between perceptions of super-
intendents of large and small school districts toward the
statewide testing program.
13. Large-school superintendents feel the program is
more fair than do small-school superintendents.
14. Large-school superintendents feel that the testing
program has had a greater impact on education than do small-
school superintendents.
15. Teachers of large school districts and small school
districts have similar views toward the Arkansas Student
Assessment Program.
Implications
results of this study have implications for all who
are interested in education in Arkansas, and particularly to
the Arkansas Department of Education, the Arkansas State
Legislature, the Arkansas Board of Education, and Adminis-
trators of Arkansas Public Schools. Significant differences
exist between legislators, superintendents, and teachers m
their perception of various aspects of the Arkansas Student
182
Assessment Program. Legislators make the laws dealing with
education; superintendents have the responsibility of seeing
that these laws are implemented in their school districts,
and teachers actually carry out the implementation in the
classrooms. A greater understanding is needed by these
three groups. The three groups should be working toward some
type of consensus on what type of testing program is best
for the school children of Arkansas. Legislators seem to
feel that expanding the tests into other subject areas and
other grade levels and expanding the use of results will
benefit education, while superintendents tend to want to hold
the "status quo." Teachers seem to be somewhat more negative
about the testing program than either legislators or super-
intendents .
Another implication is that because of a lack of uni-
formity in administration, the test results which are reported
do not always accurately reflect the abilities of the students
involved. For this and other reasons, the results of this
study also imply that the reporting of test scores so that
comparisons between districts can be made may not be helpful
to education in Arkansas.
Recommendations
As a result of the findings of this study, the following
recommendations are offered.

183
1. The testing program should be strengthened by more
uniform administration in one of the following ways: (a)
Testing officers appointed by the state administer the tests
in all school districts. (b) Strict guidelines should be
drawn up. The guidelines should include the following:
(1) Who is to administer the tests, (2) Who else can be in
the testing area, (3) What type prompting is allowable,
(4) Strict guidelines as to who is to be tested (special
education?), and (5) A signed statement that guidelines
were followed.
2. The tests should be changed each year and strong
test security measures should be taken in order to reduce
"teaching the test."
3. An information campaign should be launched to inform
the public about the Arkansas Student Assessment Program.
4. A twelfth-grade competency test should be instituted
as a part of the Arkansas Student Assessment Program.
5. A strong public relations effort on behalf of the
Arkansas Student Assessment Program needs to be directed
toward teachers.
6. Superintendents need to get into the classrooms
where the testing is taking place and try to understand the
perspective of the teachers.
7. Communication lines between superintendents and
teachers concerning the Arkansas Student Assessment Program
should carefully be kept open.
184
8. A study of this type needs to be done to assess
the perceptions of school board members and parents con-
cerning the Arkansas Student Assessment Program.

APPENDIX
185
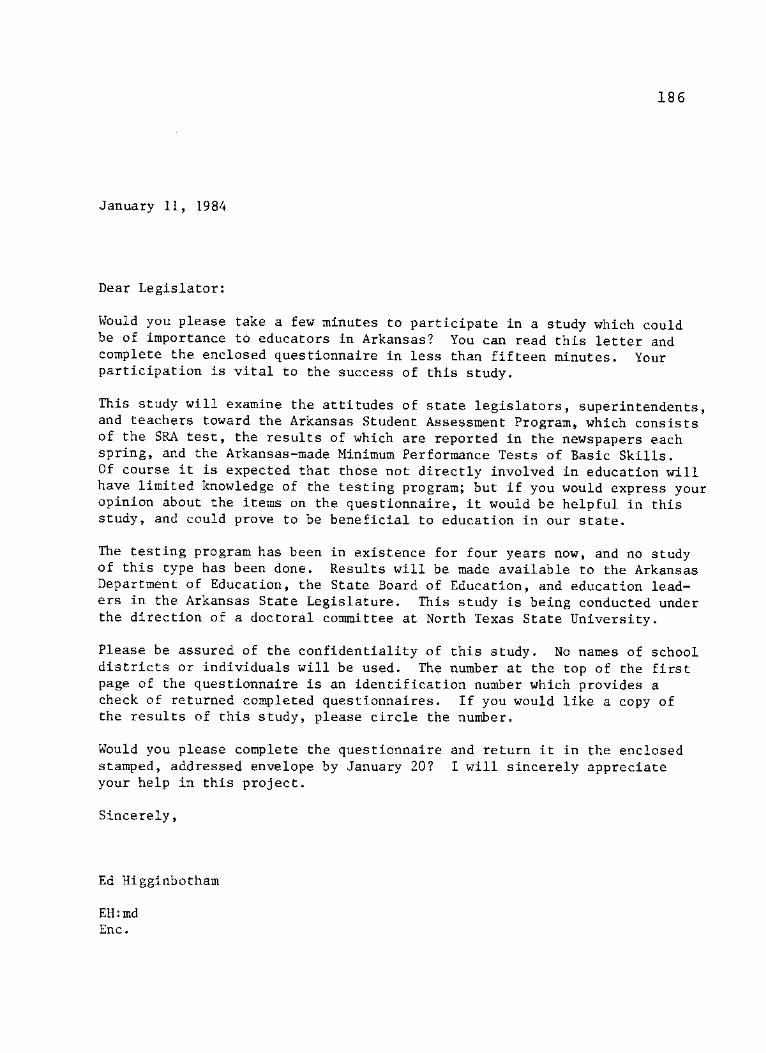
186
January 11, 1984
Dear Legislator:
Would you please take a few minutes to participate in a study which could be of importance to educators in Arkansas? You can read this letter and complete the enclosed questionnaire in less than fifteen minutes. Your participation is vital to the success of this study.
This study will examine the attitudes of state legislators, superintendents, and teachers toward the Arkansas Student Assessment Program, which consists of the SRA test, the results of which are reported in the newspapers each spring, and the Arkansas-made Minimum Performance Tests of Basic Skills. Of course it is expected that those not directly involved in education will have limited knowledge of the testing program; but if you would express your opinion about the items on the questionnaire, it would be helpful in this study, and could prove to be beneficial to education in our state.
The testing program has been in existence for four years now, and no study of this type has been done. Results will be made available to the Arkansas Department of Education, the State Board of Education, and education lead-ers in the Arkansas State Legislature. This study is being conducted under the direction of a doctoral committee at North Texas State University.
Please be assured of the confidentiality of this study. No names of school districts or individuals will be used. The number at the top of the first page of the questionnaire is an identification number which provides a check of returned completed questionnaires. If you would like a copy of the results of this study, please circle the number.
Would you please complete the questionnaire and return it in the enclosed stamped, addressed envelope by January 20? I will sincerely appreciate your help in this project.
Sincerely,
Ed Higginbotham
EH:md Enc.
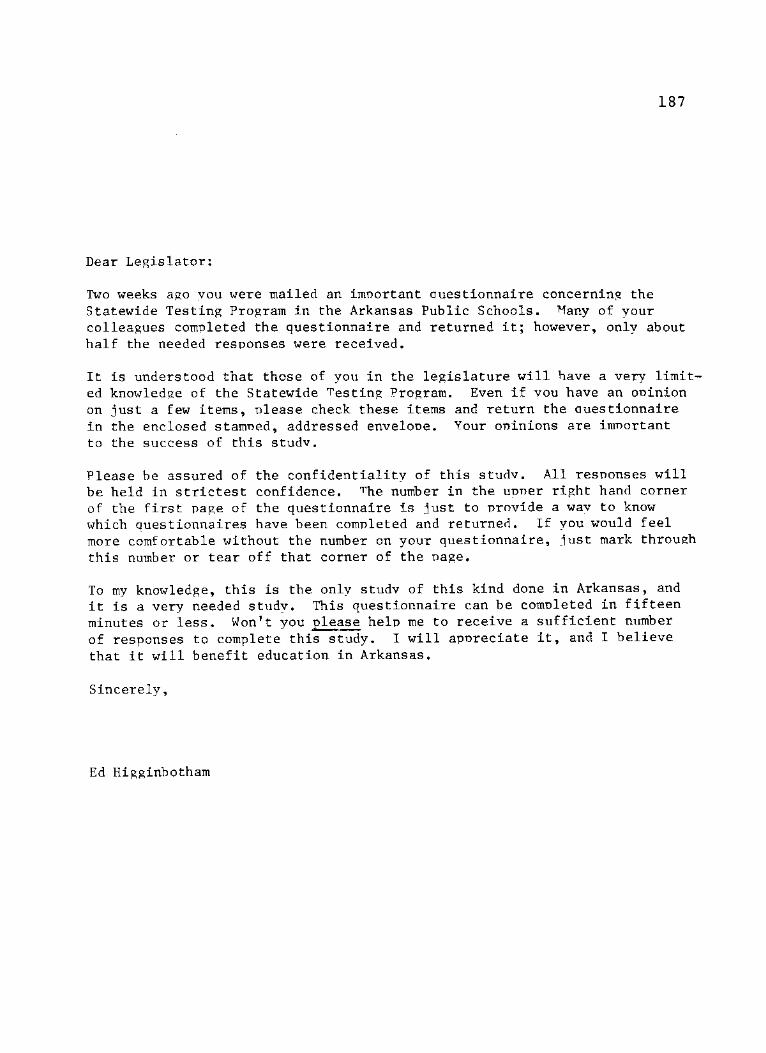
187
Dear Legislator:
Two weeks ago vou were mailed an important Questionnaire concerning the Statewide Testing Program in the Arkansas Public Schools. Many of your colleagues completed the questionnaire and returned it; however, only about half the needed responses were received.
It is understood that those of you in the legislature will have a very limit-ed knowledge of the Statewide Testing Program. Even if vou have an opinion on just a few items, please check these items and return the questionnaire in the enclosed stamped, addressed envelope. Your opinions are important to the success of this studv.
Please be assured of the confidentiality of this studv. All responses will be held in strictest confidence. The number in the upper right hand corner of the first page of the questionnaire is just to provide a wav to know which questionnaires have been completed and returned. If you would feel more comfortable without the number on your questionnaire, just mark through this number or tear off that corner of the page.
To my knowledge, this is the only studv of this kind done in Arkansas, and it is a very needed study. This questionnaire can be completed in fifteen minutes or less. Won't you please help me to receive a sufficient number of responses to complete this study. I will appreciate it, and I believe that it will benefit education in Arkansas.
Sincerely,
Ed Higginbotham

188
February 13, 1984
Dear legislator:
I really need your help today. Won't you please help me to complete a study of the Arkansas Statewide Testing Program? I realize that you are unfamiliar with many of the items on the questionnaire, but if you would just mark those items on which you have an opinion and leave the others blank, that would still count as a completed response. My doctoral com- -mittee has specified that responses must be received from 50% of the legislators in order to complete this study; otherwise the study will have to be discontinued. I know this is a needed and worthwhile study. A lot of hard work has already been put into it, and sufficient response has been received from superintendents and teachers. Won't you please complete this questionnaire now and return it in the enclosed stamped addressed en-velope? I need to receive the completed questionnaire by Friday, Febru-ary 24. It will take only a few minutes, and it is so very important to me, and I believe it will be important to education in Arkansas.
Sincerely,
Ed Higginbotham
P. S. The number in the upper right hand corner is to keep a record of returned responses. If you would like, just tear off the number, and there is no possible way to identify the respondent.
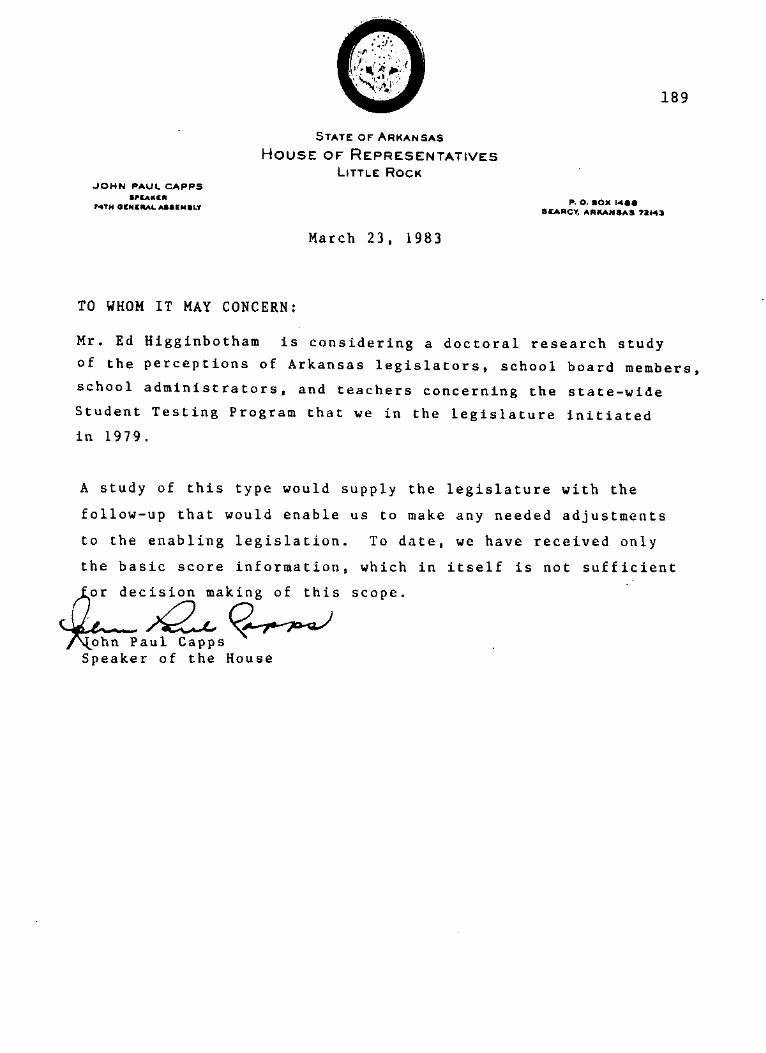
189
JOHN PAUL CAPPS SPEAKER
7 4 T H O E N E R A L ASSEMBLY
S T A T E OF A R K A N S A S
H O U S E OF R E P R E S E N T A T I V E S L I T T L E R O C K
March 23, 1983
p. o. box i*aa S C A R C Y , A R K A N S A S 7 2 1 4 3
TO WHOM IT MAY CONCERN:
Mr. Ed Higginbotham is considering a doctoral research study
of the perceptions of Arkansas legislators, school board members,
school administrators, and teachers concerning the state-wide
Student Testing Program that we in the legislature initiated
in 1979.
A study of this type would supply the legislature with the
follow-up that would enable us to make any needed adjustments
to the enabling legislation. To date, we have received only
the basic score information, which in itself is not sufficient
or decision making of this scope.
ohn Paul Capps
Speaker of the House
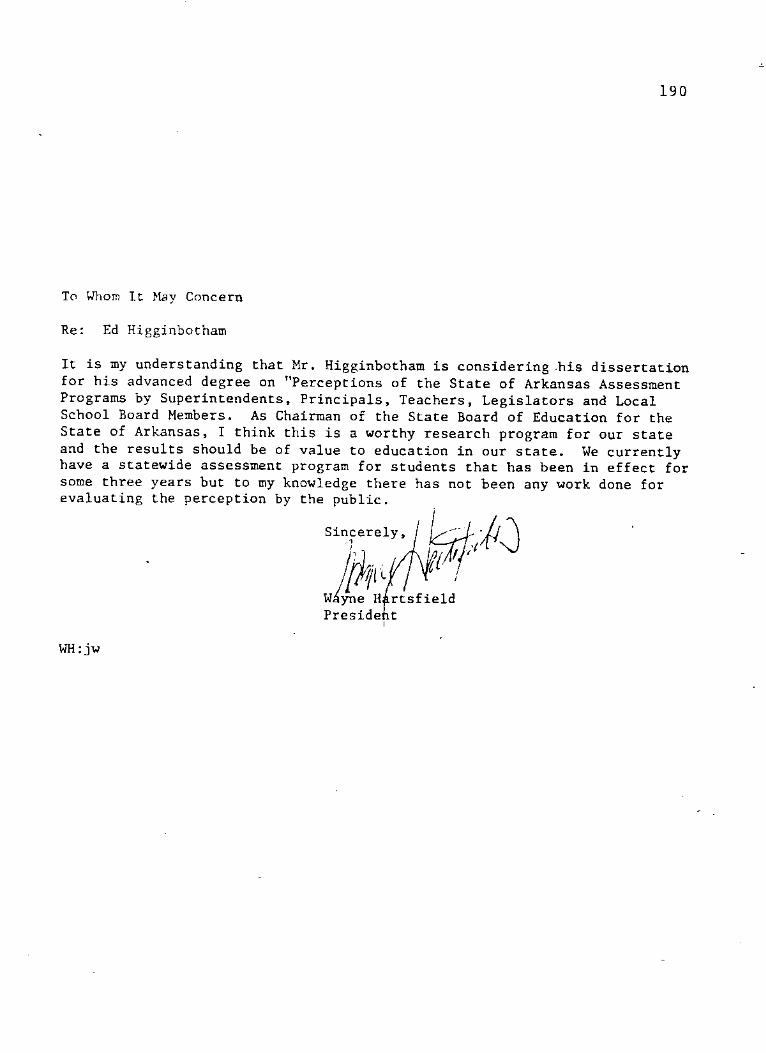
190
To Whom It May Concern
Re: Ed Higginbotham
It is my understanding that Mr. Higginbotham is considering his dissertation for his advanced degree on "Perceptions of the State of Arkansas Assessment Programs by Superintendents, Principals, Teachers, Legislators and Local School Board Members. As Chairman of the State Board of Education for the State of Arkansas, I think this is a worthy research program for our state and the results should be of value to education in our state. We currently have a statewide assessment program for students that has been in effect for some three years but to my knowledge there has not been any work done for evaluating the perception by the public.
Sincerely, '7
Wayne HArtsfield President
WH: jw
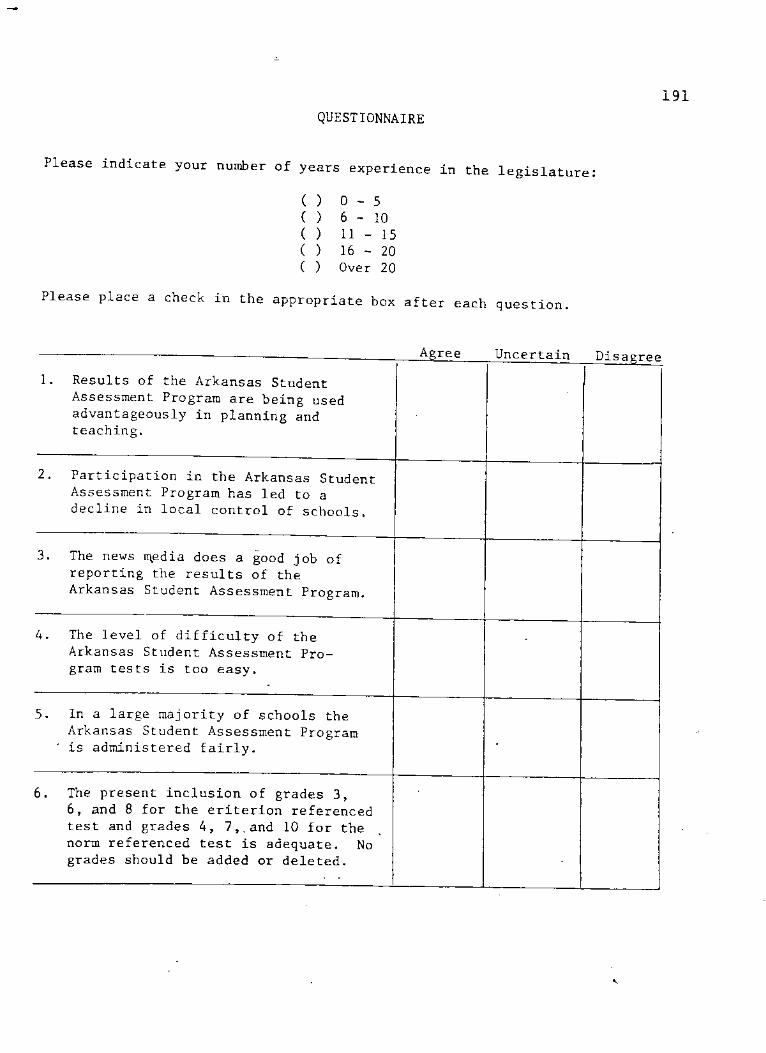
191
QUESTIONNAIRE
Please indicate your number of years experience in the legislature:
0 - 5 6 - 1 0 11 - 15 16 - 20 Over 20
Please place a check in the appropriate box after each question.
1. Results of the Arkansas Student Assessment Program are being used advantageously in planning and teaching.
Agree uncertain Disagree
2. Participation in the Arkansas Student Assessment Program has led to a decline in local control of schools.
3. The news media does a good job of
reporting the results of the
Arkansas Student Assessment Program.
4. The level of difficulty of the Arkansas Student Assessment Pro-gram tests is too easy.
5. In a large majority of schools the Arkansas Student Assessment Program
' is administered fairly. -
6. The present inclusion of grades 3,
6, and 8 for the eriterion referenced test and grades 4, 7,. and 10 for the norm referenced test is adequate. No grades should be added or deleted.
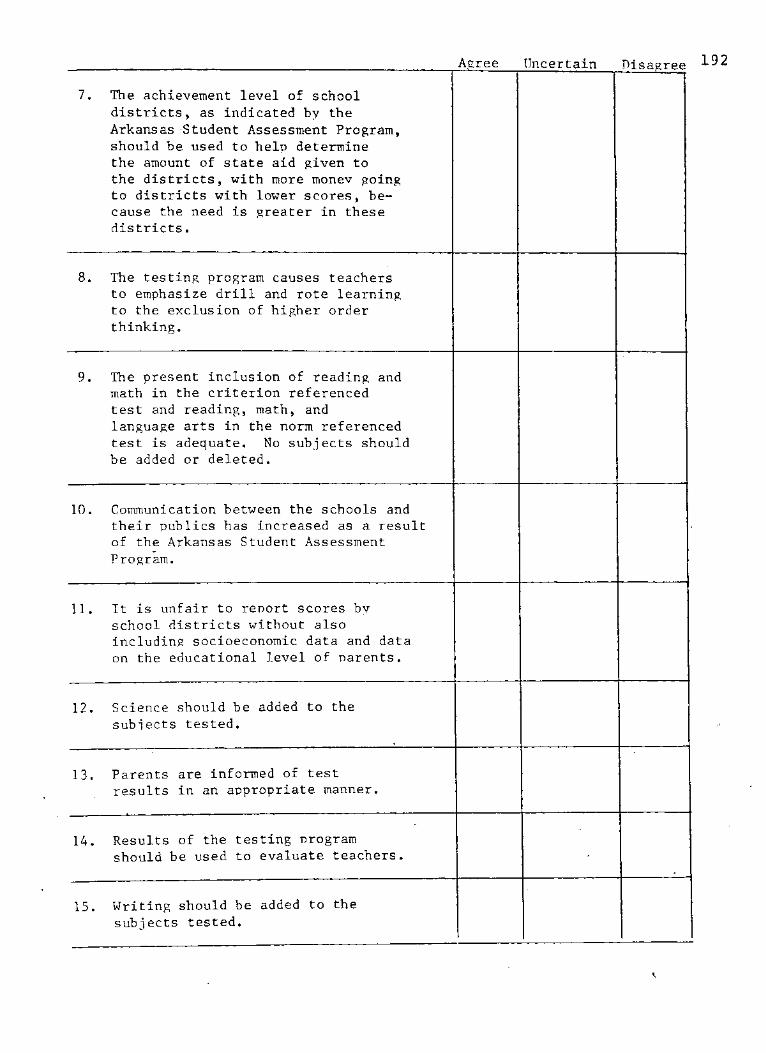
Agree Uncertain Disagree 192
7. The achievement level of school districts, as indicated by the Arkansas Student Assessment Program, should be used to help determine the amount of state aid given to the districts, with more money going to districts with lower scores, be-cause the need is greater in these districts.
8. The testing program causes teachers to emphasize drill and rote learning to the exclusion of higher order thinking.
9. The present inclusion of reading and math in the criterion referenced test and reading, math, and language arts in the norm referenced test is adequate. No subjects should be added or deleted.
10. Communication between the schools and their publics has increased as a result of the Arkansas Student Assessment Program.
11. It is unfair to report scores by school districts without also including socioeconomic data and data on the educational level of parents.
12. Science should be added to the subjects tested.
13. Parents are informed of test results in an appropriate manner.
14. Results of the testing program should be used to evaluate teachers.
15. Writing should be added to the subjects tested.
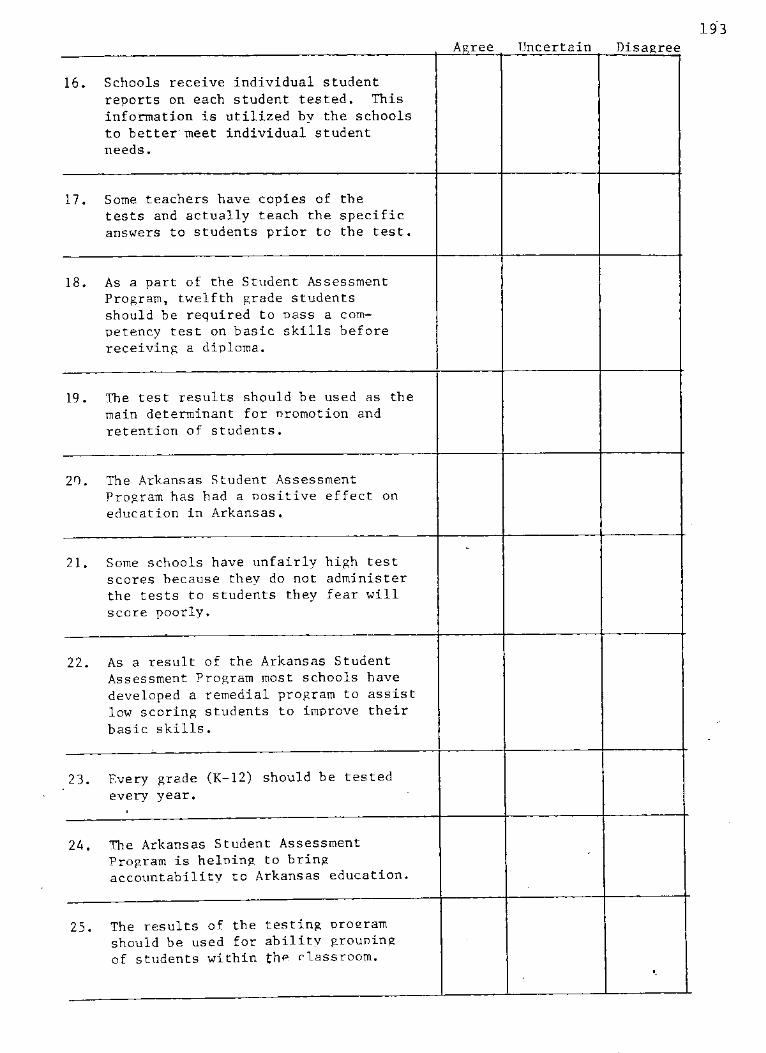
193 Agree Uncertain Disagree
16. Schools receive individual student reports on each student tested. This information is utilized by the schools to better meet individual student needs.
17. Some teachers have copies of the tests and actually teach the specific answers to students prior to the test.
18. As a part of the Student Assessment Program, twelfth grade students should be required to pass a com-petency test on basic skills before receiving a diploma.
19. The test results should be used as the main determinant for promotion and retention of students.
20. The Arkansas Student Assessment Program has had a positive effect on education in Arkansas.
21. Some schools have unfairly high test scores because they do not administer the tests to students they fear will score poorly.
22. As a result of the Arkansas Student Assessment Program most schools have developed a remedial program to assist low scoring students to improve their basic skills.
23. Every grade (K-12) should be tested
every year.
24. The Arkansas Student Assessment Program is helping to bring accountability to Arkansas education.
25. The results of the testing program should be used for ability grouping of students within the classroom.
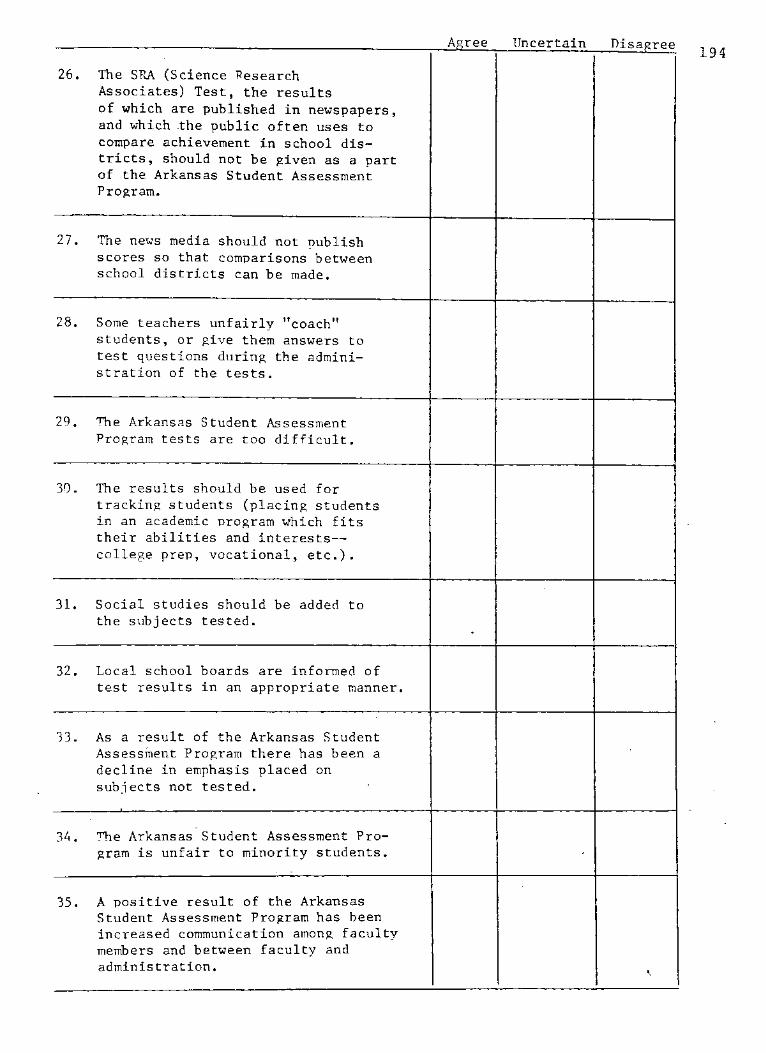
26. The SRA (Science Research Associates) Test, the results of which are published in newspapers, and which the public often uses to compare achievement in school dis-tricts, should not be given as a part of the Arkansas Student Assessment Program.
27. The news media should not publish scores so that comparisons between school districts can be made.
28. Some teachers unfairly "coach11
students, or give them answers to test questions during the admini-stration of the tests.
29. The Arkansas Student Assessment Program tests are too difficult.
30. The results should be used for tracking students (placing students in an academic program which fits their abilities and interests— college prep, vocational, etc.).
31. Social studies should be added to the subjects tested.
32. Local school boards are informed of test results in an appropriate manner.
33. As a result of the Arkansas Student Assessment Program there has been a decline in emphasis placed on subjects not tested.
34. The Arkansas Student Assessment Pro-gram is unfair to minority students.
35. A positive result of the Arkansas Student Assessment Program has been increased communication among faculty members and between faculty and administration.
194
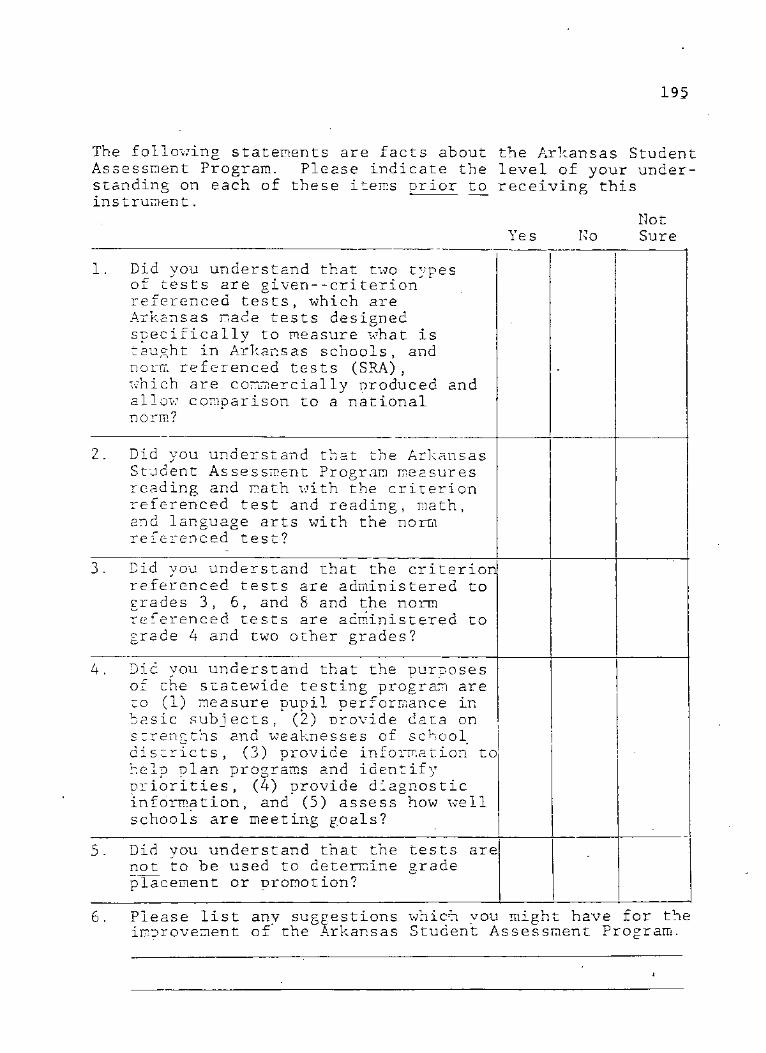
195
The following statements are facts about Assessment Program. Please indicate the standing on each of these items prior to instrument.
the Arkansas Student level of your under-receiving this
Yes No Not Sure
1. Did you understand that two types of tests are given — criterion referenced tests, which are Arkansas made tests designed specifically to measure what is taught in Arkansas schools, and norm referenced tests (SRA), which are commercially produced and allow comparison to a national norm?
•
2. Did you understand that the Arkansas Student Assessment Program measures reading and math with the criterion referenced test and reading, math, and language arts with the norm referenced test?
3. Did you understand that the criterion referenced tests are administered to grades 3, 6, and 8 and the norm referenced tests are administered to grade 4 and two other grades?
4. Did you understand that the purposes of the statewide testing program are zo (1) measure pupil performance in basic subjects, (2) provide data on strengths and weaknesses of school districts, (3) provide information to help plan programs and identify priorities, (4) provide diagnostic information, and (5) assess how well schools are meeting goals?
5. Did you understand that the tests are not to be used to determine grade placement or promotion?
6. Please list any suggestions which you might have for the improvement of the Arkansas Student Assessment Program.
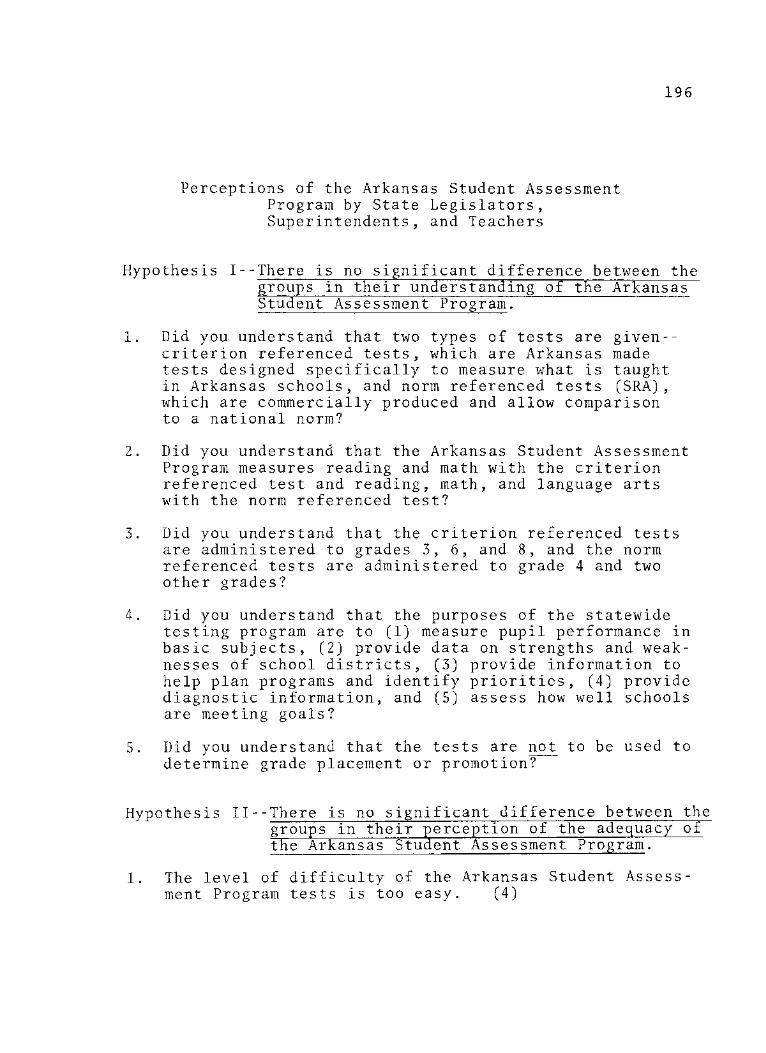
196
Perceptions of the Arkansas Student Assessment Program by State Legislators, Superintendents, and Teachers
Hypothesis I--There is no significant difference between the groups in their understanding of the Arkansas Student Assessment Program.
1. Did you understand that two types of tests are given--criterion referenced tests, which are Arkansas made tests designed specifically to measure what is taught in Arkansas schools, and norm referenced tests (SRA), which are commercially produced and allow comparison to a national norm?
2. Did you understand that the Arkansas Student Assessment Program measures reading and math with the criterion referenced test and reading, math, and language arts with the norm referenced test?
3. Did you understand that the criterion referenced tests are administered to grades 3, 6, and 8, and the norm referenced tests are administered to grade 4 and two other grades?
4. Did you understand that the purposes of the statewide testing program are to (1) measure pupil performance in basic subjects, (2) provide data on strengths and weak-nesses of school districts, (3) provide information to help plan programs and identify priorities, (4) provide diagnostic information, and (5) assess how well schools are meeting goals?
5. Did you understand that the tests are not to be used to determine grade placement or promotion?
Hypothesis II--There is no significant difference between the groups in their perception of the adequacy of the Arkansas Student Assessment Program^
1. The level of difficulty of the Arkansas Student Assess-ment Program tests is too easy. (4)
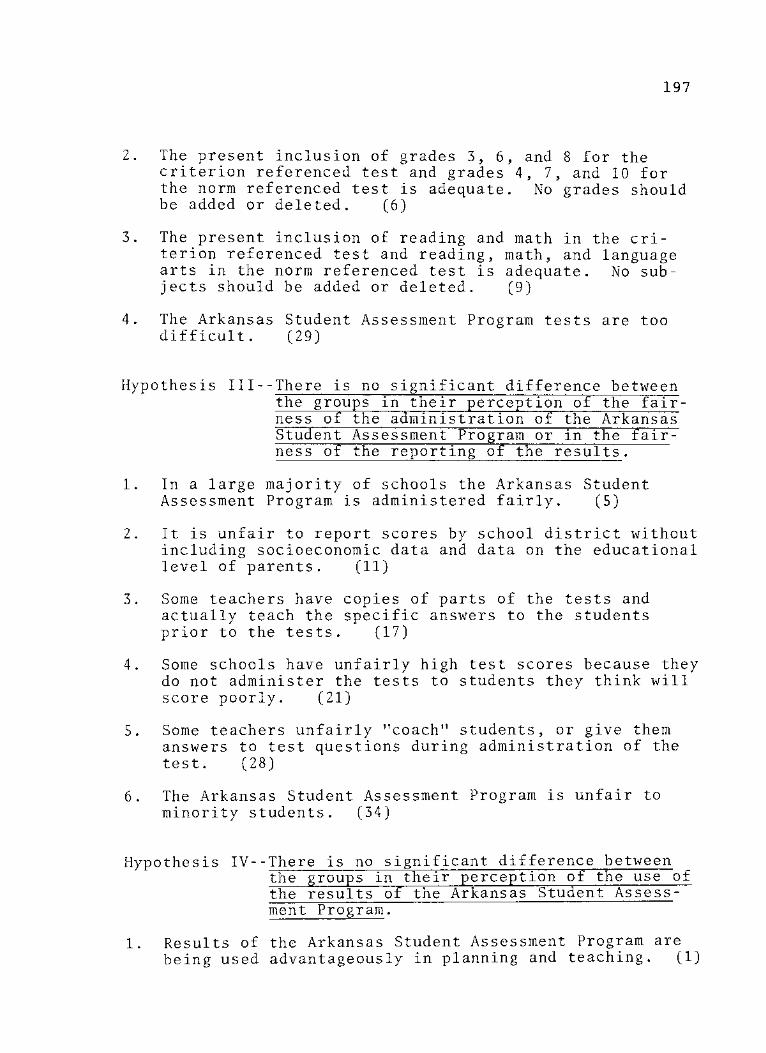
197
2. The present inclusion of grades 3, 6, and 8 for the criterion referenced test and grades 4, 7, and 10 for the norm referenced test is adequate. No grades should be added or deleted. (6)
3. The present inclusion of reading and math in the cri-terion referenced test and reading, math, and language arts in the norm referenced test is adequate. No sub-jects should be added or deleted. (9)
4. The Arkansas Student Assessment Program tests are too difficult. (29)
Hypothesis III--There is no significant difference between the groups in their perception of the fair-ness of the administration of the Arkansas Student Assessment Program or in the fair-ness of the reporting of the results.
1. In a large majority of schools the Arkansas Student Assessment Program is administered fairly. (5)
2. It is unfair to report scores by school district without including socioeconomic data and data on the educational level of parents. (11)
3. Some teachers have copies of parts of the tests and actually teach the specific answers to the students prior to the tests. (17)
4. Some schools have unfairly high test scores because they do not administer the tests to students they think will score poorly. (21)
5. Some teachers unfairly "coach" students, or give them answers to test questions during administration of the test. (28)
6. The Arkansas Student Assessment Program is unfair to minority students. (34)
Hypothesis IV--There is no significant difference between the groups in their perception of the use of the results of the Arkansas Student Assess-ment Program.
1. Results of the Arkansas Student Assessment Program are being used advantageously in planning and teaching. (1)

198
2. The achievement level of districts, as indicated by the Arkansas Student Assessment Program, should be used to help determine the amount of state aid given to the dis-tricts, with more money going to districts with lower scores, because the need is greater in these dis-tricts. (7)
3. Results of the testing program should be used to evalu-ate teachers. (14)
4. Schools receive individual student reports on each stu-dent tested. This information is utilized by the schools to better meet individual student needs. (16)
5. The test results should be used as the main determinant for promotion and retention of students. (19)
6. As a result of the Arkansas Student Assessment Program most schools have developed a remedial program to assist low-scoring students to improve basic skills. (22)
7. The results of the testing program should be used for ability grouping of students within the classroom. (25)
8. The results should be used for tracking students (plac-ing students in an academic program which fits their abilities and interests--college prep, vocational, etc.). (30)
Hypothesis V--There is no significant difference between the groups in their perception of the educational fc> ^ ^ ^ v -• ~ ~ f w v v ~ w
impact of the Arkansas Student Assessment Program.
1. Participation in the Arkansas Student Assessment Program has led to a decline in local control of schools. (2)
2. The testing program causes teachers to emphasize drill and rote learning to the exclusion of higher order thinking. (8)
3. The Arkansas Student Assessment Program has had a posi-tive effect on education in Arkansas. (20)
4. The Arkansas Student Assessment Program is helping to bring accountability to Arkansas education. (24)
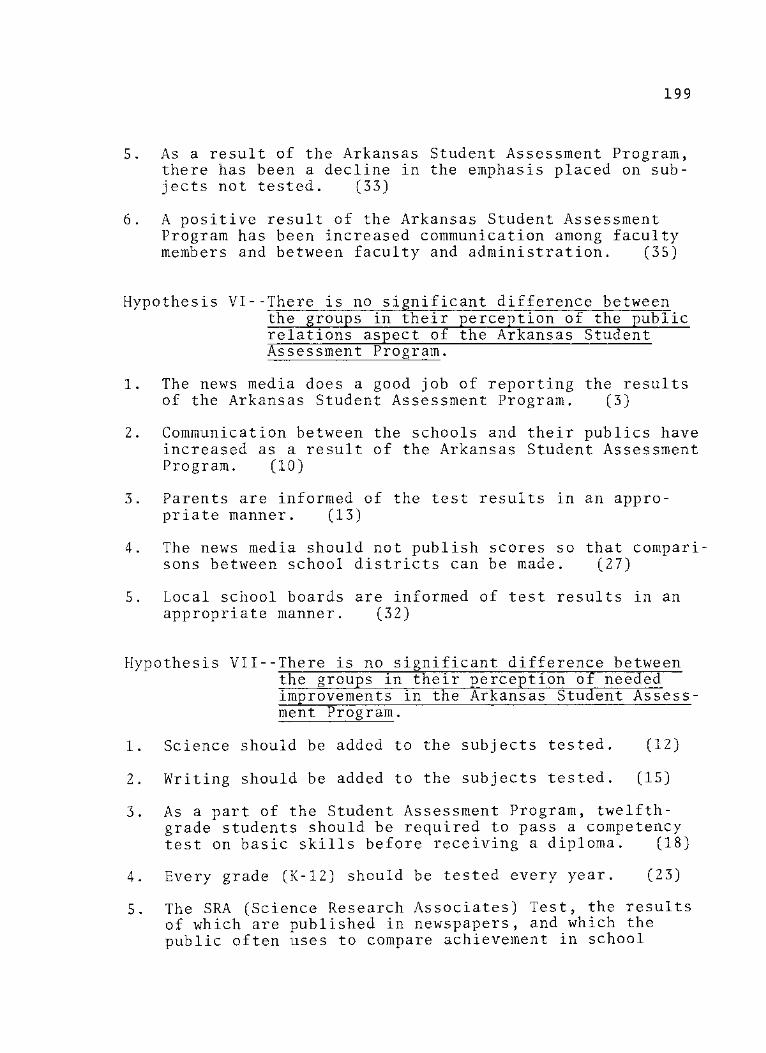
199
5. As a result of the Arkansas Student Assessment Program, there has been a decline in the emphasis placed on sub-jects not tested. (33)
6. A positive result of the Arkansas Student Assessment Program has been increased communication among faculty members and between faculty and administration. (35)
Hypothesis VI--There is no significant difference between the groups in their perception of the public relations aspect of the Arkansas Student Assessment Program.
1. The news media does a good job of reporting the results of the Arkansas Student Assessment Program. (3)
2. Communication between the schools and their publics have increased as a result of the Arkansas Student Assessment Program. (10)
3. Parents are informed of the test results in an appro-priate manner. (13)
4. The news media should not publish scores so that compari-sons between school districts can be made. (27)
5. Local school boards are informed of test results in an appropriate manner. (32)
Hypothesis VII--There is no significant difference between the groups in their perception of needed improvements in the Arkansas Student Assess-ment Program.
1. Science should be added to the subjects tested. (12)
2. Writing should be added to the subjects tested. (15)
3. As a part of the Student Assessment Program, twelfth-grade students should be required to pass a competency test on basic skills before receiving a diploma. (18)
4. Every grade (K-12) should be tested every year. (23)
5. The SRA (Science Research Associates) Test, the results of which are published in newspapers, and which the public often uses to compare achievement in school
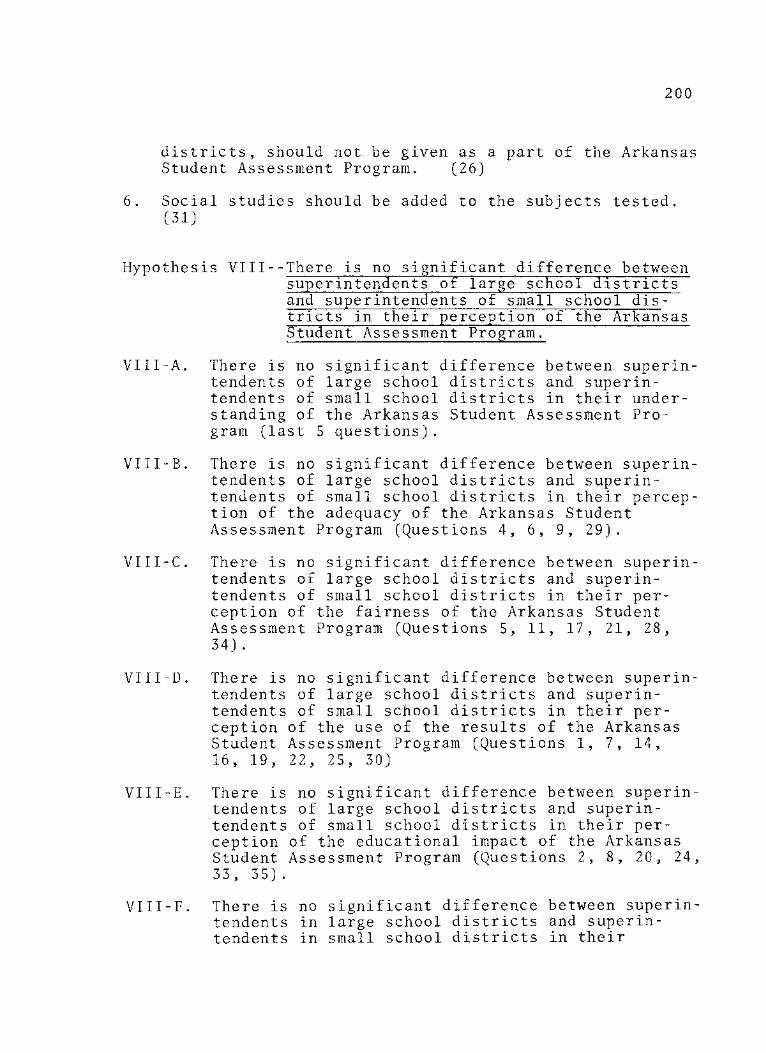
200
districts, should not be given as a part of the Arkansas Student Assessment Program. (26)
6. Social studies should be added to the subjects tested. (31)
Hypothesis VIII--There is no significant difference between superintendents of large school districts and superintendents of small school dis-tricts in their perception of the Arkansas Student Assessment Program."
VIII-A. There is no significant difference between superin-tendents of large school districts and superin-tendents of small school districts in their under-standing of the Arkansas Student Assessment Pro-gram (last 5 questions).
VIII-B. There is no significant difference between superin-tendents of large school districts and superin-tendents of small school districts in their percep-tion of the adequacy of the Arkansas Student Assessment Program (Questions 4, 6, 9, 29).
VIII-C. There is no significant difference between superin-tendents of large school districts and superin-tendents of small school districts in their per-ception of the fairness of the Arkansas Student Assessment Program (Questions 5, 11, 17, 21, 28, 34).
VIII-D. There is no significant difference between superin-tendents of large school districts and superin-tendents of small school districts in their per-ception of the use of the results of the Arkansas Student Assessment Program (Questions 1, 7, 14, 16, 19, 22, 25, 30)
VIII-E. There is no significant difference between superin-tendents of large school districts and superin-tendents of small school districts in their per-ception of the educational impact of the Arkansas Student Assessment Program (Questions 2, 8, 20, 24, 33, 35).
VIII-F. There is no significant difference between superin-tendents in large school districts and superin-tendents in small school districts in their

201
perception of the public relations aspect of the Arkansas Student Assessment Program (Questions 3, 10, 13, 27, 32).
VIII-G. There is no significant difference between superin-tendents in large school districts and superin-tendents in small school districts in their per-ception of the improvements needed in the Arkansas Student Assessment Program (Questions 12, 15, 18, 23, 26, 31)
Hypothesis IX--There is no significant difference between teachers in large school districts and teachers in small school districts in their perception of the Arkansas Student Assessment Program.
IX-A. There is no significant difference between teachers in large school districts and teachers in small school districts in their understanding of the Arkansas Student Assessment Program (last 5 questions)
IX-B. There is no significant difference between teachers in large school districts and teachers in small school districts in their perception of the adequacy of the Arkansas Student Assessment Program (Questions 4, 6, 9, 29) .
IX-C. There is no significant difference between teachers in large school districts and teachers in small school districts in their perception of the fairness of the administration of the Arkansas Student Assess-ment Program or in the fairness of the reporting of the results (Questions 5, 11, 17, 21, 28, 34).
IX-D. There is no significant difference between teachers in large school districts and teachers in small school districts in their perception of the use of the results of the Arkansas Student Assessment Pro-gram (Questions 1, 7, 14, 16, 19, 22, 25, 30).
IX-E. There is no significant difference between teachers in large school districts and teachers in small school districts in their perception of the educa-tional impact of the Arkansas Student Assessment Program (Questions 2, 8, 20, 24, 33, 35).
202
IX-F. There is no significant difference between teachers in large school districts and teachers in small school districts in their perception of the public relations aspect of the Arkansas Student Assessment Program (Questions 3, 10, 13, 27, 32).
IX-G. There is no significant difference between teachers in large school districts and teachers in small school districts in their perception of improvements needed in the Arkansas Student Assessment Program (Questions 12, 15, 18, 23, 26, 31).
BIBLIOGRAPHY
Books
Naisbitt, John, Megatrends, New York, Warner Books, Inc., 1982.
Articles
Atkinson, Donald R., "State Mandated Minimum Competency Testing Programs: Implications for School Counselors," The School Counselor, 29 (September, 1981), 22-27.
Barnes, Ronald E., Karen Moriarty, and John Murphy, "Report-ing Tests Results: The Missing Key in Most Testing Programs," National Association of Secondary School Principals Bulletin, 66 (November, 1982), 14-20.
Coburn, Terrence G., "Statewide Assessment and Curriculum Planning: One State's Experience," Arithmetic Teacher, 27 (November, 1979), 14-20.
Cole, Robert W., "A New Recipe for a Kettle of Fish," Phi Delta Kappan, 62 (May, 1981), 618.
Cook, Ann, Herb Mack and Deborah Neier, "New York's Great Reading Score Scaldal," The National Elementary Princi-pal , 59 (January, 1980), 77-80.
Dowdy, Betty J., "Is the BEST Always the Best?," School and Community, 67 (October, 1980), 16-17, 59.
Edelman, Joyce, "The Impact of the Mandated Testing Program on Classroom Practices: Teacher Perspectives," Educa-tion, 1002 (Fall, 1981), 56-59.
Finn, Chester E., "A Call for Quality Education," American Renewal, Reprint from Life Magazine, Time, Inc., 1981.
Greene, Leroy F., "The State Assessment Question—An Answer," Compact, 11 (Summer, 1977), 5-8.
Impara, James C., "Valid and Invalid Uses of Statewide Assessment," Educational Technology, 18 (September, 1978) , 5-9.
203
204
Madaus, George F., "NIE Clarification Hearing: The Negative Team's Case," Phi Delta Kappan, 63 (October, 1981), 92-94.
Owen, David, "1983 The Last Days of ETS," Harpers, 266 (May, 1983), 21-35.
Palmer, Princess, Sande Milton, and Linda Fears, "Florida's Minimum Competency Program: A Survey of Teachers' Opinions," The High School Journal, 66 (December, 1982-January, 1983), 104-109.
Pipho, Chris, "Variety Marks State Efforts in Testing," Phi Delta Kappan, 64 (November, 1982), 157-158.
Popham, W. James, "The Case for Minimum Competency Testing," Phi Delta Kappan, 63 (October, 1981), 89-91.
Popham, W. James and Elaine Lindheim, "Implications of a Landmark Ruling in Florida's Minimum Competency Test," Phi Delta Kappan, 63 (September, 1981), 18-20.
, "Minimum Competency Tests Spur Instructional Improvement," Phi Delta Kappan, 62 (May, 1981), 637-639.
Pullin, Diana, "Minimum Competency Testing and the Demand for Accountability," Phi Delta Kappan, 63 (September, 1981), 20-22.
Roeber, Edward D., David L. Donovan, and Richard T. Cole, "Telling the Statewide Testing Story . . . and Living to Tell It Again," Phi Delta Kappan, 62 (December, 1980), 273-274.
Rosenthal, Alan and Susan Fuhrman, "State Legislatures and Educational Policy: An Overview," Educational Horizons, 61 (Fall, 1982), 4-9.
Serow, Robert C. and James J. Davies, "Resources and Outcomes of Minimum Competency Testing as Measures of Equality of Educational Opportunity," American Educational Research Journal, 19 (Winter, 1982), 529— 539"!
Thurston, Paul and Ernest House, "The NIE Adversary Hearing on Minimum Competency Testing," Phi Delta Kappan, 63 (October, 1981), 87-89.
205
Wall, Janet and William J. Geppert, "Initiating School Change Through a Statewide Testing Program in Mathe-matics," School Science and Mathematics, 84 (January, 1981), 51-54.
Walton, Susan and Thomas Toch, "Competency Tests Linked to Decline in Analytic Skills," Education Week, 1 (December 8, 1982), 1, 17.
Reports
Bracey, Gerald W., "On the Compelling Need to go Beyond Minimum Competency," report presented at the annual NAEP Conference on Large Scale Assessment, Boulder, Colorado, June 8, 1982.
Brunton, Max L., "Is Competency Testing Accomplishing Any Breakthrough in Achievement?," report presented at the annual meeting of the Association for Supervisors and Curriculum Development, Anaheim, California, March 20-23, 1982.
Elford, George, "A Review of Policy Issues Related to Competency Testing for High School Graduation," report presented at the annual meeting of the New England Educational Research Organization, Manchester, New Hampshire, May 4-7, 1977.
Gillespie, Ellen B., "Implications of the Louisiana Basic Skills Test for Special Education Students," report presented at the annual meeting of the American Educa-tional Research Association and the National Council on Measurement in Education, New York, 1982.
Glasman, Naftaly S., "State Perceptions on State-Wide Evalua-tion in California," report presented at the annual meeting of the National Conference of Professors of Educational Administration, Seattle, Washington, August 16-21, 1981.
Gorth, William P. and Mary R. Perkins, "A Study of Minimum _ Competency Testing Programs. Final Summary and Analysis Report," National Evaluation Systems, Inc., Amherst, Massachusetts.
Mizell, M. Hayes, "Parents'/Advocates' Strategies to Assure the Appropriate Use of Tests in Public Elementary and Secondary Schools," ERIC Document ED 195 55G.
206
New York State Education Department, "A Report to the Board of Regents on the Basic Competency Testing Program," Albany Division of Educational Testing, May, 1978.
North Carolina State Department of Public Instruction, "Report of Student Performance, 1978," North Carolina Competency Test Program, Raleigh, North Carolina, 1978.
Parramore, Barbara M. and others, "Effects of Mandatory Competency Testing in North Carolina: The Class of 1980," report presented at the annual meeting of the Evaluation Research Society, Washington, D. C., November 19-22, 1980.
Pechman, Ellen, "The Effects of Promotional Testing on a Large City School System," report presented at the annual meeting of the American Educational Research Association, New York, 1982.
Peck, Hugh I., "The Role of Basic Skills Testing in Louisiana," report presented at the annual meeting of the National Council on Measurement in Education, New York, March 20-22, 1982.
Ramsbotham, Ann and others, "The Status of Minimum Competency Programs in Twelve Southern States: A Report of the Southwestern Public Education Program," Southwestern Public Education Program, Jackson, Mississippi, April, 1980.
Roeber, Edward D., "Teaching Local Educators to Use and Report State Assessment Results," ERIC Document ED 211 570, 1980.
Rudman, Herbert C., "Uses and Abuses of Standardized Testing," report delivered at annual meeting of North Central Association of Colleges and Schools, Chicago, Illinois, March 23, 1983.
Sebring, Penny A. and Robert F. Boruch, "Beyond the Use of NAEP: Lessons for Increasing the Use of State and Local Assessment Results," report presented at the National Assessment of Educational Progress Conference on Large Scale Assessment, Boulder, Colorado, June 7-10, 1982.
207
Publications Of Learned Organizations
Ahmann, Stanley, How Much Are Our Young People Learning? The Story of the National Assessment, Phi Delta Kappa Fastback Number 68, Phi Delta Kappa Educational Foundation, Bloomington, Indiana, 1976.
Beckham, Joseph, Legal Implications of Minimum Competency Testing, Phi Delta Kappa Fastback Number 138, Phi Delta Kappa Educational Foundation, Bloomington, Indiana, 1980.
Ebel, Robert, The Uses of Standardized Testing, Phi Delta Kappa Fastback Number 93, Phi Delta Kappa Educational Foundation, Bloomington, Indiana, 1977.
Gorce, Martin J., "Competency-Based Testing: Some Results," NCA Quarterly, 57 (Winter, 1983), 370-735.
Parnell, Dale, The Case for Competency-Based Education, Phi Delta Kappa Fastback Number 118, Phi Delta Kappa Educational Foundation, Bloomington, Indiana, 1978.
Perrone, Vito, The Abuses of Standardized Testing, Phi Delta Kappa Fastback Number 92, Phi Delta Kappa Educational Foundation, Bloomington, Indiana, 1977.
Riegel, Rodney P. and Ned B. Lovell, Minimum Competency Testing, Phi Delta Kappa Fastback Number 137, Phi Delta Kappa Educational Foundation, Bloomington, Indiana, 1980.
Public Documents
Arkansas State Legislature, Act 666 of 1979, Regular Session, 72nd General Assembly, March 30, 1979.
Alaska Department of Education, "Alaska Statewide Assessment: A Comparison of the 1977 and 1979 Results," Juneau, 1980.
Brown, William J., "Considerations in Conducting Large-Scale Writing Assessments as Part of Minimum Competency Test-ing," North Carolina Department of Public Instruction, Raleigh, North Carolina, April, 1982.
National Commission on Excellence in Education, "A Nation at Risk," April, 1983.
208
Unpublished Materials
Baldassare, Louis J., "Overt Controversies about Pennsylvania's Educational Quality Assessment Program," unpublished doctoral dissertation, College of Education, University of Pittsburgh, Pittsburgh, Pennsylvania, 1978.
Cooley, Carl, "Perceptions of the Louisiana State Assessment Program by Superintendents, Principals, and Teachers," unpublished doctoral dissertation, College of Education, North Texas State University, Denton, Texas, 1981.
Horn, Nicholas J., "Competency-Based Testing in Nevada: Perceptions of Legislators, School District Superinten-dents, Local School Board Presidents, and Third-Grade Teachers," unpublished doctoral dissertation, College of Education, University of Nevada, Las Vegas, Nevada, August, 1980.
Johnson, Maryanne, "An Analysis of Administrator Perceptions of Mandatory Evaluation Programs in Elementary and Secondary Schools," unpublished doctoral dissertation, College of Education, Washington State University, Pullman, Washington, n.d.
Prince, Julian D., "A Study of the Mississippi Educational Assessment Program as Operated by the Mississippi State Department of Education During the 1977-1978 Academic Years," University of Mississippi, 1980.
Walters, Judy Ann, "An Analysis of the Attitudes of Selected Public School Educators in Tennessee Toward Minimum Competency Testing," unpublished doctoral dissertation, College of Education, East Tennessee State University, Johnson City, Tennessee, 1980.
Newspapers
Associated Press, "A.E.A. Hits Lack of Data," Arkansas Gazette, September 6, 1981, pp. 1A, 2A.
, "Educators Blame Economic Attitudes," Arkansas Gazette, September 6, 1981, pp. 1A, 4A.
, "Ruling Upholds Skills Test Used in Florida Schools; Bias Argument Reported," Arkansas Gazette, May 5, 1983, p. 1A.
209
Copperman, Paul, "The Crisis in Our Schools," Family-Weekly, October 19, 1980, pp. 4-6.
Fulk, Marion, "White Affluent Girls Achieve Best Test Scores," Arkansas Gazette, July 29, 1982.
Hopkins, Jennifer, " . . . County Test Scores Create Stir, Not Gauge of Education, Officials Say," Arkansas Gazette, November 1, 1981, p. 16A.
McCampbell, Duane, "Merit Pay: Reward for Teachers or Scapegoat for Politicians," Searcy Daily Citizen, Searcy, Arkansas, June 21, 1983, p. 4.
Smith, Doug, "The Plan: Is Test Score or Learning Foremost?" Arkansas Gazette, May 10, 1981, pp. 1F-2F.