Embed Size (px)
Citation preview

Jackie Palermino
Clinical Practicum I
March 27,2018
Pelvis Clinical Lab Assignment
Prescription: 45 Gy in 25 Fractions to the PTV (180 cGy x 25 Fx = 4500 cGy)
Planning Directions: Place the isocenter in the center of the designated PTV (note: calculation
point will be at isocenter). Create a PA field with a 0.5 cm margin around the PTV. Use the
lowest beam energy available at your clinic. Apply the following changes (one at a time) as
listed in each plan exercise below. After adjusting each plan, answer the provided questions. Tip:
Copy and paste each plan after making the requested changes so you can compare all of them as
needed.
Plan 1: Calculate the single PA beam.
• Describe the isodose distribution as it relates to PTV coverage. If a screen shot is
helpful to show this, you may include it. o With the use of a single PA beam, the dose distribution is hotter towards the
posterior surface of the patient and cooler anteriorly. The PTV is only 45.79%
covered by 100% of the dose (4500 cGy-thick bright green) and only 54.85% is
receiving 95% (4275 cGy-royal blue) of the prescribed dose. The PTV is
completely covered by the 60% isodose line (2700 cGy-orange).
• Where is the hot spot and what is it? o The hot spot is 7614.9 cGy (169.2%) and is located near the patient's posterior
skin surface. This is extremely hot because with using the energy of 6MV, the
maximum dose is deposited at a depth of 1.5 cm.
• What do you think creates the hot spot in this location? o With using a beam energy of 6MV, the maximum dose is deposited at 1.5 cm
depth due to its dmax value. The remaining dose after reaching maximum dose
lessens the further it continues in the patient.

Plan 2: Change the field to a higher energy and calculate the dose.
• Describe how the isodose distribution changed. o When using a higher energy, such as 18MV, the dose is pushed more anteriorly
allowing for slightly better coverage overall of the PTV. This can be seen in the
comparison image below. The PTV coverage for 100% of the dose is lower from
45.79% (Plan 1-6MV) to 45.16% (Plan 2- 18MV). The coverage of 95% of the
prescribed dose increased from 54.85% (Plan 1) to 56.79% (Plan 2). The PTV is
almost entirely covered by the 70% isodose line (3150 cGy-light purple), reading
99.76%.

• Where is the hot spot and what is it? o The hot spot is 6450.1 cGy (143.3% hot) and is located posteriorly and
approximately 2.7cm anterior to the patient's posterior skin surface.
• What do you think creates the hot spot in this location? o The hot spot moved more anteriorly when using an 18MV beam. This is because
the dmax of an 18MV beam is 3.5 cm, therefore depositing its maximum dose
deeper into the patient than the 6MV beam.

Plan 3: Insert a left lateral beam with a 0.5 cm margin around the PTV. Copy and oppose
the left lateral field to create a right lateral field. Use the lowest beam energy available for
all 3 fields. Calculate the dose and apply equal weighting to all 3 beams.
• Describe the isodose distribution. o When creating a 3-field technique with equal weighting for all beams, the dose
distribution begins to look like an "bowtie". The dose distribution is focused more
towards the center of the patient around isocenter. With the addition of the
opposed lateral beams and a PA beam, the overall coverage of PTV increased.
The PTV is 99.88% covered by the 80% isodose line (3600 cGy-teal). Although
this beam orientation helped the coverage of the PTV, it caused more dose
buildup near the patients right and left skin surfaces and less dose buildup near the
patient's posterior skin surface.
• Where is the hot spot and what is it?
o The hot spot is 4994.3 cGy (110.9% hot) and is located more anteriorly and towards
the patient’s right compared to using only a PA beam orientation.
• What do you think creates the hot spot in this location? o With all the beams equally weighted, the dose is being pushed towards isocenter.
The hotspot has moved towards the center of the patient because there is greater
dose in this area due to the intersection of the three beams.
Plan 4: Change the 2 lateral fields to a higher energy and calculate the dose.
• Describe the impact on the isodose distribution.
o The plan still has a "bowtie" shape but the dose to the patient's lateral skin
surfaces have decreased because the dose is being pushed more towards the center
of the patient with the use of the higher energy. The isodose lines that are focused
just around the PTV have more of a boxier shape to them. With this beam
arrangement and the energies used (6x-PA, 18x-lateral beams), the entire PTV is
mostly covered by the 80% isodose line (teal). The PTV coverage for 100% of the
dose is 41.95% and for the PTV receiving 95% of the prescribed dose is 65.94%.
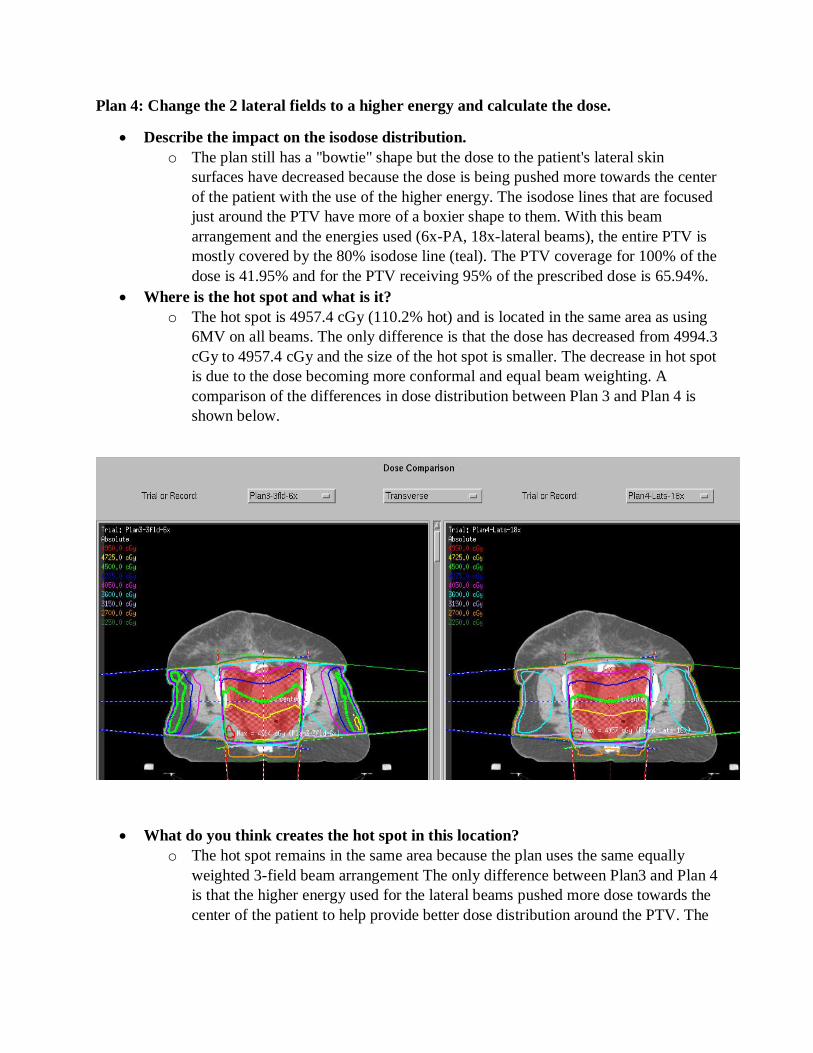
• Where is the hot spot and what is it? o The hot spot is 4957.4 cGy (110.2% hot) and is located in the same area as using
6MV on all beams. The only difference is that the dose has decreased from 4994.3
cGy to 4957.4 cGy and the size of the hot spot is smaller. The decrease in hot spot
is due to the dose becoming more conformal and equal beam weighting. A
comparison of the differences in dose distribution between Plan 3 and Plan 4 is
shown below.
• What do you think creates the hot spot in this location? o The hot spot remains in the same area because the plan uses the same equally
weighted 3-field beam arrangement The only difference between Plan3 and Plan 4
is that the higher energy used for the lateral beams pushed more dose towards the
center of the patient to help provide better dose distribution around the PTV. The

dose distribution is becoming more uniform, therefore spreading out the dose
more evenly within the patient and decreasing the dose to the hotspot.
Plan 5: Increase the energy of the PA beam and calculate the dose.
• What change do you see? o With an increase in energy of the PA beam to 18MV and the lateral beams with
energies of 18MV, the overall coverage of the PTV has increased and the hot
areas are decreasing in size and dose. A comparison of the dose distribution and
the areas of hotspots for Plan 4 and Plan 5 is shown below. The PTV coverage
receiving 95% of the dose is 69.64% (Plan 5) compared to 65.94% (Plan 4).

• Where is the hot spot and what is it? o The hot spot is 4825.1 (107.2% hot) and is located more anterior and closer to the
PTV volume.
• What do you think creates the hot spot in this location? o The hot spot is found closer to the PTV and more anterior than when using 6MV.
With the use of a higher energy, such as 18MV, the higher energy helps to push
the dose more anterior or deeper into the patient to help achieve adequate
coverage on the PTV volume. By using a larger energy, the dmax of the beam
increases, therefore allowing for dose to penetrate deeper into the patient. The
dmax of 18MV is 3.5 cm in comparison to the dmax of 6MV at 1.5 cm.

Plan 6: Add the lowest angle wedge to the two lateral beams.
• What direction did you place the wedge and why? o By adding the lowest angle wedge available at my clinical site, it allowed for
greater dose coverage anteriorly. I used a 5-degree wedge with the heel of the
wedge positioned posteriorly for each lateral beam.
• How did it affect your isodose distribution? (To describe the wedge orientation, you
may draw a picture, provide a screen shot, or describe it in relation to the patient.
(e.g., Heel towards anterior of patient, heel towards head of patient...) o The use of the wedges on both lateral beams helped to increase the overall dose
coverage of the PTV volume anteriorly and reduced the size and dose of the hot
spot. The PTV coverage receiving 95% of the dose increased to 73.56% with the
use of small wedges. The wedges are used to even out the dose distribution within
the patient while taking into account the patient's sloped skin surface.
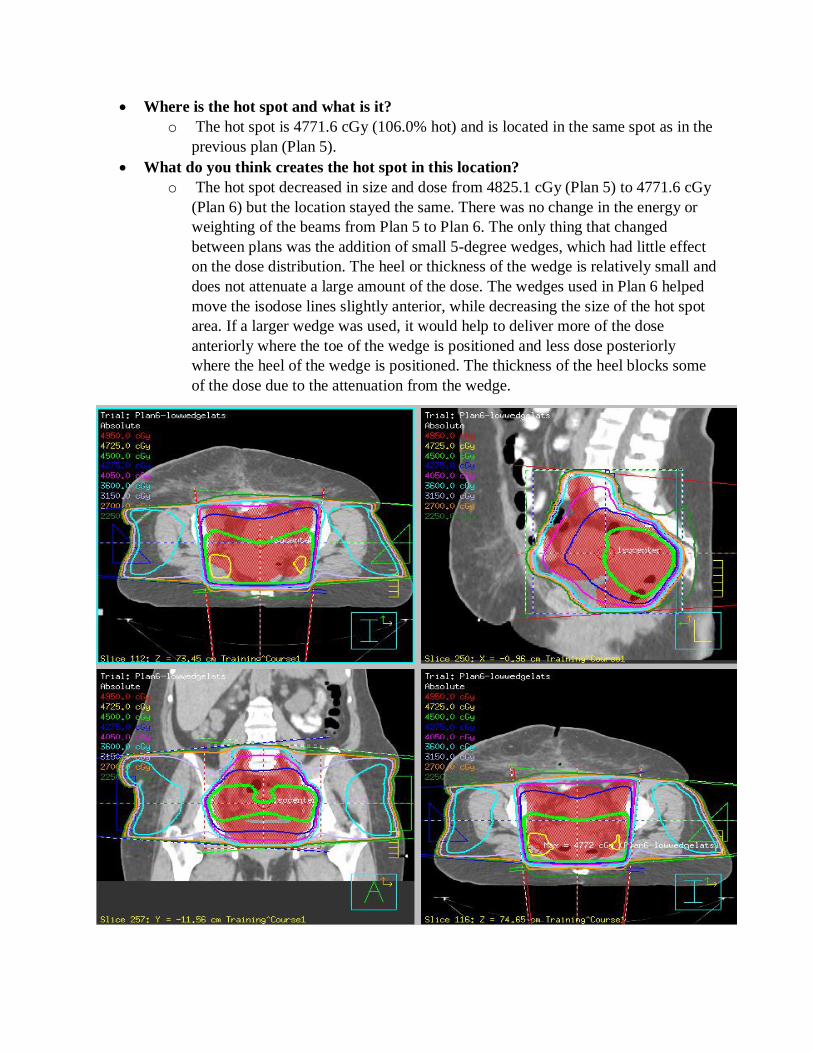
• Where is the hot spot and what is it? o The hot spot is 4771.6 cGy (106.0% hot) and is located in the same spot as in the
previous plan (Plan 5).
• What do you think creates the hot spot in this location? o The hot spot decreased in size and dose from 4825.1 cGy (Plan 5) to 4771.6 cGy
(Plan 6) but the location stayed the same. There was no change in the energy or
weighting of the beams from Plan 5 to Plan 6. The only thing that changed
between plans was the addition of small 5-degree wedges, which had little effect
on the dose distribution. The heel or thickness of the wedge is relatively small and
does not attenuate a large amount of the dose. The wedges used in Plan 6 helped
move the isodose lines slightly anterior, while decreasing the size of the hot spot
area. If a larger wedge was used, it would help to deliver more of the dose
anteriorly where the toe of the wedge is positioned and less dose posteriorly
where the heel of the wedge is positioned. The thickness of the heel blocks some
of the dose due to the attenuation from the wedge.

Plan 7: Continue to add thicker wedges on both lateral beams and calculate for each wedge
angle you try (when you replace a wedge on the left, replace it with the same wedge angle
on the right). You may weight your fields to get a better dose distribution.
• What final wedge angles and weighting did you use? o The beam arrangement that produced the best coverage with the use of thicker
wedges consisted of a PA (18MV) beam with a beam weighting of 47.44% with
no use of a wedge and two direct lateral beams with 40-degree wedges. The LT
Lateral (18MV) beam has a beam weighting of 26.56% and utilizes a 40-degree
wedge with the heel of the wedge positioned towards the posterior surface of the
patient. The RT Lateral beam (18 MV) has a beam weighting of 26.0% and
utilizes a 40-degree wedge with the heel of the wedge positioned towards the
posterior surface of the patient.
• How did each change affect the isodose distribution?
o The beam weighting affects the isodose distribution by depositing more of the
dose where the beam weighting is greater. For example, if the PA is weighted
with a larger percentage compared to the lateral beams, then more of the dose is
deposited from the PA beam leaving the dose hotter near the PA beam entrance. o When using a wedge in a beam arrangement, some of the beam will be absorbed
by the wedge and cause a shift in isodose lines. Due to the attenuation from the
wedge, it allows for more dose to pass through the toe of the wedge and less dose
through the heel because of the wedge thickness. The area located near the toe of
the wedge becomes hotter and the area near the heel of the wedge will be cooler.
• Where is the hot spot and what is it? o The hot spot is 4703.1 cGy (104.5% hot) and is located anteriorly and towards
the patients left. The hot spot is located within the PTV volume.
• What do you think creates the hot spot in this location? o The hot spot is located in this area because of the use of wedges and beam
weighting. The PA beam has a 47.44% weighting which causes more of the total
dose to be given by the PA beam. The lateral beams both use a 40-degree wedge
with the heel towards the patient's posterior surface. With the use of this wedge
orientation, the lateral dose is being attenuated posteriorly near the heel of the
wedge while allowing for more of the dose to pass through the toe of the wedge.
This causes dose to fall more anteriorly in the patient.
Plan 8: Copy and oppose the PA field to create an AP field and adjust the collimators to
keep a 0.5 cm margin around the PTV. Keep the lateral field arrangement. Remove any
wedges that may have been used. Calculate the four fields and weight them equally. Adjust
the weighting of the fields, determine which energy to use on each field, and, if wedges will
be used, determine which angle is best. Evaluate your plan in every slice throughout your
planning volume. Discuss your plan with your preceptor and adjust it based on their input.
Normalize your final plan so that 95% of the PTV is receiving 100% of the dose.
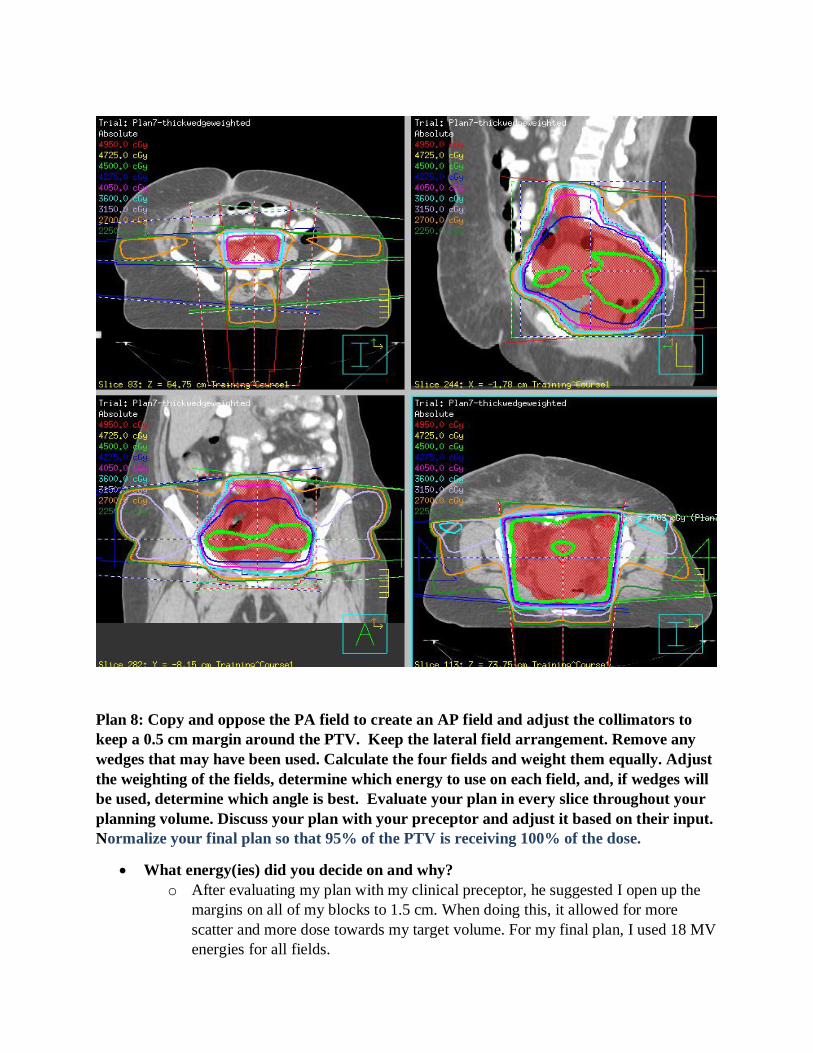
• What energy(ies) did you decide on and why? o After evaluating my plan with my clinical preceptor, he suggested I open up the
margins on all of my blocks to 1.5 cm. When doing this, it allowed for more
scatter and more dose towards my target volume. For my final plan, I used 18 MV
energies for all fields.
• What is the final weighting of your plan? o The final weighting of my final plan is near equal beam weighting. My plan
consists of the AP at 22.77%, the PA at 28.53%, the Left Lateral at 24.30%, and
the Right Lateral at 24.41%.
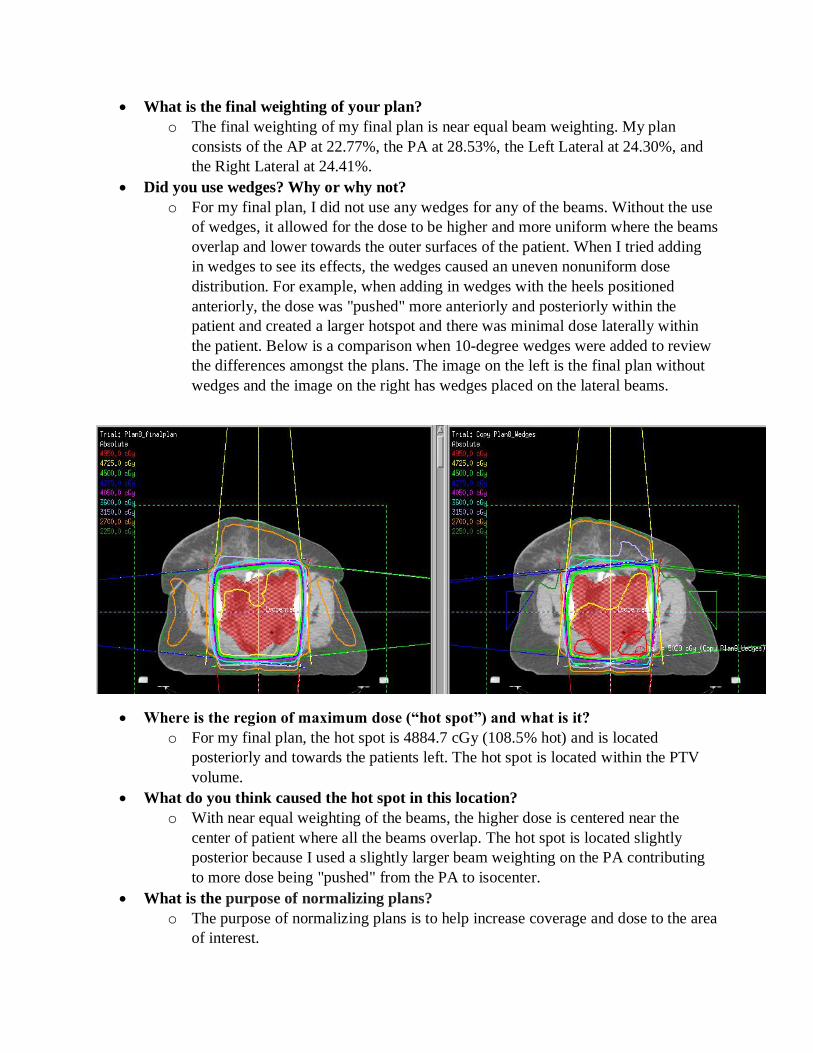
• Did you use wedges? Why or why not? o For my final plan, I did not use any wedges for any of the beams. Without the use
of wedges, it allowed for the dose to be higher and more uniform where the beams
overlap and lower towards the outer surfaces of the patient. When I tried adding
in wedges to see its effects, the wedges caused an uneven nonuniform dose
distribution. For example, when adding in wedges with the heels positioned
anteriorly, the dose was "pushed" more anteriorly and posteriorly within the
patient and created a larger hotspot and there was minimal dose laterally within
the patient. Below is a comparison when 10-degree wedges were added to review
the differences amongst the plans. The image on the left is the final plan without
wedges and the image on the right has wedges placed on the lateral beams.
• Where is the region of maximum dose (“hot spot”) and what is it? o For my final plan, the hot spot is 4884.7 cGy (108.5% hot) and is located
posteriorly and towards the patients left. The hot spot is located within the PTV
volume.
• What do you think caused the hot spot in this location? o With near equal weighting of the beams, the higher dose is centered near the
center of patient where all the beams overlap. The hot spot is located slightly
posterior because I used a slightly larger beam weighting on the PA contributing
to more dose being "pushed" from the PA to isocenter.
• What is the purpose of normalizing plans?
o The purpose of normalizing plans is to help increase coverage and dose to the area
of interest.

• What impact did you see after normalization? Why? o After normalizing my final plan to a prescription percentage of 95%, the coverage
of my PTV increased. Ninety-six percent of my PTV volume is receiving 100% of
the prescribed dose (4500 cGy). The overall plan is hotter because my original
100% isodose line is now reading closer to 105%. The shift in dose allows for
more coverage of my PTV compared to Plan 7 but also increases the dose to
critical structures. In Plan 7, only 44.23% of my PTV volume was receiving 100%
dose (4500 cGy). With the change of normalizing the plan, 96.19% of the PTV
volume is now receiving 100% of the dose.
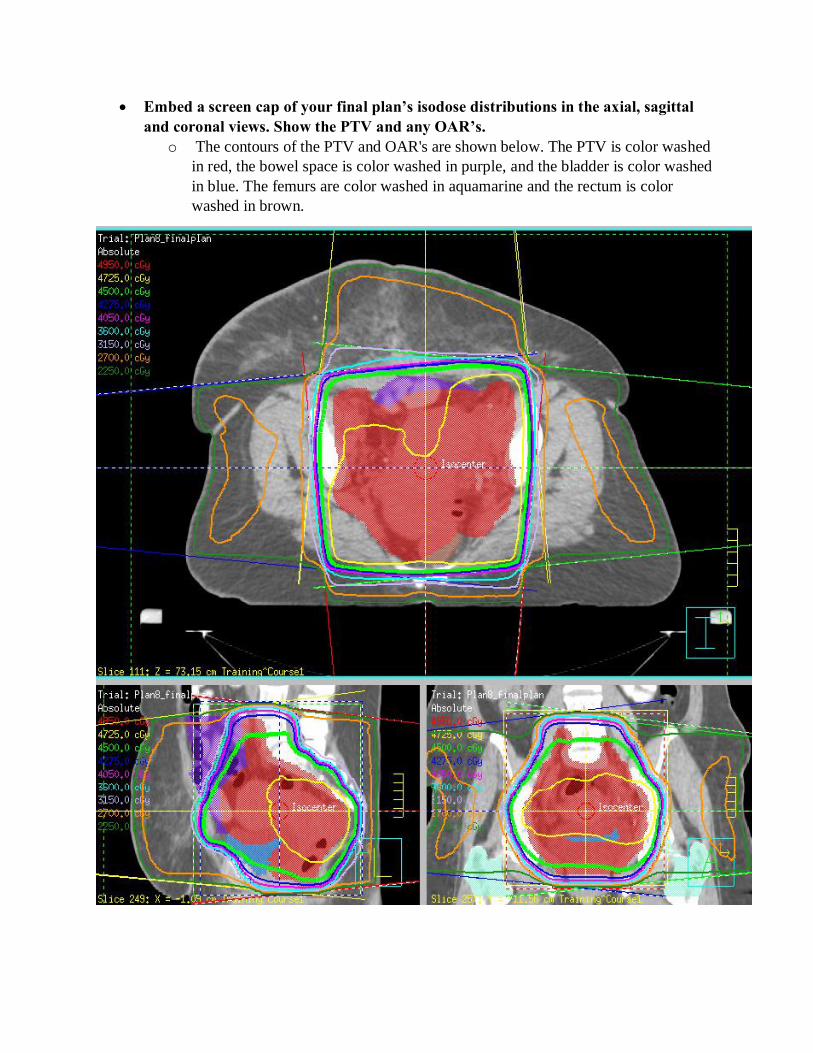
• Embed a screen cap of your final plan’s isodose distributions in the axial, sagittal
and coronal views. Show the PTV and any OAR’s. o The contours of the PTV and OAR's are shown below. The PTV is color washed
in red, the bowel space is color washed in purple, and the bladder is color washed
in blue. The femurs are color washed in aquamarine and the rectum is color
washed in brown.

• Include a final DVH. Be sure to include clear labels on each image.
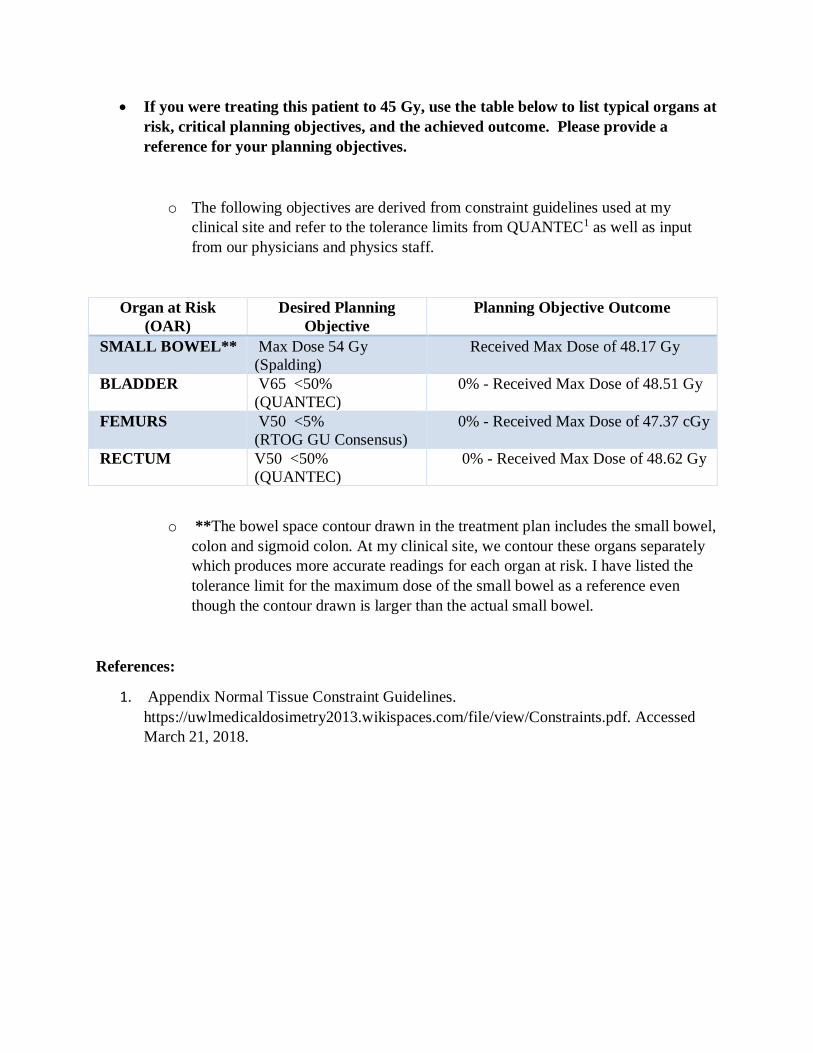
• If you were treating this patient to 45 Gy, use the table below to list typical organs at
risk, critical planning objectives, and the achieved outcome. Please provide a
reference for your planning objectives.
o The following objectives are derived from constraint guidelines used at my
clinical site and refer to the tolerance limits from QUANTEC1 as well as input
from our physicians and physics staff.
Organ at Risk
(OAR)
Desired Planning
Objective
Planning Objective Outcome
SMALL BOWEL** Max Dose 54 Gy
(Spalding)
Received Max Dose of 48.17 Gy
BLADDER V65 <50%
(QUANTEC)
0% - Received Max Dose of 48.51 Gy
FEMURS V50 <5%
(RTOG GU Consensus)
0% - Received Max Dose of 47.37 cGy
RECTUM V50 <50%
(QUANTEC)
0% - Received Max Dose of 48.62 Gy
o **The bowel space contour drawn in the treatment plan includes the small bowel,
colon and sigmoid colon. At my clinical site, we contour these organs separately
which produces more accurate readings for each organ at risk. I have listed the
tolerance limit for the maximum dose of the small bowel as a reference even
though the contour drawn is larger than the actual small bowel.
References:
1. Appendix Normal Tissue Constraint Guidelines.
https://uwlmedicaldosimetry2013.wikispaces.com/file/view/Constraints.pdf. Accessed
March 21, 2018.