Embed Size (px)
Citation preview

–– –
_
Jack de KreijMember of the Executive Board
and Chief Financial Officer
Analyst Meeting 3 July 2009

–– –3/7/2009Analyst Meeting 2009 22
Sustainable Value Growth
Introduction
Sustainable Value Growth – Status July 2009
Financing
Outlook

–– –3/7/2009Analyst Meeting 2009 3
220.9272.9
Results of Vopak Transformation Process
* Excluding exceptional items
** EBITDA includes joint ventures & associates results
> 450
2006 2007 2009In EUR mln
EBIT
369.5
EBITDA**
314.1
Outlook
2008
179.7
262.5
151.0
231.8
20052004
Guidance
429.3
320.4
Q1 115.6
3

–– –3/7/2009Analyst Meeting 2009 44
Vopak’s challengeThe challenge is to facilitate the current and future product flows:
Wide variety in required handling, level of throughput and operational automation

–– –3/7/2009Analyst Meeting 2009 55
Sustainable Value Growth
Introduction
Sustainable Value Growth – Status July 2009
Financing
Outlook

–– –3/7/2009Analyst Meeting 2009 66
“The excellence mindset”
1. Maintaining the right balance between growth and flawless execution
2. Identifying and multiplying talent
3. Closely monitoring and measuring business performance
4. Recognizing standardization and technology
as a strategic asset
5. Emphasizing continuous renewal

–– –3/7/2009Analyst Meeting 2009 77
Corporate
Objective
ValuationComponents
ValueDrivers
Management
Decisions
StakeholderValue Added
(SVA)
Cash Flow
Operations
Discount
RateDebt
Focus on: Sustainable Value Growth
• Value
Growth
• Sales Growth
• Operating Profit
Margin
• Income Tax Rate
• Working Capital
management• Maintenance/
SHE CAPEX
• Cost of
Capital
Stakeholder Interests a.o.• Safety• Client Satisfaction• Financial return• Employee Engagement• Sustainability
Operating Investment FinancingStrategicDirection
Safety Client Satisfaction Employee Engagement Sustainability
–– –3/7/2009Analyst Meeting 2009 88
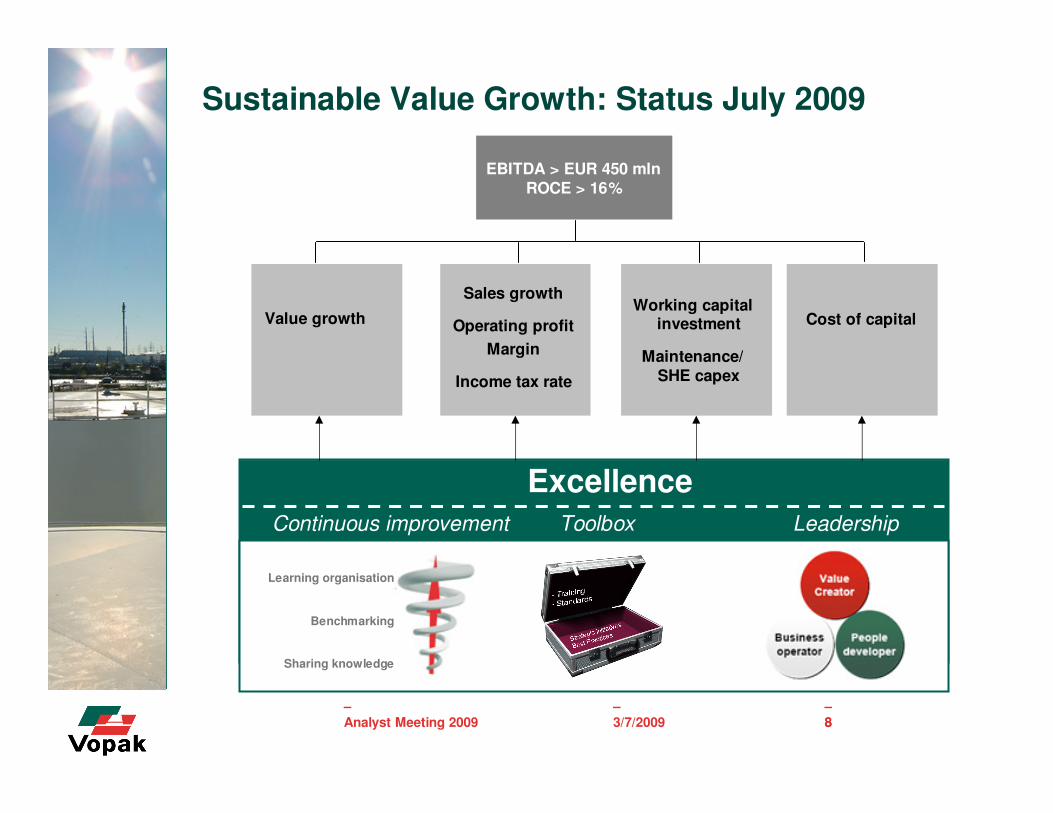
Sustainable Value Growth: Status July 2009
EBITDA > EUR 450 mln
ROCE > 16%
Working capital investment
Maintenance/
SHE capex
Sales growth
Operating profit
Margin
Income tax rate
Value growth Cost of capital
Excellence
Learning organisation
Benchmarking
Sharing knowledge
Continuous improvement Toolbox Leadership

–– –3/7/2009Analyst Meeting 2009 99
The growth of
storage capacity continues
20.4 21.221.8
27.1
30.2
2008200720062005
Storage CapacityIn mln CBM
+0.8 +0.6
27.4
+5.3
Q1 2009
+2.8+0.3
20.2
2004
+0.2
2011
19.9
2003
+0.3

–– –3/7/2009Analyst Meeting 2009 10
Characteristics of remaining 2.8 mln cbm
projects under construction
2011
2010
20091.1 mln cbm
0.2 mln cbm
1.5 mln cbm
Year of commission Per region
Asia
32%
CEMEA
10%Latin
America
2%
LNG
19%
North
America
16%
OEMEA
21%
Per productBiofuels/Vegoils
3% Chemicals
12%LNG
19%
Oil
46%
Oil/
Chemicals
14%
Chemicals/
Biofuels
6%

–– –3/7/2009Analyst Meeting 2009 11
500
600
700
800
900
1,000
2004 2005 2006 2007 2008 Q1 2009
11
Robust sales growth and
stable occupancy rates
In EUR mln
Net revenues85%
92% 94%96% 95%
Occupancy rate
95%
2008
EUR 923.5 mln

–– –3/7/2009Analyst Meeting 2009 1212
Stable EBIT(DA) margins
0%
10%
20%
30%
40%
50%
2004 2005 2006 2007 2008
EBITDA margin*
EBIT margin*
* Excluding exceptionals,
including net result of JV’s

–– –3/7/2009Analyst Meeting 2009 13
0%
10%
20%
30%
40%
50%
60%
70%
2004 2005 2006 2007 2008
Meeting different challenges
EBITDA Margins
(excluding Joint Ventures and Associates)
Asia
OEMEA
CEMEA
Latin America
North America

–– –3/7/2009Analyst Meeting 2009 14
-
100
200
300
400
500
600
700
800
900
1,000
2002 2003 2004 2005 2006 2007 2008
-
10
20
30
40
50
60
70
Income from rendering of services DSO
14
Strong focus on:
Working Capital management
DSO:From
around 60
in 2002
to around 30
in 2008
* *
* Based on Dutch GAAP
In EUR mln In days

–– –3/7/2009Analyst Meeting 2009 15
0%
2%
4%
6%
8%
10%
2004 2005 2006 2007 2008
Average interest rate
decreased
Average interest rate

–– –3/7/2009Analyst Meeting 2009 16
0
500
1,000
1,500
2,000
2,500
2004 2005 2006 2007 2008 EST 2009
0%
5%
10%
15%
20%
25%
30%
Average capital employed Return On Capital Employed (ROCE)
In EUR mln
Average Capital Employed increasing

–– –3/7/2009Analyst Meeting 2009 17
EBITDA developments
EBITDA Development
0
50
100
150
200
250
300
350
400
450
500
2004 2005 2006 2007 2008 2009
Results of joint ventures & associates using the equity method
Operating profit consolidated companies
In EUR mln
> EUR 450 mln

–– –3/7/2009Analyst Meeting 2009 18
Sustainable strategic alliances
< 5 yrs
GATE
Eemshaven LNGVopak EOS
Vopak Terminal Bahamas
PT Jakarta Tank Terminal
5 – 10 yrs
Vopak Terminal TianjinShandong Lanshan
Vopak Ecuador
Vopak Shanghai
Nippon VopakKertih Terminals
10 – 25 yrs
Terquimsa
Vopak Horizon
Sabtank
Xiamen Paktank
Terminal Ningbo
Thai Tank Terminal
Engro Vopak
Vopak Terminals Korea
Uniao - Vopak Brasterminais
> 25 yrs
Maasvlakte Olie Terminal
Vopak Terminal Singapore

–– –3/7/2009Analyst Meeting 2009 1919
Sustainable Value Growth
Introduction
Sustainable Value Growth – Status July 2009
Financing
Outlook

–– –3/7/2009Analyst Meeting 2009 20
Total investments
* Based on Dutch GAAP
In EUR mln
2003* 2004 2005 2006 2007 2008
146 147 188
446
268
800
2009-2011
> 750

–– –3/7/2009Analyst Meeting 2009 21
2.49
2.42
2.20
1.76
1.61
1.71
2.54
0 0.5 1 1.5 2 2.5 3 3.5 4
2002*
2003*
2004
2005
2006
2007
2008
Strategic financeNet debt : EBITDA ratio
Maximum Ratio under US PP
Maximum Ratio under other loans and syndicated revolving credit facility
* Based on Dutch GAAP

–– –3/7/2009Analyst Meeting 2009 22
2009 2010 2011 2012 2013 2014 > 2014
Sufficient headroom to continue growth strategy
50.025.3
180.0
83.7
313.2317.9
Debt repayment schedule (in EUR mln)
Ample financing sources of recent date
• Total financing program
around EUR 1.5 bln
• No major debt refinancing until 2012
ClosedIn use YE 2008MaturityFacility
EUR 301.5 mln (total facility EUR 1.0 bln)
EUR 267.2 mln
EUR 282.1 mln
Various joint ventures project financing
5 years + 1 + 1
8/10/12/15 years
Majority 10 years
May 2007USPP 2007
July/August 2007RCF
2007/2008/2009
USPP 2001
2007 / 2008 / 2009
March 2007 (amended)

–– –3/7/2009Analyst Meeting 2009 2323
Sustainable Value Growth
Introduction
Sustainable Value Growth – Status July 2009
Financing
Outlook

–– –3/7/2009Analyst Meeting 2009 24
Outlook
Different treatment of net result from JV’s and Associates
380
400
420
440
460
480
Bloomberg consensus Vopak Guidance
In EUR mln

–– –3/7/2009Analyst Meeting 2009 25
Reconciling Q1 with FY09 outlook
Actual Q1 2009 EBITDA
EUR 115.6 mln
+
* expansions
* margin management
* contract renewals
* operational efficiency improvements
Outlook 2009 EBITDA
> EUR 450 mln
-/-
* tanks out of operation
* pre-operating expenses
* start-up results
* uncertainty chemical storage
(especially in Europe)

–– –3/7/2009Analyst Meeting 2009 26
STABLE
Outlook Assumptions
Oil
~ 50% of EBIT
Biofuels and vegoils
~ 15% of EBIT
Chemicals
~ 20% of EBIT
ROBUST MIXED
Industrial terminals
~ 15% of EBIT
Healthy demand for storage capacity
Contract renewals
+
New storage capacity commissioned

–– –3/7/2009Analyst Meeting 2009 27
This presentation contains statements of a forward-looking nature, based on
currently available plans and forecasts. Given the dynamics of the markets
and the environments of the 32 countries in which Vopak renders logistics
services, the company cannot guarantee the accuracy and completeness of
such statements.
Unforeseen circumstances include, but are not limited to, exceptional income
and expense items, unexpected economic, political and foreign exchange
developments, and possible changes to IFRS reporting rules.
Statements of a forward-looking nature issued by the company must always
be assessed in the context of the events, risks and uncertainties of the
markets and environments in which Vopak operates. These factors could
lead to actual results being materially different from those expected.
Forward-looking statement

–– –3/7/2009Analyst Meeting 2009 28
–
www.vopak.com