Embed Size (px)
Citation preview
J . Am. Chem. Sot. 1992, 114, 83-91 83
Infrared Spectra of New Sulfur-Nitrogen Species in Solid Argon
Parviz Hassanzadeh and Lester Andrews*
Contribution from the Chemistry Department, University of Virginia, Charlottesville, Virginia 22901. Received May 6, I991
Abstract: New sulfur-nitrogen species were produced in an argon/nitrogen/sulfur vapor microwave discharge, and the reaction products were trapped in solid argon at 12 K. Nitrogen-15 and sulfur-34 isotopic substitutions, concentration variation, photolysis, and changes upon annealing provided a basis for identification and characterization of the new products. A product absorption at 1209.4 cm-I is identified as the diatomic SN radical. The strongest product absorption at 1225.2 cm-I, which shows a triplet and a doublet pattern with mixed sulfur and mixed nitrogen isotopes, respectively, is assigned to the antisymmetric stretching vibration of the NS2 radical; these isotopic data provide a 153 5' measure of the valence angle in NS2. The less stable NSS isomer absorbs at 1017.1 and 594.6 cm-' and is converted to NS2 with near-ultraviolet photolysis. An absorption band at 2040.2 cm-I shows quartet and doublet patterns with mixed nitrogen and sulfur isotopes, respectively, and is assigned to the nitrogen-nitrogen stretching fundamental of N2S. Evidence for higher nitrogen sulfides is also presented.
Introduction Nitrogen oxides have been studied extensively by infrared
absorption spectroscopy in the gas phase and solid state.' However, the analogous molecular nitrogen sulfides are not well-known. There are, however, sulfur nitrides, which include the polymeric material polythiazyl (SN),, and its evaporation products S2N2, S3N3, S4N2, and S4N4.2-8 This polymeric material has the unusual property that it can be s ~ b l i m e d . ~ . ~ An argon matrix infrared study has shown that the S2N2 and S4N4 molecules evaporate from the p01ymer.~ Finally, gas-phase reactions of atomic nitrogen with sulfur compounds have produced solid material containing the above sulfur nitride species.1°
The reactive S N radical has been widely studied in the gas phase by EPR,"-13 m i c r ~ w a v e , ~ ~ ~ ~ ~ diode laser,16 high-resolution FTIR," electronic absorption,1s photoele~tron,'~ and far-infrared LMR spectroscopies.20 Its fundamental vibrational band has recently been observed by tunable diode laser a t 1204.089 cm-I for the 2113/2 ground state in the gas phase.I6
N2S was first suggested as the carrier for CS2-N2 laser action, and its gas-phase N-N stretching frequency was predicted by comparison with N 2 0 to be about 300 cm-I below the 2331-cm-l fundamental of N2.z1 An absorption at 2030 cm-I produced by
(1) Nakamato, K. Infrared Spectra of Inorganic and Coordination Com- pounds; John Wiley & Sons: New York, 1963.
(2) Bright, A. A.; Cohen, M. J.; Garito, A. F.; Heeger, A. J.; Mikulski, C. M.; Russo, P. J.; MacDiarmid, A. G. Phys. Reu. Lett. 1975, 34, 206.
(3) Greene, R. L.; Street, G. B.; Suter, L. J. Phys. Reu. Lert. 1975, 34, 577. (4) Milkulski, C. M.; Russo, P. J.; Saran, M. S. ; MacDiarmid, A. G.;
Garito, A. F.; Heeger, A. J. J . Am. Chem. SOC. 1975, 97, 6358. (5) Warn, J. R.; Chapman, D. Spectrochim. Acta 1966, 22, 1371. (6) Bragin, J.; Evans, M. V. J . Chem. Phys. 1969, 51, 268. (7) Findlay, R. H.; Palmer, M. H.; Downs, A. J.; Edgell, R. G.; Evans, R.
(8) Lau, W. M.; Westwood, N. P. C.; Palmer, M. H. J . Am. Chem. SOC.
(9) Teichman, R. A., 111; Nixon, E. R. Inorg. Chem. 1976, 15, 1993. (10) Smith, J. J.; Jolly, W. L. Inorg. Chem. 1965, 4 , 1006. ( 1 1) Carrington, A.; Howard, B. J.; Levy, D. H.; Robertson, J. C. Mol.
(12) Carrington, A,; Levy, D. H. J . Phys. Chem. 1967, 71, 2. (13) Uehara, H.; Morino, Y. Mol. Phys. 1969, 17, 239. (14) Amano, T.; Saito, S.; Hirota, E.; Morino, Y. J. Mol. Spectrosc. 1969,
(15) Lovas, F. J.; Suenram, R. D. J . Mol. Spectrosc. 1982, 93, 416. (16) Matsumura, K.; Kawaguchi, K.; Nagai, K.; Yamada, C.; Hirota, E.
(17) Sinha, A.; Burkholder, J. B.; Hammer, Ph. D.; Howard, C. J. J . Mol.
(18) Jenouvrier, A,; Pascat, B. Can. J . Phys. 1973, 51, 2143. (19) Dyke, J. M.; Morns, A.; Trickle, I. R. J . Chem. Soc., Faraday Trans.
(20) Anacona, J. R.; Davis, P. B. Chem. Phys. Lett. 1984, 108, 128. (21) Powell, F. X. Chem. Phys. Leu. 1975, 33, 393.
Inorg. Chem. 1980, 19, 1307.
1986, 108, 3229.
Phys. 1968, 15, 187.
32, 97.
J . Mol. Spectrosc. 1980, 84, 68.
Spectrosc. 1988, 130, 466.
1977, 73, 147.
pyrolysis of 5-phenyl-1,2,3,4-thiatriazole and trapping in an argon matrix was attributed to the N2S species.22 Recently this de- composition route was confirmed by photoelectron spectroscopy of N2S, which indicates a relatively weak N-S bond and small perturbation of the N 2 submolecule in the linear N2S molecule.23 Recently, the high-resolution IR spectrum of N2S was recorded following the gas-phase pyrolysis of 5-phenyl- 1,2,3,4-thiatriazole; a 2047.59-cm-' absorption was assigned to the u3 f ~ n d a m e n t a l . ~ ~ Very recently high-level theoretical calculations on N2S have found that the linear structure is substantially more stable than the triangular form.25
The NS2 molecules has also been examined by high-level theoretical calculations as a model for a possible paramagnetic species in a N2/CS2 discharge.26 There is to date no spectroscopic identification of NS2, the sulfur analogue of NO2, in the literature.
In the present work sulfur-nitrogen species were produced by the reaction of nitrogen and sulfur vapor in a microwave powered argon discharge, and the new species were trapped in solid argon. Infrared spectra for several important binary sulfur nitrogen compounds such as diatomic SN, N2S, SNS, isomeric NSS, and higher sulfur-nitrogen containing species will be presented. Experimental Section
The vacuum system and chamber for matrix-isolation studies have been described p r e v i ~ u s l y . ~ ~ . ~ ~ A closed-cycle refrigerator (CTI Cryo- genics, Model 22) and an indicator/controller were used to cool and monitor the temperature of the CsI window. FTIR spectra were recorded on a Nicolet 60SXR spectrometer at 0.5 cm-l resolution (KBr beam splitter) and f O . l cm-I frequency accuracy.
Natural sulfur (Electronic Space Products, Inc., recrystallized), en- riched sulfur-34 material with 98% 34S (EG&G Mound Applied Tech- nologies), natural isotopic nitrogen gas (Matheson), and 99% nitrogen-15 enriched gas (Cambridge Isotope Laboratories) were used as received. Polymeric sulfur nitride was kindly provided by MacDiarmidP
The quartz tube for seeding sulfur vapor into a nitrogen/argon dis- charge was similar to the one described previously27 except that the orifice was constricted to 1 mm. The discharged gas stream was condensed at 12 f 1 K, and FTIR spectra were recorded before and after annealing and photolysis with a medium-pressure mercury arc (Philips, H39KB, 175 W) using long-wavelength pass filters.
(22) Wentrup, C.; Fischer, S . ; Maquestiau, A,; Flammang, R. J . Org.
(23) Bender, H.; Carnovale, F.; Peel, J. B.; Wentrup, C. J . Am. Chem. Soc.
(24) Brown, R. D.; Elmes, P. S. ; McNaughton, D. J . Mol. Spectrosc. 1990,
Chem. 1986, 51, 1908.
1988, 110, 3458.
140. 390. (25) Davy, R. D.; Schaefer, H. F., I11 J . Am. Chem. SOC. 1991,113, 1917. (26) Yamaguchi, Y.; Xie, Y.; Grev, R. S . ; Schaefer, H. F., 111 J . Chem.
Phys. 1990, 92, 3683. Seealso: Kaldor, U. Chem. Phys. Lett. 1991, 185, 131. (27) Brabson, G. D.; Mielke, Z.; Andrews, L. J . Phys. Chem. 1991, 95,
79. (28) Mielke, Z.; Brabson, G. D.; Andrews, L. J . Phys. Chem. 1991, 95,
75.
0002-7863/92/1514-83%03.00/0 0 1992 American Chemical Society

Hassanzadeh and Andrews 84 J . Am. Chem. SOC., Vol. 114, No. 1, 1992
Table I. Product Absorptions (cm-') Observed from the Matrix Reaction between Atomic Sulfur and Nitrogen at Several Sulfur Reservoir Temperatures
25 "C 50 "C 70 "C 115 "C 2449.0 2449.0
2040.2 1884.9
1225.2 1225.2 1209.4 1209.4 1203.1 1203.1
1167.4
882.36 773.0b
598.2 596.4
2449.0 2040.2 1884.9 1499.7 1309.5 1225.2 1209.4 1203.1 1167.4 1017.1 893.4" 882.3 773.0 624.2 598.2 596.4
2449.0 2040.2 1884.9 1499.7 1309.5 1225.2 1209.4 1203.1 1167.4 1017.1 893.4" 882.3 773.0 624.2 598.2 596.4
594.6 594.6 594.6 aThis band appeared formed after annealing. *These bands were
observed only after annealing in this low sulfur experiment.
Results The following experiments were performed to produce and
identify nitrogensulfur species in argon matrices. Nitrogen-Sulfur-Argon Discharge. A 2% mixture of nitrogen
in argon was passed through a 1-mm orifice discharge tube seeded with sulfur vapor in equilibrium with the solid a t 25 OC. New absorption bands were obseved at 1225.2 (absorbance = 0.035) and 1209.4 cm-I with a relative intensity of 3/1. When the temperature of the sulfur reservoir was increased to 50 O C , the overall intensities of these bands were increased. The absorbance of the 1225.2-cm-1 band increased to 0.2, and the relative intensity of the 1225.2- and 1209.4-cm-' bands increased to 5/1. In addition very weak new bands were observed at 2449.0, 2040.2, 1884.9, 1167.4, and 594.6 cm-', but S3 and S4 absorptions at 680, 676, 661, and 642 cm-l, respecti~ely?~ were not observed. At the same time the yield of S 2 0 (1 157.4 cm-I), which was formed from the reaction of trace oxygen impurity with discharged sulfur, was enhanced relative to SO2 (1354.3, 1350.5 cm-') and SO (1138.2 cm-'). Upon annealing at 20 f 2 K, the 1209.4- and 1167.4-cm-I absorption bands disappeared and the 1225.2-cm-' band decreased slightly while weak bands emerged at 882.3 and 773.0 cm-I. Upon further annealing at 30 f 2 K the 1125.2-cm-' absorption band decreased by 20% and the 882.3 and 773.0 cm-' bands continued to grow. The 594.6-cm-' band did not show any change in these annealing processes. Table I tracks the appearance of new bands as a function of sulfur reservoir temperature.
In another experiment the sulfur reservoir temperature was increased to 70 O C to supply a 2% nitrogen/argon discharge. An excess of sulfur was evidenced by the observation of weak S, and S4 bands. The relative intensity of S20 to SO bands was further enhanced, and the 1225.2 to 1209.4 cm-' absorbance ratio was increased to 10/1. The 1167.4- and 594.6-cm-I bands were en- hanced by factors of 10 and 15, respectively. The 2449.0-, 2040.2-, and 1884.9-cm-' bands were also increased. The 773.0- and 882.3-cm-l bands were also produced in very small quantity with a relative intensity of 2/1. New weak absorption bands were observed at 1499.7, 1309.4, 1253.8, 1017.1, and 624.2 cm-I. Photolysis (420-nm cutoff) decreased the 1309.4- and 624.2-cm-' bands by 50% and increased the 1253.8-cm-I band; further photolysis (254-nm full arc) did not affect these bands. However, annealing at 20 f 2 K caused the 1309.5- and 624.2-cm-' bands to grow together as the 1253.8-cm-' band decreased. The 1225.2-, 1017.1-, and 594.6-cm-' bands were not affected by 420-nm cutoff radiation; however, the 1225.2-cm-' band increased 5% with 254-nm light while the 1017.1- and 594.6-cm-I bands decreased 20%. The 2449.0- and 1884.9-cm-' bands showed similar changes as the 1225.2-cm-' band did. The 1209.5-cm-' band did not show any change upon photolysis, but decreased 50% upon annealing. The 1167.4-cm-l band was not affected by 420-nm cutoff light; however, it decreased by 85% with 254-nm light and further decreased on annealing. The 882.3- and 773.0-cm-l bands were increased by 420-nm light, unaffected by further 254-nm pho- tolysis, and increased by annealing. The 2040.2-cm-I band vanished in the first photolysis step and did not return in the subsequent photolysis and annealing processes.
The photochemistry was explored in greater detail in a 100 O C
sulfur experiment with 2% N2. The spectrum of the original deposited sample shown in Figure la is similar to those described above. The photolysis and annealing behaviors are summarized in Table 11, and the subsequent spectra are shown in Figure 1. The major point of interest is the decrease of 1017.1- and 594.6-cm-l bands and growth of 1225.2-, 1884.9-, and 2449-cm-' bands on 340- and 290-nm cutoff photolysis. Upon direct annealing of another matrix where only a weak
1253.8-cm-I band was originally present, the 1253.8-cm-' band decreased whereas the 1309.5- and 624.2-cm-' bands increased proportionally. The annealing behaviors of other bands were similar to those described in the photolysis experiment.
In order to obtain a higher yield of products, the sulfur reservoir temperature was increased to 11 5 O C with a 2% nitrogen/argon mixture, and a stable purplish-blue discharge was sustained with 80 W of microwave power. An excess of sulfur was readily observed through the appearance of the S3 and S4 bands. The main changes in the spectrum were enhancement of 2040.2-, 1499.7-, 1309.5-, 624.2-, and 594.6-cm-l absorption bands and
Table 11. The Photochemistry and Annealing Behavior of the Product Absorptions (cm-I) Observed from the Matrix Reaction between Atomic Sulfur and Nitrogen"
Figure 1 spectra Figure 2 spectra band 470 nm 420 nm 340 nm 290 nm 254 nm 3 0 * 2 K 254 nm 2 3 f 2 K 2449.0 0 0 +5 +20 +20 -20 +5 -30 2040.2 -5 0 +2 -15 -15 -55 +5 -40 1884.9 0 0 +2 +20 +20 -15 +5 -30 1499.7 0 0 -5 -8 -1 5 -95 -10 -80 1309.5 -60 -60 -60 -60 -50 +20 -50 +50 1253.8 +200 +280 +500 +500 +450 0 +goo -50 1225.2 0 0 +5 +20 +20 -20 +5 -30 1209.4 0 0 0 0 0 -100 0 -10 1203.1 0 0 0 0 0 -100 0 -10 1167.4 0 0 -15 -30 -40 -85 -20 -90 1017.1 0 0 -15 -30 -25 -50 -10 -80 893.9 0 0 0 0 0 b 0 b 882.3 +250 +250 +200 +I50 +150 +350 +200 +200 773.0 +200 +200 +180 +140 +140 +350 +200 +200 624.2 -40 -40 -48 -48 -42 +20 -50 +50 598.2 0 0 -10 -30 -25 -40 -20 -80 596.4 0 0 -10 -30 -25 -40 -20 -80 594.6 0 0 -10 -30 -25 -40 -20 -80
"Changes in * percent of band absorbance. bThis band appeared after annealing.
IR Spectra of New S-N Species in Solid Argon J. Am. Chem. SOC., Vol. 114, No. 1, 1992 85
I
J-r
I I I I I I I
1550 1400 1250 1100 950 800 650 500
Wavenumber Figure 1. Infrared spectra in the 1550-500-cm-' region for the discharged sulfur vapor/nitrogen/argon stream deposited on a CsI window at 12 * 1 K: (a) after 6 h of deposition, (b) after 30 min of photolysis with wavelengths greater than 470 nm, (c) after 30 min of photolysis with wavelengths greater than 340 nm, (d) after 30 min of photolysis with wavelengths greater than 290 nm, and (e) after annealing for 15 min at 30 f 2 K.
appearance of a weak new band at 893.9 cm-'. The nitrogen concentration was varied from 0.8 to 5%, and 2% was found to be optimum for the maximum yield of sharp new product ab- sorptions.
The spectra obtained from 34S-enriched sulfur with I4Nz before and after full arc photolysis and annealing at 23 f 2 K are shown in Figure 2. The changes upon photolysis and annealing are also collected in the Table 11. Under similar conditions, several ex- periments were carried out with 34S-enriched sulfur and I5N-en- riched nitrogen. The spectra obtained from the reactions of natural isotopic nitrogen with natural isotopic sulfur, 98% and 50% 34S- enriched sulfur, as well as 99% and 50% I5N-enriched nitrogen with natural isotopic sulfur are shown for the 2100-1400- and 1400-500-cm-' spectral regions, respectively, in Figures 3 and 4. The isotopic counterparts for all of the observed sulfur-nitrogen species are collected in Table 111. Another experiment was done with I4NI5N-enriched gas; the isotopic distribution was the same as with I4N2 and ISN2 mixtures, indicating that the nitrogen
discharge reaction with sulfur produced atomic nitrogen species. Oxygen (0.3%) was added to the nitrogen (2%) mixture in one
study. Some of the very low intensity bands were enhanced whereas the other bands with relatively higher absorption inten- sities were decreased. The bands enhanced by the addition of oxygen will be presented in a separate communication.
An early experiment employed a 6-mm open-end discharge tube.27 The overall yield was lower than that obtained from the 1-mm-orifice discharge tube used for the rest of these experiments.
Polymeric Sulfur Nitride. Sulfur nitride (SN), was put in the sample reservoir of the 6-mm open end discharge tubez7 and heated to 130 O C while 1 mmol/h of argon was allowed to sweep the (SN), vapor. Most of the sample was deposited within the front unheated part of the tube, and only a small portion reached the cold window. The spectrum was similar to that reported from codeposition of argon with (SN), heated within a Knudsen cell a t 160 OC,' except that no absorption around 1225 cm-' was observed. In our experiment S4N4 was observed at 554,706, and

86 J . Am. Chem. SOC., Vol. 114, No. 1, 1992 Hassanzadeh and Andrews
C
I& ii00 14bo 1300 I ~ O O iioo iooo sbo 8'00 io0 800 ioo Wavenumber
Figure 2. Infrared spectra in the 160C-500-cm-' region for the discharged sulfur vapor/nitrogen/argon stream deposited on a CsI window at 12 f 1 K: (a) after 6 h of deposition; (b) after 30 min of photolysis with the full arc lamp (254 nm), and (c) after annealing for 15 min at 30 i 2 K. These spectra were obtained with 98% enriched sulfur-34.
Table 111. Product Absorutions (cm-') Observed from the Matrix Reaction between Atomic Sulfur and Nitrogen ~ ~~ ~
I4N I 5N 32s 32S134S 3 4 s 32s 3 3 1 3 4 s 34s assignment
2449.0 2442.0 2436.0 2347.4 2346.1 2344.9 NS2 (2v3) 3nAn 70 71-119 9 1977 7 1977 n N . C IN-N\ -., ."._ 1884.9 1499.7 1309.5 1253.8 1225.2 1209.4 1203.1 1167.4
I"--.- 1873.8 1862.9 1495.7 1491.7
1297.5 1242.3
1222.0 1218.6 1198.6 1192.4 11 56.9
-. I -." 1847.6 1458.6 1279.5 1224.9 1192.1 1181.3 1175.3 1140.8
. , , -.., 1836 1825.2 1454.5 1450.6
1267.5 1213.6
1188.8 1185.5 1170.2 1165.3 11 30.0
A.L' \'. '., NS2 ( V I + 4 SNNS, SNSS or NSSS (S-N) S N (perturbed) NS2 (asym S-N-S) SN S N site SNNS,
1017.1 1008.0 993.1 985.2 NSS (N-S) 893.9 891.0 888.0 871.0 868.4 865.0 NS2-
882.3 878.4 875.9 861.2 858.0 854.9 N2S4 773.0 769.7 765.7 756.3 752.1 748.5 N2S4
893.0 890.0 887.0 888.0 885.2 882.0 NSC (site)
659.7b 644.3 655.5 639.7 NS2 ( V i ) 624.2 615.1 605.9 624.2 615.1 605.7 SNSS or NSSS (S-S) 598.2 590.8, 598.1 581.7 596.9 589.4, 587.8 580.5 NSS site 596.4 589.1, 587.2 579.9 595.0 587.8, 585.9 578.6 NSS site 594.6 587.2, 585.5 578.1 593.2 585.9, 584.2 576.9 NSS (S-S)
"Mixed nitrogen isotopic bands are 2009.3 and 2003.9 cm-'. bThese bands were calculated from u3 and Y, + u3.
948 cm-I and S2N, showed absorptions at 472,666, and 788 cm-I based on comparison to gas-phase ~ p e c t r a . ~ . ~ A Tesla coil argon discharge flow was passed over the deposited film of (SN), inside of the tube for 30 min, and the S2N2 bands were enhanced. Photolysis of the matrix with 254-nm light caused the S4N4 bands to decrease and a new band appeared at 519 cm-I; annealing at 23 f 2 K produced no new bands and caused the S4N4 species to aggregate.
In another experiment, (SN), vapor diluted in argon was subjected to a 40-80-W microwave discharge. With a 130 "C sample reservoir only a weak 1225.2-cm-' band was observed, and
with the temperature increased to 160 OC, S3 bands were also produced. In the final experiment with (SN),, the temperature was kept at 160 "C and the microwave power at 5-10 W. Under these conditions a spectrum similar to the 2% mixture of nitro- gen/argon with 70 "C sulfur reservoir was obtained. Similar photolysis and annealing behavior was also observed in this ex- periment. However, a different intensity distribution was noticed for several bands. The major features of the spectrum compared to that obtained from the mixture of nitrogen and sulfur (70 "C) discharge were the following: (a) a relatively higher yield of 773.0-, 882.3-, 1309.5, 1253.8-, and 624.2-cm-I bands, (b) the
IR Spectra of New S-N Species in Solid Argon J . Am. Chem. SOL., Vol. 114, No. 1 , 1992 87
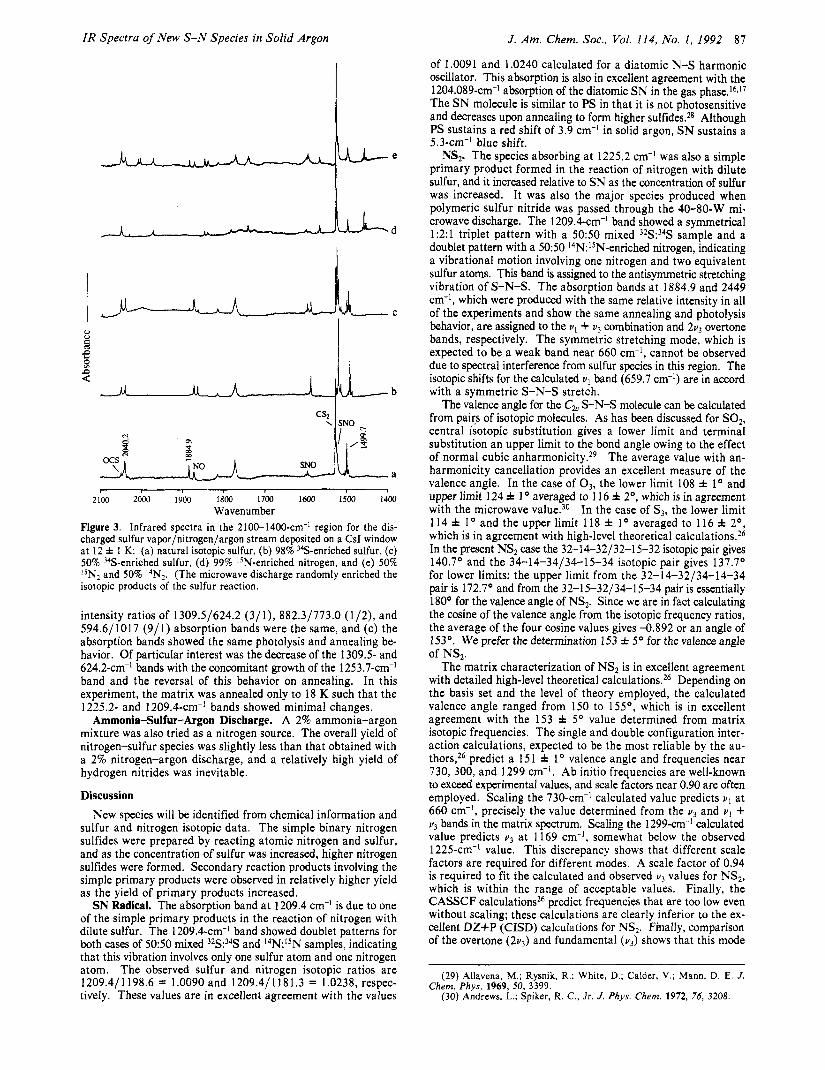
of 1.0091 and 1.0240 calculated for a diatomic N-S harmonic oscillator. This absorption is also in excellent agreement with the 1204.089-cm-' absorption of the diatomic S N in the gas pha~e.'~J' The S N molecule is similar to PS in that it is not photosensitive and decreases upon annealing to form higher sulfides.2s Although PS sustains a red shift of 3.9 cm-' in solid argon, S N sustains a 5.3-cm-' blue shift.
NS2. The species absorbing at 1225.2 cm-' was also a simple primary product formed in the reaction of nitrogen with dilute sulfur, and it increased relative to SN as the concentration of sulfur was increased. It was also the major species produced when polymeric sulfur nitride was passed through the 40-80-W mi- crowave discharge. The 1209.4-cm-' band showed a symmetrical 1:2:1 triplet pattern with a 5050 mixed 32S:34S sample and a doublet pattern with a 5050 14N:1SN-enriched nitrogen, indicating a vibrational motion involving one nitrogen and two equivalent sulfur atoms. This band is assigned to the antisymmetric stretching vibration of S-N-S. The absorption bands at 1884.9 and 2449 cm-l, which were produced with the same relative intensity in all of the experiments and show the same annealing and photolysis behavior, are assigned to the v l + v3 combination and 2v3 overtone bands, respectively. The symmetric stretching mode, which is expected to be a weak band near 660 cm-I, cannot be observed due to spectral interference from sulfur species in this region. The isotopic shifts for the calculated v 1 band (659.7 cm-') are in accord with a symmetric S-N-S stretch.
The valence angle for the C, S-N-S molecule can be calculated from pairs of isotopic molecules. As has been discussed for SO2, central isotopic substitution gives a lower limit and terminal substitution an upper limit to the bond angle owing to the effect of normal cubic an harmonic it^.^^ The average value with an- harmonicity cancellation provides an excellent measure of the valence angle. In the case of 03, the lower limit 108 f 1' and upper limit 124 f 1 ' averaged to 116 f 2", which is in agreement with the microwave value.30 In the case of S3, the lower limit 114 f 1' and the upper limit 118 f 1' averaged to 116 f 2O, which is in agreement with high-level theoretical calculations.26 In the prexnt NS2 case the 32-14-32/32-15-32 isotopic pair gives 140.7' and the 34-14-34/34-1534 isotopic pair gives 137.7' for lower limits; the upper limit from the 32-14-32/34-14-34 pair is 172.7' and from the 32-15-32/34-15-34 pair is essentially 180' for the valence angle of NS,. Since we are in fact calculating the cosine of the valence angle from the isotopic frequency ratios, the average of the four cosine values gives -0.892 or an angle of 153'. We prefer the determination 153 f 5 O for the valence angle
The matrix characterization of NS2 is in excellent agreement with detailed high-level theoretical calculations.26 Depending on the basis set and the level of theory employed, the calculated valence angle ranged from 150 to 155O, which is in excellent agreement with the 153 f 5' value determined from matrix isotopic frequencies. The single and double configuration inter- action calculations, expected to be the most reliable by the au- thors,26 predict a 151 f 1' valence angle and frequencies near 730, 300, and 1299 cm-I. Ab initio frequencies are well-known to exceed experimental values, and scale factors near 0.90 are often employed. Scaling the 730-cm-' calculated value predicts v 1 at 660 cm-', precisely the value determined from the v 3 and v 1 + v3 bands in the matrix spectrum. Scaling the 1299-cm-' calculated value predicts v3 at 1169 cm-', somewhat below the observed 1225-cm-I value. This discrepancy shows that different scale factors are required for different modes. A scale factor of 0.94 is required t o fit the calculated and observed v 3 values for NS2, which is within the range of acceptable values. Finally, the CASSCF calculations26 predict frequencies that are too low even without scaling; these calculations are clearly inferior to the ex- cellent DZ+P (CISD) calculations for NS2. Finally, comparison of the overtone (2v3) and fundamental ( v 3 ) shows that this mode
of NS2.
2;00 2doo 1900 1800 li00 le00 1500 1400 Wavenumber
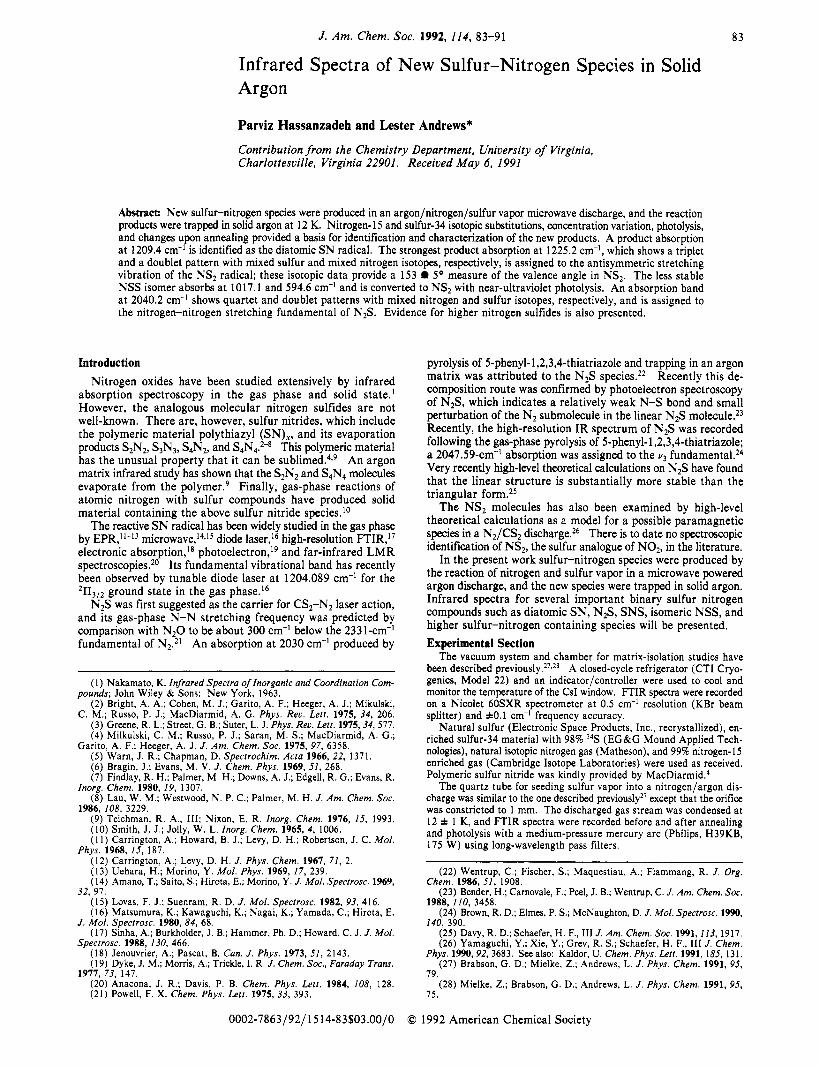
Figure 3. Infrared spectra in the 2100-1400-cm-' region for the dis- charged sulfur vapor/nitrogen/argon stream deposited on a CsI window at 12 * 1 K: (a) natural isotopic sulfur, (b) 98% 34S-enriched sulfur, (c) 50% 34S-enriched sulfur, (d) 99% 15N-enriched nitrogen, and (e) 50% I5N2 and 50% 14N2. (The microwave discharge randomly enriched the isotopic products of the sulfur reaction.
intensity ratios of 1309.5/624.2 (3/1), 882.3/773.0 (1/2), and 594.6/1017 (9/1) absorption bands were the same, and (c) the absorption bands showed the same photolysis and annealing be- havior. Of particular interest was the decrease of the 1309.5- and 624.2-cm-' bands with the concomitant growth of the 1253.7-cm-' band and the reversal of this behavior on annealing. In this experiment, the matrix was annealed only to 18 K such that the 1225.2- and 1209.4-cm-' bands showed minimal changes.
Ammonia-Sulfur-Argon Discharge. A 2% ammonia-argon mixture was also tried as a nitrogen source. The overall yield of nitrogen-sulfur species was slightly less than that obtained with a 2% nitrogen-argon discharge, and a relatively high yield of hydrogen nitrides was inevitable.
Discussion New species will be identified from chemical information and
sulfur and nitrogen isotopic data. The simple binary nitrogen sulfides were prepared by reacting atomic nitrogen and sulfur, and as the concentration of sulfur was increased, higher nitrogen sulfides were formed. Secondary reaction products involving the simple primary products were observed in relatively higher yield as the yield of primary products increased.
SN Radical. The absorption band at 1209.4 cm-' is due to one of the simple primary products in the reaction of nitrogen with dilute sulfur. The 1209.4-cm-' band showed doublet patterns for both cases of 5050 mixed 32S:34S and 14N:15N samples, indicating that this vibration involves only one sulfur atom and one nitrogen atom. The observed sulfur and nitrogen isotopic ratios are 1209.4/1198.6 = 1.0090 and 1209.4/1181.3 = 1.0238, respec- tively. These values are in excellent agreement with the values
(29) Allavena, M.; Rysnik, R.; White, D.; Calder, V.; Mann, D. E. J .
(30) Andrews, L.; Spiker, R. C., Jr. J. Phys. Chem. 1972, 76, 3208. Chem. Phys. 1969, 50, 3399.

88 J . Am. Chem. SOC., Vol. 114, No. 1, 1992 Hassanzadeh and Andrews
I I I I 1 1 I I
1400 1300 1200 1100 loo0 900 800 700 600 500 Wavenumber
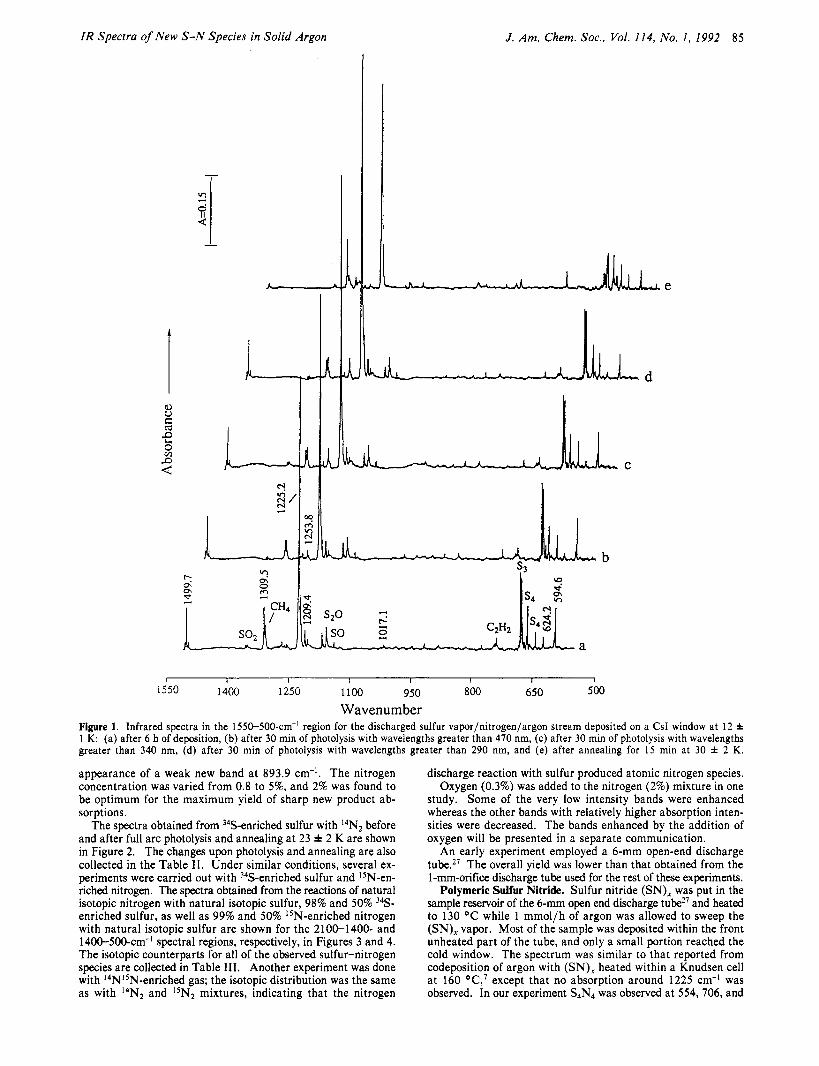
Figure 4. Infrared spectra in the 140C-500-c1n-~ region for the discharged sulfur vapor/nitrogen/argon stream deposited on a CsI window at 12 f 1 K: (a) natural isotopic sulfur, (b) 98% 34S-enriched sulfur, (c) 50% 34S-enriched sulfur, (d) 99% "N-enriched nitrogen, and (e) 50% I5N, and 50% I4N2.
is nearly harmonic (2449 cm-I vs 2 X 1225.2 = 2450.4 cm-I), which adds credence to this valence angle determination from isotopic fundamentals.
N2S. The absorption band at 2040.2 cm-I, which shows a quartet at 2040.2, 2009.3, 2003.9, and 1972.3 cm-I with mixed isotopic nitrogen, is 291 cm-' below the N2 fundamental vibration (2331 cm-I). This vibration is clearly a N-N stretching mode based on the 14-14/15-15 ratio of 2040.211972.3 = 1.0344 and agreement with the 1.0350 harmonic diatomic N z ratio and the small 34S shift to 2039.9 cm-'. The isotopic data are indicative of the N-N vibration of two inequivalent nitrogen atoms coupled very slightly to sulfur, which lead directly to the NNS assignment for the 2040.2-cm-' absorption. The present argon matrix ob- servation is in near agreement with the gas-phase value of 2047.59 cm-l for a new species produced by pyrolysis of 5-phenyl- 1,2,3,4-thiatria~ole.~~ The previous matrix valuez2 of 2030 cm-I, which was observed after flash vacuum pyrolysis of the same compound, is shifted by interaction with other species including precursor in that experiment. The lack of observation of the N-S stretching vibration in this species is attributed to its low intensity. The N2S species was detected in the nitrogen-sulfur experiment with the sulfur reservoir temperature of 70 "C and was enhanced in yie!d as the sulfur reservoir temperature was increased. This suggests that N-N bond cleavage is facilitated through chemical reaction between excited N 2 and sulfur. Finally, the NzS species was made here from the elements instead of a large cyclic organic precursor, which further supports its identification as a simple molecule.
NSS. The absorption band at 594.6 cm-I was not detected in the discharge reaction of nitrogen plus sulfur with the sulfur reservoir a t 25 "C; however, it was detected when the sulfur reservoir temperature was increased to 50 "C. Under this con- dition the total amount of sulfur, especially the ratio of diatomic sulfur to atomic sulfur, increased as was evidenced by the sbsolute and relative intennity of S 2 0 / S 0 bands, which changed from 1:2 to more than 2:l; however, no S3 nor S4 was found. As the sulfw reservoir temperature was further increased to 70 and 115 "C, the relative intensity of S20 to SO as well as the 594.6 cm-' band to S N (1 209.4 cm-I) increased. A 1 : 1 : 1 : 1 quartet pattern with the inner bands very close to each other was obtained with a 5050 mixed isotopic sulfur. Mixed isotopic nitrogen produced a doublet pattern with only 1.4-cm-l spacing. This absorption band is 121.4 cm-I below the sulfursulfur vibration frequency in diatomic S2.31332 The sulfur isotopic ratio of 594.6/578.1 = 1.0285 is very close to the sulfur isotopic value of 672.6/653.7 = 1.0289 in S 2 0 , but less than that for a pure sulfursulfur vibration (1.0304), which suggests an S-S species bonded to another atom. Furthermore, the close inner bands in the mixed isotopic sulfur and the small shift with nitrogen-15 (594.6-593.2 = 1.4 cm-I) indicate that this S-S vibrational mode is only slightly perturbed by the other bonded species. A similar isotopic oxygen shift (672.7-67 1 .O =
(31) Barletta, R. E.; Claassen, H. H.; McBeth, R. L. J . Chem. Phys. 1971, 55, 5409.
(32) Huber, K. P.; Herzberg, G. Consrants ofDiotomic Molecules; Van Nortrand Reinhold Co. Inc.: New York, 1979.

IR Spectra of New S-N Species in Solid Argon
1.7 cm-l) was also observed for the S-S stretching mode of S20. These isotopic characteristics of the 594.6-cm-' band are in parallel with those of SSO. Similarly, the 594.6-cm-' band is proposed to be the sulfursulfur vibration mode in the NSS species.33
The 1017.1-cm-I band exhibits a constant absorbance relative to the 594.6-cm-l band, namely 1/9, in the present experiments with different reagent concentrations, on photolysis, and upon annealing. The sulfur isotopic ratio 1017.1/1008.1 = 1.0090 and the nitrogen isotopic ratio 1017.1/993.1 = 1.0242 are near dia- tomic S N values, which identifies this band as an S-N vibration. Mixed isotopic experiments reveal doublets for the vibration of single S and N atoms. The 1017.1-cm-l band is assigned to the N-S stretching mode in the NSS molecule.
The asymmetric NSS isomer is predicted to be 19 kcal/mol higher in energy than the C,, isomer by the same high-level theoretical calculations.26 The strongest fundamental absorption is predicted for the S-S stretching mode at 665 cm-I. The rea- sonable scale factor 0.895 takes the calculated 665-cm-l value into the observed 595-cm-l value. The calculated S-S bond length of 1.920 8, is longer than the S2 value of 1.89 8, which has an appropriately higher frequency (720 cm-1).31,32 The N-S stretching fundamental is predicted to be half as intense and at 1072 cm-'. A scale factor of 0.949 is required to relate the calculated value to the observed value. Again different scale factors are required for different modes of the same molecule.
The NSS species is probably formed from the reaction of N plus S2 or S N plus S which also gives SNS. Although NSS is less stable than NS2,
N + S2 - N-S-S
S N + S --.* N-S-S, S-N-S
once formed in the matrix NSS is stable until energized. Irra- diation with near-ultraviolet light activates the NSS isomer and allows isomerization to the more stable NS2 form (Figure 3).
4OG-254 nm NSS - NS2
This photoisomerization process is apparently not reversible. Since S2 absorbs in the near-ultraviolet region?4 it is reasonable to expect NSS to absorb in the same region.
NSSS. The absorption bands at 1309.5 and 624.2 cm-l were produced only when the concentration of sulfur was increased to the point that excess sulfur was observed as S3. The above bands show a constant absorption intensity ratio of 3/1 in all of the experiments. They decreased upon photolysis with 420-nm ra- diation and grew back to the same intensity upon annealing, suggesting that they belong to the same species. Furthermore, the absorption band at 1253.7 cm-l grows as the 1309.5- and 624.2-cm-l bands decrease upon photolysis, and the former also decreased as the latter bands grew back upon annealing.
The 1253.7-cm-I band shows doublet patterns for both sulfur and nitrogen isotopic mixtures and diatomic isotopic ratios with slightly less nitrogen and more sulfur motion. The 1309.5-cm-' band also showed doublet patterns with mixed isotopic sulfur and nitrogen. The isotopic ratios for sulfur and nitrogen are 1309.5/1297.5 = 1.0092 and 1309.5/1279.5 = 1.0234, respec- tively, which are also slightly more than the sulfur and slightly less than the nitrogen isotopic ratios observed for diatomic SN. These values suggest an N-S vibrational motion which is bonded through sulfur. On the other hand, the 624.2-cm-l band shows a 1:2:1 triplet pattern with a 50:50 32S/34S mixture and no de- tectable shift with nitrogen-15. This absorption is in the sul- fursulfur vibrational region red shifted 92 cm-I from diatomic S2. The sulfur isotopic ratio of 624.2/605.9 = 1.0302 is also in good agreement with a diatomic sulfursulfur vibration mode. As a matter of fact it is in very close agreement with sulfur isotopic ratios of 680.0/659.9 = 1.0305 in S3, 720.5/699.2 = 1.0305 or
(33) The 594.6-cm-' band was observed in ref 27 and tentatively assigned to S3- without benefit of 34S isotopic data. The 34S shift and splittings are not compatible with a possible S3- assignment.
(34) Brewer, L.; Brabson, G. D.; Meyer, B. J . Chem. Phys. 1965.42, 1385.
J. Am. Chem. SOC., Vol. 114, No. 1 , 1992 89
710.1/689.3 = 1.0302 in (S2)2, and 642.4/623.4 = 1.0305 in S4.27 Thus, it is proposed that the 624.2-cm-' band belongs to a S-S submolecule, which is weakly attached to a N-S submolecule through a weak sulfur-sulfur bond. The weak NS-S2 bond ex- plains the photolysis and annealing behavior observed for the 1 3 0 9 5 , 624.2-, and 1253.7-cm-I bands. This bond breaks with 420-nm radiation and gives perturbed S N a t 1253.7 cm-I and another perturbed S2, which was not observed presumably due to low intensity or masking by S3 and S4 absorptions. The original NS-S2 species was reformed upon annealing.
This species is produced in the presence of excess sulfur, manifested as S3, suggesting that it is probably formed from the reaction of S3 with nitrogen in the gas phase or on the matrix surface. However, reaction of SN with S2 is apparently the most probable mechanism within the matrix.
N + S3 - NSSS (gas phase or on the matrix surface)
S N + S2 -+ NSSS (within matrix)
The latter pathway is in agreement with the annealing behavior subsequent to the photolysis where adjacent S N and S2 can react with each other in contrast to the small growth of this species upon direct annealing where only a small amount of perturbed S N with S2 is present.
SNNS2. The absorption band at 1499.7 cm-I was produced as the sulfur reservoir temperature increased to 70 O C and higher. However, annealing decreased this band, indicating a more stable higher sulfide absorbs elsewhere. The fact that the 1499.7-cm-l band was observed in the presence of a relatively high yield of the primary reaction products S N and NS2 suggests a secondary reaction product of the primary species. The sulfur and nitrogen isotopic ratios for the upper band are very close to those observed for the antisymmetric stretch of NS2. We assign the 1499.7-cm-l absorption band to the strong antisymmetric NS2 stretching vi- bration in the SN-NS, molecule; the weak N-S stretching mode was not observed. This assignment requires a relatively weak N-N bond. As a consequence the vibrational motion of one fundamental group is not coupled with the vibrational motion of the other group, and no nitrogen isotopic mixing occurs; this is the case for the analogous ON-NO2 molecule.35
It is interesting to compare the fundamentals in SN-NS2 and ON-NO2 with their constituent functional group fundamentals. The major difference here is the electron-withdrawing effect of the -NO2 group versus the probable electron-donating effect of the -NS2 group owing to the substantially lower electronegativity of S as compared to 0. The frequency shifts are relatively small in ON-NO2 from the subgroup fundamentals; however, in SN- NS2, the -NS2 group fundamental increases 274 cm-'. This denotes antibonding electron density displacement from NS2 to N S with concomitant displacements in group fundamentals. This hypothesis is supported by the higher calculated electron affinity for N S as compared to NO.36
NS-SN. The 1167.5-cm-I band was formed in all experiments where S N was produced, but this band also decreased on sample annealing. The intensity relative to S N increased from 1/2 with the sulfur reservoir temperature a t 50 "C to 1 / 1 with this tem- perature a t 70 O C . The sulfur and nitrogen isotopic ratios for this band are in very close agreement with diatomic S N with the sulfur ratio slightly higher and the nitrogen ratio slightly lower than those of SN.
A missing species is (NS),. The cyclic S2N2 molecule evapo- rating from the solid9 is clearly not produced from the elements in a gaseous discharge as S2N2 was not observed in the present experiments. Although S2N2 is a stable vapor species, it must be formed by evaporization or reaction of the solid S4N4 com- po~nds.~3' The 1167.5-cm-l band is tentatively assigned to NS-SN bonded through sulfur in contrast to (NO),, which is weakly bonded through nitrogen. Here the increased importance of sulfursulfur bonding is noteworthy.
(35) Varetti, E. L.; Pimentel, G. C. J . Chem. Phys. 1971, 55, 3813. (36) OHare, P. A. G. J . Chem. Phys. 1971, 54, 4124.
90 J . Am. Chem. Sac., Val. 114, No. 1, 1992
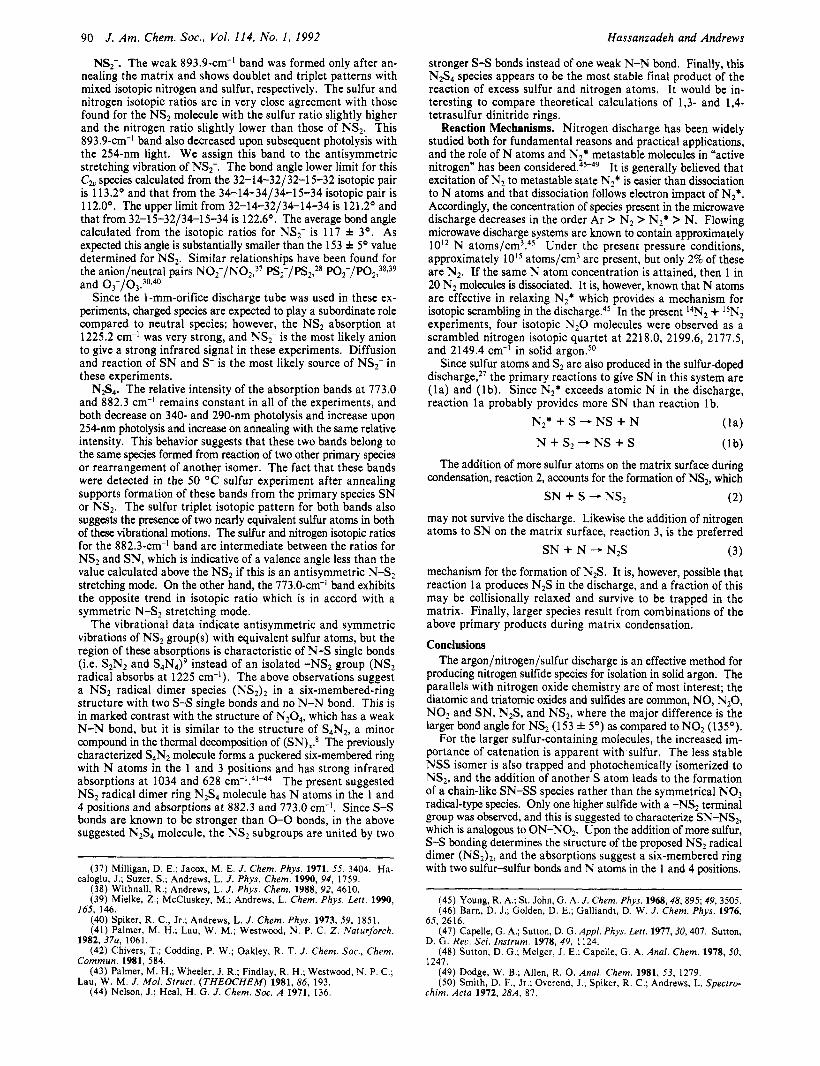
NS2-. The weak 893.9-cm-' band was formed only after an- nealing the matrix and shows doublet and triplet patterns with mixed isotopic nitrogen and sulfur, respectively. The sulfur and nitrogen isotopic ratios are in very close agreement with those found for the NS, molecule with the sulfur ratio slightly higher and the nitrogen ratio slightly lower than those of NS,. This 893.9-cm-I band also decreased upon subsequent photolysis with the 254-nm light. We assign this band to the antisymmetric stretching vibration of NS,-. The bond angle lower limit for this C, species calculated from the 32-14-32/32-15-32 isotopic pair is 113.2' and that from the 34-14-34/34-15-34 isotopic pair is 112.0'. The upper limit from 32-14-32/34-14-34 is 121.2' and that from 32-15-32/34-15-34 is 122.6'. The average bond angle calculated from the isotopic ratios for N S T is 117 * 3'. As expected this angle is substantially smaller than the 153 f 5' value determined for NS2. Similar relationships have been found for the anion/neutral pairs N02-/N02,37 pS~/pS2,28 Po2-/Po2,38~39 and 03-/03.30940
Since the 1-mm-orifice discharge tube was used in these ex- periments, charged species are expected to play a subordinate role compared to neutral species; however, the NS, absorption at 1225.2 cm-' was very strong, and NS2- is the most likely anion to give a strong infrared signal in these experiments. Diffusion and reaction of S N and S- is the most likely source of NS,- in these experiments.
N2S4. The relative intensity of the absorption bands at 773.0 and 882.3 cm-l remains constant in all of the experiments, and both decrease on 340- and 290-nm photolysis and increase upon 254-nm photolysis and increase on annealing with the same relative intensity. This behavior suggests that these two bands belong to the same species formed from reaction of two other primary species or rearrangement of another isomer. The fact that these bands were detected in the 50 'C sulfur experiment after annealing supports formation of these bands from the primary species S N or NS2. The sulfur triplet isotopic pattern for both bands also suggests the presence of two nearly equivalent sulfur atoms in both of these vibrational motions. The sulfur and nitrogen isotopic ratios for the 882.3-cm-' band are intermediate between the ratios for NS2 and SN, which is indicative of a valence angle less than the value calculated above the NS, if this is an antisymmetric N-S2 stretching mode. On the other hand, the 773.0-cm-] band exhibits the opposite trend in isotopic ratio which is in accord with a symmetric N-S2 stretching mode.
The vibrational data indicate antisymmetric and symmetric vibrations of NS2 group(s) with equivalent sulfur atoms, but the region of these absorptions is characteristic of N-S single bonds (i.e. SzN2 and S4N4)9 instead of an isolated -NS2 group (NS, radical absorbs at 1225 cm-I). The above observations suggest a NS2 radical dimer species (NS,), in a six-membered-ring structure with two S-S single bonds and no N-N bond. This is in marked contrast with the structure of N204, which has a weak N-N bond, but it is similar to the structure of S4N2, a minor compound in the thermal decomposition of (SN)x.8 The previously characterized S4Nz molecule forms a puckered six-membered ring with N atoms in the 1 and 3 positions and has strong infrared absorptions at 1034 and 628 cm-1.43-44 The present suggested NS2 radical dimer ring N2S4 molecule has N atoms in the 1 and 4 positions and absorptions at 882.3 and 773.0 cm-I. Since S-S bonds are known to be stronger than 0-0 bonds, in the above suggested N2S4 molecule, the NS2 subgroups are united by two
Hassanzadeh and Andrews
(37) Milligan, D. E.; Jacox, M. E. J. Chem. Phys. 1971.55, 3404. Ha- caloglu, J.; Suzer, s.; Andrews, L. J. Phys. Chem. 1990, 94, 1759.
(38) Withnall, R.; Andrews, L. J. Phys. Chem. 1988, 92, 4610. (39) Mielke, 2.; McCluskey, M.; Andrews, L. Chem. Phys. Lett. 1990,
165, 146. (40) Spiker, R. C., Jr.; Andrews, L. J. Chem. Phys. 1973, 59, 1851. (41) Palmer, M. H.; Lau, W. M.; Westwood, N. P. C. Z. Naturforch.
1982, 37a, 1061. (42) Chivers, T.; Codding, P. W.; Oakley, R. T. J. Chem. Soc., Chem.
Commun. 1981, 584. (43) Palmer, M. H.; Wheeler, J. R.; Findlay, R. H.; Westwood, N. P. C.;
Lau, W. M. J. Mol. Strucr. (THEOCHEM) 1981, 86, 193. (44) Nelson, J.; Heal, H. G. J. Chem. SOC. A 1971, 136.
stronger S-S bonds instead of one weak N-N bond. Finally, this NZS4 species appears to be the most stable final product of the reaction of excess sulfur and nitrogen atoms. It would be in- teresting to compare theoretical calculations of 1,3- and 1,4- tetrasulfur dinitride rings.
Reaction Mechanisms. Nitrogen discharge has been widely studied both for fundamental reasons and practical applications, and the role of N atoms and N2* metastable molecules in "active nitrogen" has been considered.4549 It is generally believed that excitation of N z to metastable state N2* is easier than dissociation to N atoms and that dissociation follows electron impact of N2*. Accordingly, the concentration of species present in the microwave discharge decreases in the order Ar > N z > N2* > N . Flowing microwave discharge systems are known to contain approximately lo', N a t ~ m s / c m ~ . ~ ~ Under the present pressure conditions, approximately 1015 atoms/cm3 are present, but only 2% of these are N2. If the same N atom concentration is attained, then 1 in 20 N z molecules is dissociated. It is, however, known that N atoms are effective in relaxing N2* which provides a mechanism for isotopic scrambling in the di~charge.4~ In the present I4N2 + 15Nz experiments, four isotopic N 2 0 molecules were observed as a scrambled nitrogen isotopic quartet at 2218.0, 2199.6, 2177.5, and 2149.4 cm-] in solid argon.50
Since sulfur atoms and S, are also produced in the sulfur-doped di~charge,~ ' the primary reactions to give S N in this system are ( l a ) and ( lb) . Since N2* exceeds atomic N in the discharge, reaction l a probably provides more S N than reaction lb.
Nz* + S --+ N S + N ( l a )
N + S , - N S + S (1b) The addition of more sulfur atoms on the matrix surface during
condensation, reaction 2, accounts for the formation of NS2, which S N + S -, NS, (2)
may not survive the discharge. Likewise the addition of nitrogen atoms to SN on the matrix surface, reaction 3, is the preferred
(3) mechanism for the formation of N2S. It is, however, possible that reaction l a produces N2S in the discharge, and a fraction of this may be collisionally relaxed and survive to be trapped in the matrix. Finally, larger species result from combinations of the above primary products during matrix condensation.
Conclusions The argon/nitrogen/sulfur discharge is an effective method for
producing nitrogen sulfide species for isolation in solid argon. The parallels with nitrogen oxide chemistry are of most interest; the diatomic and triatomic oxides and sulfides are common, NO, N20, NO, and SN, N2S, and NS2, where the major difference is the larger bond angle for NS2 (153 * 5') as compared to NO2 (135').
For the larger sulfur-containing molecules, the increased im- portance of catenation is apparent with sulfur. The less stable NSS isomer is also trapped and photochemically isomerized to NS2, and the addition of another S atom leads to the formation of a chain-like SN-SS species rather than the symmetrical NO3 radical-type species. Only one higher sulfide with a -NS2 terminal group was observed, and this is suggested to characterize SN-NS,, which is analogous to ON-NO,. Upon the addition of more sulfur, S-S bonding determines the structure of the proposed NS, radical dimer (NS,),, and the absorptions suggest a six-membered ring with two sulfursulfur bonds and N atoms in the 1 and 4 positions.
S N + N - N2S
(45) Young, R. A.; St. John, G. A. J. Chem. Phys. 1968,48,895; 49,3505. (46) Barn, D. J.; Golden, D. E.; Galliandt, D. W. J. Chem. Phys. 1976,
(47) Capelle, G. A,; Sutton, D. G. Appl. Phys. Lett. 1977, 30, 407. Sutton,
(48) Sutton, D. G.; Melger, J. E.; Capelle, G. A. Anal. Chem. 1978, 50,
(49) Dodge, W. B.; Allen, R. 0. Anal. Chem. 1981, 53, 1279. (50) Smith, D. F., Jr.; Overend, J.; Spiker, R. C.; Andrews, L. Spectro-
65, 2616.
D. G. Reu. Sci. Instrum. 1978, 49, 1124.
1247.
chim. Acta 1972, 28A, 87.

J . Am. Chem. SOC. 1992, 114, 91-98 91
Acknowledgment. We gratefully acknowledge financial support from NSF Grant C H E 88-20764 and the gift of a sulfur nitride samDle from A. G. MacDiarmid.
This differs slightly from the structure of the S4N2 molecule produced from the decomposition of (SN),. The matrix infrared characterization of larger nitrogen sulfides invites more electronic
Registry No. S, 7704-34-9; N,, ,7727-37-9; SN, 12033-56-6; NS2, 12033-57-7; N~S, 56400-02-3; NSS, 137122-34-0; NSSS, 88574-94-1; SNNS2, 137122-35-1; NS-SN, 137122-36-2; NS2-, 91054-03-4; N2S4, 79796-33-1; I5N. 14390-96-6: 32s. 13981-57-2: 34S. 13965-97-4: Ar.
structure calculations-to test Ihese bonding models. Finally, the gas-phase reaction of N and s atoms at high dilution
produced simple nitrogen sulfide species SN, N2S, and NS2 and not the larger sulfur nitride species S2N2 and SIN, formed on evaporation of solid polymeric sulfur nitride. 7440-37-1.
An Interpretation of Organometallic Bond Dissociation Energies
Russell S. Drago,* Ngai M. Wong, and Donald C. Ferris
Contribution from the Department of Chemistry, University of Florida, Gainesville. Florida 3261 1. Received May 17, 1991
Abstract: Organometallic bond dissociation energies (BDE) are incorporated into the E and C model with excellent results. Since the data are consistent with gas-phase systems, the fit supports claims that the enthalpies are relatively free of solvation contributions. The organometallic catimers (fragments forming the positive end of the dipole) include (C0)5Mn1, [q5- ( C H ~ ) ~ S ~ C S H ~ I ~ U ' " - , [11'-C5&1 (C0)3M0I15-, [11~-CdCH3)51 [P(CH3)31 (H)1r1"-, [a5-C~(CH~)~12(CH3)3COlTh'v-, [.r15-(C5- (CH3151 [P(CH3)3I zRu"-, [(C6HS)ZPCH2CH2P(C6H5)21 (CH3)Pt"-, [?5:C~(CH3)512Zr-, and ' / 2 [ v 5 - [C5(CH3)51 2Sml 2-. The animers (fragments forming the negative end of the dipole) include organics, halogens, and inorganics. In addition to predicting and interpreting enthalpies, the resulting parameters for the radicals provide reactivity scales that can be used to interpret reactivity and physicochemical properties. Significant chemical insight results from the fit of the data to the ECT model. The parameters are used to reinterpret I9F chemical shifts in (F-Ph)Pt(P2R3),-X, in terms of a u-only Pt-X bond. The earlier interpretation is one of the classic examples used to support metal-ligand a-bonding interactions. Predicted bond energies are analyzed to indicate the metal properties that facilitate the CO insertion reaction. The analysis provides insights into the relative importance of electrostatic and covalent interactions. Further, the analysis shows that simply plotting the data of L,M-X versus H-X gives an incomplete and potentially incorrect interpretation of the data. Another outcome of the analysis is that certain data points are brought into question as well as suggestions for key experiments needed to bring better insight into several systems.
Introduction Organometallic chemists have had considerable success in the
study of model reactions whose mechanisms provide insights re- garding important fundamental steps in homogeneous and het- erogeneous catalytic processes. As with the catalytic system, minor perturbations, e.g., change to another metal or ligand, often lead to dramatic changes in reactivity. Interest in obtaining a more fundamental understanding of this chemistry has led to a desire to understand the bonding energetics.' Such understanding is essential to improve and fine tune catalysts.
Measuring thermodynamic bond strengths or bond dissociation energies (BDE) for these systems is time consuming. It behooves us to extract the maximum amount of information and insight present in the data. An important component of understanding the data is being able to predict bond energies for new systems, thus eliminating the need for additional tedious measurements. Most attempts' to predict and interpret bond dissociation energies involve comparing the measured values for organometallic L,M-X compounds with those for H-X, where X represents the negative end of the bond dipole and can be either an organic or inorganic group. This approach is of limited and uncertain utility because the relative importance of covalent and electrostatic bonding contributions usually varies in the L,M-X and H-X compounds
being compared. The complications introduced into such corre- lations from variation in the covalency have been discussed in detail for neutral donor-acceptor adducts2 and for gas-phase ion- molecule correlations with proton af f in i t ie~ .~
In most correlations, systems that deviate provide the most interesting cases. For example, deviations from a linear plot of the dissociation energies of L,M-X versus H-X are often at- tributed to ?r-back-bond stabilization or steric effects. These conclusions are open to question because deviations from these plots can arise from variation in the relative importance of covalent and electrostatic contributions to the bonding in the two systems plotted.2 Another approach to explaining deviations in plots of H-X bond energies versus L,M-X is to draw a second line for a new class of X groups. This is a sign that the covalent con- tribution to the bonding in L,M is different from that in H.
When H-X bond energies are plotted versus L,M-X bond energies, linear plots usually result when X is limited to a series of halides or to a series of alkyl compounds. When such plots are found, the conclusion that L,M- and H- are similar is in- correct. For limited data sets, straight lines can be obtained even if L,M- and H- are very different. In general, a plot of bond energies for two different systems provides little insight about the fragments plotted, and when deviations from the plot occur for
( 1) (a) Metal-Ligand Bonding Energetics in Organotransition Metal Compounds; Marks, T. J., Ed.; Polyhedron Symposium in Print, 1988, Vol. 7 . This is a series of articles by various contributors. (b) Bonding Energetics in Organometallic Compounds; Marks, T. J., Ed.; ACS Symposium Series 428; American Chemical Society: Washington, DC, 1990. (c) Simces, J. A. M.; Beauchamp, J. L. Chem. Rev. 1990,90,629. (d) Handbook of Chemistry and Physics, 71st ed.; Chemical Rubber Publishing Co.: Cleveland, 1985.
0002-7863/92/1514-91%03.00/0
(2) Drago, R. S. Inorg. Chem. 1990, 29, 1379. Equation 2 becomes a linear equation for acids with the same C A / E A ratio -AH/E, = EAEB/EA + CACB/EA = EB + kCB. Thus -AH = PBEA where PB is a single parameter base scale equal to EB + kC, and k = CA/EA. If the enthalpies of two acids are linear with the base parameter, they are linear to each other.
(3 ) Drago, R. S.; Ferris, D. C.; Wong, N. M. J . Am. Chem. SOC. 1990, 112, 8953.
0 1992 American Chemical Society