Embed Size (px)
Citation preview

8/2/2019 J. Dodion et al- Cloud detection in the upper troposphere-lower stratosphere region via ACE imagers: A qualitative s…
http://slidepdf.com/reader/full/j-dodion-et-al-cloud-detection-in-the-upper-troposphere-lower-stratosphere 1/7
Cloud detection in the upper troposphere-lower
stratosphere region via ACE imagers: A qualitative
study
J. Dodion,1 D. Fussen,1 F. Vanhellemont,1 C. Bingen,1 N. Mateshvili,1 K. Gilbert,2
R. Skelton,2 D. Turnbull,2 S. D. McLeod,2 C. D. Boone,2 K. A. Walker,2 and P. F. Bernath2
Received 3 February 2006; revised 9 September 2006; accepted 2 October 2006; published 9 February 2007.
[1] Satellite-based limb occultation measurements are well suited for the detection andmapping of polar stratospheric clouds (PSCs) and cirrus clouds. Usually, cloud signaturesare detected on aerosol extinction profiles. In this paper, ACE two-dimensional (2-D)imager data are used to show PSCs and cirrus clouds. Clouds can be clearly seen, with agood vertical and horizontal resolution (1 km), during sunset and sunrise. In addition, wediscovered significant differences between stratospheric (PSCs) and tropospheric (cirrus)clouds. PSCs appear as ‘‘symmetric’’ layers, no horizontal or vertical ‘‘structure’’ isdetected within the PSC, suggesting that PSCs are uniform clouds with a very large
horizontal extent. On the other hand, cirrus cloud image geometry is not well-defined. Incontrast to PSCs, cirrus clouds appear as irregular shaped clouds. These troposphericclouds seem to have horizontal dimensions similar to the Sun on the image (25 km at thetangent point). The qualitative display of these different kinds of clouds, seen on the raw2-D imager data, proves the ability of the imagers to be an efficient cloud detector inthe upper troposphere-lower stratosphere (UTLS) region. Moreover, the structure of theseclouds can be derived.
Citation: Dodion, J., et al. (2007), Cloud detection in the upper troposphere-lower stratosphere region via ACE imagers: A qualitative
study, J. Geophys. Res., 112, D03208, doi:10.1029/2006JD007160.
1. Introduction
[2
] Polar stratospheric clouds are of fundamental impor-tance for the formation of the Antarctic ozone hole [ Farmanet al., 1985] that occurs every year since the early 1980s inSouthern Hemisphere spring. PSCs act as hosts for hetero-geneous reactions that transfer chlorine from the reservoir compounds HCl and ClONO2 to Cl2 [ Molina et al., 1987].This process occurs throughout the polar night. When solar radiation reaches the polar lower stratosphere again, Cl2 is
photolyzed to active Cl that participates in a series of catalytic ozone destruction cycles [Solomon, 1999]. Theformation of PSCs requires temperatures below 195 K (T NAT) for PSC types Ia (NAT, nitric acid trihydrate;crystalline) and Ib (ternary solution of HNO3, H2SO4 andH2O; liquid), and less than about 188 K for PSC type II
(H2O ice).[3] In addition, it has recently become clear that cirrusclouds significantly affect the global energy balance andclimate, due to their influence on atmospheric thermalstructure. Several studies [e.g., Randall et al., 1989;
Ramaswamy and Ramanathan, 1989; Liu et al., 2003a;
Liu et al., 2003b] point out that cirrus clouds are likely tohave great impact on the radiation and hence the intensity of
the general large-scale circulation in the tropics. Cirrus arethin, wispy clouds that appear at high tropospheric altitudesand consist of ice crystals. Cirrus clouds are globallydistributed at all latitudes over land or sea at any season of the year. They undergo continuous changes in area coverage,thickness, texture, and position. Tropical cirrus cloudsextend as high as 13–18 km, with ice crystal sizes that range from about 10 to 2000 mm [ Eremenko et al., 2005].
[4] Distinguishing clouds from background aerosols inaerosol extinction retrievals is far from straightforward. Theuse of an averaged line of sight in retrieval methods for solar occultation measurements, the inhomogeneous natureof cloudiness, and the lack of coincident data available for comparisons make the distinction between clouds and
aerosols very uncertain. Many approaches toward cloudidentification from solar occultation and limb emissionmeasurements have been attempted [e.g., Kent et al.,1997; Fromm et al., 1997; Nedoluha et al., 2003; vonSavigny et al., 2005; Spang et al., 2005]. Recently, the
problem of PSC identification was also addressed usingstellar occultation measurements [Vanhellemont et al.,2005].
[5] In the present work, we used imager data provided bythe Atmospheric Chemistry Experiment (ACE) to detect and illustrate cloud signatures. The main idea of our approach consists in first roughly detecting clouds using
JOURNAL OF GEOPHYSICAL RESEARCH, VOL. 112, D03208, doi:10.1029/2006JD007160, 2007ClickHere
for
Full Article
1Belgian Institute for Space Aeronomy, Brussels, Belgium.2Department of Chemistry, University of Waterloo, Waterloo, Ontario,
Canada.
Copyright 2007 by the American Geophysical Union.0148-0227/07/2006JD007160$09.00
D03208 1 of 7
8/2/2019 J. Dodion et al- Cloud detection in the upper troposphere-lower stratosphere region via ACE imagers: A qualitative s…
http://slidepdf.com/reader/full/j-dodion-et-al-cloud-detection-in-the-upper-troposphere-lower-stratosphere 2/7
transmission and total extinction profiles. A qualitativedisplay of these different kinds of clouds, seen on the rawtwo-dimensional (2-D) imager data, will prove the ability of the imagers to be an efficient cloud detector in the upper troposphere-lower stratosphere (UTLS) region. Finally, acharacteristic cloud image geometry for both PSCs andcirrus clouds is derived.
2. ACE Instrument and Imager Data
[6] The Atmospheric Chemistry Experiment (ACE)[ Bernath et al., 2005] was launched in August 2003 aboardthe Canadian scientific satellite SCISAT-I. The main instru-ment on board is a high-resolution (0.02 cmÀ1) Fourier Transform Spectrometer (FTS) operating from 750 to4400 cmÀ1. During sunrise and sunset, the FTS measuresinfrared absorption signals to provide (via an inversion)vertical profiles of atmospheric constituents (gases and
particles). Aerosols and clouds are being monitoredusing the extinction of solar radiation at 1.02 (NIR) and0.525 (VIS) mm as measured by two filtered imagers. Theimagers consist of (after binning) 128 Â 128 active pixel
sensors. The total field of view (FOV) of the imagers is30 mrad, to be compared to the 9 mrad angular diameter of the Sun. The signal-to-noise ratio (SNR) of each solar image is greater than 1000. The satellite operates from acircular orbit at an altitude of 650 km, and the orbital
plane inclination of 74 degrees allows a global coveragewith some predominance of the polar regions.
[7] While the Sun is setting below or rising from behindthe Earth’s horizon, at every time stamp, the imagerscapture a snapshot of the Sun as seen through the atmo-sphere. On these pictures, the apparent Sun width is about 25 km at the tangent point and the apparent Sun height variesfrom almost 0.7 km (geometrical dimension of 1 pixel at thetangent point) in the optically thick, lower troposphere
where the Sun image is highly flattened by the refraction,to its maximum (about 25 km at the tangent point) whererefractive effects are negligible.
[8] Transmittances are calculated only for the pixelsdeemed to be in the center of the ACE-FTS FOV (i.e., thecenter of the Sun), as determined from the prelaunchregistration measurements and postlaunch checks of theregistration. The results are averaged for three adjacent
pixels to improve the signal-to-noise ratio. The three pixelsare within the FTS FOV and are from the same row of theimage (and thus have the same tangent altitude). Tangent heights are assigned to the transmittance data through thetime stamps of the ACE-FTS and imager measurements,with an accuracy of about 1 km. The authors refer to Boone
et al. [2005] for a detailed description of ACE-FTS andimager retrievals. The imagers are sampled at a rate of 4 images per second, while the FTS scans take about 2 seach. The imagers and FTS are not synchronized to eachother. So, an offset in time stamp is required to relate thetwo data sets. The value selected for the offset was chosensuch that cloud features in the extinction profiles derivedfrom the imagers matched observations from cloud spec-tral features in the FTS. From the transmittance data, a
profile for total atmospheric extinction at both wavelengthswas retrieved by using a vertical inversion algorithm.
[9] Aerosol extinction profiles were obtained by subtract-ing the gas extinction contributions (air, O3, NO2), obtainedfrom the FTS measurements, from the total atmosphericextinction profiles. Since the used imager pixels are withinthe LOS of the FTS, our approach is reasonable. Thetemperature profiles that are used in this paper are also
provided by the FTS.
3. Cloud Detection
[10] From the 3712 events measured between April 2004and May 2005, we visually selected clouds from theimagers transmission and total extinction profiles. Cloudsappear as sharp features, with a decrease in atmospherictransmittance corresponding to an increase in total extinc-tion (Figure 1).
[11] The selected events are divisible in three mainsubgroups, determined by the three main ACE observation
priorities (Arctic/Antarctic spring and the tropics). The first group of 38 clouds were visible during the (northern) winter of 2005 in Northern Hemisphere (>50° N). Second, we havea group of 59 clouds during the (northern) summer of 2004
in Southern Hemisphere (>50°S). Finally, there is a largegroup of 103 equatorial clouds (30°S to 30° N) in any seasonof the year 2004– 2005. A longitude/latitude plot and atime/latitude plot shows the geographical and temporaldistribution of the selected events (Figure 2).
[12] The median aerosol extinction profiles (Figure 3)clearly show an increased extinction in the lower strato-sphere for the selected Southern Hemisphere occultations,revealing the presence of PSCs. At northern latitudes, nosuch stratospheric PSC signature is observed. This obser-vation is corroborated by an investigation of the ACEtemperature retrievals (Figure 4). In the majority of cases,temperatures exceed the PSC formation temperature (T NAT).However, a few cases occur below T NAT and these are
associated with PSC formation. Other clouds are tropo-spheric clouds (increased upper tropospheric median aerosolextinction). At the equator, a significant median enhance-ment of aerosol extinction is observed below 17 km,suggesting the presence of tropospheric (cirrus) clouds.
4. Imager Results
[13] In this section we present a qualitative description of PSCs and cirrus clouds as seen by the NIR imager. Thereason for not using the VIS imager is clear: opticalextinction (gas absorption and Rayleigh scattering) is muchstronger in the visible range. As a consequence, a signal cut-off is often observed at tropospheric and lower stratospheric
altitudes. Moreover, transmittances that are measured by the NIR imager are almost exclusively affected by aerosols andclouds since the extinction cross sections of the gaseousspecies are very small at the corresponding wavelength.
[14] Starting from the set of detected cloud events, wehave performed a classification. A cloud is labeled as a‘‘PSC’’ when (1) the associated occultation occurred at highlatitudes (possibly inside the polar vortex) and (2) when theassociated temperature is lower than T NAT. When at least one of these two criteria is not satisfied, the cloud is labeledas ‘‘cirrus.’’ As already mentioned, many Northern Hemi-
D03208 DODION ET AL.: ACE IMAGER CLOUD DETECTION
2 of 7
D03208

8/2/2019 J. Dodion et al- Cloud detection in the upper troposphere-lower stratosphere region via ACE imagers: A qualitative s…
http://slidepdf.com/reader/full/j-dodion-et-al-cloud-detection-in-the-upper-troposphere-lower-stratosphere 3/7
Figure 1. Atmospheric transmission (left) and total extinction (right) profile of a selected event withcloud contamination.
Figure 2. Geolocation of the selected events with possible cloud contamination at Northern Hemisphere(circles), equator (crosses) and Southern Hemisphere (stars). (top) Longitude/latitude plot; (bottom) time/ latitude plot.
D03208 DODION ET AL.: ACE IMAGER CLOUD DETECTION
3 of 7
D03208

8/2/2019 J. Dodion et al- Cloud detection in the upper troposphere-lower stratosphere region via ACE imagers: A qualitative s…
http://slidepdf.com/reader/full/j-dodion-et-al-cloud-detection-in-the-upper-troposphere-lower-stratosphere 4/7
Figure 3. Median NIR aerosol extinction profiles for the selected events (full lines) in (top) NorthernHemisphere, (middle) equator, and (bottom) Southern Hemisphere. Dashed lines represent median NIR aerosol extinction profiles for events without cloud contamination.
Figure 4. Temperature distributions for the selected occultations in (top) Northern Hemisphere and(bottom) Southern Hemisphere. T NAT is indicated by the vertical line at 195 K.
D03208 DODION ET AL.: ACE IMAGER CLOUD DETECTION
4 of 7
D03208

8/2/2019 J. Dodion et al- Cloud detection in the upper troposphere-lower stratosphere region via ACE imagers: A qualitative s…
http://slidepdf.com/reader/full/j-dodion-et-al-cloud-detection-in-the-upper-troposphere-lower-stratosphere 5/7
sphere clouds are suspected to be of the cirrus type. As wewill see, the imager data confirm this beyond doubt.
[15] The images shown in this section are (raw) imager data. A rotation is applied to measured images such that therows of the transformed image are parallel to the Earth’shorizon. The transformation uses the assumed orientation of the satellite for aligning the input slit to the horizon
(accurate to 1 degree). The images are corrected for itemssuch as dark counts and secondary images. Presentedimages are one snapshot of the Sun, initially consisting of 64 Â 64 pixels but cut off for distinct presentation. OnFigure 5, an image of the Sun at high altitude, outside theEarth’s atmosphere, is shown. Since there is no atmospheric
Figure 5. Reference Sun image outside the Earth’s atmosphere (120 km). Note that vertical andhorizontal scale is pixels (1 pixel has horizontal and vertical dimension of 0.7 km at the tangent point).The color bar represents measured flux intensity.
Figure 6. Imager data at 1.020 mm. (top) PSC layer, 9 July 2004 at lat = 61°S; (bottom) PSC doublelayer, 2 August 2004 at lat = 65°S.
D03208 DODION ET AL.: ACE IMAGER CLOUD DETECTION
5 of 7
D03208
8/2/2019 J. Dodion et al- Cloud detection in the upper troposphere-lower stratosphere region via ACE imagers: A qualitative s…
http://slidepdf.com/reader/full/j-dodion-et-al-cloud-detection-in-the-upper-troposphere-lower-stratosphere 6/7
absorption, it is a reference image for other imager data inthis section.
4.1. PSCs
[16] Imager data associated with PSC events, are shownon Figure 6. Remarkably, PSCs appear as ‘‘symmetric’’layers. No horizontal or vertical ‘‘structure’’ is detected
within the PSC, suggesting that PSCs are uniform cloudswith a large horizontal extent. Owing to the good verticalresolution, even two PSCs above each other can be seen(a double layer). Looking to the movie of a Sun rising from
behind the Earth’s atmosphere, suddenly, between 15 and25 km, a PSC appears on top of the Sun image. While theSun is rising (setting), the cloud passes as a layer slidingdown (up) over the solar disk. We detected no events with aPSC covering only a part of the Sun width. PSCs seem to bespread over very large, low-temperature, horizontal regions.
[17] In principle, cloud thickness should be derivablefrom imager data. However, it is important to notice that the cloud picture is dependent on the position of the cloudalong the LOS. When the cloud is located near the tangent
point, the cloud image geometry is a good indicator of the physical geometry. However, clouds located far from thetangent point region should be no exception. This issuggested by a significant amount of detected PSCs witha large altitude extent (10 km), most possibly caused by analtitude smearing.
4.2. Cirrus Clouds
[18] In contrast to PSCs, cirrus clouds are not character-ized by a homogeneity in the imager data. Looking to therising/setting Sun, cirrus clouds appear as horizontally andvertically moving, complex structures. This horizontalmotion is not related to a physical motion of the cloud,
but to b , i.e., the angle between the orbit track of thesatellite and the Earth-Sun vector. The greater the absolutevalue of b , the faster the apparent horizontal movement of the cirrus cloud (the Sun is fixed in the CCD center).
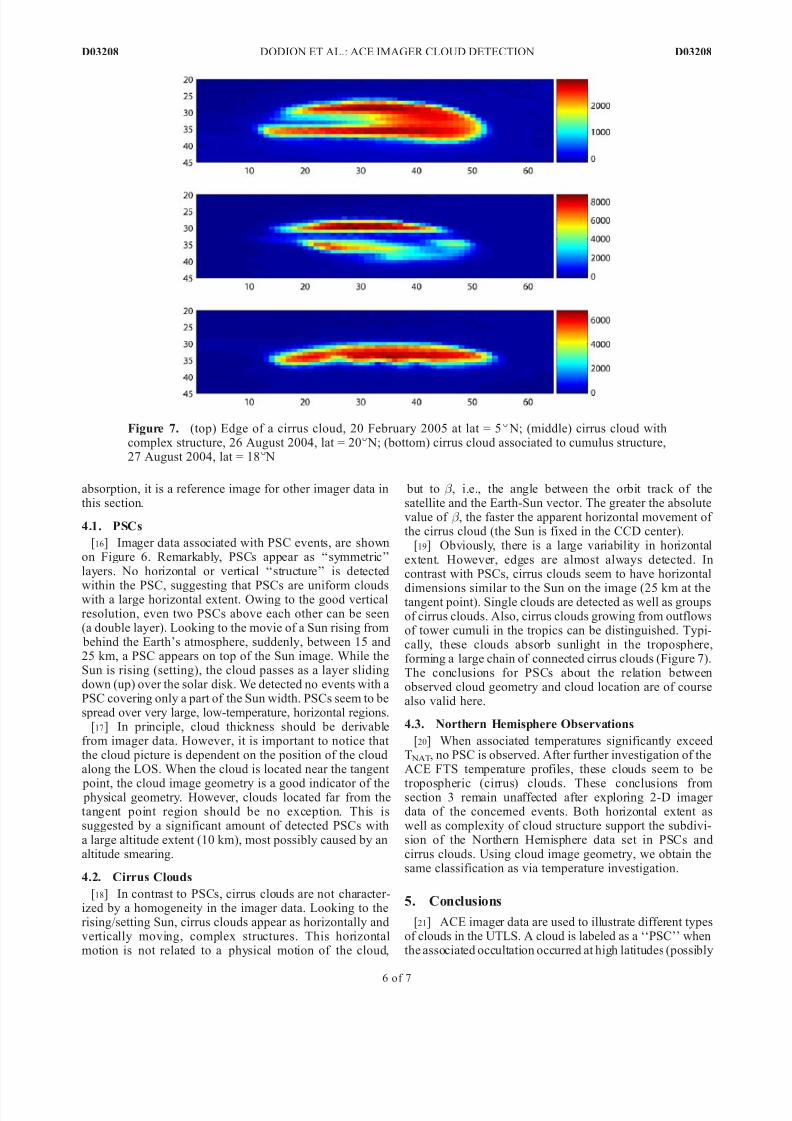
[19] Obviously, there is a large variability in horizontalextent. However, edges are almost always detected. Incontrast with PSCs, cirrus clouds seem to have horizontal
dimensions similar to the Sun on the image (25 km at thetangent point). Single clouds are detected as well as groupsof cirrus clouds. Also, cirrus clouds growing from outflowsof tower cumuli in the tropics can be distinguished. Typi-cally, these clouds absorb sunlight in the troposphere,forming a large chain of connected cirrus clouds (Figure 7).The conclusions for PSCs about the relation betweenobserved cloud geometry and cloud location are of coursealso valid here.
4.3. Northern Hemisphere Observations
[20] When associated temperatures significantly exceedT NAT, no PSC is observed. After further investigation of theACE FTS temperature profiles, these clouds seem to be
tropospheric (cirrus) clouds. These conclusions fromsection 3 remain unaffected after exploring 2-D imager data of the concerned events. Both horizontal extent aswell as complexity of cloud structure support the subdivi-sion of the Northern Hemisphere data set in PSCs andcirrus clouds. Using cloud image geometry, we obtain thesame classification as via temperature investigation.
5. Conclusions
[21] ACE imager data are used to illustrate different typesof clouds in the UTLS. A cloud is labeled as a ‘‘PSC’’ whenthe associated occultation occurred at high latitudes (possibly
Figure 7. (top) Edge of a cirrus cloud, 20 February 2005 at lat = 5° N; (middle) cirrus cloud withcomplex structure, 26 August 2004, lat = 20° N; (bottom) cirrus cloud associated to cumulus structure,27 August 2004, lat = 18° N
D03208 DODION ET AL.: ACE IMAGER CLOUD DETECTION
6 of 7
D03208

8/2/2019 J. Dodion et al- Cloud detection in the upper troposphere-lower stratosphere region via ACE imagers: A qualitative s…
http://slidepdf.com/reader/full/j-dodion-et-al-cloud-detection-in-the-upper-troposphere-lower-stratosphere 7/7
inside the polar vortex) and when the associated temperatureis lower than T NAT. Otherwise, the cloud is labeled ‘‘cirruscloud.’’ We discovered significant differences between PSCsand cirrus clouds exploring 2-D imager data. PSCs appear as‘‘symmetric’’ layers, no horizontal or vertical ‘‘structure’’ isdetected within the PSC, suggesting that PSCs are uniformclouds with a very large horizontal extent. On the other hand,cirrus cloud image geometry is not well-defined. Also, cirrus
clouds seem to have horizontal dimensions similar to the Sunon the image (25 km at the tangent point).
[22] In conclusion, we have established the usefulness of imager data to detect clouds and to observe their structure.Our conclusions about cloud image geometry will help us toimplement a cloud detection algorithm in future. After validation, a synergetic use of ACE FTS and imager datawill reveal observed cloud nature and geometry in theUTLS region. A (quantitative) cloud analysis at the tropicsand at high latitudes during the polar vortices will be
presented soon.
[23] Acknowledgments. The present study was funded by thePRODEX 7 contract SADE under the authority of the Belgian Space
Science Office (BELSPO). The ACE mission is funded by the CanadianSpace Agency and the Natural Sciences and Engineering ResearchCouncil of Canada (NSERC). Funding at Waterloo is also provided bythe NSERC-Bomem-CSA-MSC Industrial Research Chair in Fourier Transform Spectroscopy.
ReferencesBernath, P. F., et al. (2005), Atmospheric Chemistry Experiment (ACE):
Mission overview, Geophys. Res. Lett., 32, L15S01, doi:10.1029/ 2005GL022386.
Boone, C. D., R. Nassar, K. A. Walker, Y. Rochon, S. D. McLeod, C. P.Rinsland, and P. F. Bernath (2005), Retrievals for the atmospheric chem-istry experiment Fourier-transform spectrometer, Appl. Opt., 44(33),7218–7231.
Eremenko, M. N., A. Y. Zasetsky, C. D. Boone, and J. J. Sloan (2005),Properties of high-altitude tropical cirrus clouds determined from ACEFTS observations, Geophys. Res. Lett., 32, L15S07, doi:10.1029/ 2005GL022428.
Farman, J. C., B. G. Gardiner, and J. D. Shanklin (1985), Large losses of total ozone in Antarctica reveal seasonal ClO
x /NO
x interaction, Nature,
315, 207– 210.
Fromm, M. D., R. M. Bevilacqua, J. D. Lumpe, E. P. Shettle, J. S.Hornstein, S. T. Massie, and K.-H. Fricke (1997), Observations of Ant-arctic polar stratospheric clouds by POAM II: 1994–1996, J. Geophys.
Res., 102(D19), 23,659–23,672.Kent, G. S., P.-H. Wang, and K. M. Skeens (1997), Discrimination of cloud
and aerosol in the Stratospheric Aerosol and Gas Experiment III occulta-tion data, Appl. Opt., 36 (33), 8639– 8649.
Liu, H.-L., P. K. Wang, and R. E. Schlesinger (2003a), A numerical study of cirrus clouds. Part I: Model description, J. Atmos. Sci., 60(8),1075–1084.
Liu, H.-L., P. K. Wang, and R. E. Schlesinger (2003b), A numerical studyof cirrus clouds. Part II: Effects of ambient temperature, stability, radia-tion, ice microphysics, and microdynamics on cirrus evolution, J. Atmos.Sci., 60(9), 1097–1119.
Molina, M. J., T. L. Tso, L. T. Molina, and F. C.-Y. Wang (1987), Antarcticstratospheric chemistry of chlorine nitrate, hydrogen chloride and ice:Release of active chlorine, Science, 238, 1253–1257.
Nedoluha, G. E., R. M. Bevilaqua, M. D. Fromm, K. W. Hoppel, and D. R.Allen (2003), POAM measurements of PSCs and water vapor in the 2002Antarctic vortex, Geophys. Res. Lett., 30(15), 1796, doi:10.1029/ 2003GL017577.
Ramaswamy, V., and V. Ramanathan (1989), Solar absorption of cirrusclouds and the maintenance of the tropical upper troposphere thermalstructure, J. Atmos. Sci., 46 , 2293–2310.
Randall, D. A., Harshovardan, D. A. Dazlich, and T. G. Corsetti (1989),Interactions among radiation, convection, and large-scale dynamics in ageneral circulation model, J. Atmos. Sci., 46 , 1943–1970.
Solomon, S. (1999), Stratospheric ozone depletion: A review of concepts
and history, Rev. Geophys., 37 , 275– 316.Spang, R., J. J. Remedios, L. J. Kramer, L. R. Poole, M. D. Fromm,M. Muller, G . Baumgarten, and P. Konopka (2005), Polar stratosphericcloud observations by MIPAS on ENVISAT: Detection method, valida-tion and analysis of the northern hemisphere winter 2002–2003, Atmos.Chem. Phys., 5, 392–679.
Vanhellemont, F., et al. (2005), A 2003 stratospheric aerosol extinction andPSC climatology from GOMOS measurements on Envisat, Atmos. Chem.
Phys., 5, 2413–2417.von Savigny, C., E. P. Ulasi, K.-U. Eichmann, H. Bovensmann, and J. P.
Burrows (2005), Detection and mapping of polar stratospheric cloudsusing limb scattering observations, Atmos. Chem. Phys., 5, 3071–3079.
ÀÀÀÀÀÀÀÀÀÀÀÀÀÀÀÀÀÀÀÀÀÀÀ
P. F. Bernath, C. D. Boone, K. Gilbert, S. D. McLeod, R. Skelton,D. Turnbull, and K. A. Walker, Department of Chemistry, University of Waterloo, 200 University Avenue W, Waterloo, Ontario, Canada N2L 3G1.
C. Bingen, J. Dodion, D. Fussen, N. Mateshvili, and F. Vanhellemont,
Belgisch Instituut voor Ru imte-Aeronomie, Ringlaan 3, B-1180, Brussels,Belgium. ([email protected])
D03208 DODION ET AL.: ACE IMAGER CLOUD DETECTION
7 of 7
D03208