Embed Size (px)
DESCRIPTION
Transverse Momentum Spectra of Identified Hadrons in s = 130 GeV Au-Au Collisions. J. Burward-Hoy Department of Physics and Astronomy, University at Stony Brook, New York for the PHENIX Collaboration Outline of Topics Motivation Identifying , K , p in PHENIX - PowerPoint PPT Presentation
Citation preview

July 20, 2001 The PHENIX Experiment J. Burward-Hoy
1
J. Burward-HoyDepartment of Physics and Astronomy, University at Stony Brook, New York
for the PHENIX Collaboration
Outline of Topics• Motivation
• Identifying , K, p in PHENIX
• Single Particle Pt spectra
• Radial flow–hydrodynamics-based parameterization
• Discussion and conclusion
Transverse Momentum Spectra of Identified Hadrons in s = 130 GeV Au-Au Collisions

July 20, 2001 The PHENIX Experiment J. Burward-Hoy
2
Motivation
, K, p, anti-p
carry most of energy
collectively flow at t
decouple at Tfo
low pt: soft processesmultiple hadronic rescatteringhydrodynamic behavior
high pt: hard processeshard scattering, jetspQCD
RHIC: Ecm = 130 GeVAu on Au collisions

July 20, 2001 The PHENIX Experiment J. Burward-Hoy
3
Detecting , K, p in PHENIX
x
y ~ q/p
r
z
r
0
pt = p sin(0)
PC1 and Event vertexpolar angle
DC main bend plane
DC resolution p/p ~ 1% 3.5% p
TOF resolution 115 ps

July 20, 2001 The PHENIX Experiment J. Burward-Hoy
4
Corrections to the Raw SpectraUsed MC single particles and track embedding to correct for
Tracking inefficiencies and momentum resolutionGeometrical acceptance Decays in flight (’s and K’s)
Correction is p and PID dependent Particle Acceptance
0.2 GeV/c
-0.35 < < 0.35

July 20, 2001 The PHENIX Experiment J. Burward-Hoy
5
pt Spectra of Identified Hadrons

July 20, 2001 The PHENIX Experiment J. Burward-Hoy
6
Protons Cross the Pions?
HIJING
Kp
pt (GeV/c)
p crosses p crosses K

July 20, 2001 The PHENIX Experiment J. Burward-Hoy
7
Centrality selected pt spectra. . .

July 20, 2001 The PHENIX Experiment J. Burward-Hoy
8
<pt> Across Participant Number

July 20, 2001 The PHENIX Experiment J. Burward-Hoy
9
Identified particle mt-m0 Spectra
pmm tt 20
2
dmmdpp tttt
dNdN 11
If static thermal source,then spectra are parallel
In the range mt - m0 < 1 GeV, fitand extract the inverse slope Teff
edmm TmdN
eff
t
tt
1

July 20, 2001 The PHENIX Experiment J. Burward-Hoy
10
Effective Temperature and HIJING
HIJING
HIJING
No radial flow in HIJING
To measure the expansion parameters, use hydrodynamics-basedparameterization. . .

July 20, 2001 The PHENIX Experiment J. Burward-Hoy
11
Hydrodynamics-based parameterization
parametersnormalization A
freeze-out temperature Tfo
surface velocity t
t
mt
1/m
t dN
/dm
t
TfoA
1/mt dN/dmt = A f() d mT K1( mT /Tfo cosh ) I0( pT /Tfo sinh )
minimize contributions from hard processes fit mt-m0<1 GeV
linear velocity profile t() = t surf. velocity t ave. velocity <t > = 2/3 t boost () = atanh( t() )
integration variable radius r= r/R
definite integral from 0 to 1particle density distribution f() ~ const
t()
1
f()

July 20, 2001 The PHENIX Experiment J. Burward-Hoy
12
PHENIX Preliminary
PHENIX Preliminary PHENIX Preliminary
5% central data
Tfo ~ 104 21 MeVt ~ 0.7 0.1
< t > ~ 0.5 0.1
Systematic errors estimated ~8% in Tfo ~5% in t
Arrows indicate upper pt in fit

July 20, 2001 The PHENIX Experiment J. Burward-Hoy
13
Parameter Space: 2 Contours of -K-p5% central
PHENIX Preliminary PHENIX Preliminary
1
2
3 2/NDF
1
102
10
July 20, 2001 The PHENIX Experiment J. Burward-Hoy
14
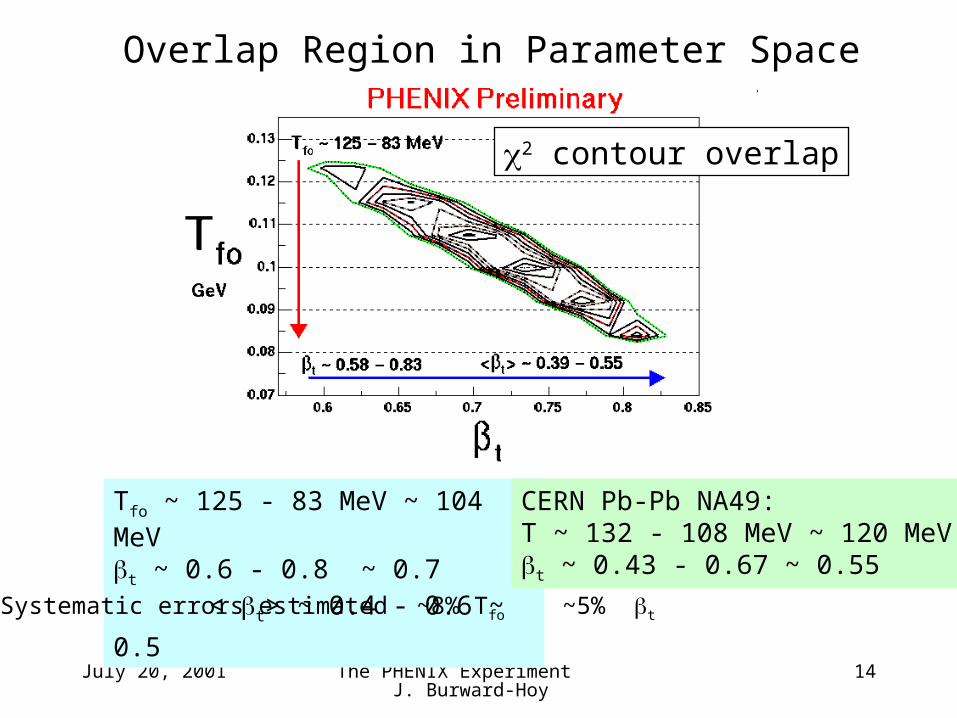
Overlap Region in Parameter Space
Tfo ~ 125 - 83 MeV ~ 104 MeV t ~ 0.6 - 0.8 ~ 0.7
< t> ~ 0.4 - 0.6 ~ 0.5
CERN Pb-Pb NA49: T ~ 132 - 108 MeV ~ 120 MeVt ~ 0.43 - 0.67 ~ 0.55
2 contour overlap
Systematic errors estimated ~8% Tfo ~5% t

July 20, 2001 The PHENIX Experiment J. Burward-Hoy
15
The H2H Model Comparison (Hydro 2 Hadrons)D. Teaney, E. Shuryak, et. al.
flowing hadronic fluid AND particle cascade
uses Hydrodynamics + Relativistic Quantum Molecular Dynamics (RQMD) cascade
more constrained predictive power
no scaling of nucleons to match data
0 ~ 16.75 GeV/fm3 0 ~ 1.0 fm/c
p/p ~ 0.5
<0> ~ 10.95 GeV/fm3
, K Tfo ~ 135 MeV <t > ~ 0.55
nucleons ~ 120 MeV <t > ~ 0.6
5% central
NOTE: includes weak decays

July 20, 2001 The PHENIX Experiment J. Burward-Hoy
16
Conclusions• Fully normalized, centrality selected , K, p/pbar spectra in 130 GeV Au-Au
collisions are measured in PHENIX (Summer 2000 runs)
significant p and pbar contribution to hadron spectra starting at ~ 2 GeV/c
STAR and PHENIX pbar consistent
• Both Teff and <pt> depend on Npart. Teff depends on m0 for 5% central and minimum bias events. There seems to be less of a dependence in the 60 - 92% centrality.
• The data suggest sizeable radial flow at RHIC A simple model that assumes hydrodynamic behavior is fit simultaneously to the 5% central data.
Good 2 fits for a finite range of anti-correlated parameters
Tfo ~ 125 - 83 MeV (~ 8% syst.)t ~ 0.6 - 0.8 ( ~ 5% syst.)
< t> ~ 0.4 - 0.6 – In comparison to NA49:
Tfo ~ 132 - 108 MeV t ~ 0.43 - 0.67
– H2H model (D. Teaney, E. Shuryak, et. al)
, K: Tfo ~ 135 MeV <t >~ 0.55
nucleons: Tfo ~ 120 MeV <t >~ 0.6
• Reduce 20% systematic uncertainty in overall normalization.

July 20, 2001 The PHENIX Experiment J. Burward-Hoy
17
momentum p pathlength L m = p/ where = L/ct
time-of-flight t
|mmeas2 - mcent
2| < 2m22
The mass-squared width: how particle identification is done.
2222
224
2
22 442 pmp
L
cm
ptp
m
H. Hamagaki
Time-of-Flight resolutionMomentum resolution

July 20, 2001 The PHENIX Experiment J. Burward-Hoy
18
0-5%
5-10%10-15%
15-20%20-25%
25-30%
Event centrality: how “head-on” is the collision?
The fraction of counts in the Beam-beam Counters.
A. Denisov
The fraction of energy deposited in the Zero-degree Calorimeters.
5 60%3.7 60%80-92%
19 60%19 60%60-80%
76 15%123 15%30-60%
178 15%383 15%15-30%
271 15%673 15%5-15%
347 15%945 15%0-5%
ParticipantsCollisionsCentrality

July 20, 2001 The PHENIX Experiment J. Burward-Hoy
19
H2H ModelThe Effect of Weak Decays
D. Teaney
- + p
+ + p
K0s + + -
The measured contribution to nucleon spectra from such “real” background is forthcoming.

July 20, 2001 The PHENIX Experiment J. Burward-Hoy
20
From Hydrodynamics:Radial Flow Velocity Profiles
Plot courtesy of P. Kolb
t()
(No QGP phase transition)
2 fm/c20 fm/c
5 fm/c
At each “snapshot”in time during theexpansion, thereis a distributionof velocities that vary with theradial position r
Velocity profileat ~ 20 fm/c “freeze-out”hypersurface

July 20, 2001 The PHENIX Experiment J. Burward-Hoy
21
Effective Temperature and Linear Fit
Teff = Tfo + m0 <t>2
Centrality Positive NegativeTfo <t> Tfo <t>
min. bias 16112 0.390.07 15115 0.410.075% 15913 0.390.07 14917 0.460.160-92% 14312 0.280.1 13416 0.280.1
Systematic errors included
5% centralTfo ~ 132 - 166 MeV<t> ~ 0.4 - 0.6
Compared to hydrodynamics-based parameterization: Tfo within 30% and <t> within 6%
July 20, 2001 The PHENIX Experiment J. Burward-Hoy
22
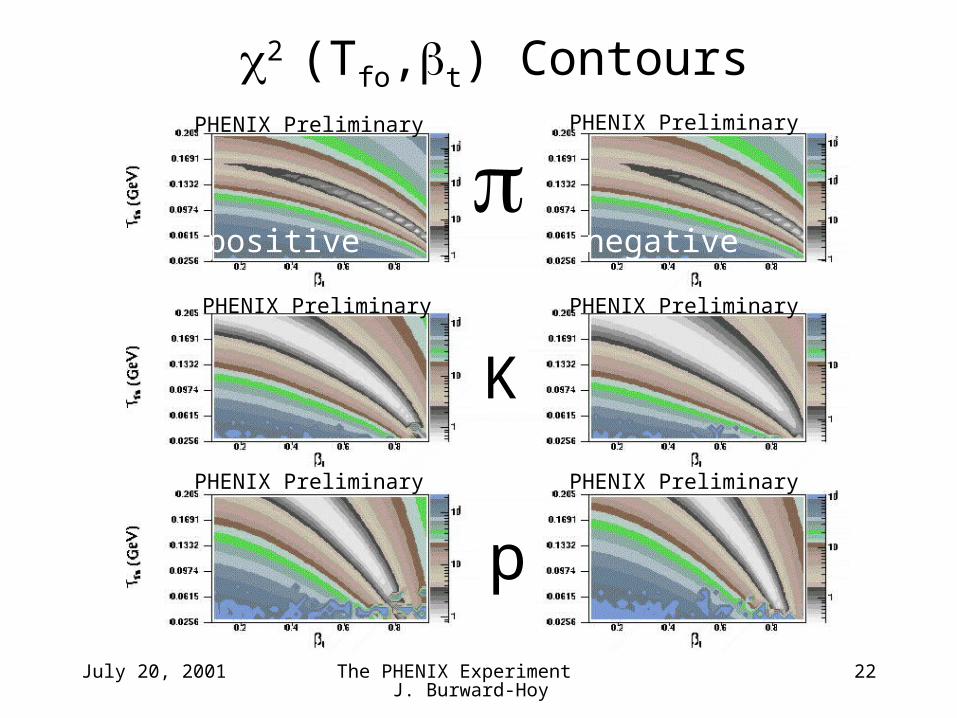
K
p
2 (Tfo,t) Contours
positive negative
PHENIX Preliminary PHENIX Preliminary
PHENIX Preliminary
PHENIX Preliminary
PHENIX Preliminary
PHENIX Preliminary
July 20, 2001 The PHENIX Experiment J. Burward-Hoy
23
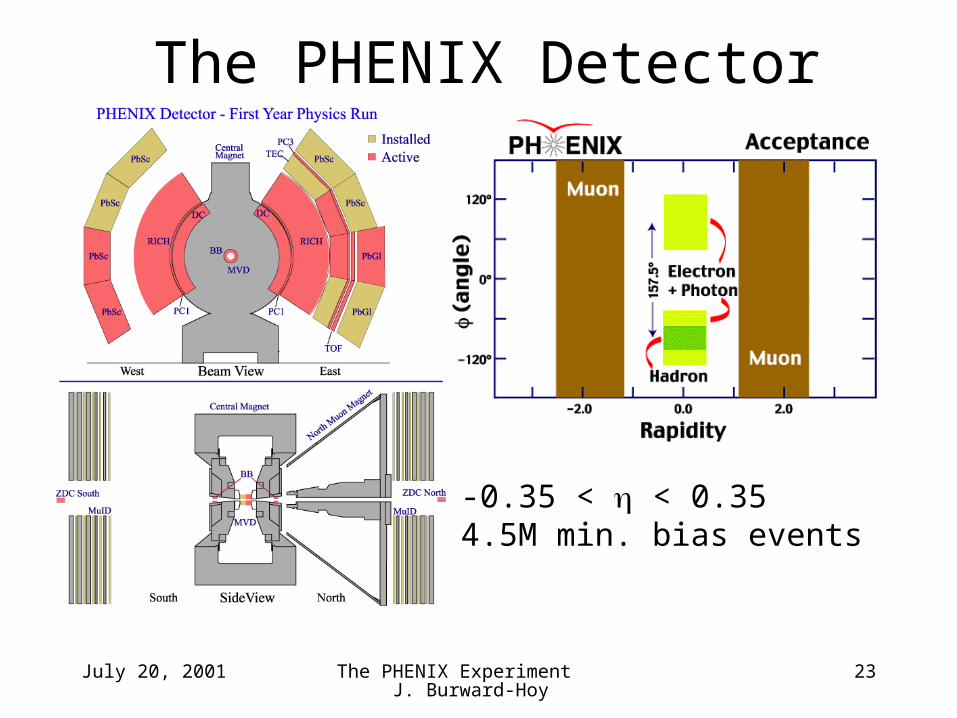
The PHENIX Detector
-0.35 < < 0.354.5M min. bias events

July 20, 2001 The PHENIX Experiment J. Burward-Hoy
24
Relevant CERN SPS Observables
Bjorken’s formula:initial energy density
<0> ~ 1/R20 dEt/dy<0> ~ 3 GeV/fm3 (NA49) System Size = A1 A2
Teff depends on m0 radial flow Teff = Tfo + m<t>2
Tfo
< t>
p + AA + A

July 20, 2001 The PHENIX Experiment J. Burward-Hoy
25
CERN SPSHydrodynamics-Based Parameterization
The spectra are well described using hydrodynamic assumptions.
CERN Pb-Pb NA49: T ~ 132 - 108 MeV ~ 120 MeVt ~ 0.43 - 0.67 ~ 0.55