Embed Size (px)
DESCRIPTION
Drabkin, D.L., and Austin, J.H., Spectrophotometric studies. II. Preparations from washed blood cells; nitric oxide hemoglobin and sulfhemoglobin. (1935) J. Biol. Chem., 112: 51
Citation preview
David L. Drabkin and J. Harold Austin SULFHEMOGLOBINHEMOGLOBIN AND BLOOD CELLS; NITRIC OXIDEPREPARATIONS FROM WASHED SPECTROPHOTOMETRIC STUDIES: II.ARTICLE:
1935, 112:51-65.J. Biol. Chem.
http://www.jbc.org/content/112/1/51.citation
Access the most updated version of this article at
.Sites
JBC AffinityClassics on similar topics on the Find articles, minireviews, Reflections and
Alerts:
When a correction for this article is posted•
When this article is cited•
alerts to choose from all of JBC's e-mailClick here
ml#ref-list-1
http://www.jbc.org/content/112/1/51.citation.full.htaccessed free atThis article cites 0 references, 0 of which can be
by guest on Decem
ber 14, 2014http://w
ww
.jbc.org/D
ownloaded from
by guest on D
ecember 14, 2014
http://ww
w.jbc.org/
Dow
nloaded from

SPECTROPHOTOMETRIC STUDIES
II. PREPARATIONS FROM WASHED BLOOD CELLS; NITRIC OXIDE HEMOGLOBIN AND SULFHEMOGLOBIN
BY DAVID L. DRABKIN AND J. HAROLD AUSTIN
(From the Department of Physiological Chemistry and the John Herr Museer
Department of Research Medicine, School of Medicine, University of Pennsylvania, Philadelphia)
(Received for publication, June 10, 1935)
In this paper evidence will be presented which indicates that spectrophotometric constants are more precisely reproducible with solutions prepared from washed erythrocytes than from hemolyzed whole blood, used in our earlier analyses (1). The data, obtained under standard conditions which will be defined, include the absorption curves of HbOz, Hb, HbCO, MHbCN, HbNO (nitric oxide hemoglobin), and SHb (sulfhemoglobin). The two latter pigments were the main subjects of the investiga- tion.
HbNO was prepared under conditions which excluded the pres- ence of higher oxides of nitrogen and the possible formation of MHb. These precautions were not taken in previous studies of HbNO (2) and rendered doubtful the older spectroscopic data.
SHb probably has not been prepared in a pure state, as claimed (3). We have derived the spectrum of this pigment by extra- polation from absorption data upon mixtures of Hb and SHb. We were thus able to establish the identity of the abnormal pig- ment present in the blood of a patient with clinical sulfhemo- globinemia (4).
Methods
The spectrophotometer and technique employed were those described in our previous publication (l), except for the following modifications.
Preparation of Hemoglobin Solutions-Dog blood was obtained 51
by guest on Decem
ber 14, 2014http://w
ww
.jbc.org/D
ownloaded from

52 Spectrophotometry of HbNO and SHb
by cardiac puncture from normal, unfed animals. It was defibri- nated. The serum was separated by centrifuging and the cells were washed three times with about 4 volumes of 0.9 per cent saline. The washed erythrocytes were hemolyzed by the addi- tion of enough distilled water to make 10 times the original volume of blood employed. This solution was filtered to remove cell debris. It was kept on ice and was not used longer than for a period of 4 days. From the 1: 10 stock solution the more dilute solutions (1: 50 or 1: 100) were prepared.
N&lion-In our absorption curves e values are plotted both against wave-length, X, in ml, and wave number, Y, which may bc defined as the frequency per cm. (5) and which is the reciprocal of X expressed in centimeters (V = l/(X in rnp X lo-‘)). Although most spectrometers aie calibrated in terms of X, v is more useful in the interpretation of spectroscopic data (6).
Our extinction coefficients, E, are qualified by the concentration of pigment, c, expressed in mM per liter where 1 M indicates 1 mole of porphyrin, which for hemoglobin is equivalent to 1 gm. atomic weight of Fe or 1 mole of 02 capacity. Standard values are given as ~(c = 1 mM per liter), obtained from the equation
e(c = 1 maf per liter) = Eobserved
&depth),,. X c(actual concentration in mrd per liter)
e values at standard concentrations are far more useful than the archaic absorption constant A = E/E. The use of molar units for c permits ready comparison of the absorption spectra of all deriva- tives and relatives of hemoglobin.
For comparison with Table III of our earlier paper (1) t(c = 1 mM per liter) = 1/60A = 167/(A X 104). In Fig. 1 of that paper the ordinates designated as l/A are actually l/(A X 10’). For convenience we have introduced at the right of our graphs a scale
of E(C = 1 gm. Hb per 100 cc.) = k7 e(c = 1 mM per liter).
Quantitative Estimation of Pigment Concentration-Total pigment was determined by measuring the absorption of cyanmethemo- globin (cyanhemoglobin), MHbCN, prepared from suitable aliquots by the addition of K3Fc(CN)e to a final concentration of 0.6 mM per liter and KCN to a concentration of 0.8 mM per liter, the pigment concentration being of the order of 0.1 to 0.2 rnM per
by guest on Decem
ber 14, 2014http://w
ww
.jbc.org/D
ownloaded from

D. L. Drabkin and J. H. Austin 53
liter. The constants for MHbCN which were utilized in this determination are: B(C = 1 mM per liter) = 11.1 at X 551, 11.5 at X 545, and 11.5 at X 540 rnp (1). At these wave-lengths the molar extinction coefficient of KaFe(CN)a has an average value of only 0.28 (r(c = 1 mM per liter) = 0.00028) ; the absorption of KdFe(CN)s in this spectral region is even less. Hence no correction was made for the absorption of ferri- or ferrocyanide. The use of the absorp- tion of MHbCN as a standard of reference has the following advan- tages. We have attained a higher precision of measurement of hemoglobin spectrophotometrically (1) than by gasometric tech- nique. It is the most direct procedure, and avoids such highly questionable practices as the estimation of total pigment colori- metrically as a basis for absorption constants (7). MHbCN is an ideal pigment for. the determination of total concentration. Hb, HbOz, HbCO, HbNO (Fig. 2), and MHb are all readily convertible into MHbCN. Within fairly wide limits (Fig. 1) pH does not influence the conversion or the spectrum, and the characteristic absorption of MHbCN is maximal in the region of greatest visual sensitivity.
Very recently Brooks (8) published her conclusion “that the absorption curve for cyanhemoglobin was identical with that for oxyhemoglobin.” She apparently studied mixtures rather than single pigment derivatives and drew her conclusion from a con- sideration of measurements at only two wave-lengths, calculating the ratio of extinction coefficients at X 560 and X 540 rnl.c. The use of extinction ratios at two points in the spectrum has been advo- cated as a guide to the detection of impurities in HbOz and not for the identification of pigments. Consideration of the shape of the entire spectrophotometric curves of HbOz and MHbCN (Fig. l), in fact so different in their character, would, we believe, have led her to a different conclusion.
Preparation of HbNO and SHb-In the preparation of HbNO the absence of oxygen (to avoid the formation of higher oxides of NJ was insured by the use of reduced hemoglobin solutions and exposure to NO in an atmosphere of nitrogen. Washed defibri- nated dog erythrocytes were hemolyzed in water to 10 times the volume of the initial blood and filtered. 20 cc. of this solution + 20 cc. of 133 mM per liter of phosphate buffer (pH 7.0) were diluted to 100 cc. The diluted solution was repeatedly evacuated in a
by guest on Decem
ber 14, 2014http://w
ww
.jbc.org/D
ownloaded from
54 Spectrophotometry of HbNO and SHb
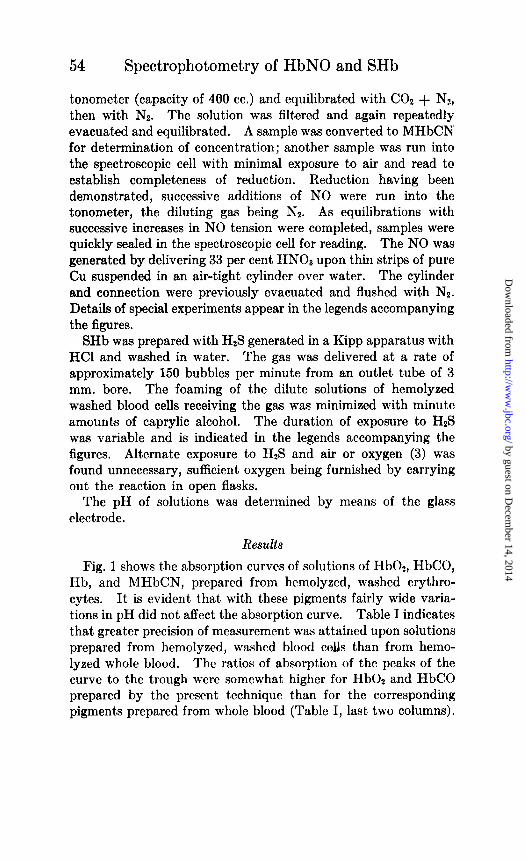
tonometer (capacity of 400 cc.) and equilibrated with CO2 + Ns, then with Nz. The solution was filtered and again repeatedly evacuated and equilibrated. A sample was converted to MHbCN for determination of concentration; another sample was run into the spectroscopic cell with minimal exposure to air and read to establish completeness of reduction. Reduction having been demonstrated, successive additions of NO were run into the tonometer, the diluting gas being Nz. As equilibrations with successive increases in NO tension were completed, samples were quickly sealed in the spectroscopic cell for reading. The NO was generated by delivering 33 per cent HNOS upon thin strips of pure Cu suspended in an air-tight cylinder over water. The cylinder and connection were previously evacuated and flushed with Nz. Details of special experiments appear in the legends accompanying the figures.
SHb was prepared with HzS generated in a Kipp apparatus with HCI and washed in water. The gas was delivered at a rate of approximately 150 bubbles per minute from an outlet tube of 3 mm. bore. The foaming of the dilut,e solutions of hemolyzed washed blood cells receiving the gas was minimized with minute amounts of caprylic alcohol. The duration of exposure to H& was variable and is indicated in the legends accompanying the figures. Alternate exposure to HzS and air or oxygen (3) was found unnecessary, sufficient oxygen being furnished by carrying out the reaction in open flasks.
The pH of solutions was determined by means of the glass electrode.
Results
Fig. 1 shows t,he absorption curves of solutions of HbOt, HbCO, Hb, and MHbCN, prepared from hemolyzcd, washed erythro- cytes. It is evident that with these pigments fairly wide varia- tions in pH did not affect the absorption curve. Table I indicates that greater precision of mea,surement was attained upon solutions prepared from hemolyzed, washed blood cells than from hemo- lyzed whole blood. The ratios of absorption of the peaks of the curve to the trough were somewhat higher for HbOz and HbCO prepared by the present technique than for the corresponding pigments prepared from whole blood (Table I, last two columns).
by guest on Decem
ber 14, 2014http://w
ww
.jbc.org/D
ownloaded from

D. L. Drabkin and J. H. Austin 55
The differences in the two sets of preparations are most probably related to physical factors such as very slight turbidity, unavoid-
vx, p” 16 17 16 19 20
FIQ. 1. Absorption curves of HbOz, HbCO, Hb, and MHbCN, cross- hatched to show the spread of the determinations. Curve 1 represents HbOr (eight solutions) 0.070 to 0.205 rnrd per liter, buffers 33 mM per liter of phosphate, 25 my per liter of borate (two unbuffered solutions), pH 5.9 to 9.2; Curve 2, HbCO (six solutions) 0.0942 to 0.205 mM per liter, buffers 33 mM per liter of phosphate, 10 to 27 mru per liter of borate (one unbuffered solution and one with 100 rnM per liter of NH,OH), pH 5.9 to 11.0; Curve 3, Hb (seven solutions) 0.107 to 0.205 mht per liter, buffers 13 to 27 mM per liter of phosphate, 24 mM per liter of borate (two unbufferedsolutions), pH 4.5 to 9.2. Reduction was by evacuation in one solution, in the others with Nan&O,, 4 mM per liter; Curve 4, MHbCN (seven solutions) 0.113 to 0.205 mM per liter, buffers 15 to 33 mM per liter of phosphate, 11 to 25 mM per liter of borate (one unbuffered solution), pH 5.9 to 9.2. KaFe(CN)e 0.8 to 0.9 rnrc per liter and KCN 0.7 to 0.8 mM per liter.
able when whole blood is used. It is well recognized that lower ratios for Hb02 will be obtained when MHb is present, but it is
by guest on Decem
ber 14, 2014http://w
ww
.jbc.org/D
ownloaded from

3 .I
a 5 s %
is 2 x - - -
w
HbOt A 17 175 160 t40
‘I B 8 i75 I60 I40
HbCO A 16 69 158 I39
‘I B 6 69 158 ,551 I39
Hb ‘I 7 160 155 150
MHbCN ‘, 7 151 A5 A0 -
dC - 1 no4 per liter) Ratio, c/4
56 Spectrophotometry of HbNO and SHb
TABS I Precision of Measurement of Absorption Constants
-
15.79 16.7 15.3 1.4 0.31 f 0.05 1.67 9.43 10.2 9.0 1.2 0.26 f 0.04
15.29 16.5 14.8 1.7 0.38 f 0.07 L5.13 15.2615.06 0.200.07 f 0.02 1.73 8.73 8.95 8.56 0.390.13 f 0.03 14.62 14.7014.52 0.180.06 f 0.01 L4.71 15.4813.22 2.260.48 zk 0.08 1.22 L2.09 12.5011.80 0.700.29 f 0.05 14.83 15.6413.31 2.330.49 f 0.09 14.39 14.5414.08 0.460.16 f 0.05 1.23 11.81 11.9211.70 0.220.08 f 0.02 11.70 11.7411.65 0.090.05 f 0.02 14.77 14.8214.69 0.130.05 Z!Z 0.01 13.24 13.5113.00 0.510.21 i 0.06 13.50 13.6613.28 0.380.14 f 0.04 13.28 13.4513.12 0.330.12 i 0.03 ll.1011 11.2810.97 0.310.10 f 0.03 11.521) 11.60 11.40 0.200.08 i 0.02 11.531111.63 11 .h 0.160.05 i 0.01
1.62
1.68
1.23
1.26
* Solutions prepared from hemolyzed, whole dog blood are listed as Source A, those prepared from hemolyzed, washed dog erythrocytes, as Source B.
t The figures after the i represent the standard error of the standard deviation.
$ Ratios of extinction coefficients at the maxima of absorption to the minimum between the two bands.
8 Only three determinations at this wave-length were made. 11 The average constants have been assumed on the basis of our earlier
work (1) so that only the spread of determinations is of significance in the case of this pigment.
not justifiable to conclude (9) that admixture with the oxidized form of hemoglobin is the sole cause of this phenomenon. The reasons for this will be made more apparent in two of the follow.- ing papers.
by guest on Decem
ber 14, 2014http://w
ww
.jbc.org/D
ownloaded from
D. L. Drabkin and J. H. Austin 57
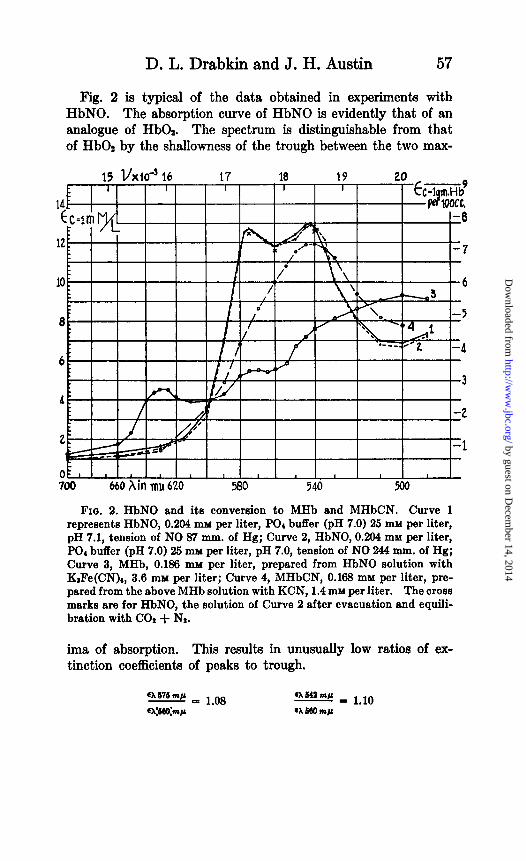
Fig. 2 is typical of the data obtained in experiments with HbNO. The absorption curve of HbNO is evidently that of an analogue of HbOz. The spectrum is distinguishable from that of HbOa by the shallowness of the trough between the two max-
15 l/x10-’ 16 17 18 19 20 I ‘I
I I I 1 b m.Hb9
I PJ WOCC.
l-8
I I I
I-7
10 6
8 5
FIQ. 2. HbNO and ita conversion to MHb and MHbCN. Curve 1 represents HbNO, 0.264 rnlld per liter, PO, buffer (pH 7.0) 25 rnlld per liter, pH 7.1, tension of NO 87 mm. of Hg; Curve 2, HbNO, 0.264 mru per liter, PO, buffer (pH 7.0) 25 my per liter, pH 7.0, tension of NO 24.4 mm. of Hg; Curve 3, MHb, 0.136 mM per liter, prepared from HbNO solution with KsFe(CN)8, 3.6 mM per liter; Curve 4, MHbCN, 0.163 mM per liter, pre- pared from the above MHb solution with KCN, 1.4 my per liter. The croea marks are for HbNO, the solution of Curve 2 after evacuation and equili- bration with CO* + Nt.
ima of absorption. This results in unusually low ratios of ex- tinction coefficients of peaks to trough.
by guest on Decem
ber 14, 2014http://w
ww
.jbc.org/D
ownloaded from
58 Spectrophotometry of HbNO and SHb
15 lj~lo-~ 16 17 18 19 20 I
I ‘I I ’ I I ’ I I 1
1 ~c=lom.Hb XC.
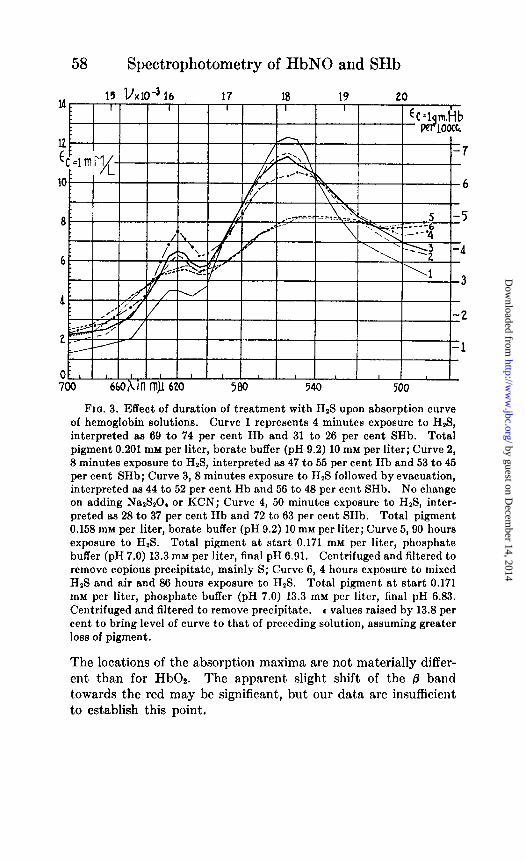
FM. 3. Effect of duration of treatment with HB upon absorption curve of hemoglobin solutions. Curve 1 represents 4 minutes exposure to I-I& interpreted aa 69 to 74 per cent Hb and 31 to 26 per cent SHb. Total pigment 0.201 mM per liter, borate buffer (pH 9.2) 10 rnrd per liter; Curve 2, 8 minutes exposure to H& interpreted as 47 to 55 per cent Hb and 53 to 45 per cent SHb; Curve 3,8 minutes exposure to H,S followed by evacuation, interpreted aa 44 to 52 per cent Hb and 56 to 48 per cent SHb. No change on adding NazSzO, or KCN; Curve 4, 50 minutes exposure to H2S, inter- preted as 28 to 37 per cent Hb and 72 to 63 per cent SHb. Total pigment 0.158 mM per liter, borate buffer (pH 9.2) 10 mM per liter; Curve 5,90 hours exposure to HIS. Total pigment at start 0.171 mM per liter, phosphate buffer (pH 7.0) 13.3 rnrd per liter, final pH 6.91. Centrifuged and filtered to remove copious precipitate, mainly S; Curve 6, 4 hours exposure to mixed H&S and air and 86 hours exposure to H&G. Total pigment at start 0.171 mM per liter, phosphate buffer (pH 7.0) 13.3 mM per liter, final pH 6.83. Centrifuged and filtered to remove precipitate. l values raised by 13.8 per cent to bring level of curve to that of preceding solution, assuming greater loss of pigment.
The locations of the absorption maxima are not materially differ- ent than for HbOz. The apparent slight shift of the /3 band towards the red may be significant, but our data are insufficient to establish this point.
by guest on Decem
ber 14, 2014http://w
ww
.jbc.org/D
ownloaded from
D. L. Drabkin and J. H. Austin 59
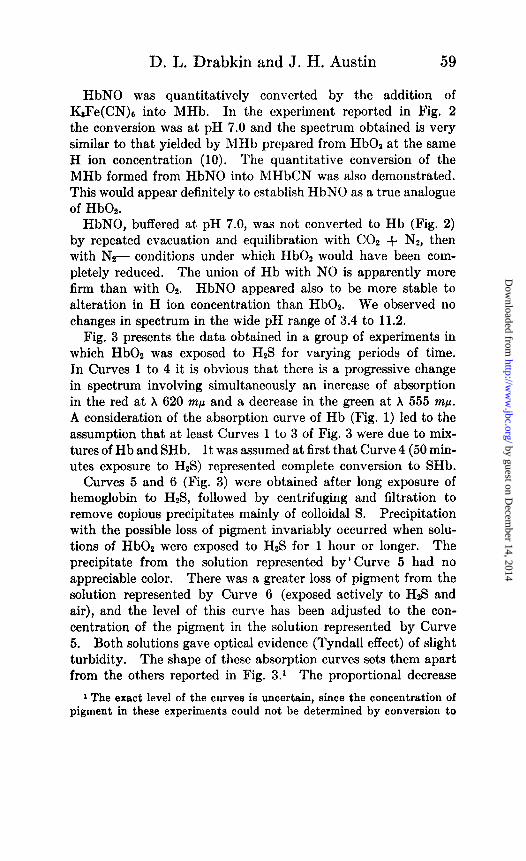
HbNO was quantitatively converted by the addition of KsFe(CN)e into MHb. In the experiment reported in Fig. 2 the conversion was at pH 7.0 and the spectrum obtained is very similar to that yielded by MHb prepared from HbOl at the same H ion concentration (10). The quantitative conversion of the MHb formed from HbNO into MHbCN was also demonstrated. This would appear definitely to establish HbNO as a true analogue of HbOz.
HbNO, buffered at pH 7.0, was not converted to Hb (Fig. 2) by repeated evacuation and equilibration with CO2 + Nz, then with Nz- conditions under which HbO, would have been com- pletely reduced. The union of Hb with NO is apparently more firm than with 02. HbNO appeared also to be more stable to alteration in H ion concentration than HbOz. We observed no changes in spectrum in the wide pH range of 3.4 to 11.2.
Fig. 3 presents the data obtained in a group of experiments in which HbOz was exposed to H,S for varying periods of time. In Curves 1 to 4 it is obvious that there is a progressive change in spectrum involving simultaneously an increase of absorption in the red at X 620 rnp and a decrease in the green at X 555 mp. A consideration of the absorption curve of Hb (Fig. 1) led to the assumption that at least Curves 1 to 3 of Fig. 3 were due to mix- tures of Hb and SHb. It was assumed at first that Curve 4 (50 min- utes exposure to HZS) represented complete conversion to SHb.
Curves 5 and 6 (Fig. 3) were obtained after long exposure of hemoglobin to H& followed by centrifuging and filtration to remove copious precipitates mainly of colloidal S. Precipitation with the possible loss of pigment invariably occurred when solu- tions of HbOs were exposed to H& for 1 hour or longer. The precipitate from the solution represented by’curve 5 had no appreciable color. There was a greater loss of pigment from the solution represented by Curve 6 (exposed actively to H&! and air), and the level of this curve has been adjusted to the con- centration of the pigment in the solution represented by Curve 5. Both solutions gave optical evidence (Tyndall effect) of slight turbidity. The shape of these absorption curves sets them apart from the others reported in Fig. 3.’ The proportional decrease
1 The exact level of the curves is uncertain, since the concentration of pigment in these experiments could not be determined by conversion to
by guest on Decem
ber 14, 2014http://w
ww
.jbc.org/D
ownloaded from
60 Spectrophotometry of HbNO and SHb
in the two maxima of absorption in comparison with Curve 4 and a relative increase in absorption at the red and blue ends of the spectrum could be due to a combination of the factors of loss of pigment and presence of turbidity. This explanation, however, demands a greater loss of pigment than appears to have actually taken place and does not account for the shift of the absorption maxima towards the blue. It is, therefore, also probable that, after long exposure to HnS, secondary pigment changes may have occurred. We believe that Haurowitz’s SHb studies (3) may be interpreted in a similar manner. Our curves are not inconsistent with the changes in spectrum which would occur were appreciable amounts of a hem&like derivative (11) produced.
Examples of the absorption spectra yielded by the hemolyzed blood of a patient with clinical sulfhemoglobinemia* as well as of specially prepared control mixtures of normal HbO2 treated with a solution of H&Z? are presented in Fig. 4 (Curves 1 and 2). It is evident that these curves are similar. However, when we constructed theoretical curves of mixtures of Hb02 and SHb, assuming that Curve 4 of Fig. 3 (repeated in Fig. 4 for conven- ience) was pure SHb, we failed to get any curve the shape of which resembled the curves yielded by the pathological blood and the control blood treated with H2S water. This led us to the conclusion that Curve 4, like Curves 1 to 3 in Fig. 3, was that of a mixture of Hb and SHb. This curve represented the max- imum conversion to SHb attained in our experiments before precipi- tation and perhaps other changes occurred.
The absorption spectrum of SHb (Curve 4, Fig. 4) has been deduced mathematically from the data at four wave-lengths, X 620, X 575, X 560, and X 540 mp, for Curves 1 to 4 in Fig. 3. The underlying assumption was that these curves represented a
MHbCN. The addition of KCN alone produced no change in spectrum, while the addition of KsFe(CN)s resulted in the precipitation of highly pigmented material.
* The patient had chronic acetanilide poisoning, in this respect resem- bling one of the patients described by Harrop (4). Solutions prepared from the blood showed spectroscopically the usual bands of HbOl and besides a band at X 620 rnp. Most of the pigment in the blood was convertible into Hb by means of Na&O, and into MHbCN by the addition of K,Fe(CN)s and KCN, but the band in the red persisted unaltered in strength in each case.
by guest on Decem
ber 14, 2014http://w
ww
.jbc.org/D
ownloaded from

D. L. Drabkin and J. H. Austin 61
progressive change from Hb to SHb. We determined by suc- cessive approximations the values for the concentration of Hb (cm,) and SHb (1 -cm,) for each of the four solutions and the
8 t I I I I I
: ._ 4 6
3 I
/
i -‘i I I I! -2 3' //
A, , - .N ’ -1
1 I I I I I t I 700 660 hin my 620 580 540 500
FIQ. 4. Absorption spectrum of blood of a patient with clinical sulf- hemoglobinemia and our extrapolated spectrum of pure SHb. Curve 1 represents pathological blood. Total pigment 0.141 rnM per liter, HbO, 0.124 to 0.126 mru per liter, SHb 0.015 to 0.017 mru per liter; Curve 2, control from normal human blood treated with HZS. Total pigment 0.226 mM per liter, as determined both upon original HbOl and after conversion, HbOg 0.192 to 0.196 mM per liter, SHb 0.030 to 0.035 mru per liter. Prepared by adding 0.1 cc. of a saturated aqueous solution of H&S to 5 cc. of dilute solu- tion of hemolyzed washed erythrocytes; Curve 3, Hb + SHb, same as Curve 4, Fig. 3; Curve 4, extrapolated spectrum of SHb (see text). Cross- hatched areas indicate zone of uncertainty.
absorption constants of SHb (~nr,) at the four chosen wave- lengths which satisfied best sixteen equations which can be set up under these circumstances. The equations were of the form
CHb x 6Hb + (1 - CHb) x WHb - %bserved = 0
by guest on Decem
ber 14, 2014http://w
ww
.jbc.org/D
ownloaded from
62 Spectrophotometry of HbNO and SHb
26 15 Vxlo-316 17 18 19 20 I I I I I ‘fgg m.H)e -
T wwocc. !5 14
6 4
3 4
2 2 1
0 700 66OXin mj.1620 580 540
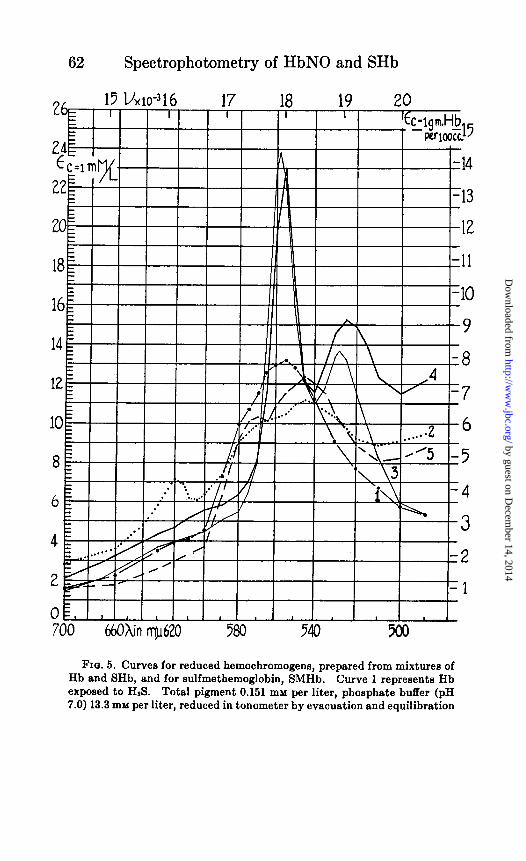
FIQ. 5. Curves for reduced hemochromogens, prepared from mixtures of Hb and SHb, and for sulfmethemoglobin, SMHb. Curve 1 represents Hb exposed to HS. Total pigment 0.151 mu per liter, phosphate buffer (pH 7.0) 13.3 mM per liter, reduced in tonometer by evacuation and equilibration
by guest on Decem
ber 14, 2014http://w
ww
.jbc.org/D
ownloaded from

D. L. Drabkin and J. H. Austin 63
The sixteen equations contained eight unknowns. The data per- mitted each of the unknowns to be evaluated within certain limits. The Esnb values so obtained were used to plot our deduced spectrum of pure SHb, the cross-hatched areas indicating the limits of the approximation. Proof of the validity of our assump- tions was furnished by the ability to construct theoretical curves of mixtures of HbOz and SHb or of Hb and SHb which agreed excellently with the observed spectra from the patient’s blood, both before and after the addition of Na&Od, and with normal hemolyzed blood treated with a solution of H&S. The percentage composition of the mixtures of pigments which appear in the leg- ends of Fig. 3 and 4 and the total pigment concentration of the clinical case were calculated from the absorption data of HbOz and Hb (Fig. 1) and of SHb (Fig. 4). This is, we believe, the first time that quantitative estimation of sulfhemoglobin concen- tration in a clinical case has been accomplished.
No consistent changes in the absorption spectra of mixtures of Hb and SHb took place with variations in pH from 6.2 to 10.4. It is of interest, however, that solutions of hemoglobin t,hrough which HzS was bubbled became somewhat more acid. The acidity of HiS (K1 = 9.0 X lo-lo) may partly account for a marked drop in pH, 9.2 to 6.7, observed in solutions buffered with Na2B,O,. This explanation, however, cannot be applied to a slight though consistent lowering of pH, 7.0 to 6.33 and 7.0 to 6.23, of solutions buffered with phosphate. The possibility that acid wss produced by the oxidation of H2S must be con- sidered.
with CO1 + Nz, then with N,, equilibrated with pure HIS in tonometer, transferred to cell with minimal exposure to air, and read; Curve 2, Hb + SHb, preceding solution after exposure to air; Curve 3, reduced hemo- chromogen. Total pigment 0.087 mM per liter, borate buffer (pH 9.2) 5 mM per liter, exposed to H,S for 4 minutes, NaOH then added to 87 mM per liter, no change on adding Na&O~; Curve 4, reduced hemochromogen. Total pigment 0.101 rnM per liter, borate buffer (pH 9.2) 5 mM per liter, ex- posed to HIS for 4 minutes, pyridine added to 50 per cent, no change on adding Nan&O,; Curve 5, SMHb. Total pigment 0.151 mM per liter, trans- formed to MHb by addition of KsFe(CN)s, 0.158 mM per liter, phosphate buffer (pH 5.9) 7 mM per liter. The acid MHb was exposed to H&l for 5 seconds. An identical spectrum was obtained from MHbCN by treatment with HIS.
by guest on Decem
ber 14, 2014http://w
ww
.jbc.org/D
ownloaded from

64 Spectrophotometry of HbNO and SHb
Reduced hemoglobin was not converted to SHb upon exposure to H2S, unless O2 was available (Fig. 5, Curves 1 and 2). Mix- tures of Hb + SHb were converted to typical reduced hemo- chromogens (11) by the addition of pyridine or alkali in excess (Fig. 5, Curves 3 and 4). Conversion to reduced hemochromogen suggests that our preparations of SHb are in a reduced condition.
In confirmation of Keilin’s experiments (12) we have found that a characteristic pigment, which may be designated as sulf- methemoglobin (SMHb), was produced when MHb was exposed to HZ’S (Fig. 5, Curve 5). In these experiments it was important to avoid any excess of KaFe(CN)6 to insure against the precipita- tion of pigmented material which otherwise occurred. SMHb, in contrast to SHb (see Curve 3, Fig. 3), could be converted to its parent pigment. Upon exposure to air, reconversion of SMHb to MHb took place; the MHb so formed was convertible to typi- cal MHbCN upon the addition of KCN and to typical Hb upon the addition of Na&%04.
We have not found a suitable explanation for the need of 01 in t,he production of SHb from Hb. The formation of SHb did not occur in solutions of HbOz exposed to Son.
SUMMARY
The absorption spectra of HbOz, Hb, HbCO, and MHbCN yielded by solutions prepared from hemolyzed washed erythro- cytes have been presented. Such solutions have been found preferable for precise spectrophotomctric analysis rather than cor- responding preparations from hemolyzed whole blood.
The absorption spectrum of HbNO was obtained under condi- tions which excluded the presence of 02. The conversion of this pigment to MHb has been demonstrated. HbNO is probably a relatively stable analogue of HbOz.
Data have been presented which indicate that the absorption spectrum of pure SHb probably has not been described heretofore. The absorption curve of this pigment has been extrapolated from our data upon mixtures of Hb + SHb. For the first time the quantitative estimation of SHb in the blood of a patient with clinical sulfhemoglobinemia has been accomplished. SHb was formed from Hb only in the presence of oxygen. The pigment was not convertible to Hb or MHbCN, but was readily changed
by guest on Decem
ber 14, 2014http://w
ww
.jbc.org/D
ownloaded from

D. L. Drabkin and J. H. Austin 65
into typical hemochromogens. Solutions of Hb increase in acidity upon exposure to H&3.
SMHb, a characteristic pigment described by Keilin (12), was obtained from MHb by treatment with H&3. A pigment yielding the spectrum of SMHb was obtained also by the exposure of MHbCN to HrS.
BIBLIOCXUPHY
1. Drabkin, D. L., and Austin, J. H., J. Biol. Chem., Q8, 719 (1932). 2. Haurowitz, F., 2. phgsiol. Chem., 136,63 (1924). Haldane, J., Mekgill,
R. H., and Mavrogordato, A. E., J. Phyeiol., 21, 160 (1897). 3. Haurowits, F., 2. phyuiot. Chem., 161, 130 (1920). 4. Clarke, T. W., and Hartley, W. H., J. Phyeiol., 86, 62 (lQO74N3). Van
Lier, H. W., Over de Parhaemoglobinaemieen, Utrecht, 61 (1933). Hariop, G. A., Jr., Internat. Clin., 636 (1931).
5. Birge, R. T., in Washburn, E. W., International critical tables of numerical data, physics, chemistry and technology, New York, 6, 409 (1929).
6. Walsh, J. W. T., Photometry, New York, 18, 460 (1926). Zeeman, P., in Washburn, E. W., International critical tables of numerical data, physics, chemistry and technology, New York, 6,418 (1929).
7. Ray, G. B., and Isaac, L. A., J. Biol. Chem., 86,549 (192930). 8. Brooks, M. M., Proe. Sot. Ezp. Biol. andMe& 32, 1113 (1935). 9. Winegarden, H. M., and Bomook, H., J. Cell. and Comp. Phyeiol., 8,
437 (1933). 10. Austin, J. II., and Drabkin, D. L., J. Biol. Chem., 112,67 (1935-36). 11. Drabkin, D. L., and Austin, J. H., J. Biol. Chem., 112,89 (1936-36). 12. Keilin, D., Proc. Roy. Sot. London, Series B, 118,393 (1933).
by guest on Decem
ber 14, 2014http://w
ww
.jbc.org/D
ownloaded from


![[ITDG] BIOL](https://img.dokumen.tips/doc/110x75/5571fcdd49795991699815b6/itdg-biol.jpg)