Embed Size (px)
Citation preview

IVUS-VH & IVUS-VH & Vulnerable PlaqueVulnerable Plaque
IVUS-VH & IVUS-VH & Vulnerable PlaqueVulnerable Plaque
Jang-Ho Bae, MD., PhD.Jang-Ho Bae, MD., PhD.Heart CenterHeart Center
Konyang University HospitalKonyang University HospitalDaejeon City, S. KoreaDaejeon City, S. Korea

CAG 2004.9.2CAG 2004.9.2 Case (48/M), STEMI (ant)
CAG 2004.9.2CAG 2004.9.2 Case (48/M), STEMI (ant)
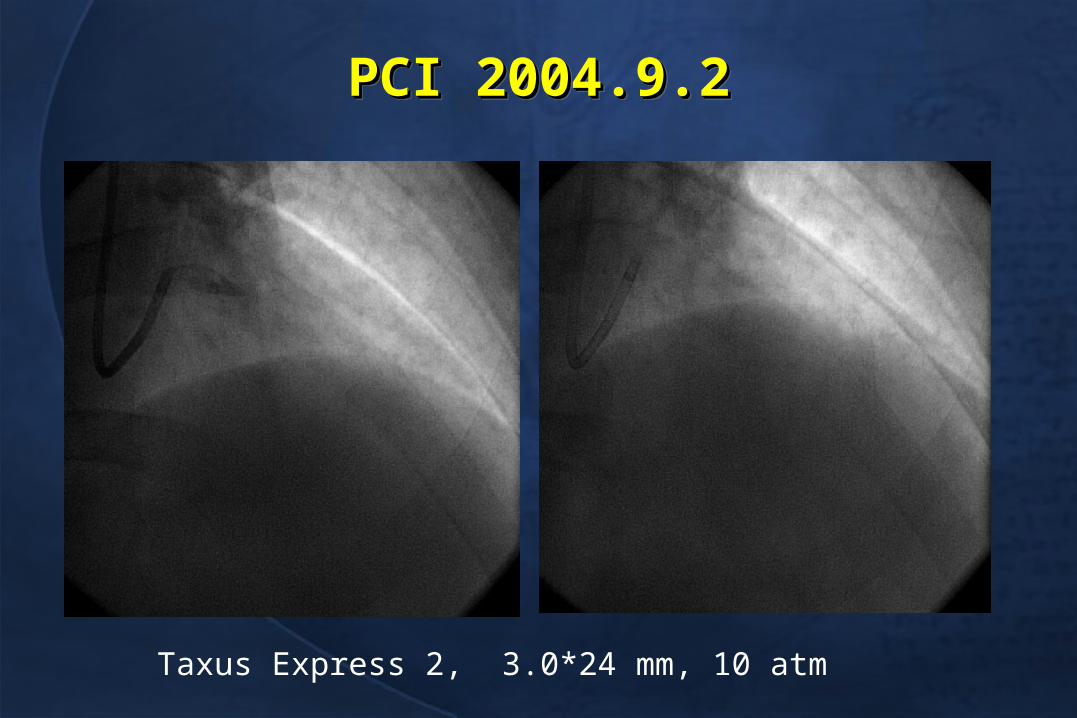
PCI 2004.9.2PCI 2004.9.2PCI 2004.9.2PCI 2004.9.2
Taxus Express 2, 3.0*24 mm, 10 atm

6 months FU CAG (2005.3.21)6 months FU CAG (2005.3.21)6 months FU CAG (2005.3.21)6 months FU CAG (2005.3.21)

STEMI at 27 months (2006.12.14)STEMI at 27 months (2006.12.14)STEMI at 27 months (2006.12.14)STEMI at 27 months (2006.12.14)
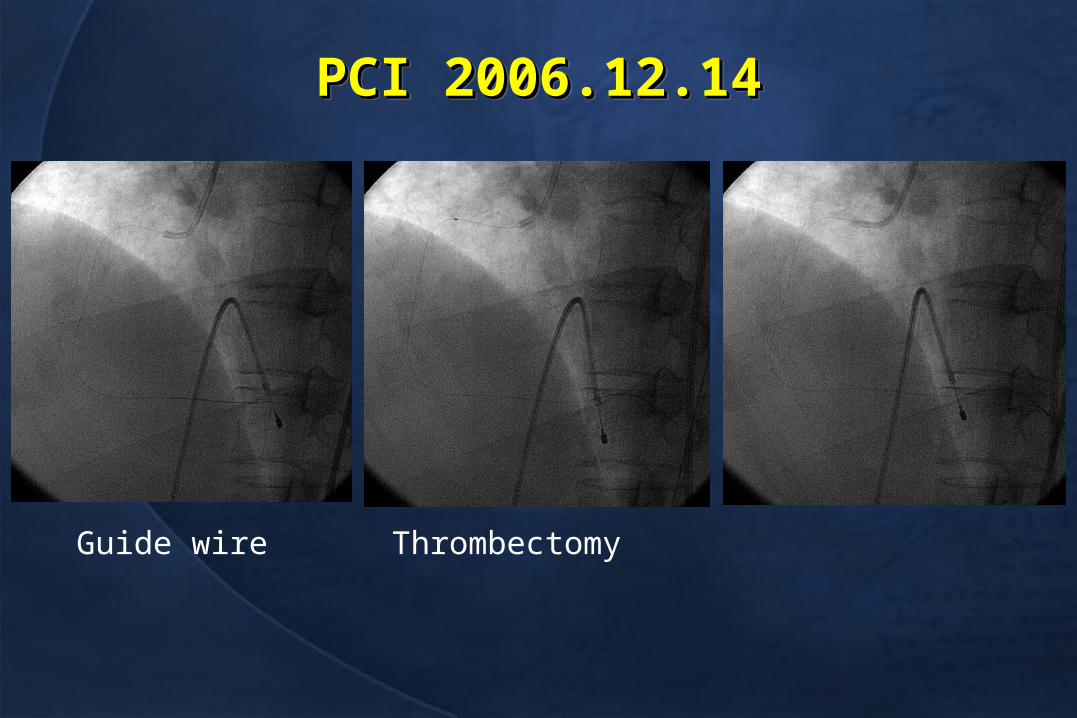
PCI 2006.12.14PCI 2006.12.14PCI 2006.12.14PCI 2006.12.14
Guide wire Thrombectomy

Lumen volume Lumen volume 394.0 mm394.0 mm33
Vessel volume Vessel volume 959.5 mm959.5 mm33
Plaque Volume Plaque Volume 565.5 mm565.5 mm33
Segment lengthSegment length 33.9 mm 33.9 mm
Fibrous volume Fibrous volume 257.1 mm257.1 mm33 63% 63%Fibro-fatty volume Fibro-fatty volume 50.8 mm 50.8 mm33 12% 12%Dense-calcium volume Dense-calcium volume 25.7 mm 25.7 mm33 5%5%Necrotic-core volume Necrotic-core volume 77.8 mm 77.8 mm33 19% 19%

ContentsContentsContentsContents
1.1. VP & TCFAVP & TCFA
2.2. Fate of VP / intermediate lesionFate of VP / intermediate lesion
3.3. Konyang experience with VPKonyang experience with VP
1.1. VP & TCFAVP & TCFA
2.2. Fate of VP / intermediate lesionFate of VP / intermediate lesion
3.3. Konyang experience with VPKonyang experience with VP

Underlying Pathologies of Culprit Coronary Lesions Underlying Pathologies of Culprit Coronary Lesions (thrombotic coronary death and ACS)(thrombotic coronary death and ACS)
Ruptured plaques (~70%) Stenotic (~20%) Nonstenotic (~50%)
Nonruptured plaques (~30%) Erosion Calcified nodule Others/Unknown
Naghavi M. et al. Circulation 2003;108:1772-8

Vulnerable PlaqueVulnerable PlaqueVulnerable PlaqueVulnerable Plaque
• Lesions are likely to ruptureLesions are likely to rupture
• Lesions composed of a lipid-rich Lesions composed of a lipid-rich core in the central portion of an core in the central portion of an eccentric plaque with a thin eccentric plaque with a thin friable capfriable cap
• Lesions are likely to ruptureLesions are likely to rupture
• Lesions composed of a lipid-rich Lesions composed of a lipid-rich core in the central portion of an core in the central portion of an eccentric plaque with a thin eccentric plaque with a thin friable capfriable cap
Muller et al. Ann Epidemiol 1992Muller et al. Ann Epidemiol 1992
Libby et al. Circulation1995Libby et al. Circulation1995

Pathologic Definition of VPPathologic Definition of VPIt can not be detectable in clinical practiceIt can not be detectable in clinical practice
Major criteriaMajor criteria• Active inflammation Active inflammation (monocyte/macrophage and sometimes T-cell infiltration)(monocyte/macrophage and sometimes T-cell infiltration)• Thin cap with large lipid coreThin cap with large lipid core• Endothelial denudation with superficial platelet aggregationEndothelial denudation with superficial platelet aggregation• Fissured plaqueFissured plaque• Stenosis > 90% Stenosis > 90%
Minor criteriaMinor criteria• Superficial calcified noduleSuperficial calcified nodule• Glistening yellowGlistening yellow• Intraplaque hemorrhageIntraplaque hemorrhage• Endothelial dysfunctionEndothelial dysfunction• Outward (positive) remodeling Outward (positive) remodeling
Naghavi et al. Circulation 2003;108:1664-72The Center of Vulnerable Plaque Research

70% of ACS 70% of ACS culprit lesionsculprit lesions
30% of ACS culprit lesions30% of ACS culprit lesions
Naghavi et al. Circulation 2003;108:1664-72Gossl M et al. Med Clin N Am 2007;91:573-601
“Vulnerable Plaque” = plaque not only prone to thrombosis/rupture but also at risk for
rapid progression
“Vulnerable Plaque” = plaque not only prone to thrombosis/rupture but also at risk for
rapid progression

Thin Cap Fibroatheroma (TCFA)Thin Cap Fibroatheroma (TCFA)
Lipid CoreFibrous Cap
Intimal Inflammation
• Most common type of VP• Lesion at risk for rupture• Lesion that most resembles the acute plaque rupture• Area narrowing <75% (diameter stenosis <50%) in over 75%
>10% area of the plaque3mm2 in 75% of caseLength; 2-17mm (mean 8mm)
<65 umMean cap thickness+2SDof ruptured plaque
Macrophage infiltration>25 cells/0.3mm diameter
Virmani R et al. J Interven Cardiol 2003;16:267-72Virmani R et al. JACC 2006;47:C13-8

Morphologic Variants of the TCFAMorphologic Variants of the TCFAMorphologic Variants of the TCFAMorphologic Variants of the TCFA
InsignificantInsignificantplaque burdenplaque burden
Large eccentricLarge eccentricnecrotic corenecrotic core
Large concentricLarge concentricnecrotic corenecrotic core
HealedHealedrupture(s)rupture(s)
Most common typeMost common type
Kolodgie FD et al. Curr Opin Cardiol 2001;16:285-92

New Methodologies to Detect VPNew Methodologies to Detect VP
1. MRI2. Coronary CT3. Conventional gray-scale IVUS4. Angiography5. OCT6. Thermography7. VH-IVUS8. NIR, …..

IVUS-RF Data AnalysisIVUS-RF Data AnalysisIVUS-RF Data AnalysisIVUS-RF Data Analysis
ROI lengthROI length480480uumm
LumenLumen
EEMEEM
ROI width=124 scan lines
64 samples along each line
(240 lines/frame)
1 IVUS scan line
Plaque Classification TreePlaque Classification TreeBased on 8 spectral parameterBased on 8 spectral parameter1.1. Maximum powerMaximum power2.2. Corresponding frequencyCorresponding frequency3.3. Minimal powerMinimal power4.4. Corresponding frequencyCorresponding frequency5.5. SlopeSlope6.6. Y-interceptY-intercept7.7. Mid-band fitMid-band fit8.8. Integrated backscatterIntegrated backscatter

Tissue CharacterizationTissue CharacterizationTissue CharacterizationTissue Characterization
MediaMedia
FibrousFibrous
FibrofattyFibrofatty
Dense calciumDense calcium
Necrotic coreNecrotic core
Densely packed Densely packed collagencollagen
Significant lipid Significant lipid in collagenin collagen
Calcium withoutCalcium withoutnecrosisnecrosis
Cholesterol cleft,Cholesterol cleft,foam cells,foam cells,microcalcificationmicrocalcification
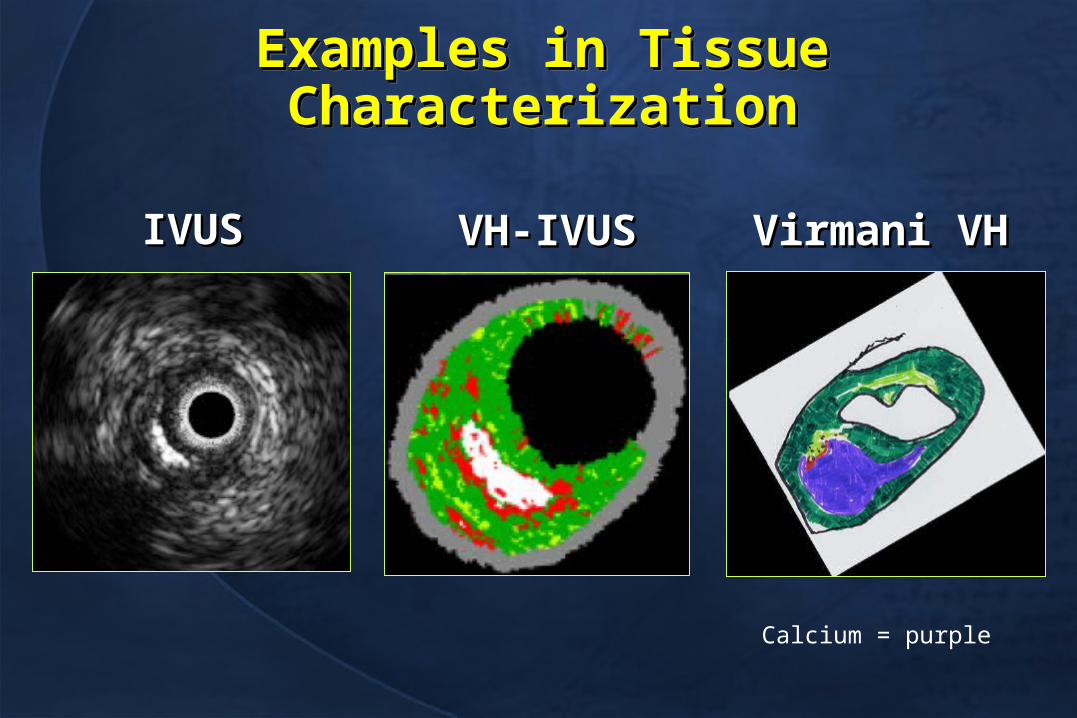
IVUSIVUS VH-IVUSVH-IVUS Virmani VHVirmani VH
Calcium = purple
Examples in Tissue CharacterizationExamples in Tissue CharacterizationExamples in Tissue CharacterizationExamples in Tissue Characterization
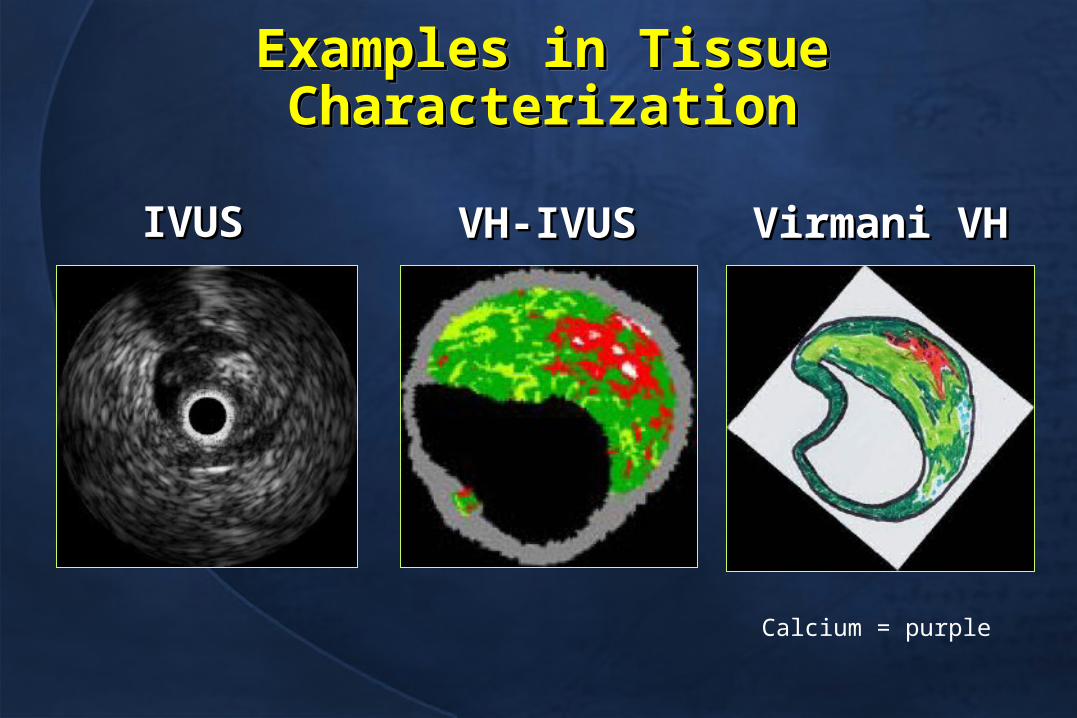
IVUSIVUS VH-IVUSVH-IVUS Virmani VHVirmani VH
Calcium = purple
Examples in Tissue CharacterizationExamples in Tissue CharacterizationExamples in Tissue CharacterizationExamples in Tissue Characterization

Predictive Accuracies of VH-IVUSPredictive Accuracies of VH-IVUSPredictive Accuracies of VH-IVUSPredictive Accuracies of VH-IVUS
FibrousFibrous
FibrofattyFibrofatty
CalcifiedCalcified
Necrotic coreNecrotic core
11stst version versionex vivoex vivo79.7%79.7%
81.2%81.2%
92.8%92.8%
85.5%85.5%
2nd version2nd versionin vivo (DCA)in vivo (DCA)
87.1%87.1%
87.1%87.1%
96.5%96.5%
88.3%88.3%
Nasu K. J Am Coll Cardiol 2006;47:2405-12
Nair A. EuroInterv 2007;3:113-120
Histology vs. RF data in gray IVUSHistology vs. RF data in gray IVUS
2nd version2nd versionex vivoex vivo93.5%93.5%
94.1%94.1%
95.8%95.8%
96.7%96.7%
Histology vs. VH-IVUSHistology vs. VH-IVUS
Nair A. Circulation 2002;106:2200-6

Gray scale IVUS vs. VH-IVUSGray scale IVUS vs. VH-IVUS

Lesion ClassificationLesion ClassificationPathological intimal thickeningPathological intimal thickening Fibrocalcific lesionFibrocalcific lesion
Fibrous cap atheromaFibrous cap atheroma Thin-cap fibroatheromaThin-cap fibroatheroma
In at least 3 consecutive frames & PAV 40%In at least 3 consecutive frames & PAV 40%Rodriguez-Granillo et al. Heart 2006;92:388-91

Cap thickness of TCFACap thickness of TCFACap thickness of TCFACap thickness of TCFA
Axial resolution of IVUS-VH; 100-Axial resolution of IVUS-VH; 100-150150uum m
6565uum; based on autopsy and data of m; based on autopsy and data of already ruptured plaquealready ruptured plaque
Cap thickness <250Cap thickness <250uum dramatically m dramatically increases peak circumferential increases peak circumferential stress in the plaquestress in the plaque
Virmani R et al. J Interven Cardiol 2003;16:267-72Schaar JA et al. Circulation 2003;108:2636-41

ContentsContentsContentsContents
1.1. Definition of VPDefinition of VP
2.2. Fate of VP / intermediate lesionFate of VP / intermediate lesion
3.3. Konyang experience with VPKonyang experience with VP
1.1. Definition of VPDefinition of VP
2.2. Fate of VP / intermediate lesionFate of VP / intermediate lesion
3.3. Konyang experience with VPKonyang experience with VP

Case (45/M), SACase (45/M), SACase (45/M), SACase (45/M), SA

1 2 3 4 5
Distal Ref.Proximal Ref.
EEM CSA = 17.6Lumen CSA = 4.1 ~ 4.3Lumen CSA = 4.1 ~ 4.3P+M CSA = 13.1Max Lumen dia = 2.5MLD = 2.3Plaque burden = 74%
EEM CSA = 17.8Lumen CSA = 12.2Max Lumen dia = 4.2MLD = 3.7P+M CSA = 5.6Plaque burden = 0.32
EEM CSA = 14.4Lumen CSA = 8.9Max Lumen dia = 3.6MLD = 3.1P+M CSA = 5.5Plaque burden = 0.38
0 4 mm 10 mm 19 mm
1 2 3 4 5

Lumen Volume 174.9 mm3
EEL Volume 361.3 mm3 Plaque Volume 186.4 mm3 Segment Length 19.7 mm
Fibrous Volume 68.2 mm3 59%Fibro-Fatty volume 6.2 mm3 5%Dense Calcium Volume 11.7 mm3 10%Necrotic Core Volume 28.9 mm3 25%

Treatment in this patients ?Treatment in this patients ?Treatment in this patients ?Treatment in this patients ?
EEM CSA = 17.6Lumen CSA = 4.1 ~ 4.3Lumen CSA = 4.1 ~ 4.3P+M CSA = 13.1Max Lumen dia = 2.5MLD = 2.3Plaque burden = 74%
TCFATCFA
Fibrous Volume 68.2 mm3 59%Fibro-Fatty volume 6.2 mm3 5%Dense Calcium Volume 11.7 mm3 10%Necrotic Core Volume 28.9 mm3 25%

Strategies in intermediate lesionStrategies in intermediate lesionStrategies in intermediate lesionStrategies in intermediate lesion
• IVUSIVUS
•FFRFFR
• IVUSIVUS
•FFRFFR

IVUS MLA < 4.0mmIVUS MLA < 4.0mm22IVUS MLA < 4.0mmIVUS MLA < 4.0mm22
357 intermediate lesion in 300 pts357 intermediate lesion in 300 ptsClinical FU >1yrClinical FU >1yr357 intermediate lesion in 300 pts357 intermediate lesion in 300 ptsClinical FU >1yrClinical FU >1yr
31
22
74
0
5
10
15
20
25
30
35
Abizaid AS, et al, Circulation 1999
31
20
4 3
0
5
10
15
20
25
30
35Any event (%)Any event (%) Revascularization (%)Revascularization (%)
2.0-2.92.0-2.9N=17N=17
3.0-3.93.0-3.9N=36N=36
4.0-4.94.0-4.9N=55N=55
55N=193N=193
2.0-2.92.0-2.9N=17N=17
3.0-3.93.0-3.9N=36N=36
4.0-4.94.0-4.9N=55N=55
55N=193N=193

Deferral of PTCA Based on FFRDeferral of PTCA Based on FFR
Bech et al, Circulation 2001
•325 patients referred for PTCA without documented ischemia• If If FFR >0.75FFR >0.75, randomized to Defer (91) or Performance (90) groups, randomized to Defer (91) or Performance (90) groups• If FFR <0.75, PTCA performed, Reference group (144)
0
20
40
60
80
100
Baseline 1 Month 12Months
24Months
DeferPerformanceReference
Patients freefrom angina
(%)
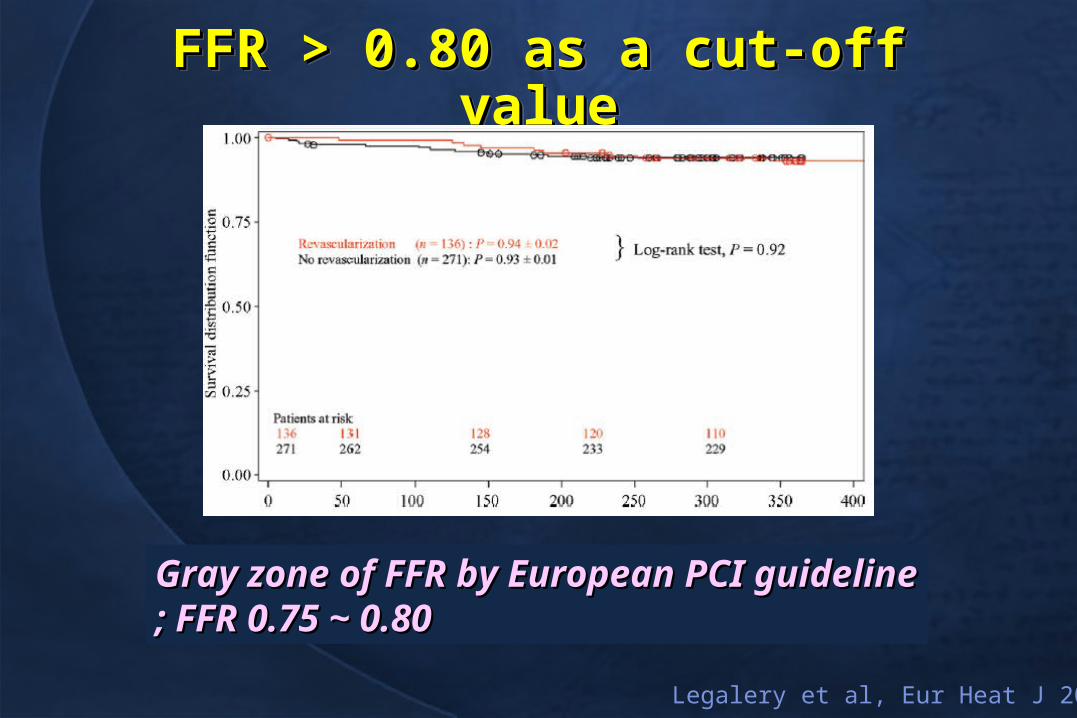
FFR > 0.80 as a cut-off valueFFR > 0.80 as a cut-off valueFFR > 0.80 as a cut-off valueFFR > 0.80 as a cut-off value
Legalery et al, Eur Heat J 2005
Gray zone of FFR by European PCI guidelineGray zone of FFR by European PCI guideline; FFR 0.75 ~ 0.80; FFR 0.75 ~ 0.80

Natural History of Intermediate LesionNatural History of Intermediate LesionNatural History of Intermediate LesionNatural History of Intermediate Lesion
• 10-yrs survival rate10-yrs survival rate 90.1% vs. 85.8% (3342 pts with nor90.1% vs. 85.8% (3342 pts with nor
mal coronary vs. 2184 pts with noncmal coronary vs. 2184 pts with noncritical stenosis (<70%)ritical stenosis (<70%)
• Noncritical stenosis; not significant Noncritical stenosis; not significant independent determinant of survivalindependent determinant of survival
Crenshaw JH. et al. Am J Med Sci 1995

Evolution of Spontaneous Atherosclerotic Evolution of Spontaneous Atherosclerotic Plaque Rupture With Medical TherapyPlaque Rupture With Medical TherapyIn 14 Pts with 28 plaque ruptures, 22 months FUIn 14 Pts with 28 plaque ruptures, 22 months FU
Evolution of Spontaneous Atherosclerotic Evolution of Spontaneous Atherosclerotic Plaque Rupture With Medical TherapyPlaque Rupture With Medical TherapyIn 14 Pts with 28 plaque ruptures, 22 months FUIn 14 Pts with 28 plaque ruptures, 22 months FU
50% healed without significant plaque modificationNo healing-prediction criterion could be found
Rioufol G. et al. Circulation 2004;110:2875-80

Angioscopic F/U of 50 Ruptured Plaques Angioscopic F/U of 50 Ruptured Plaques (30 pts) in Non-culprit Lesions; (30 pts) in Non-culprit Lesions; 13±9 Mo FU13±9 Mo FU
Takano M et al, J Am Coll Cardiol 2005;45:652– 8
• Overall healing; 30% Overall healing; 30%
• Remaining of thrombi in Remaining of thrombi in 35 (70%)35 (70%)
• Thrombus color change Thrombus color change from red (56%) at from red (56%) at baseline to pinkish-white baseline to pinkish-white (83%) at follow-up (83%) at follow-up
• %DS at the healed %DS at the healed plaque (12.3% to 22.7%, plaque (12.3% to 22.7%, p<0.05) p<0.05)
• 1 pt need PCI1 pt need PCIPinkish-white thrombus on the yellow plaque
Smooth white intima without thrombus
DS=35%DS=35% DS=43%DS=43%
Ruptured plaques in nonculprit lesions tend to heal slowly with a progression of angiographic stenosis

Plaque instability frequently occurs days or weeks Plaque instability frequently occurs days or weeks before occlusive coronary thrombosisbefore occlusive coronary thrombosis
Composition of the retrieved material using suction catheter Composition of the retrieved material using suction catheter in 211 pts undergoing 1 PCI within 6 hrs after onset of symptomin 211 pts undergoing 1 PCI within 6 hrs after onset of symptom
Only thrombus54%
Only plaque components5%
Both components45%
van der Wal AC, Koch KT et al, TCT
49
35
9 7
0
10
20
30
40
50
<1day
1-5 days
>5daysboth
%
FreshLytic
OrganizedFresh & organized
Acute coronary occlusion is often the finalStage in a series of successive thromboticEvents that occurred in the preceding days or weeks
ContentsContentsContentsContents
1.1. Definition of VPDefinition of VP
2.2. Fate of VP / intermediate lesionFate of VP / intermediate lesion
3.3. Konyang experience with VPKonyang experience with VP
1.1. Definition of VPDefinition of VP
2.2. Fate of VP / intermediate lesionFate of VP / intermediate lesion
3.3. Konyang experience with VPKonyang experience with VP

1.1. To know clinical outcomes of To know clinical outcomes of intermediate lesion according to tissue intermediate lesion according to tissue type by VH-IVUStype by VH-IVUS
2.2. To identify a lesion, which causes To identify a lesion, which causes angina (needs PCI) in the futureangina (needs PCI) in the future
ObjectivesObjectivesObjectivesObjectives
VH-IVUS for detection a VPVH-IVUS for detection a VPVH-IVUS for detection a VPVH-IVUS for detection a VP

Study DesignStudy DesignStudy DesignStudy Design
Patient population:Patient population:
30%-70% stenosis by CAG30%-70% stenosis by CAG ConsecutiveConsecutive Informed consentInformed consent Good quality of VH-IVUSGood quality of VH-IVUS
Efficacy outcome measure:Efficacy outcome measure: Time to occurrence of a major CV event:Time to occurrence of a major CV event:
– Lesion progression requiring PCILesion progression requiring PCI– Cardiac deathCardiac death– AMIAMI– Fatal or nonfatal strokeFatal or nonfatal stroke– Any eventsAny events
Jan 2007~Jun 2008Jan 2007~Jun 2008
Patients enrollPatients enrollCAG &CAG &
VH-IVUSVH-IVUS
98 lesions in 98 lesions in 94 pts94 pts65 pts eligible65 pts eligible
CAG & VH-IVUS FUCAG & VH-IVUS FU48 lesions (72.7%)48 lesions (72.7%)
FU lossFU lossn=1n=1
Clinical FU Clinical FU 64 pts (98.5%)64 pts (98.5%)
9 months9 months
DeathDeathn=3n=3
98 lesions98 lesions in 94 pts in 94 pts69 – 69 – 33 lesions eligible lesions eligible
8.78.72.9 months2.9 months

Patients Demographics (n=94)Patients Demographics (n=94)Patients Demographics (n=94)Patients Demographics (n=94)
Age, yrsMale, n (%)Hypertension, n (%)Diabetes, n (%)Smoking, n (%)Dyslipidemia, n (%)ACS, n (%)Prior MI, n (%)PCI, n (%)Hs-CRP, mg/dL
61.811.868 (72.3)43 (45.7)27 (28.7)35 (37.2)37 (39.4)42 (44.7)
5 (5.3)78 (83.0)
0.581.22

Angiographic Findings (n=98)Angiographic Findings (n=98)Angiographic Findings (n=98)Angiographic Findings (n=98)
Lesion location, n (%) LAD LCX RCA LM DiagonalMulti-vessel disease, n (%)MLD, mmProximal ref. A diameter, mmDistal ref. A diameter, mm% diameter stenosis, %
53 (54.1)20 (20.4)15 (15.3)
8 (8.2)2 (2.)
58 (59.2)1.790.533.210.712.900.6443.49.05
(30.0 ~ 66.2)

Gray Scale IVUS Findings (n=98)Gray Scale IVUS Findings (n=98)Gray Scale IVUS Findings (n=98)Gray Scale IVUS Findings (n=98)Minimal luminal area EEM area, mm2
Luminal area, mm2
P&M area, mm2
Plaque burden, % Remodeling index Positive remodeling (>1.05), n (%) Luminal area <4.0mm2, n (%)Volumetric analysis EEM volume, mm3
Lumen volume, mm3
P&M volume, mm3
Lesion length, mm
15.25.85.42.19.94.2
63.49.30.960.1323 (23.5)31 (31.6)
215.2128.197.554.2
116.380.513.97.2

IVUS-VH Findings at MLA (n=98)IVUS-VH Findings at MLA (n=98)IVUS-VH Findings at MLA (n=98)IVUS-VH Findings at MLA (n=98)
Fibrous area, mm2
Fibrofatty area, mm2
Dense calcified area, mm2
Necrotic core area, mm2
Fibrous area, %Fibrofatty area, %Dense calcified area, %Necrotic core area, %
3.952.290.921.170.530.521.170.9660.214.112.19.79.18.6
18.711.5

TCFA by IVUS-VHTCFA by IVUS-VH
• In at least three consecutive frames;In at least three consecutive frames;
• 1) necrotic core 1) necrotic core >> 10% without evid 10% without evident overlying fibrous tissue andent overlying fibrous tissue and• 2) percent atheroma area 2) percent atheroma area >> 40% 40%
Rodriguez-Granillo GA et al. JACC 2005;46:2038–42

TCFA ClassificationTCFA Classification
Less vulnerableLess vulnerable Highest vulnerableHighest vulnerable
NC > 20%NC > 20%> 50% Plaque burden> 50% Plaque burdenCa > 5%Ca > 5%Remodeling index > 1.05Remodeling index > 1.05
NC < 20%NC < 20%< 50% Plaque burden< 50% Plaque burden
Proposed by Dr. Mintz G

IVUS-VH Findings at MLA (n=98)IVUS-VH Findings at MLA (n=98)IVUS-VH Findings at MLA (n=98)IVUS-VH Findings at MLA (n=98)
PIT (n=7,7.1%) PIT (n=7,7.1%)
Fibrocalcific AFibrocalcific A(n=17, 17.3%) (n=17, 17.3%)
Fibrous cap AFibrous cap A(n=42, 42.9%)(n=42, 42.9%)
TCFATCFA(n=28, 28.6%)(n=28, 28.6%)
UndeterminedUndetermined(n=4, 4.1%) (n=4, 4.1%)
TCFA, less vulnerableTCFA, less vulnerable(n=13, 46.4%) (n=13, 46.4%)
TCFA, high vulnerableTCFA, high vulnerable(n=15, 53.6%) (n=15, 53.6%)

TCFATCFA According to Diagnosis According to DiagnosisTCFATCFA According to Diagnosis According to Diagnosis
20.0
25.0
30.0
35.0
SA ACS
P=0.021P=0.021
15 (27.3%)15 (27.3%)
13 (30.2%)13 (30.2%)
(n=55)(n=55) (n=43)(n=43)
P=NSP=NS
TC
FA
, %T
CF
A, %
Hig
hes
t vu
lne
rab
le T
CF
A, %
Hig
hes
t vu
lne
rab
le T
CF
A, %
0
20
40
60
80
100
SA ACS
(n=55)(n=55) (n=43)(n=43)
5 (53.6%)5 (53.6%)
10 (76.9%)10 (76.9%)

Medications (n=92 lesions)Medications (n=92 lesions)Medications (n=92 lesions)Medications (n=92 lesions)
AspirinAspirinBeta-blockersBeta-blockersACEIACEIARBARBCCBCCBStatinsStatinsOHAOHAInsulinInsulin
98 (100)98 (100)61 (62.2)61 (62.2)46 (46.9)46 (46.9)15 (15.3)15 (15.3)25 (25.5)25 (25.5)73 (74.5)73 (74.5)20 (20.4)20 (20.4)
2 (2.0)2 (2.0)

6 Mo Clinical outcomes6 Mo Clinical outcomes(64/65 pts, 98.5%)(64/65 pts, 98.5%)
6 Mo Clinical outcomes6 Mo Clinical outcomes(64/65 pts, 98.5%)(64/65 pts, 98.5%)
Death*Death*Myocardial infarctionMyocardial infarctionStrokeStrokeRequiring PCIRequiring PCI
3 (4.7%)3 (4.7%)0 (0)0 (0)0 (0)0 (0)
7 (10.9%)7 (10.9%)8 lesions in 7 pts8 lesions in 7 pts
*; Causes of death; CHF at 1 month, ICH at 4 months, SCD at 5 months

Case, Case, 강 강 0 0 준준 , , SCDSCD at 5 Mo at 5 MoCase, Case, 강 강 0 0 준준 , , SCDSCD at 5 Mo at 5 Mo2007-07-302007-07-30
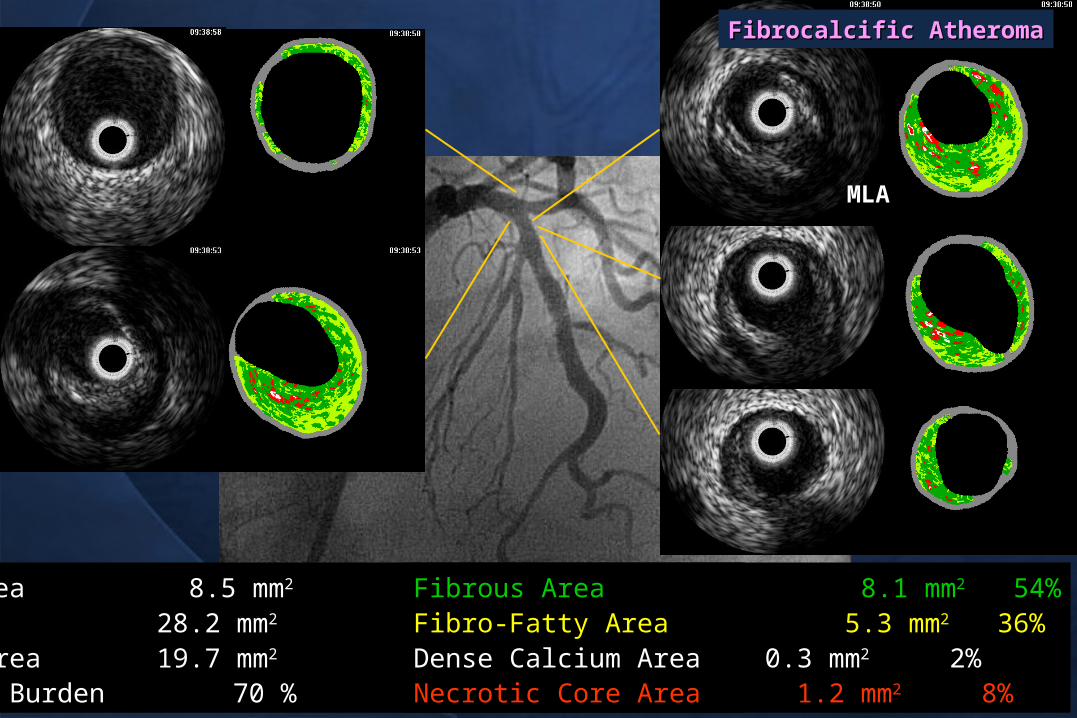
MLAMLA
Lumen Area 8.5 mm2
EEL Area 28.2 mm2
Plaque Area 19.7 mm2
% Plaque Burden 70 %
Fibrous Area 8.1 mm2 54%Fibro-Fatty Area 5.3 mm2 36%Dense Calcium Area 0.3 mm2 2%Necrotic Core Area 1.2 mm2 8%
Fibrocalcific AtheromaFibrocalcific Atheroma

2008-06-242008-06-24
Case, (65/M), Case, (65/M), 염염 00 철철 , SA, SACase, (65/M), Case, (65/M), 염염 00 철철 , SA, SA
LAD stentingLAD stenting
2007-09-182007-09-18
Lumen Area 3.8 mm2
% Plaque Burden 80 %
Fibrous Area 5.1 mm2 44%Fibro-Fatty Area 1.4 mm2 12%Dense Calcium Area 2.1 mm2 18%Necrotic Core Area 3.0 mm2 26%
TCFATCFA
QCA stenosis 35.4% MLD 2.10
QCA stenosis 50.4% MLD 1.59

Fibrous Area 2.7 mm2 72%Fibro-Fatty Area 0.2 mm2 5%Dense Calcium Area 0.2 mm2 6%Necrotic Core Area 0.6 mm2 17%
Case, (71/M), Case, (71/M), 김김 00 규규 , UA, UACase, (71/M), Case, (71/M), 김김 00 규규 , UA, UA
2007-05-072007-05-07 2008-01-222008-01-22
QCA stenosis 56.0% MLD 1.10
QCA stenosis 50.0% MLD 1.00
Lumen Area 2.7 mm2
EEL Area 8.7 mm2
Plaque Area 6.0 mm2
% Plaque Burden 69%
Lumen Area 3.0 mm2
EEL Area 6.8 mm2
Plaque Area 3.7 mm2
% Plaque Burden 55 %
Fibrous Area 1.2 mm2 73%Fibro-Fatty Area 0.2 mm2 15%Dense Calcium Area 0.1 mm2 3%Necrotic Core Area 0.1mm2 8%
Fibrous cap atheromaFibrous cap atheroma

Fibrous Area 5.5 mm2 50%Fibro-Fatty Area 0.2 mm2 2%Dense Calcium Area 0.2 mm2 2%Necrotic Core Area 5.2 mm2 47%
Case, (46/M), Case, (46/M), 윤윤 00 선선 , SA, SACase, (46/M), Case, (46/M), 윤윤 00 선선 , SA, SA
QCA stenosis 35.64% MLD 2.80
IVUS MLA 8.60 mm2
QCA stenosis 56.21% MLD 1.70
IVUS MLA 6.10 mm2
Lumen Area 8.6 mm2
EEL Area 24.2mm2
Plaque Area 15.7mm2
% Plaque Burden 65%
Lumen Area 6.1 mm2
EEL Area 21.7 mm2
Plaque Area 15.6 mm2
% Plaque Burden 72 %
Fibrous Area 7.9 mm2 70%Fibro-Fatty Area 1.4 mm2 12%Dense Calcium Area 0.1 mm2 1%Necrotic Core Area 2.0 mm2 18%
2007-06-062007-06-06 2008-02-142008-02-14TCFATCFA

Fibrous Area 1.4 mm2 70%Fibro-Fatty Area 0.1 mm2 3%Dense Calcium Area 0.2 mm2 10%Necrotic Core Area 0.3 mm2 16%
Case, (57/F), Case, (57/F), 김김 00 순순 , SA, SACase, (57/F), Case, (57/F), 김김 00 순순 , SA, SA
LAD stentingLAD stenting
2007-05-172007-05-17 2008-05-202008-05-20
QCA stenosis 32.2% MLD 1.70
IVUS MLA 4.70 mm2
QCA stenosis 78.4% MLD 0.90
IVUS MLA 3.20 mm2
Lumen Area 4.7 mm2
EEL Area 9.7 mm2
Plaque Area 5.0 mm2
% Plaque Burden 51 %
Lumen Area 3.2 mm2
EEL Area 10.3 mm2
Plaque Area 7.2 mm2
% Plaque Burden 69 %
Fibrous Area 3.6 mm2 77%Fibro-Fatty Area 0.6 mm2 12%Dense Calcium Area 0.0 mm2 0%Necrotic Core Area 0.5 mm2 11%
TCFATCFA

Fibrous Area 1.8 mm2 49%Fibro-Fatty Area 7.2 mm2 30%Dense Calcium Area 0.6 mm2 3%Necrotic Core Area 4.2 mm2 18%
Fibrous Area 10.5 mm2 57%Fibro-Fatty Area 5.8 mm2 32%Dense Calcium Area 0.7 mm2 4%Necrotic Core Area 1.4 mm2 8%
2007-08-092007-08-09 2008-05-302008-05-30
Case, (74/M), Case, (74/M), 김김 00 호호 , UA, UACase, (74/M), Case, (74/M), 김김 00 호호 , UA, UA
QCA stenosis 33.3% MLD 2.70
IVUS MLA 8.20 mm2
QCA stenosis 70.1% MLD 1.13
IVUS MLA 5.10 mm2
Lumen Area 8.2 mm2
EEL Area 32.4 mm2
Plaque Area 23.2 mm2
% Plaque Burden 72%
Lumen Area 5.1 mm2
EEL Area 33.7 mm2
Plaque Area 28.5 mm2
% Plaque Burden 85 %
Fibrocalcific AtheromaFibrocalcific Atheroma

6 Mo Angiographic Follow Up 6 Mo Angiographic Follow Up (48/66 lesions, 72.7%)(48/66 lesions, 72.7%)
6 Mo Angiographic Follow Up 6 Mo Angiographic Follow Up (48/66 lesions, 72.7%)(48/66 lesions, 72.7%)
BaselineBaseline Ref. Diameter, mmRef. Diameter, mm MLDMLD Follow upFollow up Ref. Diameter, mmRef. Diameter, mm MLDMLD Late Loss, mm Late Loss, mm
3.033.030.610.611.841.840.590.59
2.872.870.54*0.54*1.721.720.600.60
0.120.120.480.48
*;p=0.005 by paried t-test

Comparison between 2 groupsComparison between 2 groupsComparison between 2 groupsComparison between 2 groups
CAGCAG MLDMLD diameter stenosis, %diameter stenosis, %Gray scale IVUSGray scale IVUS MLAMLA Remodeling indexRemodeling index Plaque areaPlaque area Plaque burdenPlaque burden
Need PCINeed PCIn=8n=8
1.91.90.50.543.543.59.19.1
5.85.82.02.00.980.980.10.112.212.25.85.866.366.38.58.5
StationaryStationaryn=40n=40
1.81.80.60.643.243.28.98.9
5.55.52.52.50.950.950.10.19.69.64.24.2
63.163.17.07.0
PP value value
nsnsnsns
nsnsnsnsnsnsnsns

Comparison between 2 groupsComparison between 2 groupsComparison between 2 groupsComparison between 2 groups
VH-IVUSVH-IVUSAt MLA siteAt MLA site Fibrous areaFibrous area Fibrofatty areaFibrofatty area Dense calcified areaDense calcified area Necrotic core areaNecrotic core areaOver the entire lesionOver the entire lesion Fibrous volumeFibrous volume Fibrofatty volumeFibrofatty volume Dense calcified volumeDense calcified volume Necrotic core volumeNecrotic core volume
Need PCINeed PCIn=8n=8
4.914.912.72 (61%)2.72 (61%)1.481.481.84 (15%)1.84 (15%)0.580.580.66 (9%)0.66 (9%)
1.581.581.71 (18%)1.71 (18%)
32.5432.5416.40 (63%)16.40 (63%)8.518.519.41 (15%)9.41 (15%)4.654.656.40 (7%)6.40 (7%)
8.088.087.04 (15%)7.04 (15%)
StationaryStationaryn=40n=40
3.993.992.50 (63%)2.50 (63%)0.750.750.85 (11%)0.85 (11%)0.480.480.45 (9%)0.45 (9%)
1.041.040.81 (18%)0.81 (18%)
42.3442.3430.36 (62%)30.36 (62%)8.358.359.04 (12%)9.04 (12%)6.636.636.62 (9%)6.62 (9%)
10.7810.788.39 (16%)8.39 (16%)
PP value value
nsns0.0770.077
nsnsnsnsnsnsnsnsNsNsnsnsnsns

MLA vs. Lesion progression (need PCI)MLA vs. Lesion progression (need PCI)MLA vs. Lesion progression (need PCI)MLA vs. Lesion progression (need PCI)
0
10
20
30
40
<4mm<4mm22 4mm4mm22
Pro
gres
sion
req
uirin
g P
CI,
%P
rogr
essi
on r
equi
ring
PC
I, %
6 (35.3%)
2 (6.5%)
P=0.010
IVUS criteria is still important
But, 65% of intermediate lesion <4mm2 does not rapidly progress

Lesion types vs. progression (need PCI)Lesion types vs. progression (need PCI)Lesion types vs. progression (need PCI)Lesion types vs. progression (need PCI)P
rogr
essi
on r
equi
ring
PC
I, %
Pro
gres
sion
req
uirin
g P
CI,
%
0 (0%)
2 (20%)
1 (5%)
PIT; pathologic intimal thickening, FCA; fibrocalcific atheroma, CAPA; fibrous cap atheroma, TCFA; thin cap fibroatheroma
Non-TCFA TCFA
3 (8.6%)
P=0.014
(n=3) (n=10) (n=20) (n=13) (n=35) (n=13)
0
10
20
30
40
PIT FCA CAPA TCFA
5 (38.5%)
0
10
20
30
405 (38.5%)

30
32
34
36
38
40
TCFA vulnerability vs. Lesion progressionTCFA vulnerability vs. Lesion progressionTCFA vulnerability vs. Lesion progressionTCFA vulnerability vs. Lesion progression
Less Less vulnerablevulnerable
High High vulnerablevulnerable
Pro
gres
sion
req
uirin
g P
CI,
%P
rogr
essi
on r
equi
ring
PC
I, %
2 (40.0%)3 (37.5%)
P=0.928 TCFA vulnerability was not helpful to identify a real VP, which showed a rapid progression requiring PCI
Different classification is needed
(n=5) (n=8)

MLA < 4.0mmMLA < 4.0mm2 2 & TCFA & TCFA vs. Lesion progression (need PCI)vs. Lesion progression (need PCI)
MLA < 4.0mmMLA < 4.0mm2 2 & TCFA & TCFA vs. Lesion progression (need PCI)vs. Lesion progression (need PCI)
If MLA of intermediate lesion is less than 4.0mm2 as well as TCFA, 67% will rapidly progress
It will be very helpful to see MLA as well as lesion type by VH-IVUS
Variables; MLA < 4.0mm2 & TCFAVariables; MLA < 4.0mm2 & TCFA
1 (4.2%)
3 (16.7%)
P=0.001
0
10
20
30
40
50
60
70
none single double
4 (66.7%)

SummarySummarySummarySummary
1.1. 38.5% of TCFA in intermediate lesion n38.5% of TCFA in intermediate lesion needs an PCI in 6-9 months (vs. 35.3% oeeds an PCI in 6-9 months (vs. 35.3% of lesion <4.0mmf lesion <4.0mm22 by IVUS) by IVUS)
2.2. It will be very helpful to decide a therapIt will be very helpful to decide a therapeutic decision, considering TCFA by Veutic decision, considering TCFA by VH-IVUS as well as MLAH-IVUS as well as MLA
3.3. PIT and fibrous cap atheroma in intermPIT and fibrous cap atheroma in intermediate lesion have a favorable outcomeediate lesion have a favorable outcomess

• To evaluate in vivo tissue To evaluate in vivo tissue characteristics of coronary characteristics of coronary plaque with plaque with rupture/ulceration (PRU) in rupture/ulceration (PRU) in culprit lesionculprit lesion
• To evaluate in vivo tissue To evaluate in vivo tissue characteristics of coronary characteristics of coronary plaque with plaque with rupture/ulceration (PRU) in rupture/ulceration (PRU) in culprit lesionculprit lesion
ObjectivesObjectivesObjectivesObjectives
Plaque Rupture & VH-IVUSPlaque Rupture & VH-IVUSPlaque Rupture & VH-IVUSPlaque Rupture & VH-IVUS

MethodsMethodsMethodsMethods
Study PopulationStudy Population
162 consecutive patients undergoing IVUS-VH examination
before PCI or for lesion evaluation were studied prospectively
Exclusion criteriaExclusion criteria
Vessel tortuosity which precluded IVUS-VH examination
History of PCI or CABG
Refuse to study

DefinitionDefinitionDefinitionDefinition• Plaque ulcerationPlaque ulceration; ; a recess in tha recess in th
e plaque beginning at the lumie plaque beginning at the luminal-intimal border, typically witnal-intimal border, typically without enlargement of the EEM chout enlargement of the EEM compared with the ref. segmentompared with the ref. segment
• Plaque rupturePlaque rupture; ; a plaque ulcerata plaque ulceration with a tear detected in a fibion with a tear detected in a fibrous caprous cap
• Plaque ulcerationPlaque ulceration; ; a recess in tha recess in the plaque beginning at the lumie plaque beginning at the luminal-intimal border, typically witnal-intimal border, typically without enlargement of the EEM chout enlargement of the EEM compared with the ref. segmentompared with the ref. segment
• Plaque rupturePlaque rupture; ; a plaque ulcerata plaque ulceration with a tear detected in a fibion with a tear detected in a fibrous caprous cap
JACC 2001;37:1478-92.
• Plaque rupture or ulcerationPlaque rupture or ulceration; ; a cavity in the vessel wall, wia cavity in the vessel wall, with disruption of the intima, and flow observed within the th disruption of the intima, and flow observed within the plaque cavity.plaque cavity.
• Intimal disruption; irregular intimal surface of ulcerated Intimal disruption; irregular intimal surface of ulcerated plaques and visible torn edges.plaques and visible torn edges.
• Blood flow in the vessel wall cavity; contrast injection mBlood flow in the vessel wall cavity; contrast injection may be used to prove and define the communication point.ay be used to prove and define the communication point.

15.4%
26.5%58.0%
Plaque MorphologyPlaque MorphologyPlaque MorphologyPlaque Morphology
Intact (n=94)
Ulcer (n=43)
Rupture (n=25)
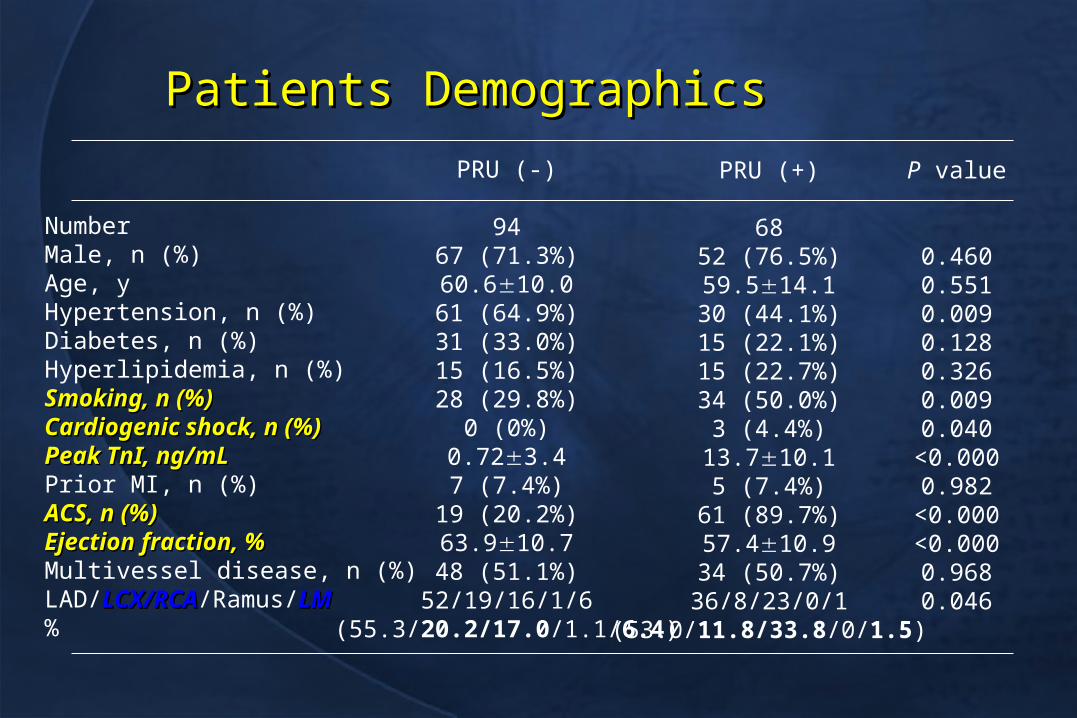
Patients DemographicsPatients Demographics
NumberMale, n (%)Age, yHypertension, n (%)Diabetes, n (%)Hyperlipidemia, n (%)Smoking, n (%)Smoking, n (%)Cardiogenic shock, n (%)Cardiogenic shock, n (%)Peak TnI, ng/mLPeak TnI, ng/mLPrior MI, n (%)ACS, n (%)ACS, n (%)Ejection fraction, %Ejection fraction, %Multivessel disease, n (%)LAD/LCX/RCALCX/RCA/Ramus/LMLM%
PRU (-)
9467 (71.3%)60.610.061 (64.9%)31 (33.0%)15 (16.5%)28 (29.8%)
0 (0%)0.723.47 (7.4%)
19 (20.2%)63.910.748 (51.1%)
52/19/16/1/6(55.3/20.2/17.0/1.1/6.4)
PRU (+)
6852 (76.5%)59.514.130 (44.1%)15 (22.1%)15 (22.7%)34 (50.0%)
3 (4.4%)13.710.15 (7.4%)
61 (89.7%)57.410.934 (50.7%)36/8/23/0/1
(53.0/11.8/33.8/0/1.5)
P value
0.4600.5510.0090.1280.3260.0090.040
<0.0000.982
<0.000<0.0000.9680.046

Patients Demographics
NumberHs-CRP, mg/LHs-CRP, mg/LTotal cholesterol, mg/dLTriglyceride, mg/dLHDL-cholesterol, mg/dLHDL-cholesterol, mg/dLLDL-cholesterol, mg/dLBUN, mg/dLCreatinine, mg/dLUric acid, mg/dL
PRU (-)
942.102.61844116582
41.710.011931
16.46.31.21.25.31.5
PRU (+)
683.703.618446
14910445.512.5
1203517.79.91.10.65.71.6
P value
0.0020.9630.2980.0420.8330.3230.4880.214

Lumen volume 204.2 mm3
Vessel volume 425.5 mm3
Plaque Volume 221.3 mm3
Segment length 20.2 mm
FI area 10.7 mm2 71 %FF area 2.5 mm2 16 %DC area 0.2 mm2 1 %NC area 1.7 mm2 11 %
STEMI, M/54, PR(+)PR(+) STEMI, M/56, PR(-)PR(-)
Lumen volume 106.0 mm3
Vessel volume 263.5 mm3
Plaque Volume 157.6 mm3
Segment length 13.5 mm
FV 39.0 mm3 36 %FFV 8.7 mm3 8 %DCV 25.7 mm3 24 %NCV 35.2 mm3 32 %
FI area 5.2 mm2 54 %FF area 1.2 mm2 12 %DC area 0.7 mm2 7 %NC area 2.6 mm2 26 %
FV 91.9 mm3 65 %FFV 28.2 mm3 20 %DCV 5.6 mm3 4 %NCV 16.6 mm3 12 %
Plaque Rupture
EEM CSA=25.1mm2, RI=1.21EEM CSA=18.7mm2, RI=0.85

STEMI, M/84, Plaque ulceration(+)Plaque ulceration(+) STEMI, M/56, PR(-)PR(-)
Lumen volume 106.0 mm3
Vessel volume 263.5 mm3
Plaque Volume 157.6 mm3
Segment length 13.5 mm
FV 39.0 mm3 36 %FFV 8.7 mm3 8 %DCV 25.7 mm3 24 %NCV 35.2 mm3 32 %
EEM CSA=18.7mm2, RI=0.85
FV 140.0 mm3 67 %FFV 61.3 mm3 29 %DCV 2.6 mm3 1 %NCV 5.1 mm3 2 %
Lumen volume 172.1 mm3
Vessel volume 477.9 mm3
Plaque Volume 305.8 mm3
Segment length 26.6 mm
FI area 10.0 mm2 58 %FF area 7.2 mm2 42 %DC area 0.0 mm2 0 %NC area 0.1 mm2 1 %
FI area 5.2 mm2 54 %FF area 1.2 mm2 12 %DC area 0.7 mm2 7 %NC area 2.6 mm2 26 %
EEM CSA=25.4mm2, RI=1.07
Plaque Ulcer

SA, M/77, PR(+)PR(+) SA, F/63, PR(-)PR(-)
Lumen volume 188.3 mm3
Vessel volume 471.4 mm3
Plaque Volume 283.1 mm3
Segment length 25.7 mm
FV 111.5 mm3 60 %FFV 3.1 mm3 2 %DCV 30.0 mm3 16 %NCV 42.2 mm3 23 %
FI area 7.5 mm2 66 %FF area 0.2 mm2 2 %DC area 0.6 mm2 6 %NC area 3.0 mm2 26 %
Lumen volume 120.8 mm3
Vessel volume 264.9 mm3
Plaque Volume 144.1 mm3
Segment length 15.9 mm
FV 51.5 mm3 59 %FFV 10.9 mm3 13 %DCV 7.0 mm3 8 %NCV 17.5 mm3 20 %
FI area 4.8 mm2 58 %FF area 1.2 mm2 15 %DC area 0.6 mm2 7 %NC area 1.7 mm2 20 %
Plaque Rupture
EEM CSA=18.5mm2, RI=1.12
EEM CSA=17.0mm2, RI=0.73

0
100
200
300
400
EEL Lumen Plaque PB
Vo
lum
e, m
m3
or
%
0
20
40
60
80
100
FV FFV DCV NCV
P<0.000
P=0.001
P<0.000
P=0.025
P<0.000
P=0.005
P=0.022
P=0.001
Volumetric Analysis (n=162)Volumetric Analysis (n=162)
PRU(-), n=94 PRU(+), n=68

0
1
2
3
4
5
6
7
FA FFA DCA NCA
0
2
4
6
8
10
12
14
16
18
EEL Lumen Plaque
Are
a, m
m2
Lesion Analysis (n=162) at MLALesion Analysis (n=162) at MLA
PRU(-), n=94 PRU(+), n=68
0.88
0.90
0.92
0.94
0.96
0.98
1.00
1.02
RI
P<0.000
P=0.002
P=0.246
P=0.002
P<0.000
P=0.869
P<0.000
P=0.003

Independent Factor for Independent Factor for Plaque Rupture/UlcerationPlaque Rupture/Ulceration
Vessel volumeFibrous volumeFibrofatty volumeNecrotic core volumeRemodeling index
Beta
1.1071.0220.5220.6840.168
P value
0.0350.0210.0080.0050.031
95% CI
0.000 ~ 0.0050.001 ~ 0.0160.003 ~ 0.0210.005 ~ 0.0280.046 ~ 0.915
This model includes IVUS-VH variables showing significance in univariate analysisas a variables

SummarySummarySummarySummary
1.1. Plaque rupture/ulceration is not Plaque rupture/ulceration is not associated with plaque associated with plaque composition at the MLD site, but composition at the MLD site, but those over the entire lesion lengththose over the entire lesion length
2.2. Plaque rupture/ulceration is also Plaque rupture/ulceration is also associated with positive vascular associated with positive vascular remodelingremodeling

ConclusionsConclusionsConclusionsConclusions
VH-IVUS has a great potential VH-IVUS has a great potential to identify a vulnerble plaqueto identify a vulnerble plaque
Needs clinical correlation witNeeds clinical correlation with VH-IVUS findingsh VH-IVUS findings
VH-IVUS has a great potential VH-IVUS has a great potential to identify a vulnerble plaqueto identify a vulnerble plaque
Needs clinical correlation witNeeds clinical correlation with VH-IVUS findingsh VH-IVUS findings

Thank you for Thank you for your attentionyour attentionThank you for Thank you for your attentionyour attention

Compositional Changes during FUCompositional Changes during FU (32/59, 54.2%) (32/59, 54.2%)
Compositional Changes during FUCompositional Changes during FU (32/59, 54.2%) (32/59, 54.2%)
38.5
40.4
7.5
10.4
6.36.3 10.8
11.7
0
5
10
15
20
25
30
35
40
45
FV FFV DCV NCV
0
5
10
15
20
25
FV FFV DCV NCV
mm
3
P=0.040P=0.040
Total SubjectsTotal Subjects
In 5 Pts Underwent PCIIn 5 Pts Underwent PCI
P=NSP=NS
0
10
20
30
40
50
FV FFV DCV NCV
In 27 Pts In 27 Pts Not Underwent PCINot Underwent PCI
P=0.050P=0.050
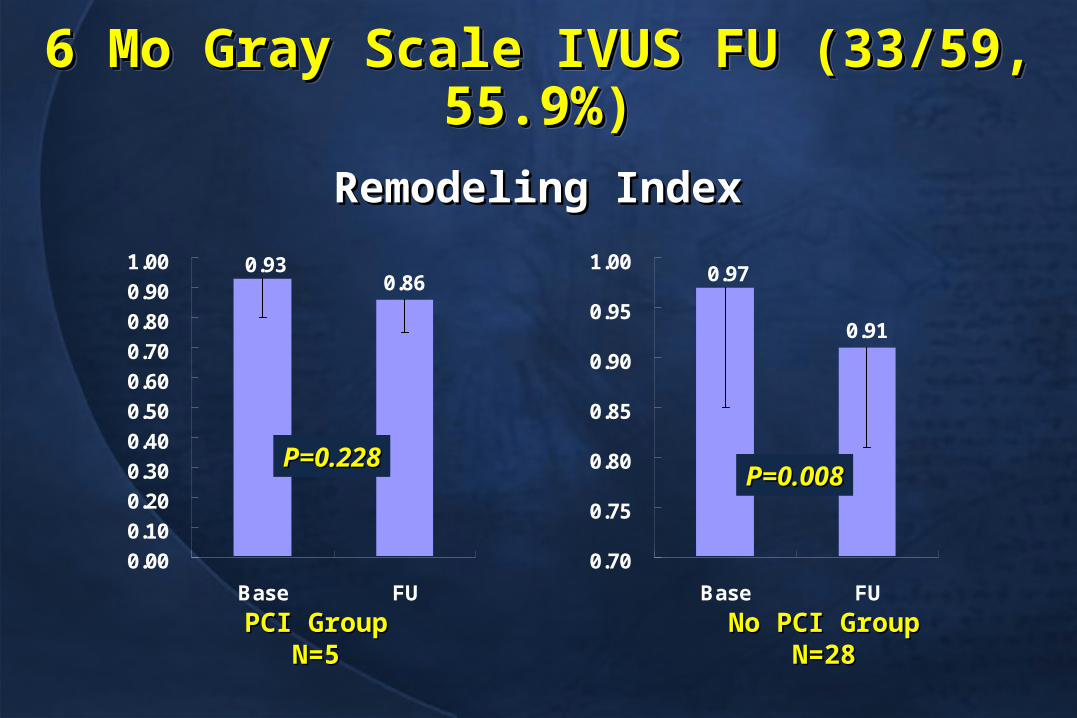
6 Mo Gray Scale IVUS FU (33/59, 55.9%)6 Mo Gray Scale IVUS FU (33/59, 55.9%)6 Mo Gray Scale IVUS FU (33/59, 55.9%)6 Mo Gray Scale IVUS FU (33/59, 55.9%)
PCI GroupPCI GroupN=5N=5
No PCI GroupNo PCI GroupN=28N=28
0.860.93
0.00
0.10
0.20
0.30
0.40
0.50
0.60
0.70
0.80
0.90
1.00
Base FU
0.91
0.97
0.70
0.75
0.80
0.85
0.90
0.95
1.00
Base FU
P=0.008P=0.008P=0.228P=0.228
Remodeling IndexRemodeling Index

6 Mo Gray Scale Volumetric IVUS FU6 Mo Gray Scale Volumetric IVUS FU(33/59, 55.9%)(33/59, 55.9%)
6 Mo Gray Scale Volumetric IVUS FU6 Mo Gray Scale Volumetric IVUS FU(33/59, 55.9%)(33/59, 55.9%)
80.2
70.8
157.3144.8
77.274
0
20
40
60
80
100
120
140
160
LV EEMV PV
BaseFU
PCI GroupPCI GroupN=5N=5
No PCI GroupNo PCI GroupN=28N=28
103.2108.3
223234.9
115.8126.5
0
50
100
150
200
250
LV EEMV PV
BaseFU
No significant changes in both groupsNo significant changes in both groups

IVUS-VH Findings over entire lesion (n=98)IVUS-VH Findings over entire lesion (n=98)IVUS-VH Findings over entire lesion (n=98)IVUS-VH Findings over entire lesion (n=98)
Fibrous volume, mm3
Fibrofatty volume, mm3
Dense calcified volume, mm3
Necrotic core volume, mm3
Fibrous volume, %Fibrofatty volume, %Dense calcified volume, %Necrotic core volume, %
42.937.49.913.16.06.1
11.69.861.311.212.68.08.87.0
17.39.5
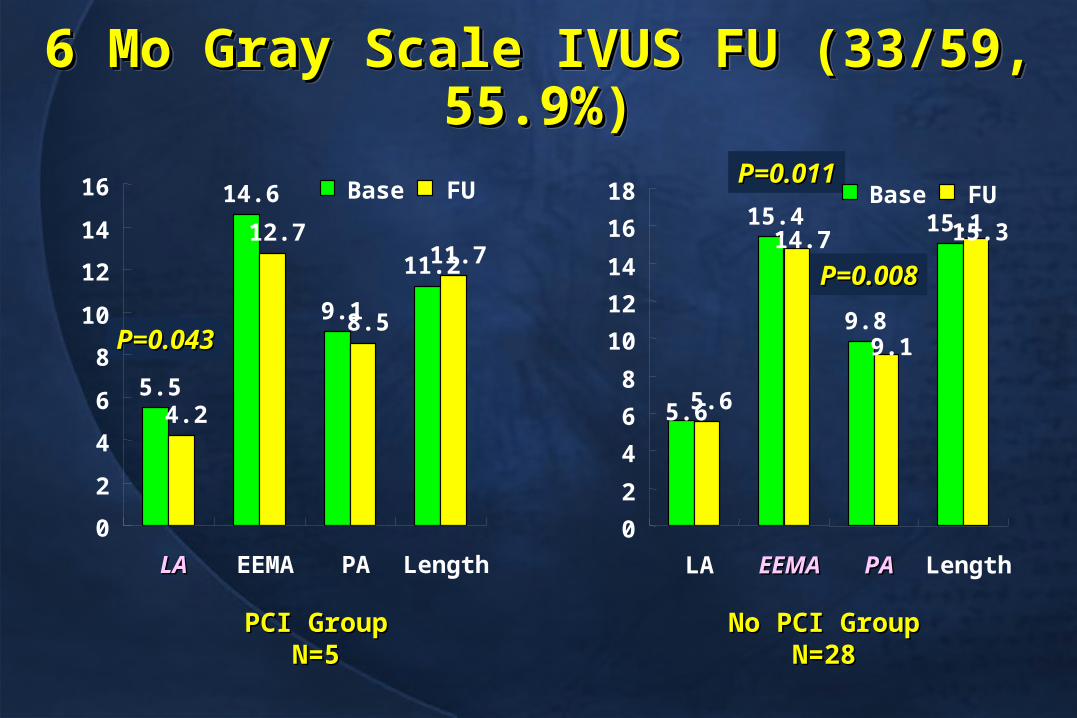
6 Mo Gray Scale IVUS FU (33/59, 55.9%)6 Mo Gray Scale IVUS FU (33/59, 55.9%)6 Mo Gray Scale IVUS FU (33/59, 55.9%)6 Mo Gray Scale IVUS FU (33/59, 55.9%)
PCI GroupPCI GroupN=5N=5
P=0.043P=0.043
No PCI GroupNo PCI GroupN=28N=28
P=0.011P=0.011
P=0.008P=0.008
5.5
14.6
9.1
11.2
4.2
12.7
8.5
11.7
0
2
4
6
8
10
12
14
16
LALA EEMA PA Length
Base FU15.4
9.8
15.1
5.65.6
15.3
9.1
14.7
0
2
4
6
8
10
12
14
16
18
LA EEMAEEMA PAPA Length
Base FU

3.223.32
2.662.84
0.0
0.5
1.0
1.5
2.0
2.5
3.0
3.5
Base FU
PCI
Not PCI
2
1.18
1.841.85
0.0
0.5
1.0
1.5
2.0
2.5
Base FU
PCI
Not PCI
0.82
0.010.0
0.2
0.4
0.6
0.8
1.0
1.2
PCI None
Late Loss, mmLate Loss, mmRef D, mmRef D, mm MLD, mmMLD, mm
P=0.004P=0.004
P=0.016P=0.016
P<0.001P<0.001
6 Mo Angiographic Follow Up 6 Mo Angiographic Follow Up (35/59, 59.3%)(35/59, 59.3%)
6 Mo Angiographic Follow Up 6 Mo Angiographic Follow Up (35/59, 59.3%)(35/59, 59.3%)
PCI GroupPCI GroupN=5N=5
No PCI GroupNo PCI GroupN=30N=30