Embed Size (px)
Citation preview
Ivory Day Clear Investment Consulting
Have insight! Will share!!
ENHANCED INVESTMENT PARTNERS, LLC – EIR ACC Active Overlay
SDIC Quantitative Investment Performance Analysis Report (10Y201312)
Complete Report
Ivory Day Clear Investment Consulting
Have insight! Will share!!
Ivory Day Clear Investment Consulting
Have insight! Will share!!
04/20/23 2
TABLE OF CONTENTS
PAGE Investment Performance Analysis Introduction 3 - 10
Investment Performance Summary of Results 11 - 29
Fidelity to Investment Style (FIT) 30 - 46
Investment Performance Comparisons 47 - 72
Investment Performance Analysis Appendix 73 - 77

Ivory Day Clear Investment Consulting
Have insight! Will share!!
04/20/23 3
INTRODUCTION
ENHANCED INVESTMENT PARTNERS, LLC. EIR ACC Investment Performance Analysis
Executive Summary Pension fund asset allocation is best done by establishing reasonable risk and return expectations for appropriate asset classes over long, intermediate and short term investment performance horizons. It is important that we evaluate the development and viability of the target and current asset allocation and current managers against the current and expected market environments. Our proprietary asset allocation model was developed internally and is not associated with or dependent on any other organization. It was developed to explicitly address the known problems that plagued other asset allocation models and methodologies. We specifically targeted the following issues (The Dirty Dozen Problems) that had impeded the application of sound asset allocation programs and denied plan sponsors the ability to achieve their long term investment performance goals:
The efficient market conundrum Deficient modeling of alternative asset classes The failure of Capital Market Assumptions (CMA) Unexpected fat tail financial investment returns Investment return correlations are not well understood Standard deviation is not a sufficiently robust measure of risk Investment Horizon mismatch of 10 Years for CMA and 30 years for ARA Means variance and Monte Carlo techniques are not sufficient Financial investment returns are not “normally” distributed The asymmetry of positive and negative returns Singular investment horizons are not sufficient Investment performance period end bias
Our asset allocation program starts with an 80+ year generic study to determine the reasonableness of the Actuarial Return Assumption and / or Minimum Acceptable Return. We then look at results over multiple time periods such as 30, 20, 10 and 5 years rolling quarterly. We then show the performance results over the last 10 years using rolling periods such as 5, 3 and 1 year rolling quarterly. As a result, the analysis that follows is an example of the approach that we take with our clients. All of the work that we do is customized for the specific situations of each client. Our asset allocation methodology is proprietary and designed to minimize the frequency, magnitude and duration of underperformance; especially negative returns. The asset allocation methodology that we have used for RPCTAE since 2000 continues to be appropriate.

Ivory Day Clear Investment Consulting
Have insight! Will share!!
04/20/23 4
INTRODUCTION
FINANCIAL INVESTMENT ORGANIZATION DESCRIPTION (Who are we?)
Name, Background, History, Experience, Scope, Mission
INVESTMENT MANAGER CLIENTS (Who believes and trusts us?)
Number, Type, Assets, Examples, Locations, Size
INVESTMENT MANAGER CLIENT PROFILES (What do they care about?)
Concerns, Interest, Priorities
INVESTMENT MANAGER DESCRIPTION (What do we do?)
Mission Statement, Goals, Objectives
INVESTMENT MANAGEMENT PHILOSOPHY (What do we believe?)
Simple Statement

Ivory Day Clear Investment Consulting
Have insight! Will share!!
04/20/23 5
INTRODUCTION
EVIDENCE (Why do we believe it?)
Prove it ! Studies, Exhibits, Statistics, Tables, Results INVESTMENT MANAGEMENT STRATEGY (What do we do about it?)
Approach, Process, Exhibit, Diagram, Flowchart, Example INVESTMENT PERFORMANCE RESULTS (How have we done?)
Investment Horizon, Rolling Periods, Market Cycles, Benchmark Indexes, Peer Universes Risk of Investment, Fidelity to Style, Return on Investment INVESTMENT MANAGEMENT PROFESSIONALS (Who does what?)
Names, Experience, Education, Position, Responsibilities INVESTMENT CLIENT BENEFITS (Why should you care?)
Professional Quality Investment Management, Professional Quality Client Service

Ivory Day Clear Investment Consulting
Have insight! Will share!!
04/20/23 6
HUMILITY
The Encyclopedia of Ignorance is much larger than the Encyclopedia of Knowledge.
SKEPTICISM
We are all familiar with optical illusions and understand that often a different perspective will lead to better understanding. Beware of statistical illusions.
INTEREST
We need to understand what the manager is trying to accomplish and how they intend to do it.
THOROUGHNESS
Be sure to look at all of the relevant measures of performance in the context of the manager’s stated strategy and the plan sponsor’s investment needs.
FAIRNESS
Make sure that the Plan Sponsor has appropriate investment horizons and reasonable performance expectations for the Investment Managers .
INTRODUCTION: Measures of Consultant / Sponsor Attitude

Ivory Day Clear Investment Consulting
Have insight! Will share!!
04/20/23 7
RETURN ON INVESTMENT (Higher is Better)
Positive average excess returns over relevant market / core / style benchmark indexes over multiple rolling periods and investment horizons.
RISK OF INVESTMENT (Smaller Ranges and Larger Values are Better when Excess Returns are Positive)
Reasonable range and average excess return tracking error to relevant benchmark indexes over multiple rolling periods and investment horizons.
EFFICIENCY OF INVESTMENT (Higher is Better)
High information ratio of excess returns relative to appropriate benchmark indexes over multiple rolling periods and investment horizons.
FIDELITY TO STYLE (FIT) (Smaller Spreads and Larger Values are Better)
Appropriate excess return correlations and spreads to relevant benchmark indexes over multiple rolling periods and investment horizons.
PERFORMANCE SUMMARY (Higher is Better)
A combination of the previous four measures that summarizes the total effect that the manager achieves.
INTRODUCTION: Measures of Investment Performance

Ivory Day Clear Investment Consulting
Have insight! Will share!!
04/20/23 8
INTRODUCTION: Description of Analysis
ENHANCED INVESTMENT PARTNERS, LLC – EIR ACM Active QUARTERLY RETURNS from 1/1/2004 to 12/31/2013S&P 500 LCM CW INDEX PROXY QUARTERLY RETURNS from 4/1/2010 to 3/31/2011
RUSSELL 3000 ACM CW INDEX PROXY QUARTERLY RETURNS from 1/1/1999 to 3/31/2002
The purpose of this analysis is to look at investment performance in multiple dimensions of returns, risk and efficiency and over multiple time periods from quarterly to 5 years rolling.
Among the benchmarks used for comparisons are the core and style indexes such as thethe S&P 500 Index, Russell Style Indexes, and the Barclays Aggregate Index.
Most exhibits represent a ten year time period divided into rolling periods ending each quarter.
In a ten year time period there are 40 quarters.In a ten year time period there are 37 one year periods rolling quarterly.In a ten year time period there are 29 three year periods rolling quarterly.In a ten year time period there are 21 five year periods rolling quarterly.

Ivory Day Clear Investment Consulting
Have insight! Will share!!
04/20/23 9
INTRODUCTION: Asset Allocation Passive Return Tables
PASSIVE ASSET CLASS ALLOCATION MATTERS (10 Years)
ENHANCED INVESTMENT PARTNERS, LLC. EIR ACC PASSIVE ALLOCATION EXAMPLE as of 201312
1 Market / Core Index Actual Index EIR
2 Russell 3000 All Cap Market Index CW Index Market Overlay
Returns Allocation Allocation
3 Russell 1000 Large Cap Value Index CW 7.58% 45.00% 29.25%
4 Russell 2000 Small Cap Value Index CW 8.60% 5.00% 19.75%
5 Russell 1000 Large Cap Growth Index CW 7.83% 45.00% 30.75%
6 Russell 2000 Small Cap Growth Index CW 9.40% 5.00% 20.25%
7 Russell 3000 All Cap Market Index CW 7.89% 7.83% 8.23%
8 10 Year Growth of $1 Billion $2,137,036,456 $2,126,068,679 $2,204,708,547
9 Passive Manager Performance Attribution 86.71% 89.92% 86.91%
10 A B C D E F

Ivory Day Clear Investment Consulting
Have insight! Will share!!
04/20/23 10
ACTIVE MAINSTREAM MANAGER ALLOCATION, SELECTION & RETENTION MATTERS (10 Years)
ENHANCED INVESTMENT PARTNERS, LLC. EIR ACC ACTIVE ALLOCATION EXAMPLE as of 201312
1 Active Managers Universe Actual Index EIR
2 Wilshire All Cap Neutral Universe Median Market Overlay
Returns Allocation Allocation
3 Wilshire Large Cap Value Median 8.60% 45.00% 29.25%
4 Wilshire Small Cap Value Median 11.74% 5.00% 19.75%
5 Wilshire Large Cap Growth Median 8.86% 45.00% 30.75%
6 Wilshire Small Cap Growth Median 10.85% 5.00% 20.25%
7 Wilshire All Cap Neutral Median 8.50% 8.99% 9.76%
8 10 Year Growth of $1 Billion $2,260,983,442 $2,364,433,252 $2,536,715,886
9 Active Manager Performance Attribution 5.48% 10.08% 13.09%
10 Active Manager Excess Dollars $123,946,986 $238,364,573 $332,007,339
11 A B C D E F
INTRODUCTION: Asset Allocation Active Return Tables

Ivory Day Clear Investment Consulting
Have insight! Will share!!
ENHANCED INVESTMENT PARTNERS, LLC – EIR ACC Active Overlay
SDIC Quantitative Investment Performance Analysis Report (10Y201312)
Investment Performance Summary of Results

Ivory Day Clear Investment Consulting
Have insight! Will share!!
04/20/23 12
Enhanced Investment Partners, LLC. EIR ACC A Enhanced Investment Partners, LLC. EIR ACC A Value AddedValue Added for for Plan ParticipantsPlan Participants
The Bottom Line:10 Year Average = $8.4 Million per YearThe Bottom Line:10 Year Average = $8.4 Million per Year
Cumulative Dollars for Multiple Years Ending 12/31/2013 Include All Cumulative Dollars for Multiple Years Ending 12/31/2013 Include All ShorterShorter Period DollarsPeriod Dollars$100,000,000 1 Year 3 Years 5 Years 10 Years Ending Value = $252,156,614
-$27,200,944 -$39,859,183 -$79,833,519 -$57,072,680 Policy Performance
-$27,606,103 -$39,859,183 -$74,483,378 -$45,302,361 Policy Performance
$0 $0 $0 $0 Policy Performance
$405,160 $0 -$5,350,141 -$11,770,319 Benchmark Index Performance
$0 $0 $0 $0 Benchmark Index Performance
$27,606,103 $39,859,183 $74,483,378 $45,302,361 Benchmark Index Performance
$0 $0 $0 $0 Manager Universe Performance
-$405,160 $0 $5,350,141 $11,770,319 Manager Universe Performance
$27,200,944 $39,859,183 $79,833,519 $57,072,680 Manager Universe Performance
$6,574,636 $1,103,008 -$10,292,973 $26,682,650 Actual Performance
$6,169,476 $1,103,008 -$4,942,833 $38,452,969 Actual Performance
$33,775,579 $40,962,190 $69,540,546 $83,755,330 Actual Performance
*Wilshire AENU Median represents the median of the Wilshire All Equity Neutral Universe. **ARA 8.00% MAR Benchmark: Represents the designated portion of the 88 year return composite of 59.64% S&P 500 Index + 40.36% 91 Day Treasury Bills.
1/1/2004 Beginning Value =
Excess $ Over ARA 8.00% MAR Benchmark**
Excess $ Over Wilshire AENU Median*
Excess $ Over Russell 3000 ACM CW
Excess $ Over Wilshire AENU Median*
Excess $ Over Russell 3000 ACM CW
Excess $ Over ARA 8.00% MAR Benchmark**
Excess $ Over Russell 3000 ACM CW
Excess $ Over ARA 8.00% MAR Benchmark**
Excess $ Over Russell 3000 ACM CW
Excess $ Over ARA 8.00% MAR Benchmark**
Excess $ Over Wilshire AENU Median*
Excess $ Over Wilshire AENU Median*

Ivory Day Clear Investment Consulting
Have insight! Will share!!
04/20/23 13
SUMMARY OF RESULTS: SUMMARY OF RESULTS: PositivePositive In-BetweenIn-Between NegativeNegative
ENHANCED INVESTMENT PARTNERS, LLC – EIR ACM vs. RUSSELL 3000 ACM CW INDEX Large positive average excess returns relative to the benchmark.
o Positive excess returns relative to the benchmark for 20 of 21 rolling 5 year periods. o Positive excess returns relative to the benchmark for 24 of 29 rolling 3 year periods. o Positive excess returns relative to the benchmark for 26 of 37 rolling 1 year periods.
Low average tracking error and small range relative to the benchmark. Moderately high average information ratio relative to the benchmark. Small positive average excess return correlation range relative to the benchmark. Large positive average performance summary relative to the benchmark.

Ivory Day Clear Investment Consulting
Have insight! Will share!!
04/20/23 14
PORTFOLIO Range of Nominal Returns & Risk Statistics (10 Years)
BENCHMARK
100.00% ALLOCATION
S&P 500 LEVEL
0.00% 7.50%
T-BILLS
A B C D E F G H I J K L M N
1 YEAR 2 YEAR 3 YEAR 4 YEAR 5 YEAR 6 YEAR 7 YEAR 8 YEAR 9 YEAR 10 YEAR
COVERAGE NOMINAL ANNUALIZED ANNUALIZED ANNUALIZED ANNUALIZED ANNUALIZED ANNUALIZED ANNUALIZED ANNUALIZED ANNUALIZED ANNUALIZED
LEVEL CALENDAR RETURNS RETURNS RETURNS RETURNS RETURNS RETURNS RETURNS RETURNS RETURNS RETURNS
100.00% QUARTER ROLLING ROLLING ROLLING ROLLING ROLLING ROLLING ROLLING ROLLING ROLLING ROLLING
RETURNS QUARTERLY QUARTERLY QUARTERLY QUARTERLY QUARTERLY QUARTERLY QUARTERLY QUARTERLY QUARTERLY QUARTERLY
1 9.83% 38.28% 28.08% 17.11% 18.93% 21.57% 8.59% 8.26% 9.71% 9.44% 10.16%
2 20.78% 62.97% 41.62% 27.19% 24.91% 21.57% 8.59% 8.26% 9.71% 9.64% 10.16%
3 8.54% 21.66% 15.82% 15.36% 8.75% 5.44% 5.80% 7.50% 8.18% 9.44% 10.16%
4 3.67% 14.19% 12.33% 8.14% 3.47% 3.29% 5.29% 6.78% 7.45% 8.56% 10.16%
5 -1.55% 0.86% 3.21% -2.34% 0.38% 1.56% 4.67% 6.08% 6.53% 8.34% 10.16%
6 -25.46% -39.16% -24.40% -13.47% -6.34% -3.33% 2.09% 4.17% 6.08% 7.41% 10.16%
7 2.91% 11.31% 8.94% 7.38% 5.88% 4.34% 5.26% 6.67% 7.58% 8.68% 10.16%
8 0.29% 1.74% 2.39% 2.04% 1.22% 2.84% 4.99% 6.30% 7.77% 8.99%
9 5.52% 18.08% 13.84% 10.89% 9.37% 6.22% 5.40% 6.94% 8.21% 9.21%
10 40 37 33 29 25 21 17 13 9 5 1
11 46.24% 102.13% 66.02% 40.65% 31.26% 24.89% 6.50% 4.10% 3.63% 2.23% 0.00%
12 18.83% 20.42% 14.69% 10.30% 8.30% 5.13% 1.49% 1.21% 1.14% 0.81% 0.00%
13 67.00% 70.00% 68.00% 62.00% 47.00% 36.00% 79.00% 96.00% 100.00% 100.00% 100.00%
14 0.934 0.561 0.383 0.688 1.707 1.245 0.819 1.028 0.798 4.038 0.000
15 200812 200903 200903 200903 200903 200903 201109 201109 201112 201212 201312
16 12 9 8 8 6 3 0 0 0 0 0
INVESTMENT PERFORMANCE HORIZONS
ONE YEAR TO TEN YEARS ROLLING QUARTERLY
EIP, LLC. EIR ACC A OVERLAY
IVORY DAY JR.
SUMMARY
INVESTMENT
PERFORMANCE
25TH. PERCENTILE
MEDIAN
75TH. PERCENTILE
100TH. PERCENTILE
STATISTICS
1/1/2004 - 12/31/2013
MOST RECENT
1ST. PERCENTILE
NOMINAL RETURNS
ACTUAL 4.34% MAR OCCURRENCE
September 4, 2014
AVERAGE (ERA)
1ST. HALF AVERAGE
2ND. HALF AVERAGE
NUMBER OF PERIODS
PERIOD OF LOWEST RETURNS
PERIODS OF NEGATIVE RETURNS
RANGE OF RETURNS
STANDARD DEVIATION
CORE SKEWNESS

Ivory Day Clear Investment Consulting
Have insight! Will share!!
04/20/23 15
BENCHMARK
100.00% ALLOCATION
S&P 500 LEVEL
0.00% 7.50%
T-BILLS
A B C D E F G H I J K L M N
1 YEAR 2 YEAR 3 YEAR 4 YEAR 5 YEAR 6 YEAR 7 YEAR 8 YEAR 9 YEAR 10 YEAR
COVERAGE EXCESS ANNUALIZED ANNUALIZED ANNUALIZED ANNUALIZED ANNUALIZED ANNUALIZED ANNUALIZED ANNUALIZED ANNUALIZED ANNUALIZED
LEVEL CALENDAR RETURNS RETURNS RETURNS RETURNS RETURNS RETURNS RETURNS RETURNS RETURNS RETURNS
100.00% QUARTER ROLLING ROLLING ROLLING ROLLING ROLLING ROLLING ROLLING ROLLING ROLLING ROLLING
RETURNS QUARTERLY QUARTERLY QUARTERLY QUARTERLY QUARTERLY QUARTERLY QUARTERLY QUARTERLY QUARTERLY QUARTERLY
1 -0.24% 3.54% 2.71% 0.75% 2.16% 2.41% 1.74% 1.66% 1.95% 1.86% 2.11%
2 3.39% 6.91% 5.86% 3.32% 2.65% 2.68% 2.62% 2.69% 1.97% 2.04% 2.11%
3 1.22% 3.54% 2.71% 2.36% 2.20% 2.06% 2.22% 1.85% 1.95% 1.95% 2.11%
4 0.47% 2.58% 1.95% 1.92% 1.89% 1.74% 1.74% 1.62% 1.78% 1.94% 2.11%
5 -0.12% 1.12% 0.45% 1.19% 1.37% 1.32% 1.34% 1.52% 1.70% 1.88% 2.11%
6 -5.31% -4.28% -0.79% 0.10% 0.71% 0.91% 1.18% 1.41% 1.56% 1.86% 2.11%
7 0.54% 2.03% 1.81% 1.79% 1.82% 1.74% 1.80% 1.81% 1.79% 1.93% 2.11%
8 0.46% 1.73% 1.82% 1.80% 1.87% 2.04% 1.94% 1.73% 1.77% 1.93%
9 0.61% 2.06% 1.69% 1.70% 1.75% 1.48% 1.48% 1.60% 1.83% 1.95%
10 40 37 33 29 25 21 17 13 9 5 1
11 8.70% 11.19% 6.64% 3.22% 1.95% 1.77% 1.44% 1.28% 0.41% 0.18% 0.00%
12 3.20% 2.63% 1.61% 0.81% 0.58% 0.49% 0.47% 0.43% 0.14% 0.06% 0.00%
13 50.00% 65.00% 55.00% 56.00% 67.00% 55.00% 51.00% 32.00% 57.00% 100.00% 100.00%
14 1.270 0.665 0.510 0.599 0.587 0.753 1.193 2.294 2.354 0.169 0.000
15 201109 201203 200903 201109 201209 201109 201209 201209 201209 201312 201312
16 13 7 7 0 0 0 0 0 0 0 0
ACTUAL 1.74% MAR OCCURRENCE
EIP, LLC. EIR ACC A OVERLAY
EXCESS RETURNS OVER RUSSELL 3000 ACM CW INDEX
SUMMARY
INVESTMENT
PERFORMANCE
25TH. PERCENTILE
MEDIAN
75TH. PERCENTILE
100TH. PERCENTILE
STATISTICS
1/1/2004 - 12/31/2013
MOST RECENT
1ST. PERCENTILE
September 4, 2014 IVORY DAY JR.
PERIODS OF NEGATIVE RETURNS
RANGE OF RETURNS
INVESTMENT PERFORMANCE HORIZONS
CORE SKEWNESS
PERIOD OF LOWEST RETURNS
ONE YEAR TO TEN YEARS ROLLING QUARTERLY
STANDARD DEVIATION
AVERAGE (ERA)
1ST. HALF AVERAGE
2ND. HALF AVERAGE
NUMBER OF PERIODS
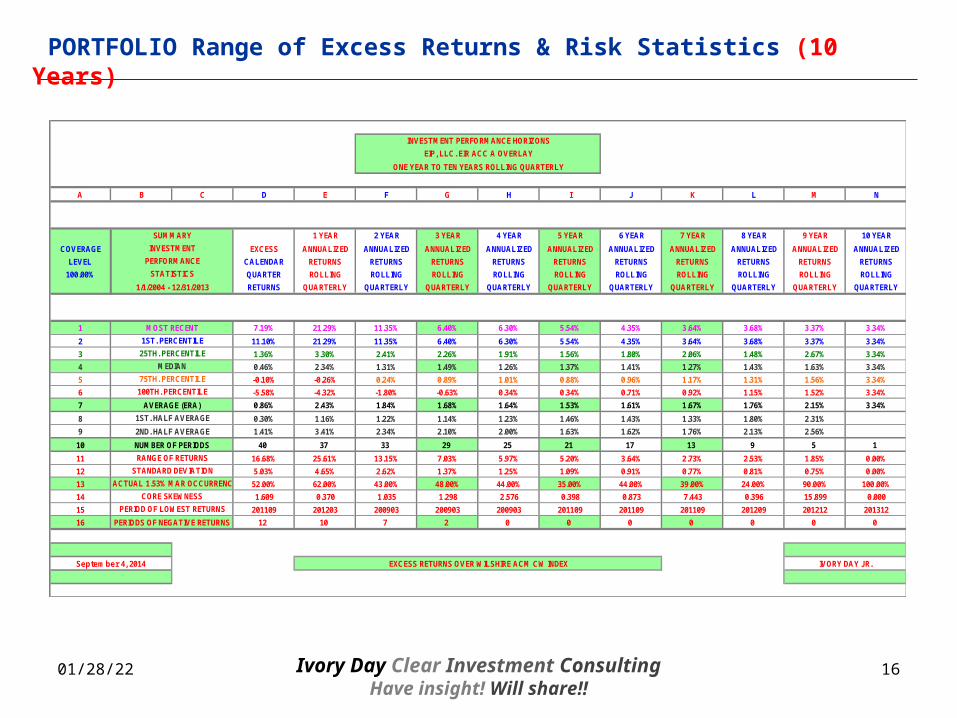
PORTFOLIO Range of Excess Returns & Risk Statistics (10 Years)
Ivory Day Clear Investment Consulting
Have insight! Will share!!
04/20/23 16
BENCHMARK
100.00% ALLOCATION
S&P 500 LEVEL
0.00% 7.50%
T-BILLS
A B C D E F G H I J K L M N
1 YEAR 2 YEAR 3 YEAR 4 YEAR 5 YEAR 6 YEAR 7 YEAR 8 YEAR 9 YEAR 10 YEAR
COVERAGE EXCESS ANNUALIZED ANNUALIZED ANNUALIZED ANNUALIZED ANNUALIZED ANNUALIZED ANNUALIZED ANNUALIZED ANNUALIZED ANNUALIZED
LEVEL CALENDAR RETURNS RETURNS RETURNS RETURNS RETURNS RETURNS RETURNS RETURNS RETURNS RETURNS
100.00% QUARTER ROLLING ROLLING ROLLING ROLLING ROLLING ROLLING ROLLING ROLLING ROLLING ROLLING
RETURNS QUARTERLY QUARTERLY QUARTERLY QUARTERLY QUARTERLY QUARTERLY QUARTERLY QUARTERLY QUARTERLY QUARTERLY
1 7.19% 21.29% 11.35% 6.40% 6.30% 5.54% 4.35% 3.64% 3.68% 3.37% 3.34%
2 11.10% 21.29% 11.35% 6.40% 6.30% 5.54% 4.35% 3.64% 3.68% 3.37% 3.34%
3 1.36% 3.30% 2.41% 2.26% 1.91% 1.56% 1.80% 2.06% 1.48% 2.67% 3.34%
4 0.46% 2.34% 1.31% 1.49% 1.26% 1.37% 1.41% 1.27% 1.43% 1.63% 3.34%
5 -0.10% -0.26% 0.24% 0.89% 1.01% 0.88% 0.96% 1.17% 1.31% 1.56% 3.34%
6 -5.58% -4.32% -1.80% -0.63% 0.34% 0.34% 0.71% 0.92% 1.15% 1.52% 3.34%
7 0.86% 2.43% 1.84% 1.68% 1.64% 1.53% 1.61% 1.67% 1.76% 2.15% 3.34%
8 0.30% 1.16% 1.22% 1.14% 1.23% 1.46% 1.43% 1.33% 1.80% 2.31%
9 1.41% 3.41% 2.34% 2.10% 2.00% 1.63% 1.62% 1.76% 2.13% 2.56%
10 40 37 33 29 25 21 17 13 9 5 1
11 16.68% 25.61% 13.15% 7.03% 5.97% 5.20% 3.64% 2.73% 2.53% 1.85% 0.00%
12 5.03% 4.65% 2.62% 1.37% 1.25% 1.09% 0.91% 0.77% 0.81% 0.75% 0.00%
13 52.00% 62.00% 43.00% 48.00% 44.00% 35.00% 44.00% 39.00% 24.00% 90.00% 100.00%
14 1.609 0.370 1.035 1.298 2.576 0.398 0.873 7.443 0.396 15.899 0.000
15 201109 201203 200903 200903 200903 201109 201109 201109 201209 201212 201312
16 12 10 7 2 0 0 0 0 0 0 0
ACTUAL 1.53% MAR OCCURRENCE
EXCESS RETURNS OVER WILSHIRE ACM CW INDEX
EIP, LLC. EIR ACC A OVERLAY
ONE YEAR TO TEN YEARS ROLLING QUARTERLY
INVESTMENT PERFORMANCE HORIZONS
1ST. HALF AVERAGE
STATISTICS
1/1/2004 - 12/31/2013
25TH. PERCENTILE
MEDIAN
100TH. PERCENTILE
CORE SKEWNESS
2ND. HALF AVERAGE
NUMBER OF PERIODS
SUMMARY
INVESTMENT
PERFORMANCE
AVERAGE (ERA)
IVORY DAY JR.
PERIOD OF LOWEST RETURNS
PERIODS OF NEGATIVE RETURNS
MOST RECENT
1ST. PERCENTILE
September 4, 2014
75TH. PERCENTILE
RANGE OF RETURNS
STANDARD DEVIATION
PORTFOLIO Range of Excess Returns & Risk Statistics (10 Years)

Ivory Day Clear Investment Consulting
Have insight! Will share!!
04/20/23 17
PORTFOLIO RANGE OF NOMINAL RETURNS Quarterly and Annualized Returns Rolling Quarterly
11 Investment Horizons in 10 Years from 1/1/2003 to 12/31/2012
-6.0%
-4.0%
-2.0%
0.0%
2.0%
4.0%
6.0%
8.0%
1 Q / 40 P 1 Y / 37 P 2 Y / 33 P 3 Y / 29 P 4 Y / 25 P 5 Y / 21 P 6 Y / 17 P 7 Y / 13 P 8 Y / 9 P 9 Y / 5 P 10 Y / 1 P
CURRENT 1ST. PERCENTILE 25TH. PERCENTILE MEDIAN 75TH. PERCENTILE 100TH. PERCENTILE AVERAGE
.

Ivory Day Clear Investment Consulting
Have insight! Will share!!
04/20/23 18
PORTFOLIO RANGE OF EXCESS RETURNS vs. RUSSELL 3000 ACM CW INDEX Quarterly and Annualized Returns Rolling Quarterly
11 Investment Horizons in 10 Years from 1/1/2004 to 12/31/2013
-6.0%
-4.0%
-2.0%
0.0%
2.0%
4.0%
6.0%
8.0%
1 Q / 40 P 1 Y / 37 P 2 Y / 33 P 3 Y / 29 P 4 Y / 25 P 5 Y / 21 P 6 Y / 17 P 7 Y / 13 P 8 Y / 9 P 9 Y / 5 P 10 Y / 1 P
CURRENT 1ST. PERCENTILE 25TH. PERCENTILE MEDIAN 75TH. PERCENTILE 100TH. PERCENTILE AVERAGE
.
Ivory Day Clear Investment Consulting
Have insight! Will share!!
04/20/23 19
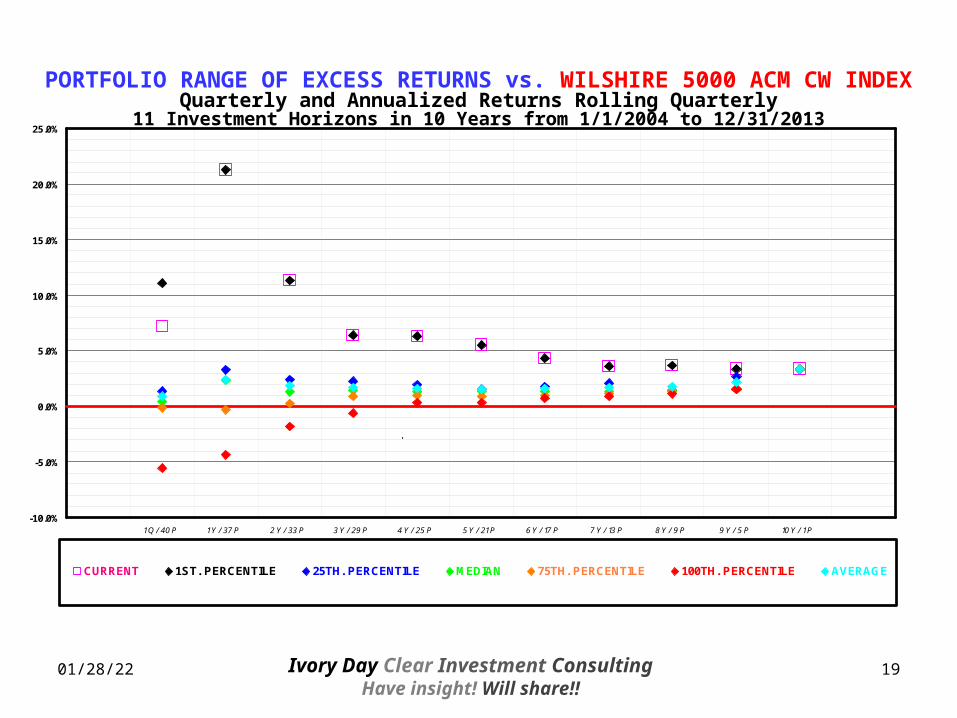
PORTFOLIO RANGE OF EXCESS RETURNS vs. WILSHIRE 5000 ACM CW INDEXQuarterly and Annualized Returns Rolling Quarterly
11 Investment Horizons in 10 Years from 1/1/2004 to 12/31/2013
-10.0%
-5.0%
0.0%
5.0%
10.0%
15.0%
20.0%
25.0%
1 Q / 40 P 1 Y / 37 P 2 Y / 33 P 3 Y / 29 P 4 Y / 25 P 5 Y / 21 P 6 Y / 17 P 7 Y / 13 P 8 Y / 9 P 9 Y / 5 P 10 Y / 1 P
CURRENT 1ST. PERCENTILE 25TH. PERCENTILE MEDIAN 75TH. PERCENTILE 100TH. PERCENTILE AVERAGE
.

Ivory Day Clear Investment Consulting
Have insight! Will share!!
04/20/23 20
RANGE OF EXCESS RETURNS vs. RUSSELL 3000 MARKET INDEXAnnualized Five Years Rolling Quarterly
21 Periods in 10 Years from 1/1/2004 to 12/31/2013
CURRENT 1ST. PERCENTILE25TH. PERCENTILE MEDIAN 75TH. PERCENTILE100TH. PERCENTILEAVERAGE (EAR)
SURZ STYLE PURE U.S. ACT -0.12% 0.83% 0.70% 0.46% -0.12% -0.56% 0.30%
SURZ STYLE PURE U.S. ACV 0.74% 3.49% 2.32% 1.77% 1.46% 0.74% 1.92%
SURZ STYLE PURE U.S. ACC -2.41% 1.68% 1.11% 0.71% 0.35% -2.41% 0.36%
SURZ STYLE PURE U.S. ACG 0.15% 0.15% -1.26% -1.55% -2.51% -3.57% -1.87%
WILSHIRE ACV CW -3.15% 1.92% 0.41% 0.15% -0.74% -3.15% -0.24%
WILSHIRE ACM CW -2.97% 0.64% 0.60% 0.52% 0.22% -2.97% 0.17%
WILSHIRE ACG CW -1.22% 2.92% 2.24% 1.28% 0.44% -1.84% 1.19%
RUSSELL 3000 ACV CW -1.65% 1.26% -1.00% -1.25% -1.99% -2.85% -1.33%
RUSSELL 3000 ACM CW 0.00% 0.00% 0.00% 0.00% -0.00% -0.00% -0.00%
RUSSELL 3000 ACG CW 1.56% 2.78% 1.89% 1.12% 0.81% -1.40% 1.20%
EIP, LLC. EIR ACC A 2.41% 2.68% 2.06% 1.74% 1.32% 0.91% 1.74%
EXCESS RETURNS
Ivory Day Clear Investment Consulting
Have insight! Will share!!
04/20/23 21
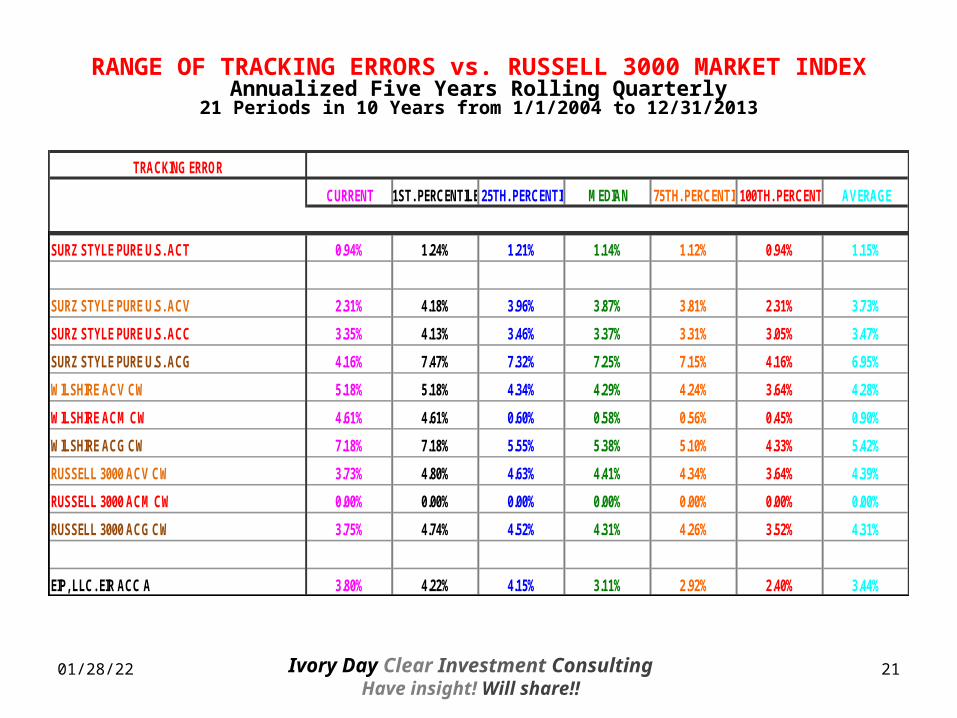
RANGE OF TRACKING ERRORS vs. RUSSELL 3000 MARKET INDEXAnnualized Five Years Rolling Quarterly
21 Periods in 10 Years from 1/1/2004 to 12/31/2013
CURRENT 1ST. PERCENTILE25TH. PERCENTILE MEDIAN 75TH. PERCENTILE100TH. PERCENTILE AVERAGE
SURZ STYLE PURE U.S. ACT 0.94% 1.24% 1.21% 1.14% 1.12% 0.94% 1.15%
SURZ STYLE PURE U.S. ACV 2.31% 4.18% 3.96% 3.87% 3.81% 2.31% 3.73%
SURZ STYLE PURE U.S. ACC 3.35% 4.13% 3.46% 3.37% 3.31% 3.05% 3.47%
SURZ STYLE PURE U.S. ACG 4.16% 7.47% 7.32% 7.25% 7.15% 4.16% 6.95%
WILSHIRE ACV CW 5.18% 5.18% 4.34% 4.29% 4.24% 3.64% 4.28%
WILSHIRE ACM CW 4.61% 4.61% 0.60% 0.58% 0.56% 0.45% 0.90%
WILSHIRE ACG CW 7.18% 7.18% 5.55% 5.38% 5.10% 4.33% 5.42%
RUSSELL 3000 ACV CW 3.73% 4.80% 4.63% 4.41% 4.34% 3.64% 4.39%
RUSSELL 3000 ACM CW 0.00% 0.00% 0.00% 0.00% 0.00% 0.00% 0.00%
RUSSELL 3000 ACG CW 3.75% 4.74% 4.52% 4.31% 4.26% 3.52% 4.31%
EIP, LLC. EIR ACC A 3.80% 4.22% 4.15% 3.11% 2.92% 2.40% 3.44%
TRACKING ERROR

Ivory Day Clear Investment Consulting
Have insight! Will share!!
04/20/23 22
RANGE OF INFORMATION RATIOS vs. RUSSELL 3000 MARKET INDEXAnnualized Five Years Rolling Quarterly
21 Periods in 10 Years from 1/1/2004 to 12/31/2013
CURRENT 1ST. PERCENTILE25TH. PERCENTILE MEDIAN 75TH. PERCENTILE100TH. PERCENTILE AVERAGE
SURZ STYLE PURE U.S. ACT 0.990 0.997 0.996 0.993 0.987 0.983 0.992
SURZ STYLE PURE U.S. ACV 0.985 0.994 0.987 0.984 0.977 0.973 0.983
SURZ STYLE PURE U.S. ACC 0.944 0.984 0.981 0.972 0.967 0.944 0.970
SURZ STYLE PURE U.S. ACG 0.962 0.962 0.922 0.917 0.909 0.899 0.917
WILSHIRE ACV CW 0.921 0.983 0.963 0.960 0.951 0.921 0.957
WILSHIRE ACM CW 0.928 1.001 1.000 0.999 0.998 0.928 0.993
WILSHIRE ACG CW 0.922 0.977 0.969 0.963 0.955 0.922 0.960
RUSSELL 3000 ACV CW 0.948 0.977 0.949 0.946 0.939 0.931 0.945
RUSSELL 3000 ACM CW 1.000 1.000 1.000 1.000 1.000 1.000 1.000
RUSSELL 3000 ACG CW 0.979 0.986 0.977 0.969 0.964 0.952 0.970
EIP, LLC. EIR ACC A 0.987 0.996 0.993 0.989 0.973 0.970 0.984
INFORMATION RATIO
Ivory Day Clear Investment Consulting
Have insight! Will share!!
04/20/23 23
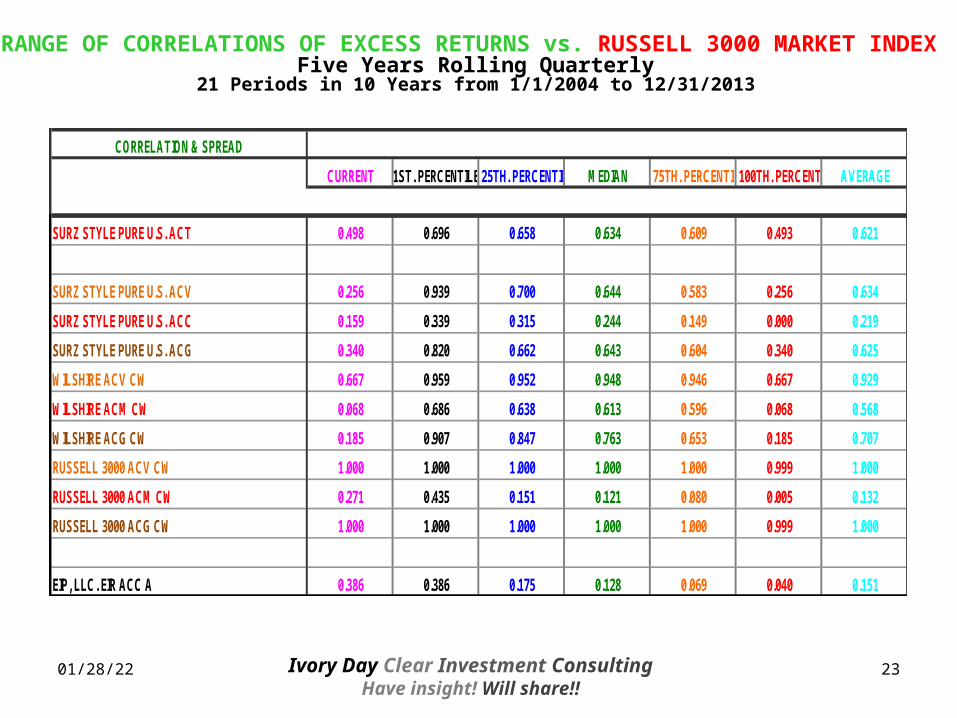
RANGE OF CORRELATIONS OF EXCESS RETURNS vs. RUSSELL 3000 MARKET INDEX Five Years Rolling Quarterly
21 Periods in 10 Years from 1/1/2004 to 12/31/2013
CURRENT 1ST. PERCENTILE25TH. PERCENTILE MEDIAN 75TH. PERCENTILE100TH. PERCENTILE AVERAGE
SURZ STYLE PURE U.S. ACT 0.498 0.696 0.658 0.634 0.609 0.493 0.621
SURZ STYLE PURE U.S. ACV 0.256 0.939 0.700 0.644 0.583 0.256 0.634
SURZ STYLE PURE U.S. ACC 0.159 0.339 0.315 0.244 0.149 0.000 0.219
SURZ STYLE PURE U.S. ACG 0.340 0.820 0.662 0.643 0.604 0.340 0.625
WILSHIRE ACV CW 0.667 0.959 0.952 0.948 0.946 0.667 0.929
WILSHIRE ACM CW 0.068 0.686 0.638 0.613 0.596 0.068 0.568
WILSHIRE ACG CW 0.185 0.907 0.847 0.763 0.653 0.185 0.707
RUSSELL 3000 ACV CW 1.000 1.000 1.000 1.000 1.000 0.999 1.000
RUSSELL 3000 ACM CW 0.271 0.435 0.151 0.121 0.080 0.005 0.132
RUSSELL 3000 ACG CW 1.000 1.000 1.000 1.000 1.000 0.999 1.000
EIP, LLC. EIR ACC A 0.386 0.386 0.175 0.128 0.069 0.040 0.151
CORRELATION & SPREAD

Ivory Day Clear Investment Consulting
Have insight! Will share!!
04/20/23 24
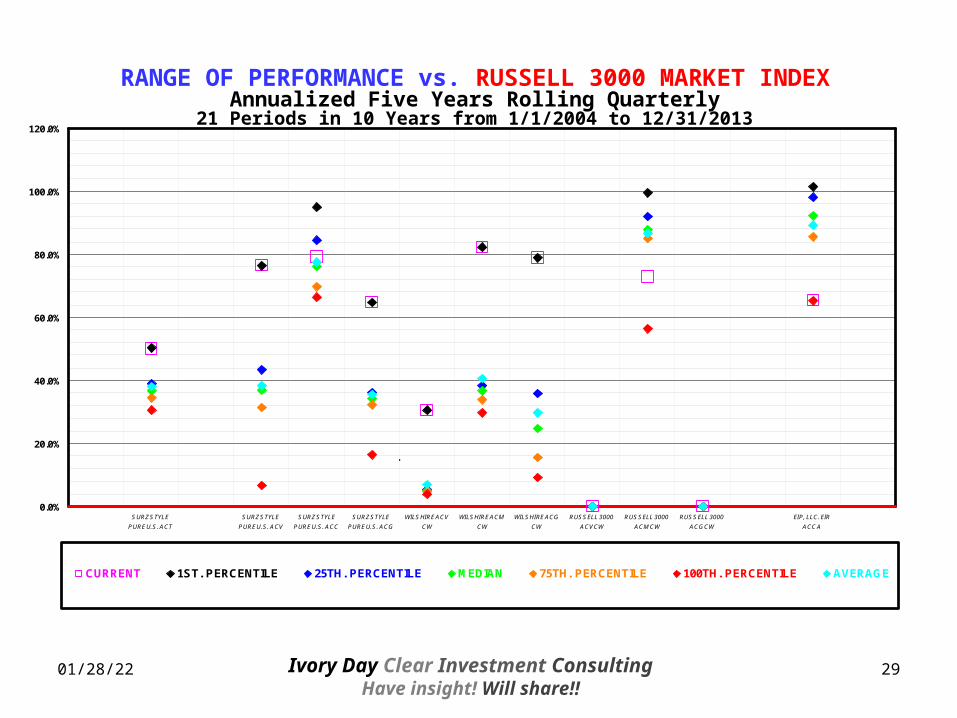
RANGE OF PERFORMANCE vs. RUSSELL 3000 MARKET INDEX Annualized Five Years Rolling Quarterly
21 Periods in 10 Years from 1/1/2004 to 12/31/2013
CURRENT 1ST. PERCENTILE25TH. PERCENTILE MEDIAN 75TH. PERCENTILE100TH. PERCENTILE AVERAGE
SURZ STYLE PURE U.S. ACT 49.96% 50.35% 38.86% 36.58% 34.53% 30.56% 38.01%
SURZ STYLE PURE U.S. ACV 76.26% 76.26% 43.31% 36.81% 31.48% 6.53% 38.20%
SURZ STYLE PURE U.S. ACC 79.17% 95.09% 84.43% 76.22% 69.72% 66.49% 77.55%
SURZ STYLE PURE U.S. ACG 64.82% 64.82% 36.20% 34.10% 32.13% 16.52% 35.49%
WILSHIRE ACV CW 30.56% 30.56% 5.30% 5.13% 4.62% 3.99% 6.83%
WILSHIRE ACM CW 82.24% 82.24% 38.23% 36.64% 33.96% 29.76% 40.43%
WILSHIRE ACG CW 78.85% 78.85% 35.84% 24.75% 15.62% 9.13% 29.65%
RUSSELL 3000 ACV CW 0.01% 0.07% 0.04% 0.04% 0.03% 0.01% 0.04%
RUSSELL 3000 ACM CW 72.90% 99.49% 91.98% 87.88% 84.90% 56.52% 86.77%
RUSSELL 3000 ACG CW 0.01% 0.07% 0.04% 0.04% 0.04% 0.01% 0.04%
EIP, LLC. EIR ACC A 65.30% 101.32% 98.14% 92.17% 85.56% 65.30% 89.20%
PERFORMANCE SUMMARY

Ivory Day Clear Investment Consulting
Have insight! Will share!!
04/20/23 25
RANGE OF EXCESS RETURNS vs. RUSSELL 3000 MARKET INDEXAnnualized Five Years Rolling Quarterly
21 Periods in 10 Years from 1/1/2004 to 12/31/2013
-4.0%
-3.0%
-2.0%
-1.0%
0.0%
1.0%
2.0%
3.0%
4.0%
SURZ STYLE
PURE U.S. ACT
SURZ STYLE
PURE U.S. ACV
SURZ STYLE
PURE U.S. ACC
SURZ STYLE
PURE U.S. ACG
WILSHIRE ACV
CW
WILSHIRE ACM
CW
WILSHIRE ACG
CW
RUSSELL 3000
ACV CW
RUSSELL 3000
ACM CW
RUSSELL 3000
ACG CW
EIP, LLC. EIR
ACC A
CURRENT 1ST. PERCENTILE 25TH. PERCENTILE MEDIAN 75TH. PERCENTILE 100TH. PERCENTILE AVERAGE (EAR)
.

Ivory Day Clear Investment Consulting
Have insight! Will share!!
04/20/23 26
RANGE OF TRACKING ERRORS vs. RUSSELL 3000 MARKET INDEXAnnualized Five Years Rolling Quarterly
21 Periods in 10 Years from 1/1/2004 to 12/31/2013
0.0%
1.0%
2.0%
3.0%
4.0%
5.0%
6.0%
7.0%
8.0%
SURZ STYLE
PURE U.S. ACT
SURZ STYLE
PURE U.S. ACV
SURZ STYLE
PURE U.S. ACC
SURZ STYLE
PURE U.S. ACG
WILSHIRE ACV
CW
WILSHIRE ACM
CW
WILSHIRE ACG
CW
RUSSELL 3000
ACV CW
RUSSELL 3000
ACM CW
RUSSELL 3000
ACG CW
EIP, LLC. EIR ACC
A
CURRENT 1ST. PERCENTILE 25TH. PERCENTILE MEDIAN 75TH. PERCENTILE 100TH. PERCENTILE AVERAGE
.
Ivory Day Clear Investment Consulting
Have insight! Will share!!
04/20/23 27
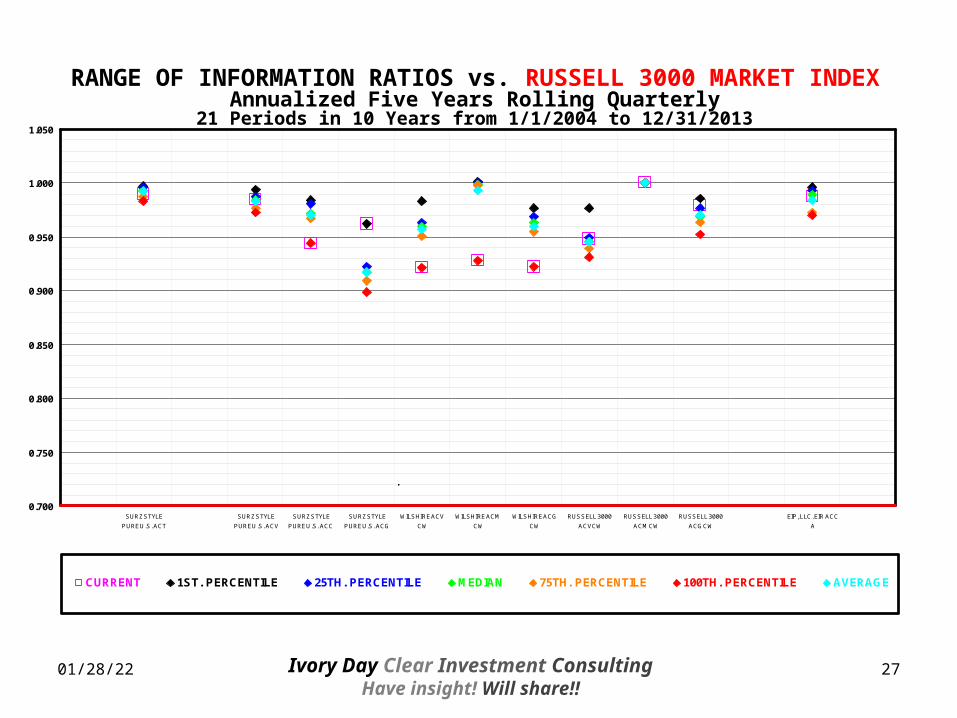
RANGE OF INFORMATION RATIOS vs. RUSSELL 3000 MARKET INDEXAnnualized Five Years Rolling Quarterly
21 Periods in 10 Years from 1/1/2004 to 12/31/2013
0.700
0.750
0.800
0.850
0.900
0.950
1.000
1.050
SURZ STYLE
PURE U.S. ACT
SURZ STYLE
PURE U.S. ACV
SURZ STYLE
PURE U.S. ACC
SURZ STYLE
PURE U.S. ACG
WILSHIRE ACV
CW
WILSHIRE ACM
CW
WILSHIRE ACG
CW
RUSSELL 3000
ACV CW
RUSSELL 3000
ACM CW
RUSSELL 3000
ACG CW
EIP, LLC. EIR ACC
A
CURRENT 1ST. PERCENTILE 25TH. PERCENTILE MEDIAN 75TH. PERCENTILE 100TH. PERCENTILE AVERAGE
.
Ivory Day Clear Investment Consulting
Have insight! Will share!!
04/20/23 28
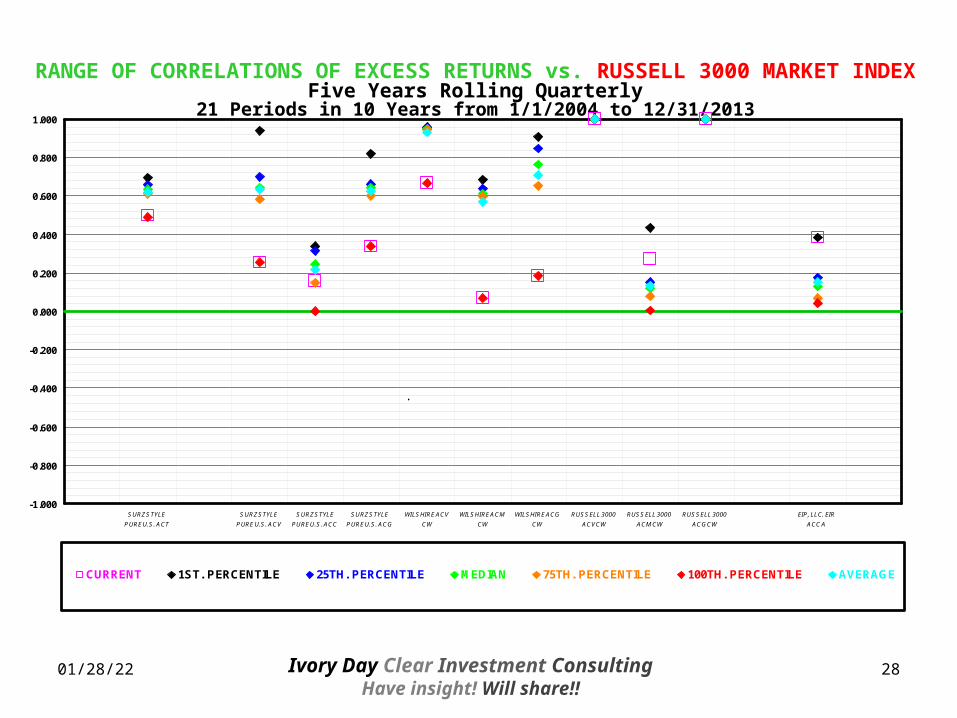
RANGE OF CORRELATIONS OF EXCESS RETURNS vs. RUSSELL 3000 MARKET INDEXFive Years Rolling Quarterly
21 Periods in 10 Years from 1/1/2004 to 12/31/2013
-1.000
-0.800
-0.600
-0.400
-0.200
0.000
0.200
0.400
0.600
0.800
1.000
SURZ STYLE
PURE U.S. ACT
SURZ STYLE
PURE U.S. ACV
SURZ STYLE
PURE U.S. ACC
SURZ STYLE
PURE U.S. ACG
WILSHIRE ACV
CW
WILSHIRE ACM
CW
WILSHIRE ACG
CW
RUSSELL 3000
ACV CW
RUSSELL 3000
ACM CW
RUSSELL 3000
ACG CW
EIP, LLC. EIR
ACC A
CURRENT 1ST. PERCENTILE 25TH. PERCENTILE MEDIAN 75TH. PERCENTILE 100TH. PERCENTILE AVERAGE
.
Ivory Day Clear Investment Consulting
Have insight! Will share!!
04/20/23 29
RANGE OF PERFORMANCE vs. RUSSELL 3000 MARKET INDEXAnnualized Five Years Rolling Quarterly
21 Periods in 10 Years from 1/1/2004 to 12/31/2013
0.0%
20.0%
40.0%
60.0%
80.0%
100.0%
120.0%
SURZ STYLE
PURE U.S. ACT
SURZ STYLE
PURE U.S. ACV
SURZ STYLE
PURE U.S. ACC
SURZ STYLE
PURE U.S. ACG
WILSHIRE ACV
CW
WILSHIRE ACM
CW
WILSHIRE ACG
CW
RUSSELL 3000
ACV CW
RUSSELL 3000
ACM CW
RUSSELL 3000
ACG CW
EIP, LLC. EIR
ACC A
CURRENT 1ST. PERCENTILE 25TH. PERCENTILE MEDIAN 75TH. PERCENTILE 100TH. PERCENTILE AVERAGE
.

Ivory Day Clear Investment Consulting
Have insight! Will share!!
ENHANCED INVESTMENT PARTNERS, LLC – EIR ACC Active Overlay
SDIC Quantitative Investment Performance Analysis Report (10Y201312)
Fidelity to Investment Style (Fit)

Ivory Day Clear Investment Consulting
Have insight! Will share!!
04/20/23 31
-1.000
-0.800
-0.600
-0.400
-0.200
0.000
0.200
0.400
0.600
0.800
1.000
COMBINED
ACV CW
RUSSELL
3000 ACV
CW
SURZ
STYLE
PURE U.S.
ACV
WILSHIRE
ACV CW
COMBINED
ACM CW
RUSSELL
3000 ACM
CW
SURZ
STYLE
PURE U.S.
ACC
WILSHIRE
ACM CW
COMBINED
ACG CW
RUSSELL
3000 ACG
CW
SURZ
STYLE
PURE U.S.
ACG
WILSHIRE
ACG CW
EIP, LLC.
EIR ACC A
RUSSELL
3000 ACV
CW
RUSSELL
3000 ACM
CW
RUSSELL
3000 ACG
CW
CURRENT 1ST. PERCENTILE 25TH. PERCENTILEMEDIAN 75TH. PERCENTILE 100TH. PERCENTILEAVERAGE PERFECT POSITIVE CORRELATION ZERO CORRELATIONPERFECT NEGATIVE CORRELATION
.
RANGE OF SELECTED CORRELATIONS OF NOMINAL RETURNS vs. BENCHMARKSBased on Five Years of Returns Rolling Quarterly
21 Periods in 10 Years from 1/1/2004 to 12/31/2013

Ivory Day Clear Investment Consulting
Have insight! Will share!!
04/20/23 32
SUMMARY OF RESULTS: Don’t Mess with Mr. In Between
1 0.996
2 0.994
3 0.994
4 0.993
5 0.991
6 0.990
7 0.9908 0.989
9 0.988
10 0.988
11 0.987
12 0.985
13 0.985
14 0.984
15 0.984
16 0.983
SURZ STYLE PURE U.S. ACT BENCHMARK
WILSHIRE ACM CW INDEX
RUSSELL 1000 LCM CW INDEX
WILSHIRE LCM CW INDEX
COMBINED LCM CW BENCHMARK
SURZ STYLE PURE U.S. MCT BENCHMARK
EIP, LLC. EIR ACC A OVERLAY VS. NOMINAL 0 BENCHMARK
RUSSELL 2500 SMCM CW INDEX
WILSHIRE SCM CW INDEX
SURZ STYLE PURE U.S. ACC BENCHMARK
WILSHIRE MCM CW INDEX
FIRST QUARTILE AVERAGE NOMINAL RETURN CORRELATIONS
COMBINED ACM CW BENCHMARK
RUSSELL 3000 ACM CW INDEX
S&P 500 LCM CW INDEX
SURZ STYLE PURE U.S. SCC BENCHMARK
RUSSELL 800 MCM CW INDEX
COMBINED MCM CW BENCHMARK

Ivory Day Clear Investment Consulting
Have insight! Will share!!
04/20/23 33
SUMMARY OF RESULTS: Don’t Mess with Mr. In Between
17 0.983
18 0.983
19 0.983
20 0.982
21 0.981
22 0.981
23 0.979
24 0.979
25 0.977
26 0.977
27 0.977
28 0.977
29 0.976
30 0.976
31 0.976
32 0.975
RUSSELL 2000 SCG CW INDEX
WILSHIRE SCG CW INDEX
WILSHIRE ACV CW INDEX
SURZ STYLE PURE U.S. SCT BENCHMARK
SURZ STYLE PURE U.S. LCC BENCHMARK
S&P 600 SCG CW INDEX
RUSSELL 800 MCV CW INDEX
COMBINED MCV CW BENCHMARK
COMBINED SCM CW BENCHMARK
S&P 400 MCM CW INDEX
RUSSELL 2500 SMCG CW INDEX
COMBINED ACV CW BENCHMARK
SECOND QUARTILE AVERAGE NOMINAL RETURN CORRELATIONS
EIP, LLC. EIR ACC A OVERLAY VS. NOMINAL 0 BENCHMARK
COMBINED ACG CW BENCHMARK
S&P 400 MCV CW INDEX
SURZ STYLE PURE U.S. LCT BENCHMARK
COMBINED SCG CW BENCHMARK

Ivory Day Clear Investment Consulting
Have insight! Will share!!
04/20/23 34
SUMMARY OF RESULTS: Don’t Mess with Mr. In Between
33 0.974
34 0.974
35 0.974
36 0.974
37 0.974
38 0.973
39 0.972
40 0.972
41 0.970
42 0.970
43 0.969
44 0.968
45 0.968
46 0.967
47 0.965
48 0.963
S&P 600 SCM CW INDEX
COMBINED LCG CW BENCHMARK
WILSHIRE LCV CW INDEX
S&P 500 LCG CW INDEX
RUSSELL 2000 SCM CW INDEX
RUSSELL 1000 LCV CW INDEX
THIRD QUARTILE AVERAGE NOMINAL RETURN CORRELATIONS
EIP, LLC. EIR ACC A OVERLAY VS. NOMINAL 0 BENCHMARK
WILSHIRE MCV CW INDEX
RUSSELL 3000 ACG CW INDEX
SURZ STYLE PURE U.S. MCC BENCHMARK
WILSHIRE LCG CW INDEX
RUSSELL 3000 ACV CW INDEX
SURZ STYLE PURE U.S. MCV BENCHMARK
SURZ STYLE PURE U.S. ACV BENCHMARK
WILSHIRE ACG CW INDEX
S&P 500 LCV CW INDEX
COMBINED LCV CW BENCHMARK

Ivory Day Clear Investment Consulting
Have insight! Will share!!
04/20/23 35
SUMMARY OF RESULTS: Don’t Mess with Mr. In Between
49 0.962
50 0.962
51 0.961
52 0.960
53 0.960
54 0.959
55 0.958
56 0.956
57 0.955
58 0.953
59 0.948
60 0.948
61 0.945
62 0.942
63 0.941
64 0.925
SURZ STYLE PURE U.S. SCV BENCHMARK
S&P 400 MCG CW INDEX
SURZ STYLE PURE U.S. LCG BENCHMARK
RUSSELL 2000 SCV CW INDEX
SURZ STYLE PURE U.S. MCG BENCHMARK
COMBINED SCV CW BENCHMARK
S&P 600 SCV CW INDEX
SURZ STYLE PURE U.S. SCG BENCHMARK
COMBINED MCG CW BENCHMARK
WILSHIRE MCG CW INDEX
WILSHIRE SCV CW INDEX
RUSSELL 800 MCG CW INDEX
SURZ STYLE PURE U.S. ACG BENCHMARK
SURZ STYLE PURE U.S. LCV BENCHMARK
RUSSELL 2500 SMCV CW INDEX
RUSSELL 1000 LCG CW INDEX
EIP, LLC. EIR ACC A OVERLAY VS. NOMINAL 0 BENCHMARK
FOURTH QUARTILE AVERAGE NOMINAL RETURN CORRELATIONS

Ivory Day Clear Investment Consulting
Have insight! Will share!!
04/20/23 36
-1.000
-0.800
-0.600
-0.400
-0.200
0.000
0.200
0.400
0.600
0.800
1.000
COMBINED
ACV CW
RUSSELL
3000 ACV
CW
SURZ STYLE
PURE U.S.
ACV
WILSHIRE
ACV CW
COMBINED
ACM CW
RUSSELL
3000 ACM
CW
SURZ STYLE
PURE U.S.
ACC
WILSHIRE
ACM CW
COMBINED
ACG CW
RUSSELL
3000 ACG
CW
SURZ STYLE
PURE U.S.
ACG
WILSHIRE
ACG CW
EIP, LLC. EIR
ACC A
RUSSELL
3000 ACV
CW
RUSSELL
3000 ACM
CW
RUSSELL
3000 ACG
CW
CURRENT 1ST. PERCENTILE 25TH. PERCENTILEMEDIAN 75TH. PERCENTILE 100TH. PERCENTILEAVERAGE PERFECT POSITIVE CORRELATION ZERO CORRELATIONPERFECT NEGATIVE CORRELATION
.
RANGE OF SELECTED CORRELATIONS OF EXCESS RETURNS vs. BENCHMARKSBased on Five Years of Returns Rolling Quarterly
21 Periods in 10 Years from 1/1/2004 to 12/31/2013

Ivory Day Clear Investment Consulting
Have insight! Will share!!
04/20/23 37
SUMMARY OF RESULTS: Don’t Mess with Mr. In Between
1 0.840
2 0.838
3 0.836
4 0.820
5 0.819
6 0.813
7 0.7958 0.780
9 0.771
10 0.760
11 0.726
12 0.704
13 0.701
14 0.700
15 0.699
16 0.695
WILSHIRE SCM CW INDEX
RUSSELL 2500 SMCM CW INDEX
WILSHIRE SCG CW INDEX
RUSSELL 2000 SCG CW INDEX
SURZ STYLE PURE U.S. SCT BENCHMARK
WILSHIRE MCM CW INDEX
EIP, LLC. EIR ACC A OVERLAY VS. RUSSELL 3000 ACM CW INDEX
SURZ STYLE PURE U.S. SCC BENCHMARK
COMBINED MCM CW BENCHMARK
RUSSELL 2500 SMCG CW INDEX
S&P 400 MCV CW INDEX
FIRST QUARTILE AVERAGE EXCESS RETURN CORRELATIONS
COMBINED SCG CW BENCHMARK
COMBINED ACM CW BENCHMARK
SURZ STYLE PURE U.S. SCG BENCHMARK
COMBINED SCM CW BENCHMARK
RUSSELL 2000 SCM CW INDEX
RUSSELL 800 MCM CW INDEX

Ivory Day Clear Investment Consulting
Have insight! Will share!!
04/20/23 38
SUMMARY OF RESULTS: Don’t Mess with Mr. In Between
17 0.678
18 0.677
19 0.658
20 0.642
21 0.629
22 0.612
23 0.592
24 0.567
25 0.554
26 0.551
27 0.550
28 0.519
29 0.517
30 0.506
31 0.500
32 0.497
WILSHIRE MCG CW INDEX
COMBINED SCV CW BENCHMARK
WILSHIRE MCV CW INDEX
SURZ STYLE PURE U.S. MCV BENCHMARK
COMBINED ACV CW BENCHMARK
S&P 600 SCV CW INDEX
S&P 400 MCM CW INDEX
S&P 600 SCM CW INDEX
WILSHIRE SCV CW INDEX
COMBINED ACG CW BENCHMARK
RUSSELL 2500 SMCV CW INDEX
SURZ STYLE PURE U.S. SCV BENCHMARK
SECOND QUARTILE AVERAGE EXCESS RETURN CORRELATIONS
EIP, LLC. EIR ACC A OVERLAY VS. RUSSELL 3000 ACM CW INDEX
RUSSELL 800 MCV CW INDEX
S&P 600 SCG CW INDEX
COMBINED MCV CW BENCHMARK
SURZ STYLE PURE U.S. MCT BENCHMARK
Ivory Day Clear Investment Consulting
Have insight! Will share!!
04/20/23 39
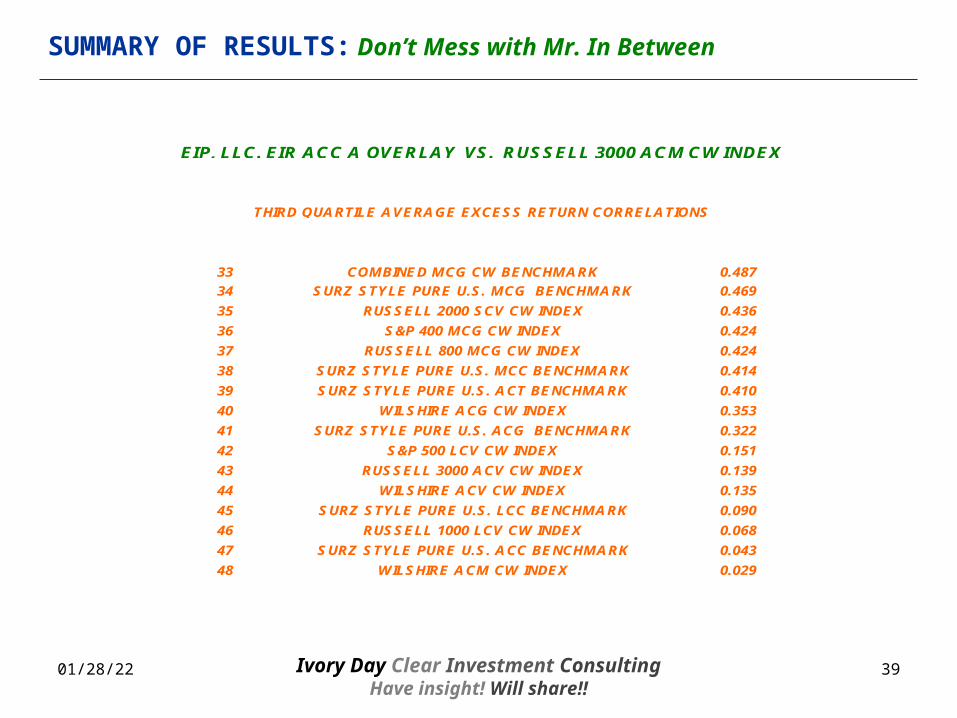
SUMMARY OF RESULTS: Don’t Mess with Mr. In Between
33 0.487
34 0.469
35 0.436
36 0.424
37 0.424
38 0.414
39 0.410
40 0.353
41 0.322
42 0.151
43 0.139
44 0.135
45 0.090
46 0.068
47 0.043
48 0.029
SURZ STYLE PURE U.S. LCC BENCHMARK
RUSSELL 1000 LCV CW INDEX
SURZ STYLE PURE U.S. ACC BENCHMARK
WILSHIRE ACM CW INDEX
COMBINED MCG CW BENCHMARK
SURZ STYLE PURE U.S. MCG BENCHMARK
THIRD QUARTILE AVERAGE EXCESS RETURN CORRELATIONS
EIP, LLC. EIR ACC A OVERLAY VS. RUSSELL 3000 ACM CW INDEX
RUSSELL 3000 ACV CW INDEX
WILSHIRE ACV CW INDEX
SURZ STYLE PURE U.S. ACG BENCHMARK
S&P 500 LCV CW INDEX
RUSSELL 2000 SCV CW INDEX
S&P 400 MCG CW INDEX
RUSSELL 800 MCG CW INDEX
SURZ STYLE PURE U.S. MCC BENCHMARK
SURZ STYLE PURE U.S. ACT BENCHMARK
WILSHIRE ACG CW INDEX

Ivory Day Clear Investment Consulting
Have insight! Will share!!
04/20/23 40
SUMMARY OF RESULTS: Don’t Mess with Mr. In Between
49 -0.011
50 -0.014
51 -0.035
52 -0.081
53 -0.150
54 -0.190
55 -0.260
56 -0.260
57 -0.313
58 -0.492
59 -0.567
60 -0.610
61 -0.734
62 -0.738
63 -0.792
64 -0.823
COMBINED LCG CW BENCHMARK
WILSHIRE LCM CW INDEX
COMBINED LCM CW BENCHMARK
S&P 500 LCM CW INDEX
S&P 500 LCG CW INDEX
SURZ STYLE PURE U.S. LCV BENCHMARK
RUSSELL 1000 LCM CW INDEX
SURZ STYLE PURE U.S. LCT BENCHMARK
WILSHIRE LCG CW INDEX
RUSSELL 3000 ACM CW INDEX
RUSSELL 3000 ACG CW INDEX
SURZ STYLE PURE U.S. ACV BENCHMARK
WILSHIRE LCV CW INDEX
RUSSELL 1000 LCG CW INDEX
SURZ STYLE PURE U.S. LCG BENCHMARK
COMBINED LCV CW BENCHMARK
EIP, LLC. EIR ACC A OVERLAY VS. RUSSELL 3000 ACM CW INDEX
FOURTH QUARTILE AVERAGE EXCESS RETURN CORRELATIONS

Ivory Day Clear Investment Consulting
Have insight! Will share!!
04/20/23 41
RANGE OF FIRST QUARTILE CORRELATIONS OF EXCESS RETURNS vs. BENCHMARKSBased on Five Years of Returns Rolling Quarterly21 Periods in 10 Years from 1/1/2004 to 12/31/2013
-1.000
-0.800
-0.600
-0.400
-0.200
0.000
0.200
0.400
0.600
0.800
1.000
COMBINED
SCG CW
COMBINED
ACM CW
WILSHIRE
SCM CW
RUSSELL
2500
SMCM CW
WILSHIRE
SCG CW
RUSSELL
2000 SCG
CW
SURZ
STYLE
PURE U.S.
SCT
SURZ
STYLE
PURE U.S.
SCC
SURZ
STYLE
PURE U.S.
SCG
COMBINED
SCM CW
RUSSELL
2000 SCM
CW
RUSSELL
800 MCM
CW
WILSHIRE
MCM CW
COMBINED
MCM CW
RUSSELL
2500 SMCG
CW
S&P 400
MCV CW
CURRENT 1ST. PERCENTILE 25TH. PERCENTILEMEDIAN 75TH. PERCENTILE 100TH. PERCENTILEAVERAGE PERFECT POSITIVE CORRELATION ZERO CORRELATIONPERFECT NEGATIVE CORRELATION
.

Ivory Day Clear Investment Consulting
Have insight! Will share!!
04/20/23 42
RANGE OF SECOND QUARTILE CORRELATIONS OF EXCESS RETURNS vs. BENCHMARKSBased on Five Years of Returns Rolling Quarterly21 Periods in 10 Years from 1/1/2004 to 12/31/2013
-1.000
-0.800
-0.600
-0.400
-0.200
0.000
0.200
0.400
0.600
0.800
1.000
RUSSELL
800 MCV CW
S&P 600
SCG CW
COMBINED
MCV CW
SURZ STYLE
PURE U.S.
MCT
S&P 400
MCM CW
S&P 600
SCM CW
WILSHIRE
SCV CW
COMBINED
ACG CW
RUSSELL
2500 SMCV
CW
SURZ STYLE
PURE U.S.
SCV
WILSHIRE
MCG CW
COMBINED
SCV CW
WILSHIRE
MCV CW
SURZ STYLE
PURE U.S.
MCV
COMBINED
ACV CW
S&P 600
SCV CW
CURRENT 1ST. PERCENTILE 25TH. PERCENTILEMEDIAN 75TH. PERCENTILE 100TH. PERCENTILEAVERAGE PERFECT POSITIVE CORRELATION ZERO CORRELATIONPERFECT NEGATIVE CORRELATION
.
Ivory Day Clear Investment Consulting
Have insight! Will share!!
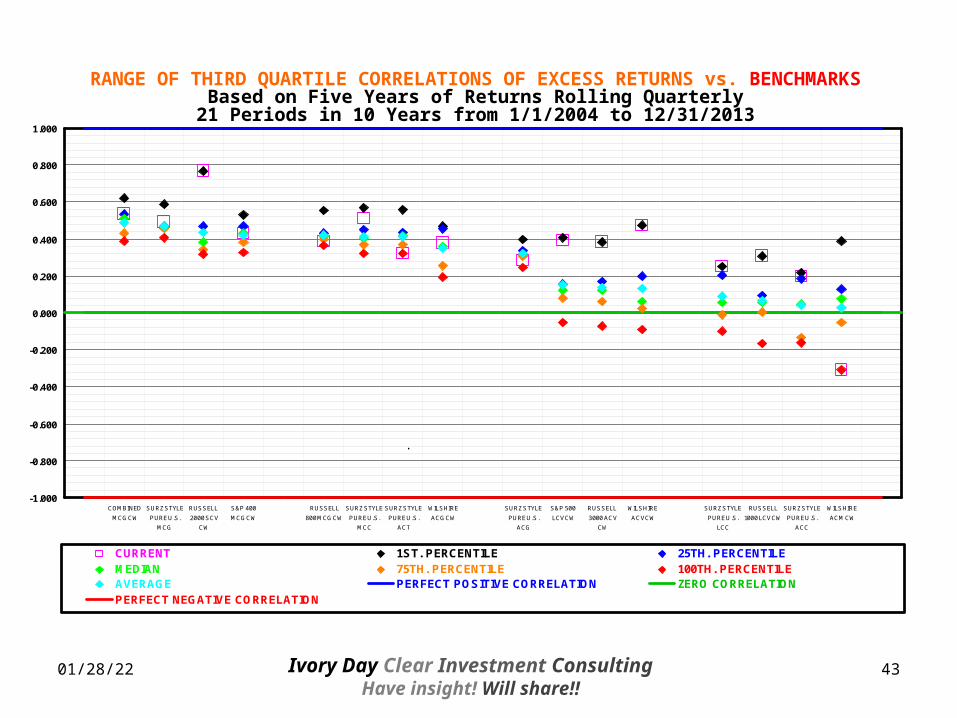
04/20/23 43
RANGE OF THIRD QUARTILE CORRELATIONS OF EXCESS RETURNS vs. BENCHMARKSBased on Five Years of Returns Rolling Quarterly21 Periods in 10 Years from 1/1/2004 to 12/31/2013
-1.000
-0.800
-0.600
-0.400
-0.200
0.000
0.200
0.400
0.600
0.800
1.000
COMBINED
MCG CW
SURZ STYLE
PURE U.S.
MCG
RUSSELL
2000 SCV
CW
S&P 400
MCG CW
RUSSELL
800 MCG CW
SURZ STYLE
PURE U.S.
MCC
SURZ STYLE
PURE U.S.
ACT
WILSHIRE
ACG CW
SURZ STYLE
PURE U.S.
ACG
S&P 500
LCV CW
RUSSELL
3000 ACV
CW
WILSHIRE
ACV CW
SURZ STYLE
PURE U.S.
LCC
RUSSELL
1000 LCV CW
SURZ STYLE
PURE U.S.
ACC
WILSHIRE
ACM CW
CURRENT 1ST. PERCENTILE 25TH. PERCENTILEMEDIAN 75TH. PERCENTILE 100TH. PERCENTILEAVERAGE PERFECT POSITIVE CORRELATION ZERO CORRELATIONPERFECT NEGATIVE CORRELATION
.

Ivory Day Clear Investment Consulting
Have insight! Will share!!
04/20/23 44
RANGE OF FOURTH QUARTILE CORRELATIONS OF EXCESS RETURNS vs. BENCHMARKSBased on Five Years of Returns Rolling Quarterly21 Periods in 10 Years from 1/1/2004 to 12/31/2013
-1.000
-0.800
-0.600
-0.400
-0.200
0.000
0.200
0.400
0.600
0.800
1.000
SURZ STYLE
PURE U.S.
LCG
COMBINED
LCV CW
WILSHIRE
LCG CW
RUSSELL
3000 ACM
CW
RUSSELL
3000 ACG
CW
SURZ STYLE
PURE U.S.
ACV
WILSHIRE
LCV CW
RUSSELL
1000 LCG
CW
COMBINED
LCG CW
WILSHIRE
LCM CW
S&P 500
LCG CW
SURZ STYLE
PURE U.S.
LCV
RUSSELL
1000 LCM
CW
SURZ STYLE
PURE U.S.
LCT
COMBINED
LCM CW
S&P 500
LCM CW
CURRENT 1ST. PERCENTILE 25TH. PERCENTILEMEDIAN 75TH. PERCENTILE 100TH. PERCENTILEAVERAGE PERFECT POSITIVE CORRELATION ZERO CORRELATIONPERFECT NEGATIVE CORRELATION
.

Ivory Day Clear Investment Consulting
Have insight! Will share!!
04/20/23 45
CORRELATION OF EXCESS RETURNS vs. RUSSELL 3000 ACM CW INDEXBased on Annualized Five Years of Returns Rolling Quarterly
21 Periods in 10 Years from 1/1/2004 to 12/31/2013
-1.500
-1.000
-0.500
0.000
0.500
1.000
1.500
200812 200903 200906 200909 200912 201003 201006 201009 201012 201103 201106 201109 201112 201203 201206 201209 201212 201303 201306 201309 201312 AVERAGE
EIP, LLC. EIR ACC A EXCESS RUSSELL 3000 ACV CWRUSSELL 3000 ACG CW PERFECT POSITIVE CORRELATIONPERFECT NEGATIVE CORRELATION ZERO CORRELATION
Ivory Day Clear Investment Consulting
Have insight! Will share!!
04/20/23 46
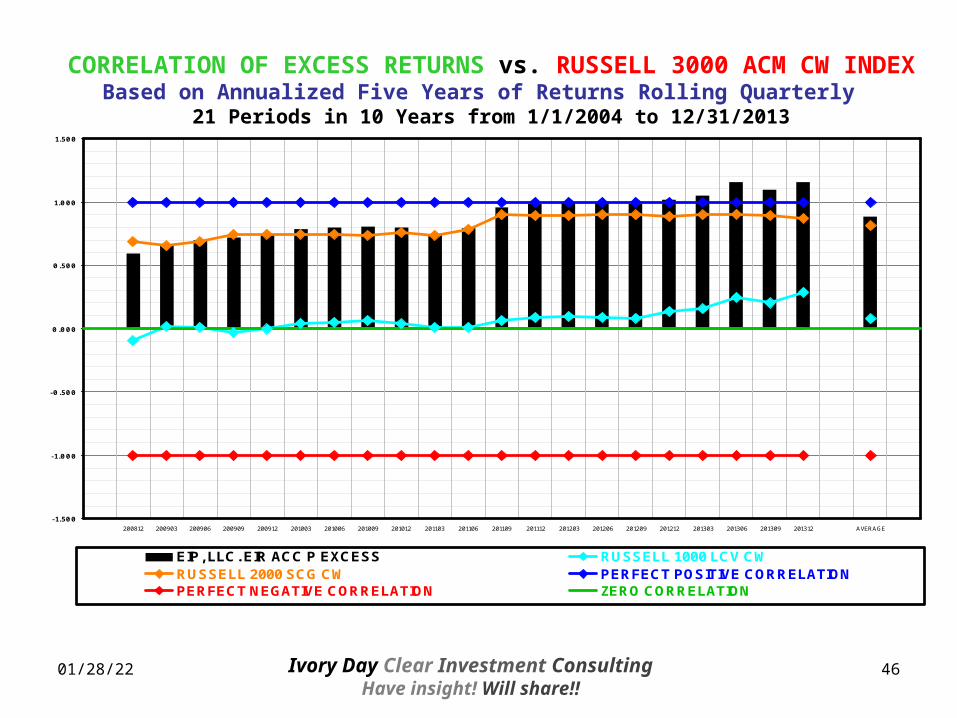
CORRELATION OF EXCESS RETURNS vs. RUSSELL 3000 ACM CW INDEXBased on Annualized Five Years of Returns Rolling Quarterly
21 Periods in 10 Years from 1/1/2004 to 12/31/2013
-1.500
-1.000
-0.500
0.000
0.500
1.000
1.500
200812 200903 200906 200909 200912 201003 201006 201009 201012 201103 201106 201109 201112 201203 201206 201209 201212 201303 201306 201309 201312 AVERAGE
EIP, LLC. EIR ACC P EXCESS RUSSELL 1000 LCV CWRUSSELL 2000 SCG CW PERFECT POSITIVE CORRELATIONPERFECT NEGATIVE CORRELATION ZERO CORRELATION

Ivory Day Clear Investment Consulting
Have insight! Will share!!
ENHANCED INVESTMENT PARTNERS, LLC – EIR ACC Active Overlay
SDIC Quantitative Investment Performance Analysis Report (10Y201312)
Investment Performance Comparisons

Ivory Day Clear Investment Consulting
Have insight! Will share!!
04/20/23 48
SUMMARY OF RESULTS: SUMMARY OF RESULTS: PositivePositive In-BetweenIn-Between NegativeNegative
ENHANCED INVESTMENT PARTNERS, LLC – EIR ACM vs. RUSSELL 3000 ACM CW INDEX Large positive average excess returns relative to the benchmark.(Page 65)
o Positive excess returns relative to the benchmark for 21 of 21 rolling 5 year periods. (Page 60) o Positive excess returns relative to the benchmark for 29 of 29 rolling 3 year periods. (Page 59) o Positive excess returns relative to the benchmark for 30 of 37 rolling 1 year periods. (Page 58)
Low average tracking error and small range relative to the benchmark.(Page 67) Moderately high average information ratio relative to the benchmark.(Page 68) Small positive average excess return correlation range relative to the benchmark.(Page 69) Large positive average performance summary relative to the benchmark.(Page 70)

Ivory Day Clear Investment Consulting
Have insight! Will share!!
04/20/23 49
Enhanced Investment Partners, LLC. EIR ACC A Enhanced Investment Partners, LLC. EIR ACC A Value AddedValue Added for for Plan ParticipantsPlan Participants
The Bottom Line:10 Year Average = $8.4 Million per YearThe Bottom Line:10 Year Average = $8.4 Million per Year
Cumulative Dollars for Multiple Years Ending 12/31/2013 Include All Cumulative Dollars for Multiple Years Ending 12/31/2013 Include All ShorterShorter Period DollarsPeriod Dollars$100,000,000 1 Year 3 Years 5 Years 10 Years Ending Value = $252,156,614
-$27,200,944 -$39,859,183 -$79,833,519 -$57,072,680 Policy Performance
-$27,606,103 -$39,859,183 -$74,483,378 -$45,302,361 Policy Performance
$0 $0 $0 $0 Policy Performance
$405,160 $0 -$5,350,141 -$11,770,319 Benchmark Index Performance
$0 $0 $0 $0 Benchmark Index Performance
$27,606,103 $39,859,183 $74,483,378 $45,302,361 Benchmark Index Performance
$0 $0 $0 $0 Manager Universe Performance
-$405,160 $0 $5,350,141 $11,770,319 Manager Universe Performance
$27,200,944 $39,859,183 $79,833,519 $57,072,680 Manager Universe Performance
$6,574,636 $1,103,008 -$10,292,973 $26,682,650 Actual Performance
$6,169,476 $1,103,008 -$4,942,833 $38,452,969 Actual Performance
$33,775,579 $40,962,190 $69,540,546 $83,755,330 Actual Performance
*Wilshire AENU Median represents the median of the Wilshire All Equity Neutral Universe. **ARA 8.00% MAR Benchmark: Represents the designated portion of the 88 year return composite of 59.64% S&P 500 Index + 40.36% 91 Day Treasury Bills.
1/1/2004 Beginning Value =
Excess $ Over ARA 8.00% MAR Benchmark**
Excess $ Over Wilshire AENU Median*
Excess $ Over Russell 3000 ACM CW
Excess $ Over Wilshire AENU Median*
Excess $ Over Russell 3000 ACM CW
Excess $ Over ARA 8.00% MAR Benchmark**
Excess $ Over Russell 3000 ACM CW
Excess $ Over ARA 8.00% MAR Benchmark**
Excess $ Over Russell 3000 ACM CW
Excess $ Over ARA 8.00% MAR Benchmark**
Excess $ Over Wilshire AENU Median*
Excess $ Over Wilshire AENU Median*

Ivory Day Clear Investment Consulting
Have insight! Will share!!
04/20/23 50
NOMINAL and EXCESS RETURNS vs. MARKET BENCHMARKQuarterly Returns
40 Periods in 10 Years from 1/1/2004 to 12/31/2013
-30.0%
-20.0%
-10.0%
0.0%
10.0%
20.0%
30.0%
EIP, LLC. EIR ACC A EXCESS EIP, LLC. EIR ACC A RUSSELL 3000 ACM CW

Ivory Day Clear Investment Consulting
Have insight! Will share!!
04/20/23 51
NOMINAL and EXCESS RETURNS vs. MARKET BENCHMARKCumulative Quarterly Returns
40 Periods in 10 Years from 1/1/2004 to 12/31/2013
-50.0%
0.0%
50.0%
100.0%
150.0%
200.0%
EXCESS EIP, LLC. EIR ACC A RUSSELL 3000 ACM CW

Ivory Day Clear Investment Consulting
Have insight! Will share!!
04/20/23 52
NOMINAL and EXCESS DOLLARS vs. MARKET BENCHMARKCumulative Quarterly Dollars
40 Periods in 10 Years from 1/1/2004 to 12/31/2013
$0
$50,000,000
$100,000,000
$150,000,000
$200,000,000
$250,000,000
$300,000,000
EXCESS EIP, LLC. EIR ACC A RUSSELL 3000 ACM CW

Ivory Day Clear Investment Consulting
Have insight! Will share!!
04/20/23 53
NOMINAL and EXCESS RETURNS vs. MARKET BENCHMARKQuarterly Returns
40 Periods in 10 Years from 1/1/2004 to 12/31/2013
QUARTERLY
RETURN
PERIODS EIP, LLC. EIR ACC ARUSSELL 3000 ACM CWEXCESS
1 200403 4.03% 2.23% 1.76%
2 200406 1.44% 1.33% 0.11%
3 200409 -0.84% -1.90% 1.08%
4 200412 11.63% 10.16% 1.34%
5 200503 -2.27% -2.20% -0.07%
6 200506 3.15% 2.24% 0.89%
7 200509 4.43% 4.01% 0.40%
8 200512 1.94% 2.04% -0.10%
9 200603 8.13% 5.32% 2.67%
10 200606 -1.77% -1.98% 0.22%
11 200609 4.67% 4.64% 0.02%
12 200612 8.32% 7.12% 1.12%
13 200703 1.82% 1.27% 0.54%
14 200706 5.39% 5.77% -0.35%
15 200709 1.83% 1.55% 0.27%
16 200712 -2.70% -3.34% 0.66%
17 200803 -10.04% -9.52% -0.58%
18 200806 0.48% -1.69% 2.21%
19 200809 -8.36% -8.73% 0.40%
20 200812 -25.46% -22.78% -3.46%

Ivory Day Clear Investment Consulting
Have insight! Will share!!
04/20/23 54
NOMINAL and EXCESS RETURNS vs. MARKET BENCHMARKQuarterly Returns
40 Periods in 10 Years from 1/1/2004 to 12/31/2013
21 200903 -11.37% -10.80% -0.64%
22 200906 20.78% 16.82% 3.39%
23 200909 17.67% 16.31% 1.17%
24 200912 5.34% 5.90% -0.53%
25 201003 8.85% 5.94% 2.75%
26 201006 -10.51% -11.32% 0.91%
27 201009 11.28% 11.53% -0.22%
28 201012 14.91% 11.59% 2.98%
29 201103 7.54% 6.38% 1.09%
30 201106 -1.48% -0.03% -1.45%
31 201109 -19.78% -15.28% -5.31%
32 201112 15.20% 12.12% 2.74%
33 201203 12.67% 12.87% -0.17%
34 201206 -3.13% -3.15% 0.01%
35 201209 6.21% 6.24% -0.03%
36 201212 2.35% 0.25% 2.09%
37 201303 12.38% 11.07% 1.18%
38 201306 3.31% 2.69% 0.60%
39 201309 8.44% 6.35% 1.97%
40 201312 9.83% 10.10% -0.24%
41 AVERAGE 2.91% 2.28% 0.62%

Ivory Day Clear Investment Consulting
Have insight! Will share!!
04/20/23 55
NOMINAL and EXCESS RETURNS vs. MARKET BENCHMARKCumulative Quarterly Returns
40 Periods in 10 Years from 1/1/2004 to 12/31/2013
CUMULATIVE
RETURN
PERIODS EIP, LLC. EIR ACC ARUSSELL 3000 ACM CWEXCESS
1 200403 4.03% 2.23% 1.76%
2 200406 5.53% 3.59% 1.87%
3 200409 4.64% 1.62% 2.97%
4 200412 16.82% 11.95% 4.35%
5 200503 14.16% 9.48% 4.27%
6 200506 17.76% 11.94% 5.20%
7 200509 22.97% 16.42% 5.63%
8 200512 25.36% 18.80% 5.52%
9 200603 35.55% 25.12% 8.34%
10 200606 33.16% 22.64% 8.57%
11 200609 39.37% 28.33% 8.60%
12 200612 50.96% 37.47% 9.81%
13 200703 53.70% 39.22% 10.41%
14 200706 61.99% 47.25% 10.01%
15 200709 64.96% 49.53% 10.32%
16 200712 60.51% 44.54% 11.05%
17 200803 44.39% 30.78% 10.41%
18 200806 45.08% 28.57% 12.85%
19 200809 32.95% 17.34% 13.30%
20 200812 -0.89% -9.39% 9.38%

Ivory Day Clear Investment Consulting
Have insight! Will share!!
04/20/23 56
NOMINAL and EXCESS RETURNS vs. MARKET BENCHMARKCumulative Quarterly Returns
40 Periods in 10 Years from 1/1/2004 to 12/31/2013
21 200903 -12.16% -19.17% 8.67%
22 200906 6.09% -5.58% 12.36%
23 200909 24.84% 9.82% 13.67%
24 200912 31.51% 16.30% 13.08%
25 201003 43.15% 23.21% 16.18%
26 201006 28.10% 9.26% 17.24%
27 201009 42.55% 21.86% 16.98%
28 201012 63.81% 35.99% 20.46%
29 201103 76.16% 44.66% 21.78%
30 201106 73.56% 44.62% 20.02%
31 201109 39.24% 22.52% 13.64%
32 201112 60.40% 37.37% 16.76%
33 201203 80.72% 55.05% 16.56%
34 201206 75.06% 50.17% 16.58%
35 201209 85.93% 59.54% 16.54%
36 201212 90.29% 59.94% 18.97%
37 201303 113.85% 77.65% 20.38%
38 201306 120.92% 82.43% 21.10%
39 201309 139.57% 94.01% 23.49%
40 201312 163.13% 113.60% 23.19%
40 AVERAGE 49.49% 31.77% 12.56%

Ivory Day Clear Investment Consulting
Have insight! Will share!!
04/20/23 57
NOMINAL and EXCESS DOLLARS vs. MARKET BENCHMARKCumulative Quarterly Dollars
40 Periods in 10 Years from 1/1/2004 to 12/31/2013
CUMULATIVE
$100,000,000
PERIODS EIP, LLC. EIR ACC ARUSSELL 3000 ACM CWEXCESS
1 200403 $104,031,379 $102,230,100 $1,801,279
2 200406 $105,530,550 $103,589,658 $1,940,892
3 200409 $104,641,193 $101,621,558 $3,019,635
4 200412 $116,815,585 $111,946,207 $4,869,378
5 200503 $114,160,939 $109,483,502 $4,677,437
6 200506 $117,758,138 $111,935,823 $5,822,315
7 200509 $122,974,797 $116,424,562 $6,550,235
8 200512 $125,359,948 $118,799,506 $6,560,441
9 200603 $135,553,744 $125,119,759 $10,433,985
10 200606 $133,155,455 $122,642,263 $10,513,193
11 200609 $139,368,527 $128,332,986 $11,035,540
12 200612 $150,958,014 $137,470,166 $13,487,848
13 200703 $153,701,694 $139,216,175 $14,485,519
14 200706 $161,993,689 $147,248,809 $14,744,880
15 200709 $164,956,379 $149,531,313 $15,425,066
16 200712 $160,506,898 $144,536,817 $15,970,080
17 200803 $144,385,032 $130,777,057 $13,607,975
18 200806 $145,083,481 $128,566,794 $16,516,687
19 200809 $132,951,285 $117,343,041 $15,608,243
20 200812 $99,108,023 $90,612,179 $8,495,844

Ivory Day Clear Investment Consulting
Have insight! Will share!!
04/20/23 58
NOMINAL and EXCESS DOLLARS vs. MARKET BENCHMARKCumulative Quarterly Dollars
40 Periods in 10 Years from 1/1/2004 to 12/31/2013
21 200903 $87,837,395 $80,826,154 $7,011,241
22 200906 $106,091,528 $94,421,033 $11,670,495
23 200909 $124,837,798 $109,821,198 $15,016,600
24 200912 $131,508,912 $116,300,539 $15,208,373
25 201003 $143,145,175 $123,208,907 $19,936,268
26 201006 $128,095,056 $109,261,535 $18,833,520
27 201009 $142,550,072 $121,859,500 $20,690,573
28 201012 $163,807,973 $135,985,331 $27,822,642
29 201103 $176,162,175 $144,661,331 $31,500,844
30 201106 $173,563,371 $144,617,788 $28,945,583
31 201109 $139,237,317 $122,521,636 $16,715,681
32 201112 $160,400,412 $137,373,464 $23,026,948
33 201203 $180,723,192 $155,048,071 $25,675,121
34 201206 $175,062,348 $150,170,569 $24,891,779
35 201209 $185,927,212 $159,537,158 $26,390,054
36 201212 $190,290,761 $159,943,659 $30,347,102
37 201303 $213,854,428 $177,649,581 $36,204,847
38 201306 $220,924,933 $182,428,178 $38,496,756
39 201309 $239,572,273 $194,009,083 $45,563,189
40 201312 $263,129,733 $213,603,807 $49,525,926
40 AVERAGE $149,492,920 $131,766,920 $17,726,000

Ivory Day Clear Investment Consulting
Have insight! Will share!!
04/20/23 59
NOMINAL and EXCESS RETURNS vs. MARKET BENCHMARKQuarterly Returns (The View from 250 Feet)
40 Periods in 10 Years from 1/1/2004 to 12/31/2013
-30.0%
-20.0%
-10.0%
0.0%
10.0%
20.0%
30.0%
EIP, LLC. EIR ACC A EXCESS EIP, LLC. EIR ACC A RUSSELL 3000 ACM CW
Ivory Day Clear Investment Consulting
Have insight! Will share!!
04/20/23 60
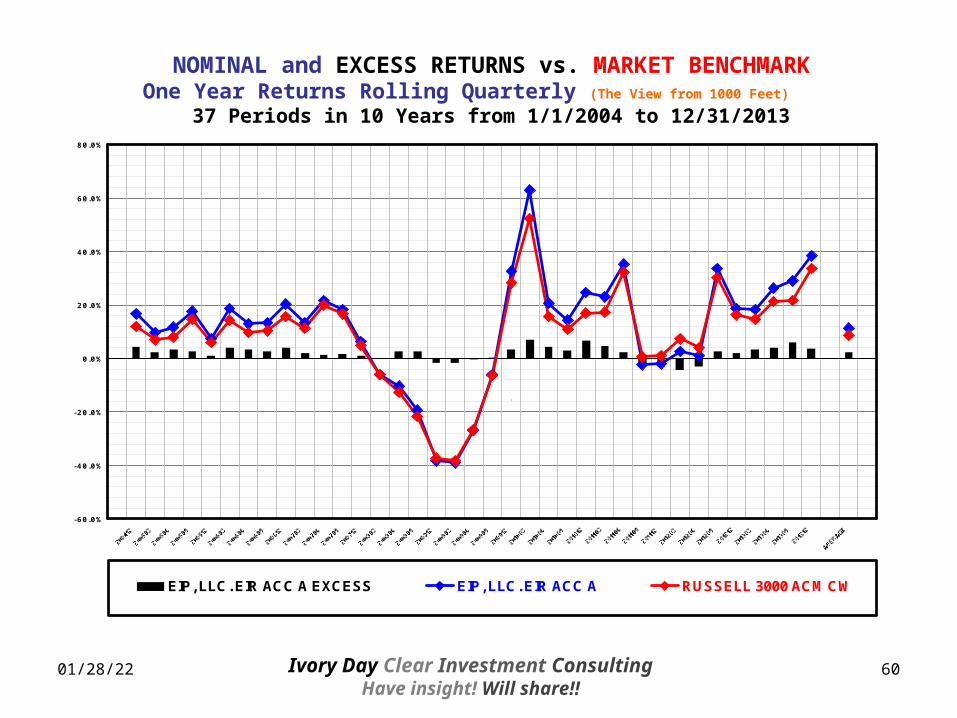
NOMINAL and EXCESS RETURNS vs. MARKET BENCHMARKOne Year Returns Rolling Quarterly (The View from 1000 Feet)
37 Periods in 10 Years from 1/1/2004 to 12/31/2013
-60.0%
-40.0%
-20.0%
0.0%
20.0%
40.0%
60.0%
80.0%
EIP, LLC. EIR ACC A EXCESS EIP, LLC. EIR ACC A RUSSELL 3000 ACM CW
`

Ivory Day Clear Investment Consulting
Have insight! Will share!!
04/20/23 61
NOMINAL and EXCESS RETURNS vs. MARKET BENCHMARKAnnualized Three Year Returns Rolling Quarterly (The View from 3000 Feet)
29 Periods in 10 Years from 1/1/2004 to 12/31/2013
-20.0%
-15.0%
-10.0%
-5.0%
0.0%
5.0%
10.0%
15.0%
20.0%
25.0%
30.0%
EIP, LLC. EIR ACC A EXCESS EIP, LLC. EIR ACC A RUSSELL 3000 ACM CW

Ivory Day Clear Investment Consulting
Have insight! Will share!!
04/20/23 62
NOMINAL and EXCESS RETURNS vs. MARKET BENCHMARKAnnualized Five Year Returns Rolling Quarterly (The View from 5000 Feet)
21 Periods in 10 Years from 1/1/2004 to 12/31/2013
-10.0%
-5.0%
0.0%
5.0%
10.0%
15.0%
20.0%
25.0%
200812 200903 200906 200909 200912 201003 201006 201009 201012 201103 201106 201109 201112 201203 201206 201209 201212 201303 201306 201309 201312 AVERAGE
EIP, LLC. EIR ACC A EXCESS EIP, LLC. EIR ACC A RUSSELL 3000 ACM CW
Ivory Day Clear Investment Consulting
Have insight! Will share!!
04/20/23 63
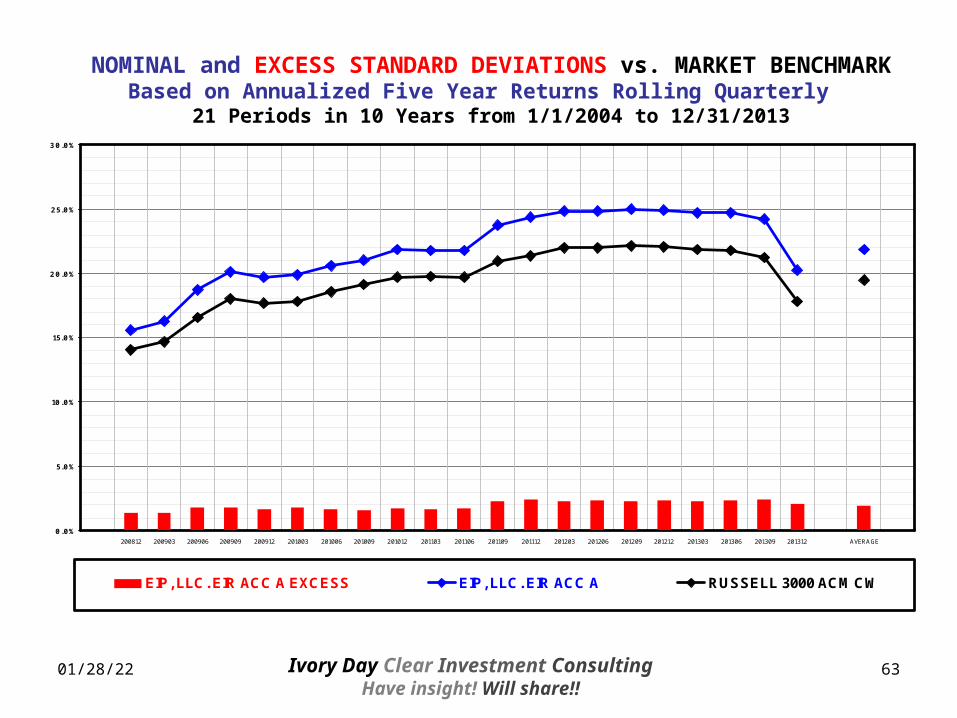
NOMINAL and EXCESS STANDARD DEVIATIONS vs. MARKET BENCHMARKBased on Annualized Five Year Returns Rolling Quarterly
21 Periods in 10 Years from 1/1/2004 to 12/31/2013
0.0%
5.0%
10.0%
15.0%
20.0%
25.0%
30.0%
200812 200903 200906 200909 200912 201003 201006 201009 201012 201103 201106 201109 201112 201203 201206 201209 201212 201303 201306 201309 201312 AVERAGE
EIP, LLC. EIR ACC A EXCESS EIP, LLC. EIR ACC A RUSSELL 3000 ACM CW
Ivory Day Clear Investment Consulting
Have insight! Will share!!
04/20/23 64
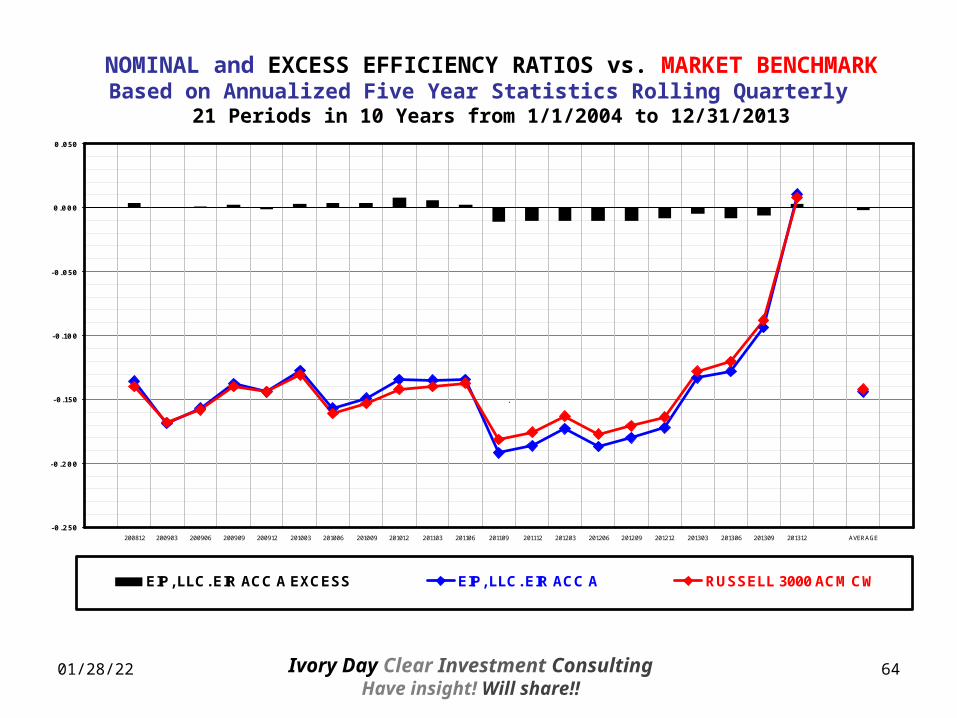
NOMINAL and EXCESS EFFICIENCY RATIOS vs. MARKET BENCHMARKBased on Annualized Five Year Statistics Rolling Quarterly
21 Periods in 10 Years from 1/1/2004 to 12/31/2013
-0.250
-0.200
-0.150
-0.100
-0.050
0.000
0.050
200812 200903 200906 200909 200912 201003 201006 201009 201012 201103 201106 201109 201112 201203 201206 201209 201212 201303 201306 201309 201312 AVERAGE
EIP, LLC. EIR ACC A EXCESS EIP, LLC. EIR ACC A RUSSELL 3000 ACM CW
`
Ivory Day Clear Investment Consulting
Have insight! Will share!!
04/20/23 65
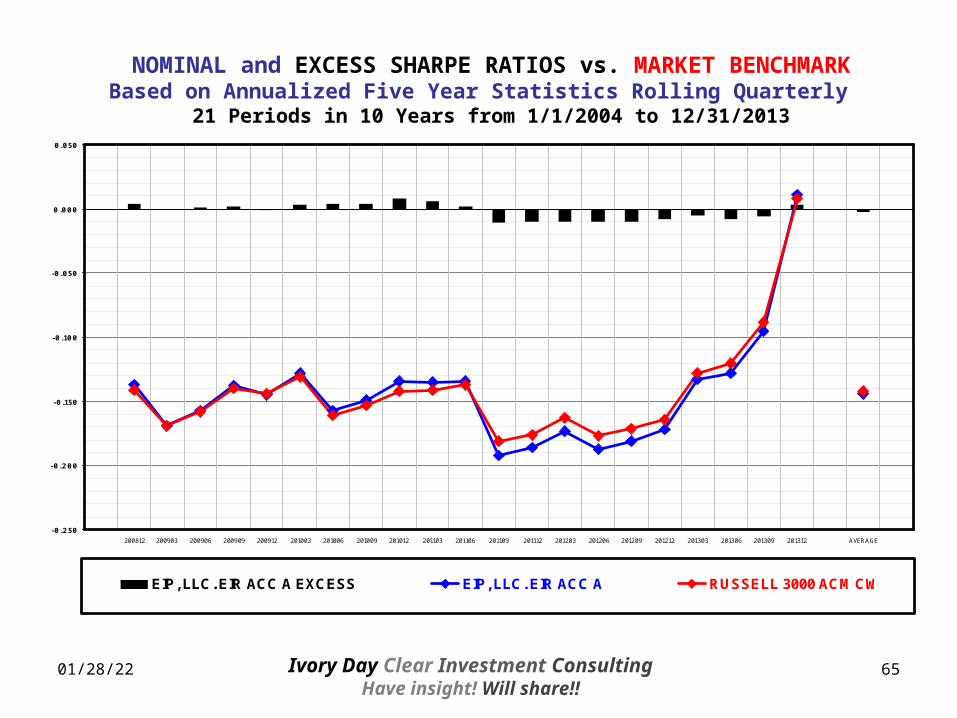
NOMINAL and EXCESS SHARPE RATIOS vs. MARKET BENCHMARKBased on Annualized Five Year Statistics Rolling Quarterly
21 Periods in 10 Years from 1/1/2004 to 12/31/2013
-0.250
-0.200
-0.150
-0.100
-0.050
0.000
0.050
200812 200903 200906 200909 200912 201003 201006 201009 201012 201103 201106 201109 201112 201203 201206 201209 201212 201303 201306 201309 201312 AVERAGE
EIP, LLC. EIR ACC A EXCESS EIP, LLC. EIR ACC A RUSSELL 3000 ACM CW

Ivory Day Clear Investment Consulting
Have insight! Will share!!
04/20/23 66
EIP, LLC. EIR ACC A
RUSSELL 3000 ACM CW
-10.0%
-5.0%
0.0%
5.0%
10.0%
15.0%
20.0%
25.0%
3.0% 8.0% 13.0% 18.0% 23.0% 28.0%
Annualized Standard Deviation %
An
nu
aliz
ed R
etu
rns
%
More RewardMore Risk
Less RewardLess Risk
Less RewardMore Risk
LARGER SYMBOLSMORE RECENT
SMALLER SYMBOLSMORE DISTANT
MANAGER EFFICIENCY (Return / Standard Deviation) vs. MARKET BENCHMARK Based on Annualized Five Year Returns Rolling Quarterly
21 Periods in 10 Years from 1/1/2004 to 12/31/2013
More RewardLess Risk

Ivory Day Clear Investment Consulting
Have insight! Will share!!
04/20/23 67
EXCESS RETURNS vs. BENCHMARKSBased on Annualized Five Year Returns Rolling Quarterly
21 Periods in 10 Years from 1/1/2004 to 12/31/2013
-2.0%
-1.0%
0.0%
1.0%
2.0%
3.0%
4.0%
5.0%
200812 200903 200906 200909 200912 201003 201006 201009 201012 201103 201106 201109 201112 201203 201206 201209 201212 201303 201306 201309 201312 AVERAGE
RUSSELL 3000 ACV CW RUSSELL 3000 ACM CW RUSSELL 3000 ACG CW

Ivory Day Clear Investment Consulting
Have insight! Will share!!
04/20/23 68
EXCESS DOLLARS vs. BENCHMARKS on Base of $100,000,000Based on Annualized Five Year Returns Rolling Quarterly
21 Periods in 10 Years from 1/1/2004 to 12/31/2013
$3
$9
$12
$14 $14
$18$18
$18
$22$21
$23
$19
$21$22
$20
$17
$14
$16
$9
$18
$22
$17
$9
$7
$10 $10
$8
$11 $11$11
$14
$12
$11
$5
$6$6 $6 $6
$7
$9
$7
$9
$13
$9
$17
$6
$10
$8
$4
$6$6
$5
$8
$5
$0
($8)
($6)
($8)
($6)
($4)
$1
$3
$6
$2
$4
$3
($10)
($5)
$0
$5
$10
$15
$20
$25
200812 200903 200906 200909 200912 201003 201006 201009 201012 201103 201106 201109 201112 201203 201206 201209 201212 201303 201306 201309 201312 AVERAGE
Millions
RUSSELL 3000 ACV CW RUSSELL 3000 ACM CW RUSSELL 3000 ACG CW

Ivory Day Clear Investment Consulting
Have insight! Will share!!
04/20/23 69
EXCESS RETURN TRACKING ERROR vs. MARKET BENCHMARKBased on Annualized Five Year Returns Rolling Quarterly
21 Periods in 10 Years from 1/1/2004 to 12/31/2013
0.0%
1.0%
2.0%
3.0%
4.0%
5.0%
6.0%
200812 200903 200906 200909 200912 201003 201006 201009 201012 201103 201106 201109 201112 201203 201206 201209 201212 201303 201306 201309 201312 AVERAGE
RUSSELL 3000 ACV CW RUSSELL 3000 ACG CW EIP, LLC. EIR ACC A

Ivory Day Clear Investment Consulting
Have insight! Will share!!
04/20/23 70
INFORMATION RATIO vs. MARKET BENCHMARKBased on Annualized Five Year Statistics Rolling Quarterly
21 Periods in 10 Years from 1/1/2004 to 12/31/2013
0.800
0.850
0.900
0.950
1.000
1.050
200812 200903 200906 200909 200912 201003 201006 201009 201012 201103 201106 201109 201112 201203 201206 201209 201212 201303 201306 201309 201312 AVERAGE
RUSSELL 3000 ACV CW RUSSELL 3000 ACG CW EIP, LLC. EIR ACC A

Ivory Day Clear Investment Consulting
Have insight! Will share!!
04/20/23 71
CORRELATION OF EXCESS RETURNS vs. MARKET BENCHMARKBased on Annualized Five Years of Returns Rolling Quarterly
21 Periods in 10 Years from 1/1/2004 to 12/31/2013
-1.500
-1.000
-0.500
0.000
0.500
1.000
1.500
200812 200903 200906 200909 200912 201003 201006 201009 201012 201103 201106 201109 201112 201203 201206 201209 201212 201303 201306 201309 201312 AVERAGE
EIP, LLC. EIR ACC A EXCESS RUSSELL 3000 ACV CWRUSSELL 3000 ACG CW PERFECT POSITIVE CORRELATIONPERFECT NEGATIVE CORRELATION ZERO CORRELATION
Ivory Day Clear Investment Consulting
Have insight! Will share!!
04/20/23 72
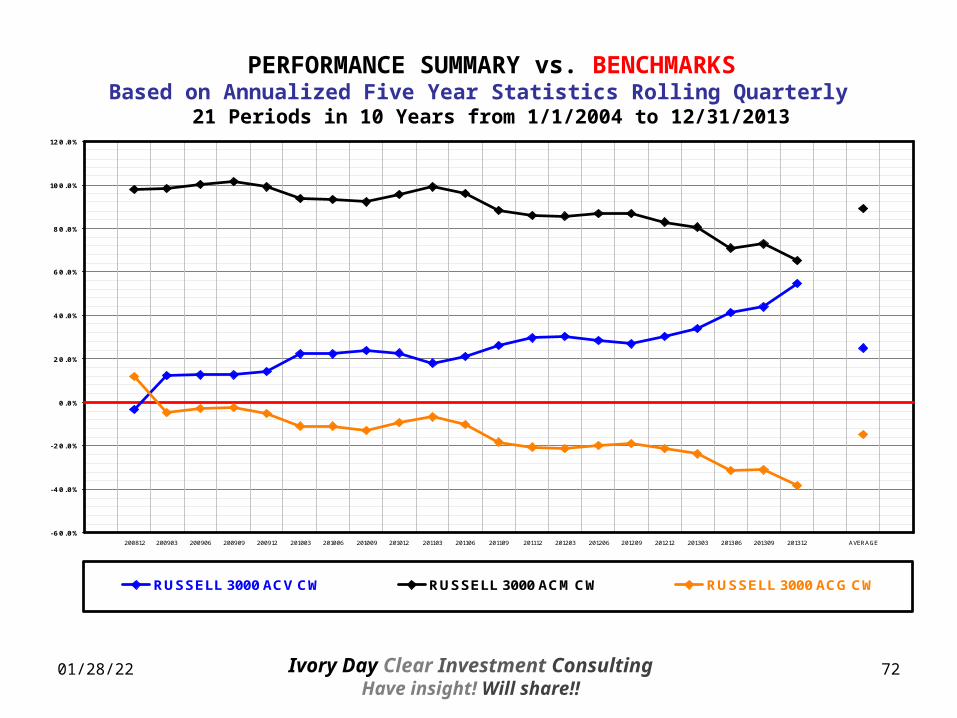
PERFORMANCE SUMMARY vs. BENCHMARKSBased on Annualized Five Year Statistics Rolling Quarterly
21 Periods in 10 Years from 1/1/2004 to 12/31/2013
-60.0%
-40.0%
-20.0%
0.0%
20.0%
40.0%
60.0%
80.0%
100.0%
120.0%
200812 200903 200906 200909 200912 201003 201006 201009 201012 201103 201106 201109 201112 201203 201206 201209 201212 201303 201306 201309 201312 AVERAGE
RUSSELL 3000 ACV CW RUSSELL 3000 ACM CW RUSSELL 3000 ACG CW
Ivory Day Clear Investment Consulting
Have insight! Will share!!
ENHANCED INVESTMENT PARTNERS, LLC – EIR ACC Active Overlay
SDIC Quantitative Investment Performance Analysis Report (10Y201312)
Investment Performance Analysis Appendix
Ivory Day Clear Investment Consulting
Have insight! Will share!!
04/20/23 74
APPENDIX B
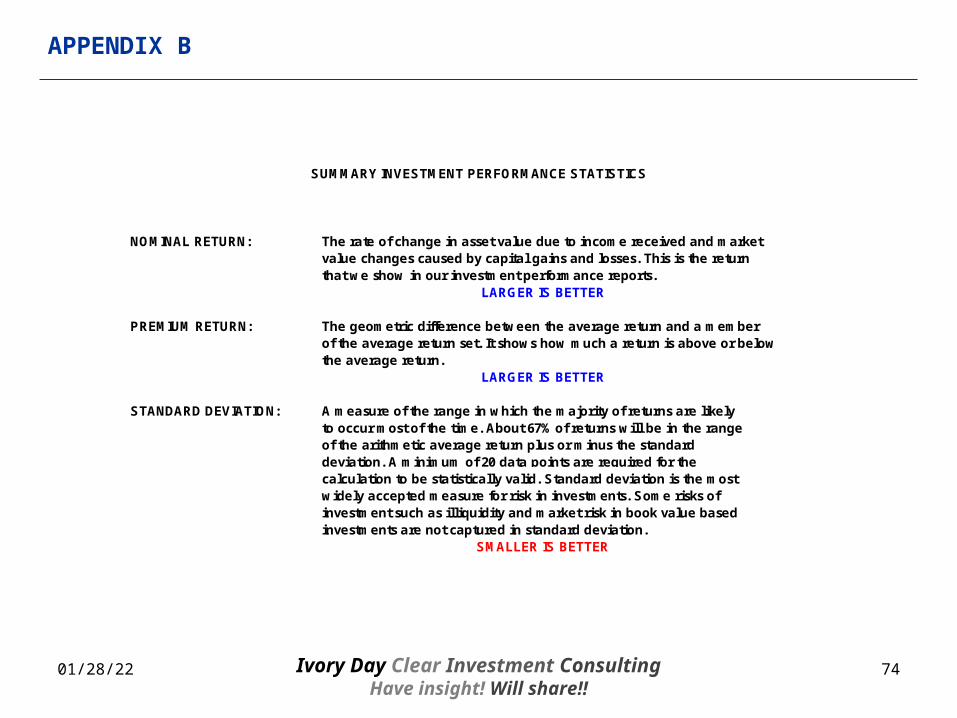
NOMINAL RETURN: The rate of change in asset value due to income received and marketvalue changes caused by capital gains and losses. This is the returnthat we show in our investment performance reports.
PREMIUM RETURN: The geometric difference between the average return and a member of the average return set. It shows how much a return is above or below the average return.
STANDARD DEVIATION: A measure of the range in which the majority of returns are likely to occur most of the time. About 67% of returns will be in the range of the arithmetic average return plus or minus the standard deviation. A minimum of 20 data points are required for the calculation to be statistically valid. Standard deviation is the mostwidely accepted measure for risk in investments. Some risks of investment such as illiquidity and market risk in book value based investments are not captured in standard deviation.
LARGER IS BETTER
LARGER IS BETTER
SMALLER IS BETTER
SUMMARY INVESTMENT PERFORMANCE STATISTICS
Ivory Day Clear Investment Consulting
Have insight! Will share!!
04/20/23 75
APPENDIX B
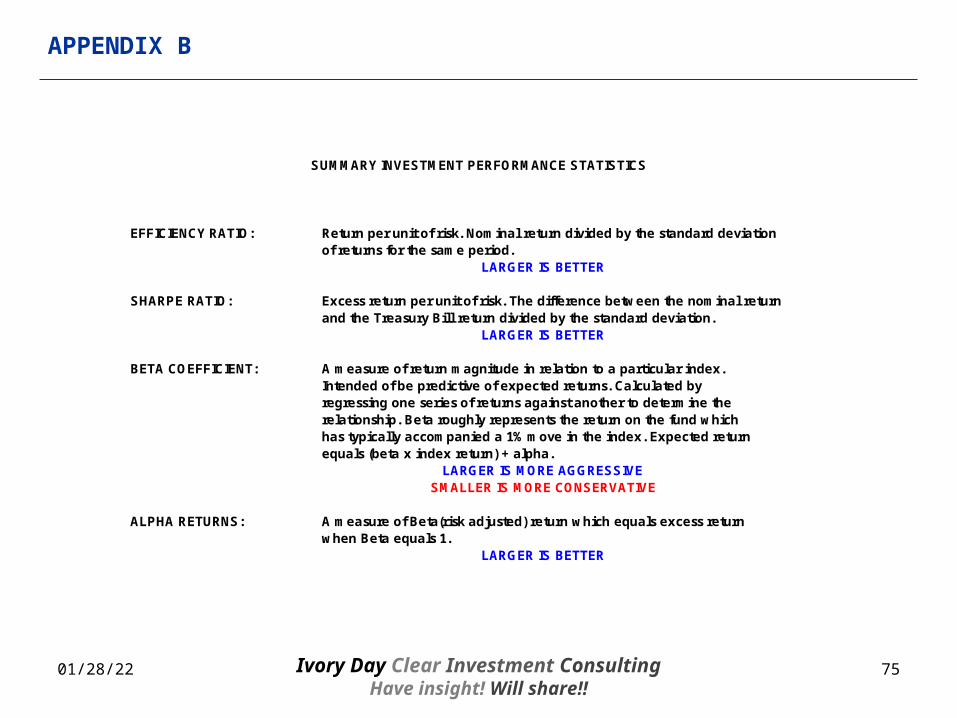
EFFICIENCY RATIO: Return per unit of risk. Nominal return divided by the standard deviationof returns for the same period.
SHARPE RATIO: Excess return per unit of risk. The difference between the nominal returnand the Treasury Bill return divided by the standard deviation.
BETA COEFFICIENT: A measure of return magnitude in relation to a particular index. Intended of be predictive of expected returns. Calculated by regressing one series of returns against another to determine the relationship. Beta roughly represents the return on the fund which has typically accompanied a 1% move in the index. Expected returnequals (beta x index return) + alpha.
ALPHA RETURNS: A measure of Beta(risk adjusted) return which equals excess return when Beta equals 1.
LARGER IS BETTER
LARGER IS BETTER
LARGER IS MORE AGGRESSIVESMALLER IS MORE CONSERVATIVE
SUMMARY INVESTMENT PERFORMANCE STATISTICS
LARGER IS BETTER

Ivory Day Clear Investment Consulting
Have insight! Will share!!
04/20/23 76
APPENDIX B
CORRELATION: A measure of similarity in the direction of one series of returns comparedto another series of returns. Correlation ranges from +1.000 to -1.000.A correlation of +1.000 means that two return series point the same direction100% of the time periods studied. A correlation of -1.000 means that the tworeturn series point in opposite directions 100% of the time periods studied.A correlation of 0.000 means that there is no correlation between the two series of returns for the time periods studied.
EXCESS RETURNS: A measure of the difference between a manager's return and the returnof a relevant benchmark. The simplest measure of a manager's valueadded.
TRACKING ERROR: The standard deviation of excess returns. A measure of the range ofreturn differences between the manager and the benchmark.
INFORMATION RATIO: A measure of efficiency. Excess return per unit of risk (tracking error).
SUMMARY INVESTMENT PERFORMANCE STATISTICS
LARGER IS BETTER
LARGER IS BETTER IF RANGE IS SMALL & EXCESS RETURNS ARE POSITIVE
LARGER IS BETTER
Ivory Day Clear Investment Consulting
Have insight! Will share!!
04/20/23 77
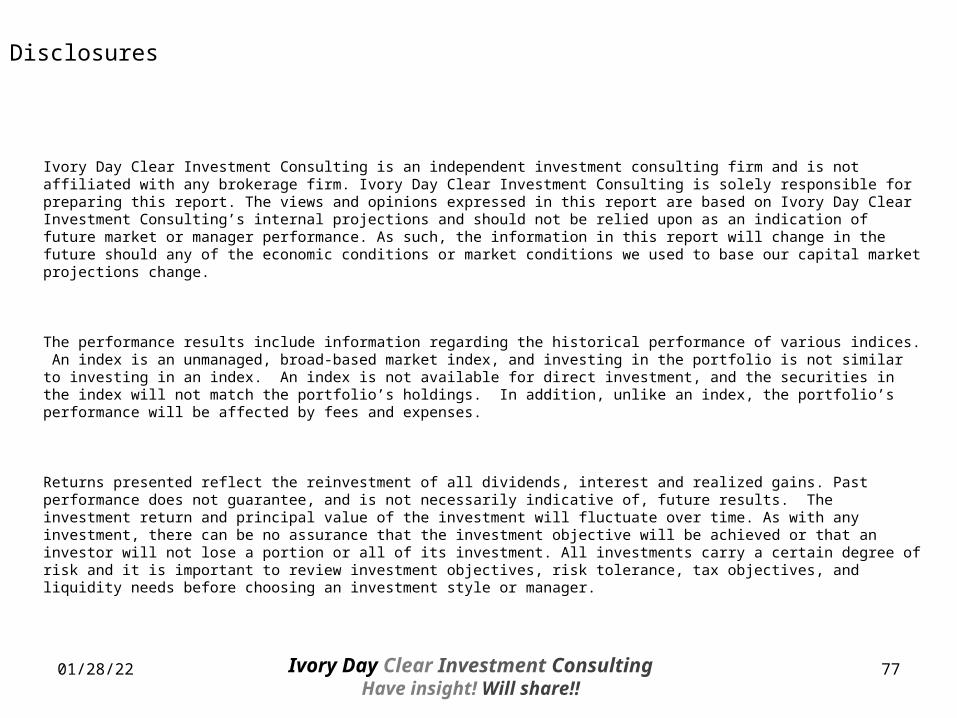
Ivory Day Clear Investment Consulting is an independent investment consulting firm and is not affiliated with any brokerage firm. Ivory Day Clear Investment Consulting is solely responsible for preparing this report. The views and opinions expressed in this report are based on Ivory Day Clear Investment Consulting’s internal projections and should not be relied upon as an indication of future market or manager performance. As such, the information in this report will change in the future should any of the economic conditions or market conditions we used to base our capital market projections change.
The performance results include information regarding the historical performance of various indices. An index is an unmanaged, broad-based market index, and investing in the portfolio is not similar to investing in an index. An index is not available for direct investment, and the securities in the index will not match the portfolio’s holdings. In addition, unlike an index, the portfolio’s performance will be affected by fees and expenses.
Returns presented reflect the reinvestment of all dividends, interest and realized gains. Past performance does not guarantee, and is not necessarily indicative of, future results. The investment return and principal value of the investment will fluctuate over time. As with any investment, there can be no assurance that the investment objective will be achieved or that an investor will not lose a portion or all of its investment. All investments carry a certain degree of risk and it is important to review investment objectives, risk tolerance, tax objectives, and liquidity needs before choosing an investment style or manager.
Disclosures
Ivory Day Clear Investment Consulting
Have insight! Will share!!
ENHANCED INVESTMENT PARTNERS, LLC – EIR ACC Active Overlay
SDIC Quantitative Investment Performance Analysis Report (10Y201312)
THANK YOU!!!


![Stephen Peedell - INSPIRE.ppt [Read-Only] · GSDI Standards Workshop Cairo Spatial Data Interest Communities (SDIC) • SDIC bundle the human expertise of users, producers and transformers](https://img.dokumen.tips/doc/110x75/5f600a07ba63be082d1d1a0d/stephen-peedell-read-only-gsdi-standards-workshop-cairo-spatial-data-interest.jpg)


![SDIC 11marks (Q & a) [Unit 4]](https://img.dokumen.tips/doc/110x75/552515c34a795968498b49c3/sdic-11marks-q-a-unit-4.jpg)


![SDIC 11marks (Q & a) [Unit 3]](https://img.dokumen.tips/doc/110x75/577d35401a28ab3a6b8fea9c/sdic-11marks-q-a-unit-3.jpg)


![SDIC 11marks (Q & a) [Unit 5]](https://img.dokumen.tips/doc/110x75/577d35401a28ab3a6b8fea9e/sdic-11marks-q-a-unit-5.jpg)