Embed Size (px)
Citation preview

50 United Nations Population Division World Urbanization Prospects: The 2001 Revision
IV. URBANIZATION PATTERNS AND RURAL POPULATION
GROWTH AT THE COUNTRY LEVEL
Urbanization patterns at the country level are much more varied than at the regional level. Fur-thermore, for most countries, the changes experi-enced over the second half of the twentieth cen-tury were remarkable. Thus, whereas in 1950 only a quarter of the 228 countries or areas in the world had more than 46 per cent of their population liv-ing in urban areas, by 2000 nearly half had 57 per cent or more of their population living in urban areas. If the country-level projections presented in this volume prove approximately correct, by 2030 over three-quarters of all countries or areas will have over half of their population in urban areas. In most countries the urban population has grown in parallel to the proportion urban. How-ever, because most countries have small or me-dium-sized populations, their urban populations remain small. Thus, in 2000 three-quarters of all countries and areas had urban populations of less than 7 million persons. At the same time, 25 coun-tries accounted for 75 per cent of the urban popu-lation in the world. China and India had the larg-est urban populations, at 456 million and 279 million, respectively. In 1950 the United States had about half again as many urban dwellers as either China or India, but by 2000 China had over twice the urban population of the United States and India 27 per cent more. Most developed coun-tries with relatively large urban populations in 2000 had experienced low rates of urban popula-tion growth during 1950-2000 (below 2 per cent per year), whereas most developing countries had experienced considerably higher annual rates of urban population growth (ranging between 2 per cent and 6 per cent), the highest being those of Bangladesh and Nigeria (5.9 per cent and 5.6 per cent respectively). In 2030, 28 countries are expected to account for 75 per cent of the world’s urban population, and eight for over half. China and India have pro-jected urban populations of 883 million and 576 million, respectively. Only 7 of the 28 countries with large urban populations in 2030 will be in the more developed regions, down from 9 of 25 in
2000. In 1950, in contrast, of the 17 countries accounting for 75 per cent of the world’s popula-tion, 11 were in the developed regions. These changes reflect the striking shift in the world’s urban population from the more developed to the less developed countries that has taken place since 1950 and is expected to continue during the twenty-first century. The rural population of the world continues to be concentrated in developing countries. Although three-quarters of all countries or areas of the world had rural populations of less than 7.2 mil-lion persons in 2000, the largest rural populations are considerably higher than the largest urban populations: 819 million in China and 730 million in India. Just 17 countries accounted for 75 per cent of the total rural population in 2000, includ-ing only two developed countries (the Russian Federation and the United States). In comparison to the urban growth rates of the 25 countries that comprised 75 per cent of the urban population in 2000, the growth rates of the rural population among these 17 countries during 1950-2000 were considerably lower. Thus, none grew at rates above 3 per cent per year and only four had rural growth rates higher than 2 per cent per year (the Democratic Republic of the Congo, Ethiopia, Pakistan and Thailand), while for three others av-erage annual rural growth rates were negative (Brazil, Japan and the Russian Federation). During 2000-2030, more than half of the coun-tries or areas of the world are expected to experi-ence negative growth rates of the rural population, so that their rural populations will decrease. Among the 18 countries expected to account for 75 per cent of the world’s rural population in 2030, only seven—Afghanistan, Ethiopia, the Democratic Republic of the Congo, Nepal, Paki-stan, Uganda and Yemen—are likely to experi-ence rural growth rates above 1 per cent per year. Although the rural populations of a few populous countries, such as Bangladesh and India (in addi-tion to Pakistan), are still expected to increase, that of China is projected to decline significantly,
United Nations Population Division 51 World Urbanization Prospects: The 2001 Revision
so that by 2030 it will have over 200 million fewer rural inhabitants than India (601 million versus 833 million). Most countries that are pro-jected to see their rural populations rise by 2030 are in Africa, South-central Asia and developing Oceania. For the rest of the world, the rapid rise of urbanization coupled with a reduction of overall population growth will result in reductions of the rural population. The following sections further discuss these trends at the country level.
A. THE LEVEL OF URBANIZATION
The countries of the world are at very different stages of the transition to a largely urban popula-
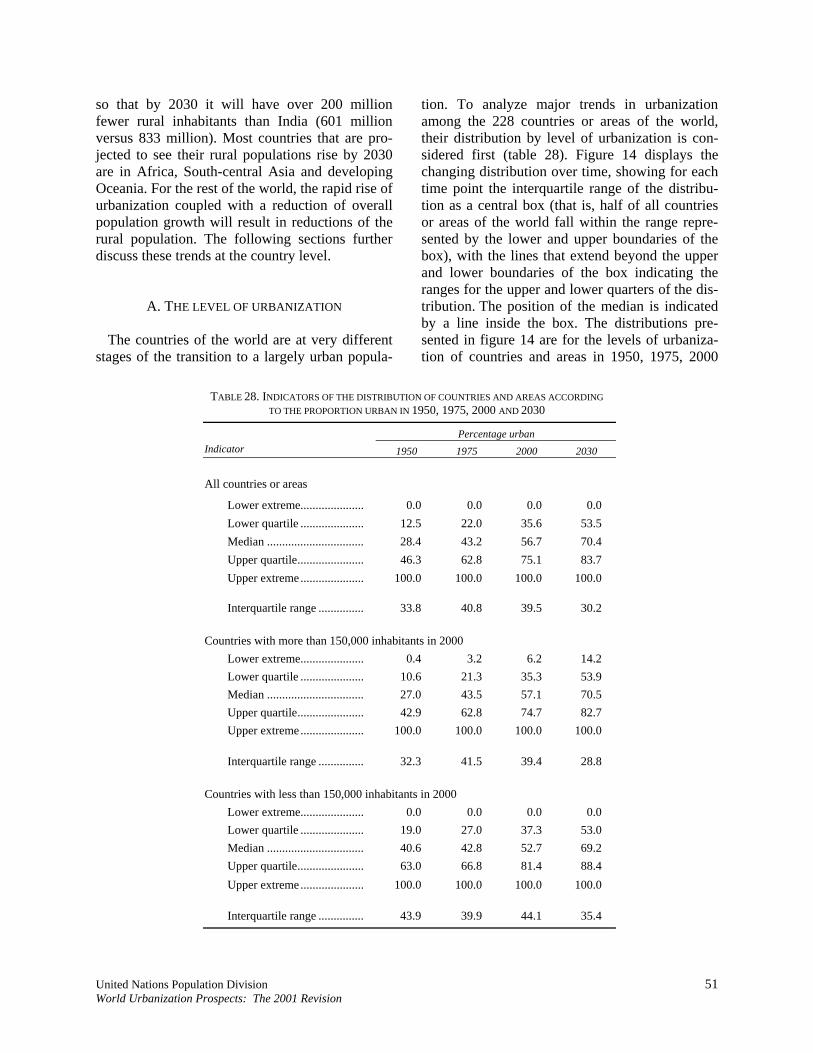
tion. To analyze major trends in urbanization among the 228 countries or areas of the world, their distribution by level of urbanization is con-sidered first (table 28). Figure 14 displays the changing distribution over time, showing for each time point the interquartile range of the distribu-tion as a central box (that is, half of all countries or areas of the world fall within the range repre-sented by the lower and upper boundaries of the box), with the lines that extend beyond the upper and lower boundaries of the box indicating the ranges for the upper and lower quarters of the dis-tribution. The position of the median is indicated by a line inside the box. The distributions pre-sented in figure 14 are for the levels of urbaniza-tion of countries and areas in 1950, 1975, 2000
TABLE 28. INDICATORS OF THE DISTRIBUTION OF COUNTRIES AND AREAS ACCORDING
TO THE PROPORTION URBAN IN 1950, 1975, 2000 AND 2030 Percentage urban
Indicator 1950 1975 2000 2030 All countries or areas
Lower extreme..................... 0.0 0.0 0.0 0.0 Lower quartile ..................... 12.5 22.0 35.6 53.5 Median ................................ 28.4 43.2 56.7 70.4 Upper quartile...................... 46.3 62.8 75.1 83.7 Upper extreme..................... 100.0 100.0 100.0 100.0
Interquartile range ............... 33.8 40.8 39.5 30.2 Countries with more than 150,000 inhabitants in 2000
Lower extreme..................... 0.4 3.2 6.2 14.2 Lower quartile ..................... 10.6 21.3 35.3 53.9 Median ................................ 27.0 43.5 57.1 70.5 Upper quartile...................... 42.9 62.8 74.7 82.7 Upper extreme..................... 100.0 100.0 100.0 100.0
Interquartile range ............... 32.3 41.5 39.4 28.8 Countries with less than 150,000 inhabitants in 2000
Lower extreme..................... 0.0 0.0 0.0 0.0 Lower quartile ..................... 19.0 27.0 37.3 53.0 Median ................................ 40.6 42.8 52.7 69.2 Upper quartile...................... 63.0 66.8 81.4 88.4 Upper extreme..................... 100.0 100.0 100.0 100.0
Interquartile range ............... 43.9 39.9 44.1 35.4

52 United Nations Population Division World Urbanization Prospects: The 2001 Revision
Figure 14. Distribution of countries by level of urbanization, 1950, 1975, 2000 and 2030
and 2030. In all cases, the extremes of the distri-bution are 0 and 100, since there have always been and there are expected to remain a few coun-tries or areas that are totally rural or totally urban.
As table 28 and figure 14 show, the median
level of urbanization has been rising steadily from 1950 to 2000, doubling from 28.4 per cent to 56.7 per cent, and is projected to reach 70 per cent in 2030. Concomitantly, the position of the central part of the distribution (the box) has been mov-ing upward as the level of urbanization of most countries has risen. Furthermore, the width of the box (the interquartile range), which indicates the amount of variation around the median, has been changing. In 1950, most countries had low urbanization levels (in 3 out of every 4 countries the proportion urban was below 46 per cent) and there was relatively little variation around the me-dian because the process of differentiation in terms of level of urbanization was still at its initial stages. By 1975, not only had the median in-creased markedly but the interquartile range had risen from 34 percentage points to 41. But as more and more countries caught up with the rapidly urbanizing ones during the last quarter of the
twentieth century, the variation around the median began to decline. By 2000 the interquartile range stood at 39.5 percentage points. If the projected paths toward increased urbanization hold, by 2030 the median level of urbanization will be 70 per cent and the interquartile range will have declined to 30 percentage points. This value will be lower than the value for 1950, indicating an increasing homogeneity among countries with respect to their levels of urbanization. In addition, by 2030 the upper quarter of the distribution will be more concentrated, ranging from 84 per cent to 100 per cent (table 28), while the lower quarter will be more extended that in previous years.
One reason for the growing diversity in the level
of urbanization at the lower end of the distribution is that a few countries or areas with small territo-ries and small populations are expected to main-tain a rural character for longer than countries or areas with larger populations, perhaps because small rural societies with limited natural resources face more constraints to urbanization than better endowed countries. To explore this hypothesis, table 28 shows the distribution by level of urbani-zation of countries with more than 150,000 in-

United Nations Population Division 53 World Urbanization Prospects: The 2001 Revision
habitants in 2000 separately from that of countries with smaller populations. A comparison of the two shows that in 1950 the small countries or ar-eas tended to have higher levels of urbanization than the large countries. Their median level of urbanization was 41 per cent whereas that of the larger countries was 27 per cent. In addition, the lower and the upper quartiles of the distribution of the small countries were higher than those of the large countries, resulting in an interquartile range of 44 for the small countries versus 32 for the lar-ger countries in 1950. Over time, the median of the distribution of small countries has fallen be-low that of large countries, but the upper quartile has been and is expected to remain above that of large countries, implying that at the upper end of the distribution small countries tend to display higher levels of urbanization than large ones. At the same time, at the lower end of the distribution, small countries show greater dispersion than large countries, with larger differences between the lower quartile and the lower extreme. In 1950, for instance, the lower quarter of the distribution of small countries ranged from 0 to 19 per cent urban whereas that of large countries had a range of 0.4 per cent to 10.6 per cent urban, or about half as wide. By 2000, large countries in the lower quarter of the distribution had levels of urbaniza-tion ranging from 6 per cent to 35 per cent, nar-rower than the 0 to 37 per cent range of small countries. In 2030, the respective ranges are ex-pected to be 14 per cent to 54 per cent urban for large countries and 0 to 53 per cent urban for small ones. That is, small countries are responsi-ble for extending the lower part of the distribution of all countries to zero and thus increasing its overall dispersion, a finding suggesting that some small countries are indeed slow at embarking on the urbanization process.
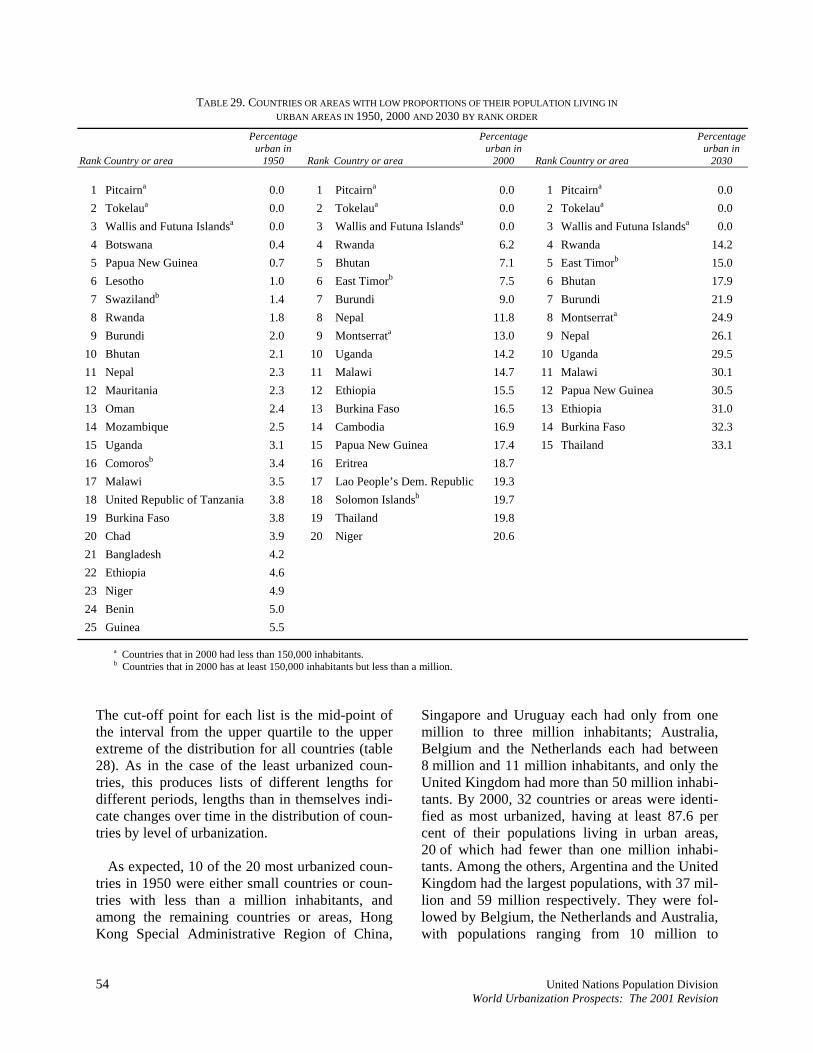
But are there many small countries with consis-
tently low proportions urban over time? To an-swer this question, table 29 displays the least ur-banized countries or areas in the world as of 1950, 2000 and 2030. They are those countries with lev-els of urbanization ranging from 0 to half the dis-tance between the lower extreme and the lower quartile of the distribution of large countries (table 28). The reduction in the length of the list over time is indicative of the increasing levels of ur-banization that characterize larger countries over
time. Thus in 1950 a low level of urbanization was anything at or below 5.5 per cent, but because the level of urbanization rose over time, by 2000 a “low” level is anything below 21 per cent, and by 2030 anything below 34 per cent.
The lists of countries in table 29 reveal that
three areasPitcairn, Tokelau, and Wallis and Futuna Islandsare the ones consistently show-ing a zero proportion urban. They are all places with very small populations: Pitcairn has less than a thousand inhabitants, Tokelau has around 1,500, and Wallis and Futuna Islands have 14,500. With the exception of these three areas, all other coun-tries or areas appearing in both the list for 1950 and that for 2000 in table 29 experienced an in-crease in the proportion urban. Rwanda, for in-stance, saw its level of urbanization rise from 1.8 per cent to 6.2 per cent between 1950 and 2000, although it is the least urbanized country in 2000, and will continue to be the least urbanized until 2030. The proportion urban for Burundi also rose, from 2 per cent in 1950 to 9 per cent in 2000 and it is expected to reach nearly 22 per cent in 2030. For Bhutan the equivalent figures are 2 per cent, 7 per cent and 18 per cent. But for a number of countries with low levels of urbanization in 2000, table 29 does not show the corresponding level in 1950. Among them, East Timor and Montserrat experienced slight reductions in the proportion urban. In East Timor it fell from 9.9 per cent in 1950 to 7.5 per cent in 2000, and in Montserrat from 22 per cent to 13 per cent. In East Timor, the protracted occupation of its territory probably contributed to the reversal of the normal process of urbanization while in Montserrat, the location of its capital near an active volcano which erupted in 1997 was likely responsible for the reduction in the level of urbanization recorded.
However, the number of small countries or ar-
eas is too small to conclude that a small popula-tion per se represents a drawback to urbanization. In fact, small populations often live in places that are highly urbanized. Thus, among the most highly urbanized countries in the world, the pro-portion of countries or areas with small popula-tions (less than 150,000 in 2000) or with popula-tions ranging from 150,000 to one million inhabitants is large. Table 30 lists the most urban-ized countries or areas in 1950, 2000 and 2030.
54 United Nations Population Division World Urbanization Prospects: The 2001 Revision
TABLE 29. COUNTRIES OR AREAS WITH LOW PROPORTIONS OF THEIR POPULATION LIVING IN URBAN AREAS IN 1950, 2000 AND 2030 BY RANK ORDER
Rank Country or area
Percentage urban in
1950 Rank Country or area
Percentage urban in
2000 Rank Country or area
Percentage urban in
2030
1 Pitcairna 0.0 1 Pitcairna 0.0 1 Pitcairna 0.0 2 Tokelaua 0.0 2 Tokelaua 0.0 2 Tokelaua 0.0 3 Wallis and Futuna Islandsa 0.0 3 Wallis and Futuna Islandsa 0.0 3 Wallis and Futuna Islandsa 0.0 4 Botswana 0.4 4 Rwanda 6.2 4 Rwanda 14.2 5 Papua New Guinea 0.7 5 Bhutan 7.1 5 East Timorb 15.0 6 Lesotho 1.0 6 East Timorb 7.5 6 Bhutan 17.9 7 Swazilandb 1.4 7 Burundi 9.0 7 Burundi 21.9 8 Rwanda 1.8 8 Nepal 11.8 8 Montserrata 24.9 9 Burundi 2.0 9 Montserrata 13.0 9 Nepal 26.1
10 Bhutan 2.1 10 Uganda 14.2 10 Uganda 29.5 11 Nepal 2.3 11 Malawi 14.7 11 Malawi 30.1 12 Mauritania 2.3 12 Ethiopia 15.5 12 Papua New Guinea 30.5 13 Oman 2.4 13 Burkina Faso 16.5 13 Ethiopia 31.0 14 Mozambique 2.5 14 Cambodia 16.9 14 Burkina Faso 32.3 15 Uganda 3.1 15 Papua New Guinea 17.4 15 Thailand 33.1 16 Comorosb 3.4 16 Eritrea 18.7 17 Malawi 3.5 17 Lao People’s Dem. Republic 19.3 18 United Republic of Tanzania 3.8 18 Solomon Islandsb 19.7 19 Burkina Faso 3.8 19 Thailand 19.8 20 Chad 3.9 20 Niger 20.6 21 Bangladesh 4.2 22 Ethiopia 4.6 23 Niger 4.9 24 Benin 5.0 25 Guinea 5.5
a Countries that in 2000 had less than 150,000 inhabitants. b Countries that in 2000 has at least 150,000 inhabitants but less than a million.
The cut-off point for each list is the mid-point of the interval from the upper quartile to the upper extreme of the distribution for all countries (table 28). As in the case of the least urbanized coun-tries, this produces lists of different lengths for different periods, lengths than in themselves indi-cate changes over time in the distribution of coun-tries by level of urbanization.
As expected, 10 of the 20 most urbanized coun-
tries in 1950 were either small countries or coun-tries with less than a million inhabitants, and among the remaining countries or areas, Hong Kong Special Administrative Region of China,
Singapore and Uruguay each had only from one million to three million inhabitants; Australia, Belgium and the Netherlands each had between 8 million and 11 million inhabitants, and only the United Kingdom had more than 50 million inhabi-tants. By 2000, 32 countries or areas were identi-fied as most urbanized, having at least 87.6 per cent of their populations living in urban areas, 20 of which had fewer than one million inhabi-tants. Among the others, Argentina and the United Kingdom had the largest populations, with 37 mil-lion and 59 million respectively. They were fol-lowed by Belgium, the Netherlands and Australia, with populations ranging from 10 million to
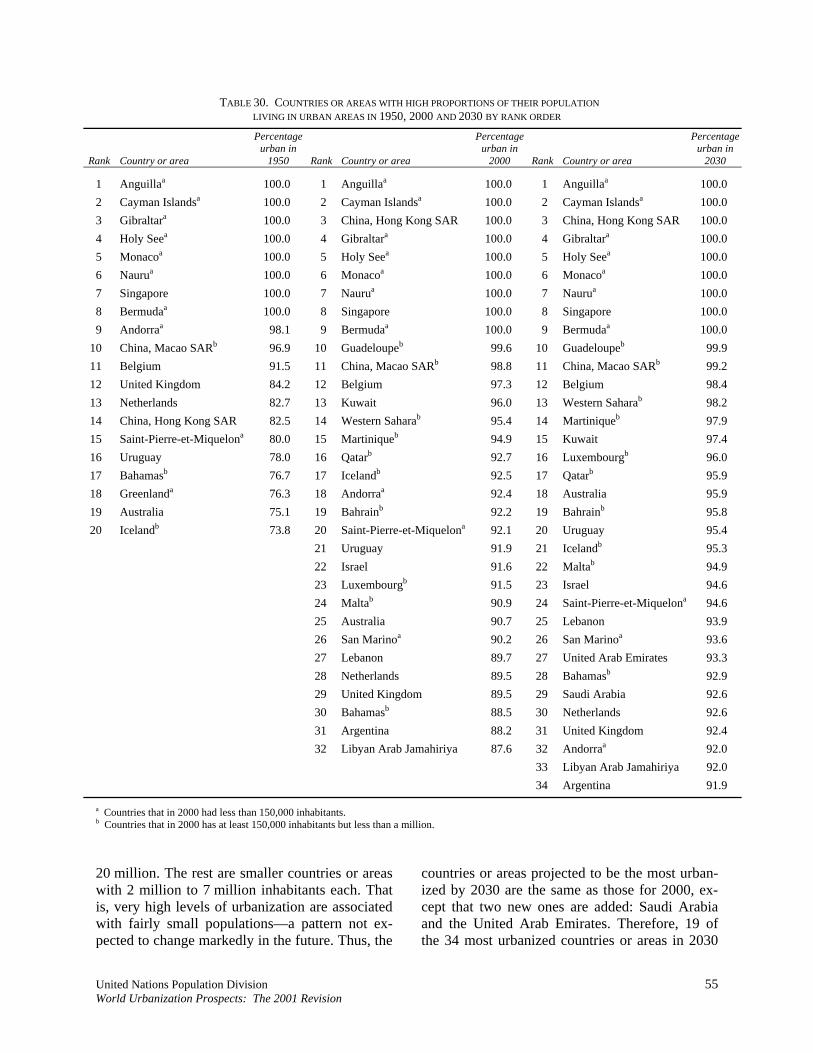
United Nations Population Division 55 World Urbanization Prospects: The 2001 Revision
TABLE 30. COUNTRIES OR AREAS WITH HIGH PROPORTIONS OF THEIR POPULATION LIVING IN URBAN AREAS IN 1950, 2000 AND 2030 BY RANK ORDER
Rank Country or area
Percentage urban in
1950 Rank Country or area
Percentage urban in
2000 Rank Country or area
Percentage urban in
2030
1 Anguillaa 100.0 1 Anguillaa 100.0 1 Anguillaa 100.0 2 Cayman Islandsa 100.0 2 Cayman Islandsa 100.0 2 Cayman Islandsa 100.0 3 Gibraltara 100.0 3 China, Hong Kong SAR 100.0 3 China, Hong Kong SAR 100.0 4 Holy Seea 100.0 4 Gibraltara 100.0 4 Gibraltara 100.0 5 Monacoa 100.0 5 Holy Seea 100.0 5 Holy Seea 100.0 6 Naurua 100.0 6 Monacoa 100.0 6 Monacoa 100.0 7 Singapore 100.0 7 Naurua 100.0 7 Naurua 100.0 8 Bermudaa 100.0 8 Singapore 100.0 8 Singapore 100.0 9 Andorraa 98.1 9 Bermudaa 100.0 9 Bermudaa 100.0
10 China, Macao SARb 96.9 10 Guadeloupeb 99.6 10 Guadeloupeb 99.9 11 Belgium 91.5 11 China, Macao SARb 98.8 11 China, Macao SARb 99.2 12 United Kingdom 84.2 12 Belgium 97.3 12 Belgium 98.4 13 Netherlands 82.7 13 Kuwait 96.0 13 Western Saharab 98.2 14 China, Hong Kong SAR 82.5 14 Western Saharab 95.4 14 Martiniqueb 97.9 15 Saint-Pierre-et-Miquelona 80.0 15 Martiniqueb 94.9 15 Kuwait 97.4 16 Uruguay 78.0 16 Qatarb 92.7 16 Luxembourgb 96.0 17 Bahamasb 76.7 17 Icelandb 92.5 17 Qatarb 95.9 18 Greenlanda 76.3 18 Andorraa 92.4 18 Australia 95.9 19 Australia 75.1 19 Bahrainb 92.2 19 Bahrainb 95.8 20 Icelandb 73.8 20 Saint-Pierre-et-Miquelona 92.1 20 Uruguay 95.4
21 Uruguay 91.9 21 Icelandb 95.3 22 Israel 91.6 22 Maltab 94.9 23 Luxembourgb 91.5 23 Israel 94.6
24 Maltab 90.9 24 Saint-Pierre-et-Miquelona 94.6 25 Australia 90.7 25 Lebanon 93.9 26 San Marinoa 90.2 26 San Marinoa 93.6 27 Lebanon 89.7 27 United Arab Emirates 93.3 28 Netherlands 89.5 28 Bahamasb 92.9 29 United Kingdom 89.5 29 Saudi Arabia 92.6 30 Bahamasb 88.5 30 Netherlands 92.6 31 Argentina 88.2 31 United Kingdom 92.4 32 Libyan Arab Jamahiriya 87.6 32 Andorraa 92.0 33 Libyan Arab Jamahiriya 92.0 34 Argentina 91.9
a Countries that in 2000 had less than 150,000 inhabitants. b Countries that in 2000 has at least 150,000 inhabitants but less than a million. 20 million. The rest are smaller countries or areas with 2 million to 7 million inhabitants each. That is, very high levels of urbanization are associated with fairly small populations—a pattern not ex-pected to change markedly in the future. Thus, the
countries or areas projected to be the most urban-ized by 2030 are the same as those for 2000, ex-cept that two new ones are added: Saudi Arabia and the United Arab Emirates. Therefore, 19 of the 34 most urbanized countries or areas in 2030
56 United Nations Population Division World Urbanization Prospects: The 2001 Revision
will have a population of less than a million, and among the 15 others, the same ones will be the largest, led by the United Kingdom, Argentina and Saudi Arabia, with more than 44 million in-habitants each; followed by Belgium, the Nether-lands and Australia, with populations ranging from 10 million to 25 million. The rest are coun-tries whose populations are expected to range from 2 million to 10 million inhabitants in 2030. It bears noting that seven small countries or areas plus Singapore have been totally urban since 1950 and that by 2000 they were joined by Hong Kong, Special Administrative Region of China, the most populous area with 100 per cent of its population living in an urban environment (nearly 7 million inhabitants in 2000).
Table 30 shows that the most urbanized coun-
tries or areas are located in Europe, the Caribbean, Oceania, South America, South-eastern Asia and Western Asia. Only one of the most urbanized areas, Western Sahara, is located in Africa, and its population is very small. In contrast, about a third of the least urbanized countries are in Africa, the rest being in Oceania, South-central Asia and South-eastern Asia (table 29). These results are consistent with the differences among regions dis-cussed in chapter II in terms of average regional levels of urbanization.
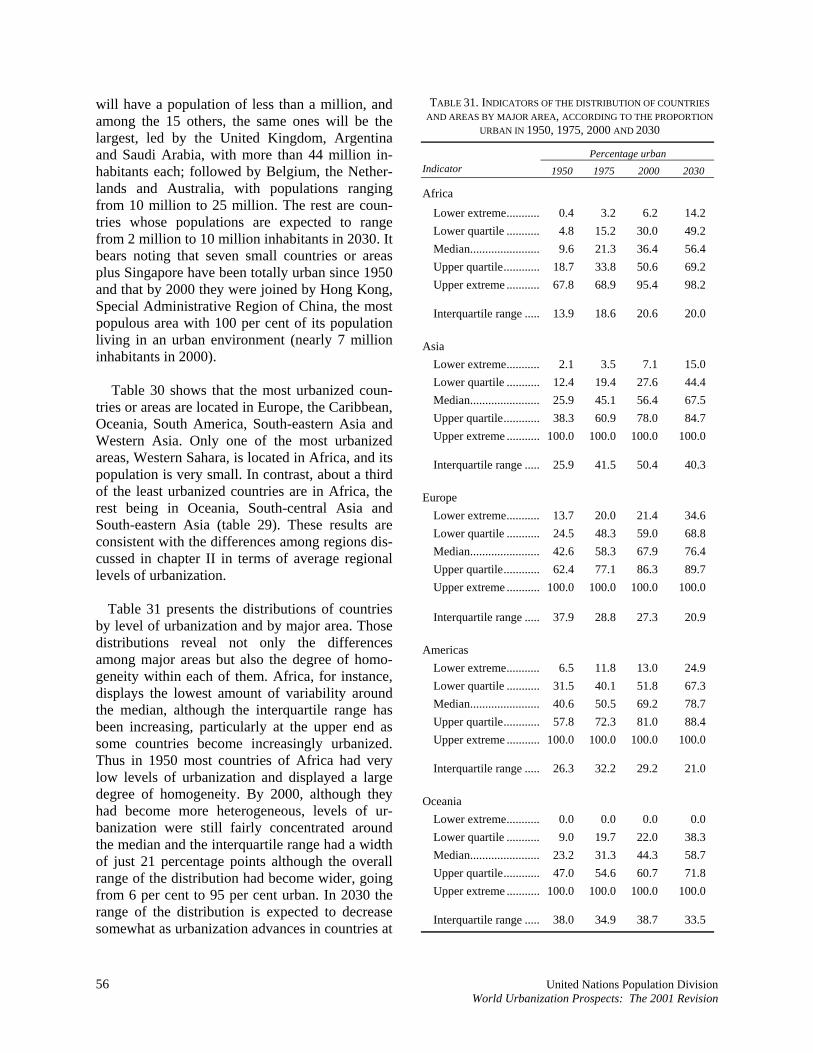
Table 31 presents the distributions of countries
by level of urbanization and by major area. Those distributions reveal not only the differences among major areas but also the degree of homo-geneity within each of them. Africa, for instance, displays the lowest amount of variability around the median, although the interquartile range has been increasing, particularly at the upper end as some countries become increasingly urbanized. Thus in 1950 most countries of Africa had very low levels of urbanization and displayed a large degree of homogeneity. By 2000, although they had become more heterogeneous, levels of ur-banization were still fairly concentrated around the median and the interquartile range had a width of just 21 percentage points although the overall range of the distribution had become wider, going from 6 per cent to 95 per cent urban. In 2030 the range of the distribution is expected to decrease somewhat as urbanization advances in countries at
TABLE 31. INDICATORS OF THE DISTRIBUTION OF COUNTRIES AND AREAS BY MAJOR AREA, ACCORDING TO THE PROPORTION
URBAN IN 1950, 1975, 2000 AND 2030 Percentage urban
Indicator 1950 1975 2000 2030
Africa Lower extreme........... 0.4 3.2 6.2 14.2 Lower quartile ........... 4.8 15.2 30.0 49.2 Median....................... 9.6 21.3 36.4 56.4 Upper quartile............ 18.7 33.8 50.6 69.2 Upper extreme ........... 67.8 68.9 95.4 98.2
Interquartile range ..... 13.9 18.6 20.6 20.0 Asia
Lower extreme........... 2.1 3.5 7.1 15.0 Lower quartile ........... 12.4 19.4 27.6 44.4 Median....................... 25.9 45.1 56.4 67.5 Upper quartile............ 38.3 60.9 78.0 84.7 Upper extreme ........... 100.0 100.0 100.0 100.0
Interquartile range ..... 25.9 41.5 50.4 40.3 Europe
Lower extreme........... 13.7 20.0 21.4 34.6 Lower quartile ........... 24.5 48.3 59.0 68.8 Median....................... 42.6 58.3 67.9 76.4 Upper quartile............ 62.4 77.1 86.3 89.7 Upper extreme ........... 100.0 100.0 100.0 100.0
Interquartile range ..... 37.9 28.8 27.3 20.9 Americas
Lower extreme........... 6.5 11.8 13.0 24.9 Lower quartile ........... 31.5 40.1 51.8 67.3 Median....................... 40.6 50.5 69.2 78.7 Upper quartile............ 57.8 72.3 81.0 88.4 Upper extreme ........... 100.0 100.0 100.0 100.0
Interquartile range ..... 26.3 32.2 29.2 21.0 Oceania
Lower extreme........... 0.0 0.0 0.0 0.0 Lower quartile ........... 9.0 19.7 22.0 38.3 Median....................... 23.2 31.3 44.3 58.7 Upper quartile............ 47.0 54.6 60.7 71.8 Upper extreme ........... 100.0 100.0 100.0 100.0
Interquartile range ..... 38.0 34.9 38.7 33.5
United Nations Population Division 57 World Urbanization Prospects: The 2001 Revision
the lower end of the scale, but homogeneity will still be high, with the central half of the distribu-tion ranging from 49 per cent to 69 per cent, just 20 percentage points in width.
Asia and the Americas, which include Latin
America, the Caribbean and Northern America, displayed a moderate level of variation around the median in 1950 (both had an interquartile range of about 26 percentage points in width) when ur-banization levels in Asia were still low and those in the Americas were already moderately high. In the next half century the variation around the me-dian doubled in Asia to 50 percentage points while it rose only slightly in the Americas to 29 percentage points. These changes reflect the growing heterogeneity in urbanization levels in Asia, a continent comprising at the same time small countries or areas that are highly urbanized and the most populous countries in the world with low levels of urbanization. In the Americas, in contrast, there has been a rapid increase in urbani-zation levels in almost every country, a process expected to continue, resulting not only in high median levels of urbanization similar to those of the developed world, but also in increasing homo-geneity among countries and a reduction of the interquartile range (to 21 percentage points in 2030).
Europe, comprising only more developed re-
gions, is also the only major area where variability around the median has been declining consistently over time as the interquartile range has fallen from 38 percentage points in 1950 to 27 percentage points in 2000 and is projected to drop still further to 21 percentage points by 2030. This reduction reflects the high degree of homogeneity among European countries in terms of patterns of urbani-zation and the advanced stages that most of them have already reached in the transition to a nearly universal urban way of life. By 2030 over three quarters of the countries in Europe are expected to be at least 69 per cent urban.
Lastly, in Oceania, where small countries pre-
dominate, the range of variation around the me-dian is affected by the bimodal nature of the dis-tribution of countries by level of urbanization. Consequently, Oceania is the only major area where the lower extreme remains at 0 and forces
the lower part of the distribution to become more elongated as time elapses. Furthermore, although Australia, New Zealand and some of the small areas in Oceania are highly urbanized, the larger part of the countries or areas in Oceania remain less urbanized than their counterparts in Asia or the Americas. Because of the co-existence of such different groups, by 2000 Oceania displays the second highest degree of variation around the me-dian and is still expected to evince a high degree of heterogeneity in 2030.
B. THE SIZE AND GROWTH OF THE URBAN POPULATION
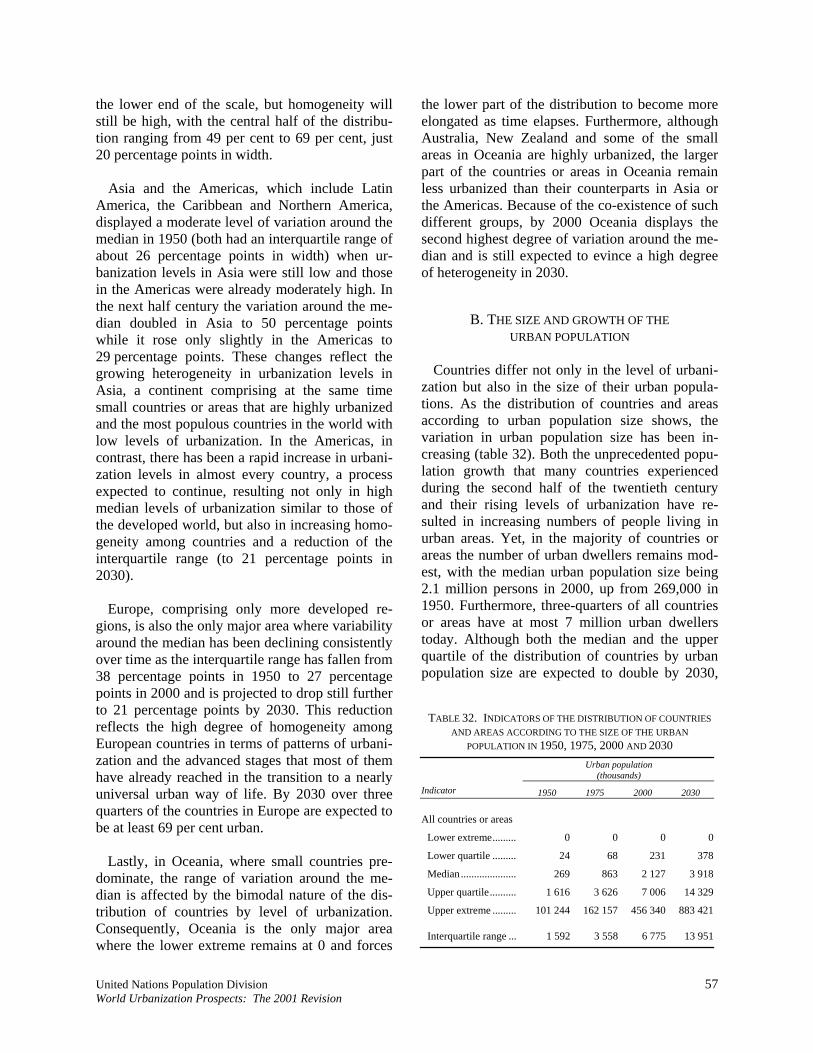
Countries differ not only in the level of urbani-
zation but also in the size of their urban popula-tions. As the distribution of countries and areas according to urban population size shows, the variation in urban population size has been in-creasing (table 32). Both the unprecedented popu-lation growth that many countries experienced during the second half of the twentieth century and their rising levels of urbanization have re-sulted in increasing numbers of people living in urban areas. Yet, in the majority of countries or areas the number of urban dwellers remains mod-est, with the median urban population size being 2.1 million persons in 2000, up from 269,000 in 1950. Furthermore, three-quarters of all countries or areas have at most 7 million urban dwellers today. Although both the median and the upper quartile of the distribution of countries by urban population size are expected to double by 2030,
TABLE 32. INDICATORS OF THE DISTRIBUTION OF COUNTRIES AND AREAS ACCORDING TO THE SIZE OF THE URBAN
POPULATION IN 1950, 1975, 2000 AND 2030 Urban population
(thousands) Indicator 1950 1975 2000 2030
All countries or areas
Lower extreme......... 0 0 0 0
Lower quartile ......... 24 68 231 378
Median..................... 269 863 2 127 3 918
Upper quartile.......... 1 616 3 626 7 006 14 329
Upper extreme ......... 101 244 162 157 456 340 883 421
Interquartile range ... 1 592 3 558 6 775 13 951
58 United Nations Population Division World Urbanization Prospects: The 2001 Revision
most countries will still have small urban popula-tions by then, half with fewer than 4 million urban dwellers and three-quarters with under 14.5 mil-lion. In addition, a quarter of all countries or areas of the world are expected to have at most 378,000 urban dwellers in 2030.
Although the urban populations of most coun-
tries are small and expected to remain small, countries at the upper end of the distribution have large numbers of urban dwellers living in complex urban systems where single cities can have popu-lations of 10 million or more. The countries ac-counting for 75 per cent of the urban population of the world in 1950, 2000 and 2030 are listed in table 33. In 1950, when most countries outside of Europe and Northern America were still in the early stages of urbanization, only 17 countries accounted for three-quarters of the world’s urban population. The United States headed the list with 101 million urban dwellers, followed by China and India with 69 million and 61 million respec-tively, though both had very low levels of urbani-zation (12.5 per cent and 17.3 per cent, respec-tively). The next six slots corresponded to developed countries (Germany, the Russian Federation, the United Kingdom, Japan, Italy and France, in order of urban population size). In total, 11 of the 17 countries in the list were developed countries, most in Europe. The list for 1950 in-cluded also three countries in Latin America (Bra-zil, Mexico and Argentina, in order of urban population size) and three developing countries in Asia (China, India and Indonesia, ordered by ur-ban population size). By 2000, along with the overall increase in the urban population of the world, the number of countries accounting for three-quarters of it had increased to 25, the major-ity (16) belonging to the developing world. China and India headed the list, having seen their urban populations increase over five-fold each. Among other Asian countries, Indonesia rose from fif-teenth to seventh place, and Pakistan, Iran, the Philippines, Turkey, the Republic of Korea and Bangladesh, in order of urban population size, joined the group. There were also additions from Africa (Nigeria, Egypt and South Africa) and Latin America (Colombia). Moreover, most of the developed countries with large urban populations in both 1950 and 2000 saw their ranking in the list
increase between the two dates and two dropped out, Poland and the Netherlands.
By 2030, as urbanization continues to spread
throughout the world, the number of countries expected to account for 75 per cent of the world’s urban population is anticipated to rise to 28, most of them in the developing world. Indeed, only 7 of the 11 developed countries appearing in the lists for 1950 and 2000 are expected to remain in 2030, but all are moved farther down the list as they are displaced by the larger urban populations of de-veloping countries. Among the latter, China and India will continue to have the largest urban popu-lations, but Brazil, Indonesia, Nigeria, Pakistan and Mexico are also expected to rank high, occu-pying places 4 to 8. With the exception of South Africa, all the developing countries appearing in the list for 2000 remain in that for 2030, but six countries are added: three in Africa (the De-mocratic Republic of the Congo, Ethiopia and the United Republic of Tanzania), two in Asia (Saudi Arabia and Viet Nam), and one in Latin America (Venezuela). In addition, Spain and the Ukraine drop out. That is, by 2030, 11 developing coun-tries in Asia are expected to be among those with the largest urban populations in the world, accom-panied by 5 in Latin America and another 5 in Africa.
A comparison of the countries accounting for
three-quarters of the urban population with those accounting for the same proportion of the total population of the world reveals interesting differ-ences (tables 33 and 34). In 1950, 6 of the 21 countries that accounted for 75 per cent of the world population were not among the 17 countries accounting for three-quarters of the urban popula-tion, mainly due to their low levels of urbaniza-tion (table 35). They were, in order of population size, Bangladesh, Pakistan, Nigeria, Viet Nam, Egypt and Turkey. Conversely, Argentina and the Netherlands were on the list of countries account-ing for most of the urban population but not on that of the most populous countries in the world. In 2000 only four of the 27 most populous coun-tries were not on the list of the 28 with the highest numbers of urban dwellers, namely, the Democ-ratic Republic of Congo, Ethiopia, Thailand and Viet Nam. However, five highly urbanized coun-
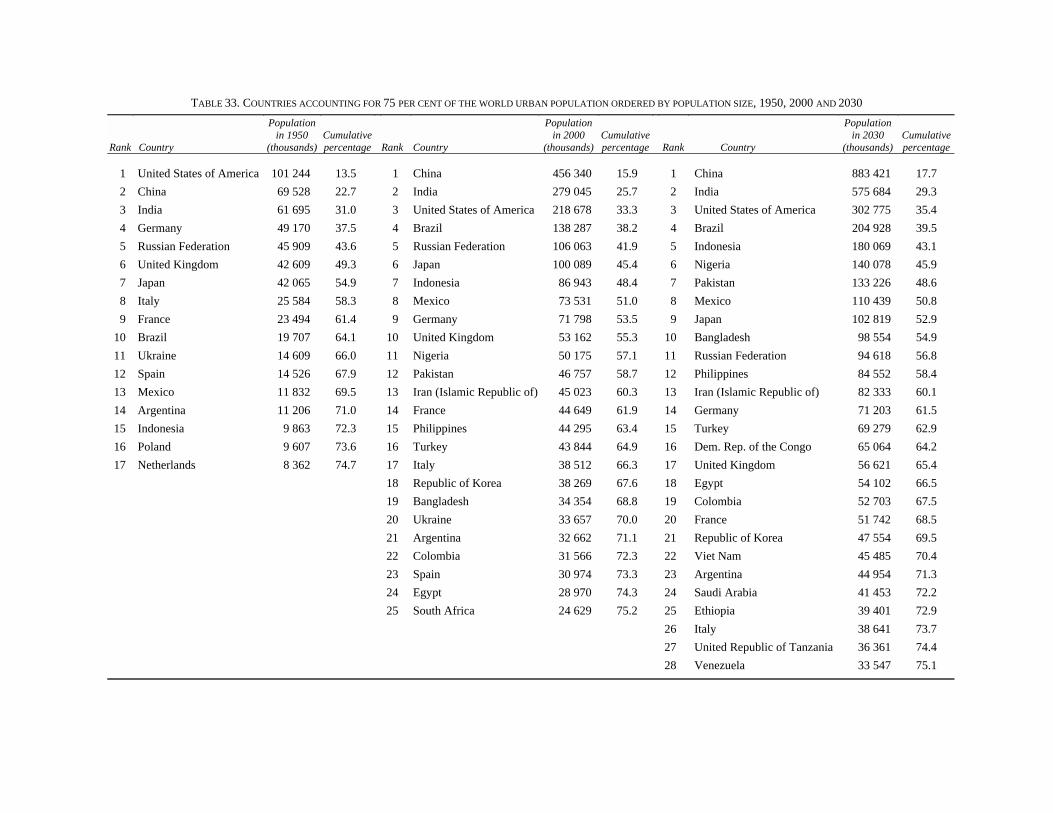
TABLE 33. COUNTRIES ACCOUNTING FOR 75 PER CENT OF THE WORLD URBAN POPULATION ORDERED BY POPULATION SIZE, 1950, 2000 AND 2030
Rank Country
Population in 1950
(thousands) Cumulative percentage Rank Country
Population in 2000
(thousands) Cumulative percentage Rank Country
Population in 2030
(thousands) Cumulative percentage
1 United States of America 101 244 13.5 1 China 456 340 15.9 1 China 883 421 17.7 2 China 69 528 22.7 2 India 279 045 25.7 2 India 575 684 29.3 3 India 61 695 31.0 3 United States of America 218 678 33.3 3 United States of America 302 775 35.4 4 Germany 49 170 37.5 4 Brazil 138 287 38.2 4 Brazil 204 928 39.5 5 Russian Federation 45 909 43.6 5 Russian Federation 106 063 41.9 5 Indonesia 180 069 43.1 6 United Kingdom 42 609 49.3 6 Japan 100 089 45.4 6 Nigeria 140 078 45.9 7 Japan 42 065 54.9 7 Indonesia 86 943 48.4 7 Pakistan 133 226 48.6 8 Italy 25 584 58.3 8 Mexico 73 531 51.0 8 Mexico 110 439 50.8 9 France 23 494 61.4 9 Germany 71 798 53.5 9 Japan 102 819 52.9
10 Brazil 19 707 64.1 10 United Kingdom 53 162 55.3 10 Bangladesh 98 554 54.9 11 Ukraine 14 609 66.0 11 Nigeria 50 175 57.1 11 Russian Federation 94 618 56.8 12 Spain 14 526 67.9 12 Pakistan 46 757 58.7 12 Philippines 84 552 58.4 13 Mexico 11 832 69.5 13 Iran (Islamic Republic of) 45 023 60.3 13 Iran (Islamic Republic of) 82 333 60.1 14 Argentina 11 206 71.0 14 France 44 649 61.9 14 Germany 71 203 61.5 15 Indonesia 9 863 72.3 15 Philippines 44 295 63.4 15 Turkey 69 279 62.9 16 Poland 9 607 73.6 16 Turkey 43 844 64.9 16 Dem. Rep. of the Congo 65 064 64.2 17 Netherlands 8 362 74.7 17 Italy 38 512 66.3 17 United Kingdom 56 621 65.4
18 Republic of Korea 38 269 67.6 18 Egypt 54 102 66.5 19 Bangladesh 34 354 68.8 19 Colombia 52 703 67.5 20 Ukraine 33 657 70.0 20 France 51 742 68.5 21 Argentina 32 662 71.1 21 Republic of Korea 47 554 69.5 22 Colombia 31 566 72.3 22 Viet Nam 45 485 70.4 23 Spain 30 974 73.3 23 Argentina 44 954 71.3 24 Egypt 28 970 74.3 24 Saudi Arabia 41 453 72.2 25 South Africa 24 629 75.2 25 Ethiopia 39 401 72.9 26 Italy 38 641 73.7 27 United Republic of Tanzania 36 361 74.4 28 Venezuela 33 547 75.1
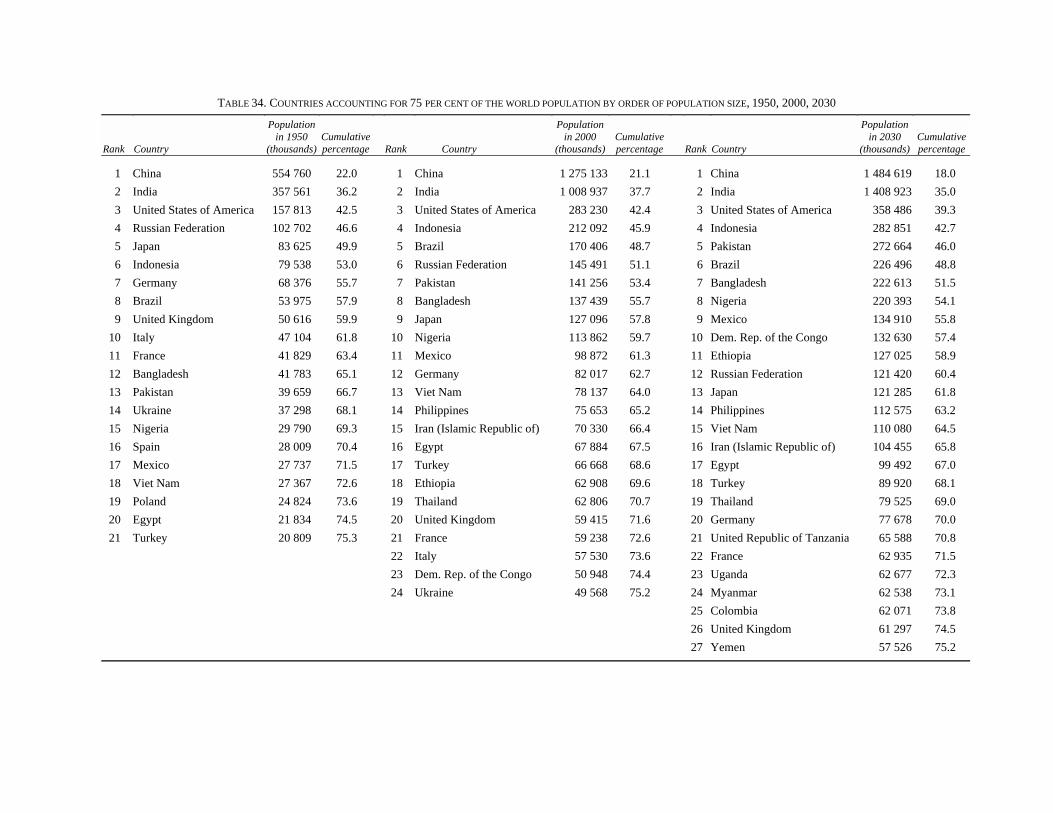
TABLE 34. COUNTRIES ACCOUNTING FOR 75 PER CENT OF THE WORLD POPULATION BY ORDER OF POPULATION SIZE, 1950, 2000, 2030
Rank Country
Population in 1950
(thousands) Cumulative percentage Rank Country
Population in 2000
(thousands) Cumulative percentage Rank Country
Population in 2030
(thousands) Cumulative percentage
1 China 554 760 22.0 1 China 1 275 133 21.1 1 China 1 484 619 18.0 2 India 357 561 36.2 2 India 1 008 937 37.7 2 India 1 408 923 35.0 3 United States of America 157 813 42.5 3 United States of America 283 230 42.4 3 United States of America 358 486 39.3 4 Russian Federation 102 702 46.6 4 Indonesia 212 092 45.9 4 Indonesia 282 851 42.7 5 Japan 83 625 49.9 5 Brazil 170 406 48.7 5 Pakistan 272 664 46.0 6 Indonesia 79 538 53.0 6 Russian Federation 145 491 51.1 6 Brazil 226 496 48.8 7 Germany 68 376 55.7 7 Pakistan 141 256 53.4 7 Bangladesh 222 613 51.5 8 Brazil 53 975 57.9 8 Bangladesh 137 439 55.7 8 Nigeria 220 393 54.1 9 United Kingdom 50 616 59.9 9 Japan 127 096 57.8 9 Mexico 134 910 55.8
10 Italy 47 104 61.8 10 Nigeria 113 862 59.7 10 Dem. Rep. of the Congo 132 630 57.4 11 France 41 829 63.4 11 Mexico 98 872 61.3 11 Ethiopia 127 025 58.9 12 Bangladesh 41 783 65.1 12 Germany 82 017 62.7 12 Russian Federation 121 420 60.4 13 Pakistan 39 659 66.7 13 Viet Nam 78 137 64.0 13 Japan 121 285 61.8 14 Ukraine 37 298 68.1 14 Philippines 75 653 65.2 14 Philippines 112 575 63.2 15 Nigeria 29 790 69.3 15 Iran (Islamic Republic of) 70 330 66.4 15 Viet Nam 110 080 64.5 16 Spain 28 009 70.4 16 Egypt 67 884 67.5 16 Iran (Islamic Republic of) 104 455 65.8 17 Mexico 27 737 71.5 17 Turkey 66 668 68.6 17 Egypt 99 492 67.0 18 Viet Nam 27 367 72.6 18 Ethiopia 62 908 69.6 18 Turkey 89 920 68.1 19 Poland 24 824 73.6 19 Thailand 62 806 70.7 19 Thailand 79 525 69.0 20 Egypt 21 834 74.5 20 United Kingdom 59 415 71.6 20 Germany 77 678 70.0 21 Turkey 20 809 75.3 21 France 59 238 72.6 21 United Republic of Tanzania 65 588 70.8
22 Italy 57 530 73.6 22 France 62 935 71.5 23 Dem. Rep. of the Congo 50 948 74.4 23 Uganda 62 677 72.3 24 Ukraine 49 568 75.2 24 Myanmar 62 538 73.1 25 Colombia 62 071 73.8 26 United Kingdom 61 297 74.5 27 Yemen 57 526 75.2

United Nations Population Division 61 World Urbanization Prospects: The 2001 Revision
TABLE 35. LEVEL OF URBANIZATION AND URBANIZATION RATES FOR THE COUNTRIES WITH THE LARGEST URBAN POPULATIONS, 1950 TO 2030
Percentage urban
Urbanization rate (percentage)
Urban growth rate (percentage)
Rank Country 1950 2000 2030 1950-2000 2000-2030 1950-2000 2000-2030
1 China............................................. 12.5 35.8 59.5 2.10 1.69 3.76 2.20 2 India .............................................. 17.3 27.7 40.9 0.94 1.30 3.02 2.41 3 United States of America .............. 64.2 77.2 84.5 0.37 0.30 1.54 1.08 4 Brazil............................................. 36.5 81.2 90.5 1.60 0.36 3.90 1.31 5 Indonesia....................................... 12.4 41.0 63.7 2.39 1.47 4.35 2.43 6 Nigeria .......................................... 10.1 44.1 63.6 2.94 1.22 5.62 3.42 7 Pakistan......................................... 17.5 33.1 48.9 1.27 1.30 3.81 3.49 8 Mexico .......................................... 42.7 74.4 81.9 1.11 0.32 3.65 1.36 9 Japan ............................................. 50.3 78.8 84.8 0.90 0.25 1.73 0.09
10 Bangladesh.................................... 4.3 25.0 44.3 3.55 1.91 5.93 3.51 11 Russian Federation........................ 44.7 72.9 77.9 0.98 0.22 1.67 -0.38 12 Philippines .................................... 27.1 58.6 75.1 1.54 0.83 4.20 2.15 13 Iran (Islamic Republic of) ............. 27.0 64.0 78.8 1.73 0.69 4.58 2.01 14 Germany ....................................... 71.9 87.5 91.7 0.39 0.15 0.76 -0.03 15 Turkey........................................... 21.3 65.8 77.0 2.25 0.53 4.58 1.53 16 Dem. Rep. of the Congo................ 19.1 30.3 49.1 0.92 1.61 3.78 4.80 17 United Kingdom............................ 84.2 89.5 92.4 0.12 0.11 0.44 0.21 18 Egypt............................................. 31.9 42.7 54.4 0.58 0.81 2.85 2.08 19 Colombia....................................... 42.1 75.0 84.9 1.15 0.41 3.57 1.71 20 France ........................................... 56.2 75.4 82.2 0.59 0.29 1.28 0.49 21 Republic of Korea ......................... 21.4 81.9 90.5 2.69 0.34 4.35 0.72 22 Viet Nam....................................... 11.6 24.1 41.3 1.45 1.80 3.55 2.94 23 Argentina ...................................... 65.3 88.2 91.9 0.60 0.14 2.14 1.06 24 Saudi Arabia ................................. 15.9 86.2 92.6 3.38 0.24 7.08 2.87 25 Ethiopia......................................... 4.6 15.5 31.0 2.43 2.31 4.89 4.65 26 Italy ............................................... 54.3 66.9 76.1 0.42 0.43 0.82 0.01 27 United Republic of Tanzania ........ 3.8 32.3 55.4 4.28 1.81 7.27 3.89 28 Venezuela...................................... 46.8 86.9 91.8 1.24 0.18 4.35 1.56 29 South Africa.................................. 43.1 56.9 73.5 0.55 0.86 2.86 0.91 30 Ukraine ......................................... 39.2 67.9 75.6 1.10 0.36 1.67 -0.56 31 Spain ............................................. 51.9 77.6 84.5 0.81 0.28 1.51 -0.02 32 Poland ........................................... 38.7 62.3 72.5 0.95 0.50 1.84 0.32 33 Netherlands ................................... 82.7 89.5 92.6 0.16 0.11 1.06 0.26
tries appeared on the list of countries with large numbers of urban dwellers although their overall population did not qualify them for the list of most populous countries, namely, Argentina, Co-lombia, the Republic of Korea, Spain and South Africa. By 2030, four of the most populous coun-tries (Myanmar, Thailand, Uganda, and Yemen)
are not expected to be among those with the larg-est numbers of urban dwellers, and five of the lat-ter (Argentina, Italy, the Republic of Korea, Saudi Arabia and Venezuela) are not expected to be among the most populous countries. Despite dif-ferences between the two sets of countries, the large degree of overlap between the two indicates
62 United Nations Population Division World Urbanization Prospects: The 2001 Revision
that urban populations are tending to follow the concentration patterns of the overall world population.
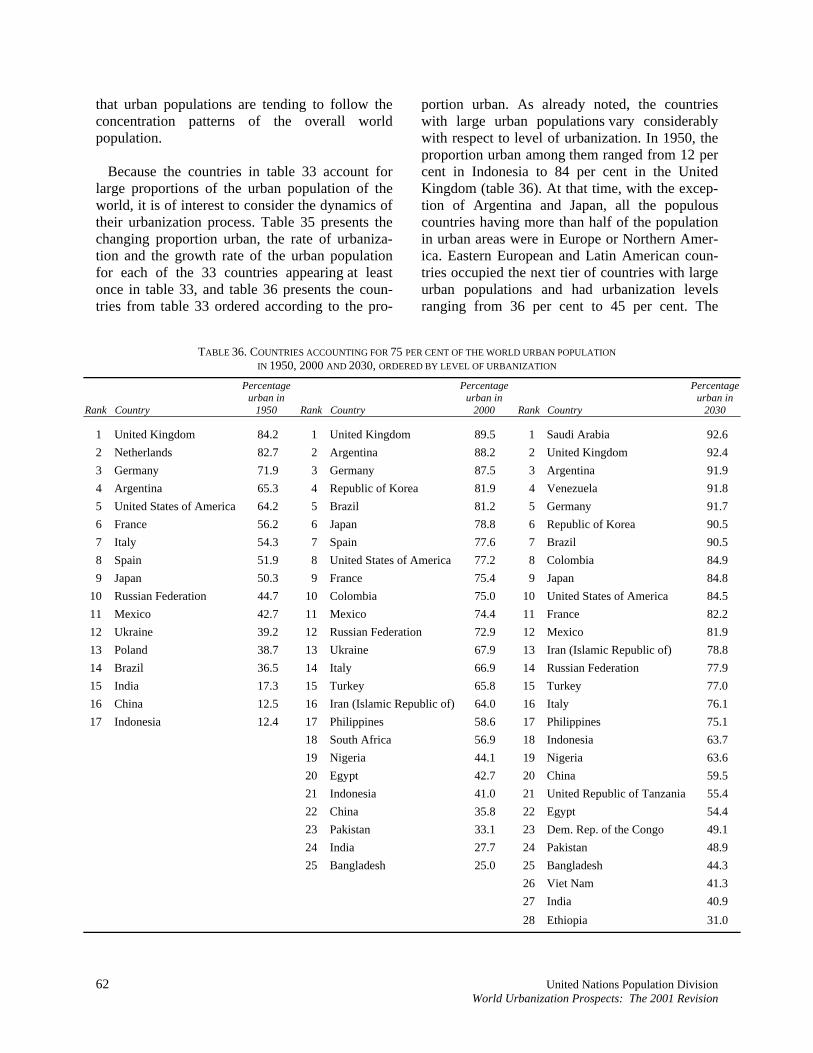
Because the countries in table 33 account for
large proportions of the urban population of the world, it is of interest to consider the dynamics of their urbanization process. Table 35 presents the changing proportion urban, the rate of urbaniza-tion and the growth rate of the urban population for each of the 33 countries appearing at least once in table 33, and table 36 presents the coun-tries from table 33 ordered according to the pro-
portion urban. As already noted, the countries with large urban populations vary considerably with respect to level of urbanization. In 1950, the proportion urban among them ranged from 12 per cent in Indonesia to 84 per cent in the United Kingdom (table 36). At that time, with the excep-tion of Argentina and Japan, all the populous countries having more than half of the population in urban areas were in Europe or Northern Amer-ica. Eastern European and Latin American coun-tries occupied the next tier of countries with large urban populations and had urbanization levels ranging from 36 per cent to 45 per cent. The
TABLE 36. COUNTRIES ACCOUNTING FOR 75 PER CENT OF THE WORLD URBAN POPULATION IN 1950, 2000 AND 2030, ORDERED BY LEVEL OF URBANIZATION
Rank Country
Percentage urban in
1950 Rank Country
Percentage urban in
2000 Rank Country
Percentage urban in
2030
1 United Kingdom 84.2 1 United Kingdom 89.5 1 Saudi Arabia 92.6 2 Netherlands 82.7 2 Argentina 88.2 2 United Kingdom 92.4 3 Germany 71.9 3 Germany 87.5 3 Argentina 91.9 4 Argentina 65.3 4 Republic of Korea 81.9 4 Venezuela 91.8 5 United States of America 64.2 5 Brazil 81.2 5 Germany 91.7 6 France 56.2 6 Japan 78.8 6 Republic of Korea 90.5 7 Italy 54.3 7 Spain 77.6 7 Brazil 90.5 8 Spain 51.9 8 United States of America 77.2 8 Colombia 84.9 9 Japan 50.3 9 France 75.4 9 Japan 84.8
10 Russian Federation 44.7 10 Colombia 75.0 10 United States of America 84.5 11 Mexico 42.7 11 Mexico 74.4 11 France 82.2 12 Ukraine 39.2 12 Russian Federation 72.9 12 Mexico 81.9 13 Poland 38.7 13 Ukraine 67.9 13 Iran (Islamic Republic of) 78.8 14 Brazil 36.5 14 Italy 66.9 14 Russian Federation 77.9 15 India 17.3 15 Turkey 65.8 15 Turkey 77.0 16 China 12.5 16 Iran (Islamic Republic of) 64.0 16 Italy 76.1 17 Indonesia 12.4 17 Philippines 58.6 17 Philippines 75.1
18 South Africa 56.9 18 Indonesia 63.7 19 Nigeria 44.1 19 Nigeria 63.6 20 Egypt 42.7 20 China 59.5 21 Indonesia 41.0 21 United Republic of Tanzania 55.4 22 China 35.8 22 Egypt 54.4 23 Pakistan 33.1 23 Dem. Rep. of the Congo 49.1 24 India 27.7 24 Pakistan 48.9 25 Bangladesh 25.0 25 Bangladesh 44.3 26 Viet Nam 41.3 27 India 40.9 28 Ethiopia 31.0
United Nations Population Division 63 World Urbanization Prospects: The 2001 Revision
populous countries in developing Asia—China, India and Indonesia—came next, all with levels of urbanization under 20 per cent.
Today the most urbanized countries with large
urban populations include several in the less de-veloped regions, led by Argentina with 88 per cent of its population urban in 2000, followed by the Republic of Korea, Brazil, Colombia, and Mexico, each with 74 per cent or more of their populations living in urban areas, and then by Turkey and Iran, each with about 65 per cent of the population urban (table 36). However, most of the highly urbanized countries with large urban populations in 2000 still belong to the more de-veloped regions. Among the 16 countries with large urban populations and a level of urbaniza-tion of 64 per cent or more, 8 are in Europe or Northern America. The other nine countries with large urban populations in 2000 have considerably lower levels of urbanization, with only the Philip-pines and South Africa having more than half of their populations urban. The other seven are lo-cated in Africa or Asia and have levels of urbanization ranging from 25 per cent to 44 per cent. They include the most populous countries in the world, namely China, India and Indonesia.
The urbanization levels of most of the countries
with large urban populations are expected to rise markedly during 2000-2030. Among the 28 coun-tries with large urban populations in 2030, 17 are projected to be over 75 per cent urban and just 7 of those countries are in the more developed re-gions. In addition, China, Egypt, Indonesia, Nige-ria and the United Republic of Tanzania are pro-jected to be more than 50 per cent urban by 2030. However, the populous countries of South-central Asia, namely, Bangladesh, India and Pakistan, will still be less than 50 per cent urban.
In general, countries at high levels of urbaniza-
tion tend to experience low rates of urbanization because a high proportion urban cannot keep on rising at a fast pace for long. Conversely, coun-tries with a low percentage of their population in urban areas can and often do experience a rapid increase of that percentage. Consequently, the countries of Europe, Northern America and Latin America, with fairly high proportions of their populations urban, display low rates of urbaniza-
tion during 1950-2000 and even more so during 2000-2030 (under half of a per cent per year). In contrast, high rates of urbanization (over 2 per cent per year during 1950-2000 and over 1 per cent during 2000-2030) are characteristic of most of the African and Asian countries with large ur-ban populations (table 34). Bangladesh, China, Ethiopia, Indonesia, Nigeria, the Republic of Ko-rea, Saudi Arabia, Turkey and the United Repub-lic of Tanzania exhibited particularly high annual rates of urbanization during 1950-2000 (ranging from just over 2 per cent to 4.3 per cent). During 2000-2030, expected rates of urbanization tend to be lower, but Bangladesh, China, the Democratic Republic of the Congo, Ethiopia, Indonesia, the United Republic of Tanzania and Viet Nam are all projected to see their proportion urban rise at rates equal or higher than 1.5 per cent per year.
The rate of urbanization is determined by both
the rate of growth of the urban population and that of the total population. Positive rates of urbaniza-tion result when the urban population grows at a faster rate than the total population. But the pace of urban population growth depends on the natural increase of the urban population and the popula-tion gained by urban areas through both net rural-urban migration and the reclassification of rural settlements into cities and towns. All three com-ponents of urban growth were large in developing countries up to 2000, since the level of natural increase was high in most of them until the 1970s and, as part of the process of modernization, their urban settlements expanded both geographically (by annexation and reclassification) and demog-raphically (by attracting rural dwellers). As table 37 shows, among the countries with the largest urban populations, the rate of growth of the urban population has been particularly high in countries of Asia and Africa, 10 of which experienced aver-age urban growth rates higher than 4 per cent per year during 1950-2000. Only one country in Latin America, Venezuela, experienced a similar rate of urban population growth. Latin American coun-tries have experienced, in general, more moderate urban growth rates during 1950-2000, though they were still high by historical standards. Similarly, the most populous countries, China and India, saw their urban populations grow at more than 3 per cent per year during 1950-2000. In contrast, urban growth rates among the most populous developed
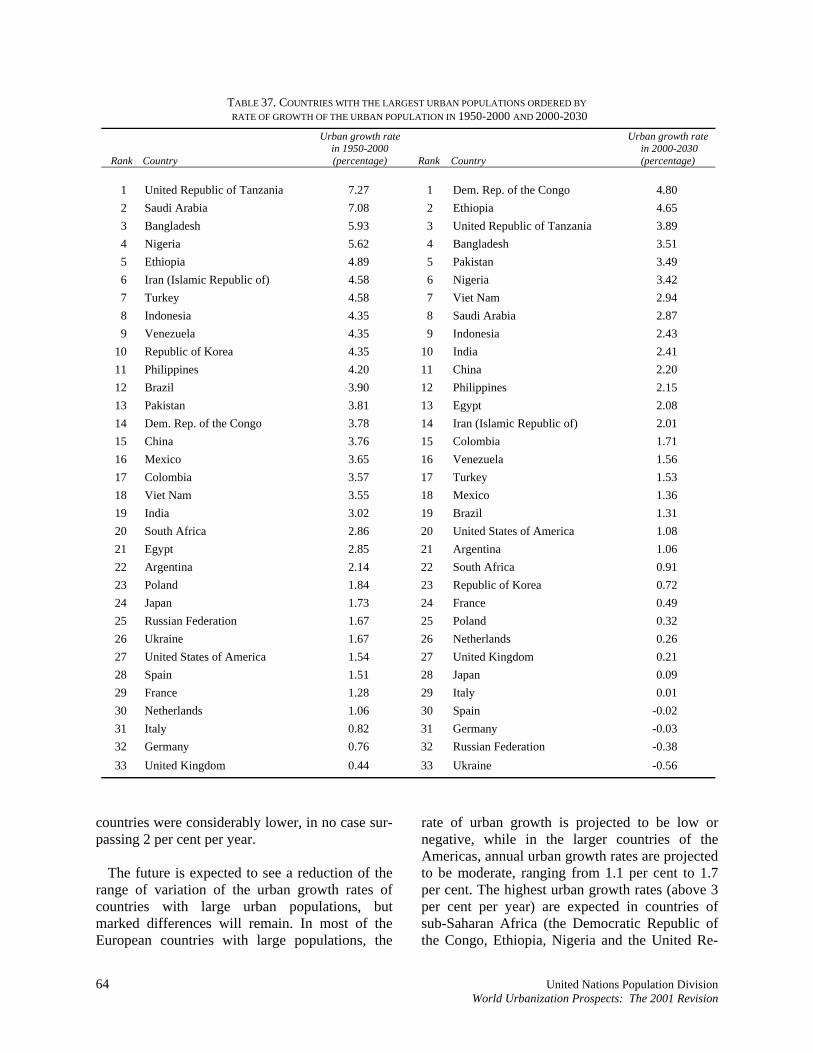
64 United Nations Population Division World Urbanization Prospects: The 2001 Revision
TABLE 37. COUNTRIES WITH THE LARGEST URBAN POPULATIONS ORDERED BY RATE OF GROWTH OF THE URBAN POPULATION IN 1950-2000 AND 2000-2030
Rank Country
Urban growth rate in 1950-2000 (percentage) Rank Country
Urban growth rate in 2000-2030 (percentage)
1 United Republic of Tanzania 7.27 1 Dem. Rep. of the Congo 4.80 2 Saudi Arabia 7.08 2 Ethiopia 4.65 3 Bangladesh 5.93 3 United Republic of Tanzania 3.89 4 Nigeria 5.62 4 Bangladesh 3.51 5 Ethiopia 4.89 5 Pakistan 3.49 6 Iran (Islamic Republic of) 4.58 6 Nigeria 3.42 7 Turkey 4.58 7 Viet Nam 2.94 8 Indonesia 4.35 8 Saudi Arabia 2.87 9 Venezuela 4.35 9 Indonesia 2.43
10 Republic of Korea 4.35 10 India 2.41 11 Philippines 4.20 11 China 2.20 12 Brazil 3.90 12 Philippines 2.15 13 Pakistan 3.81 13 Egypt 2.08 14 Dem. Rep. of the Congo 3.78 14 Iran (Islamic Republic of) 2.01 15 China 3.76 15 Colombia 1.71 16 Mexico 3.65 16 Venezuela 1.56 17 Colombia 3.57 17 Turkey 1.53 18 Viet Nam 3.55 18 Mexico 1.36 19 India 3.02 19 Brazil 1.31 20 South Africa 2.86 20 United States of America 1.08 21 Egypt 2.85 21 Argentina 1.06 22 Argentina 2.14 22 South Africa 0.91 23 Poland 1.84 23 Republic of Korea 0.72 24 Japan 1.73 24 France 0.49 25 Russian Federation 1.67 25 Poland 0.32 26 Ukraine 1.67 26 Netherlands 0.26 27 United States of America 1.54 27 United Kingdom 0.21 28 Spain 1.51 28 Japan 0.09 29 France 1.28 29 Italy 0.01 30 Netherlands 1.06 30 Spain -0.02 31 Italy 0.82 31 Germany -0.03 32 Germany 0.76 32 Russian Federation -0.38 33 United Kingdom 0.44 33 Ukraine -0.56
countries were considerably lower, in no case sur-passing 2 per cent per year.
The future is expected to see a reduction of the
range of variation of the urban growth rates of countries with large urban populations, but marked differences will remain. In most of the European countries with large populations, the
rate of urban growth is projected to be low or negative, while in the larger countries of the Americas, annual urban growth rates are projected to be moderate, ranging from 1.1 per cent to 1.7 per cent. The highest urban growth rates (above 3 per cent per year) are expected in countries of sub-Saharan Africa (the Democratic Republic of the Congo, Ethiopia, Nigeria and the United Re-
United Nations Population Division 65 World Urbanization Prospects: The 2001 Revision
public of Tanzania) and in some of the most popu-lous countries of Asia (Bangladesh and Pakistan). However, most large countries of Asia are ex-pected to experience considerably lower rates of urban population growth, ranging from 1.5 per cent to 2.4 per cent.
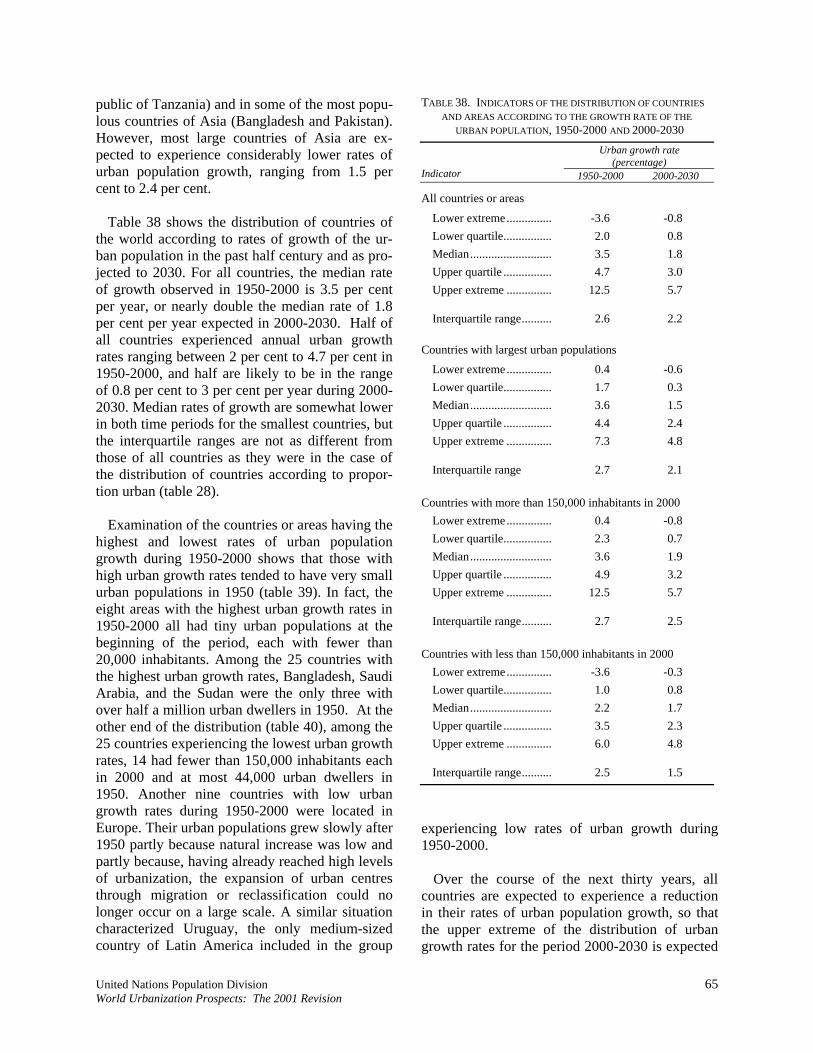
Table 38 shows the distribution of countries of
the world according to rates of growth of the ur-ban population in the past half century and as pro-jected to 2030. For all countries, the median rate of growth observed in 1950-2000 is 3.5 per cent per year, or nearly double the median rate of 1.8 per cent per year expected in 2000-2030. Half of all countries experienced annual urban growth rates ranging between 2 per cent to 4.7 per cent in 1950-2000, and half are likely to be in the range of 0.8 per cent to 3 per cent per year during 2000-2030. Median rates of growth are somewhat lower in both time periods for the smallest countries, but the interquartile ranges are not as different from those of all countries as they were in the case of the distribution of countries according to propor-tion urban (table 28).
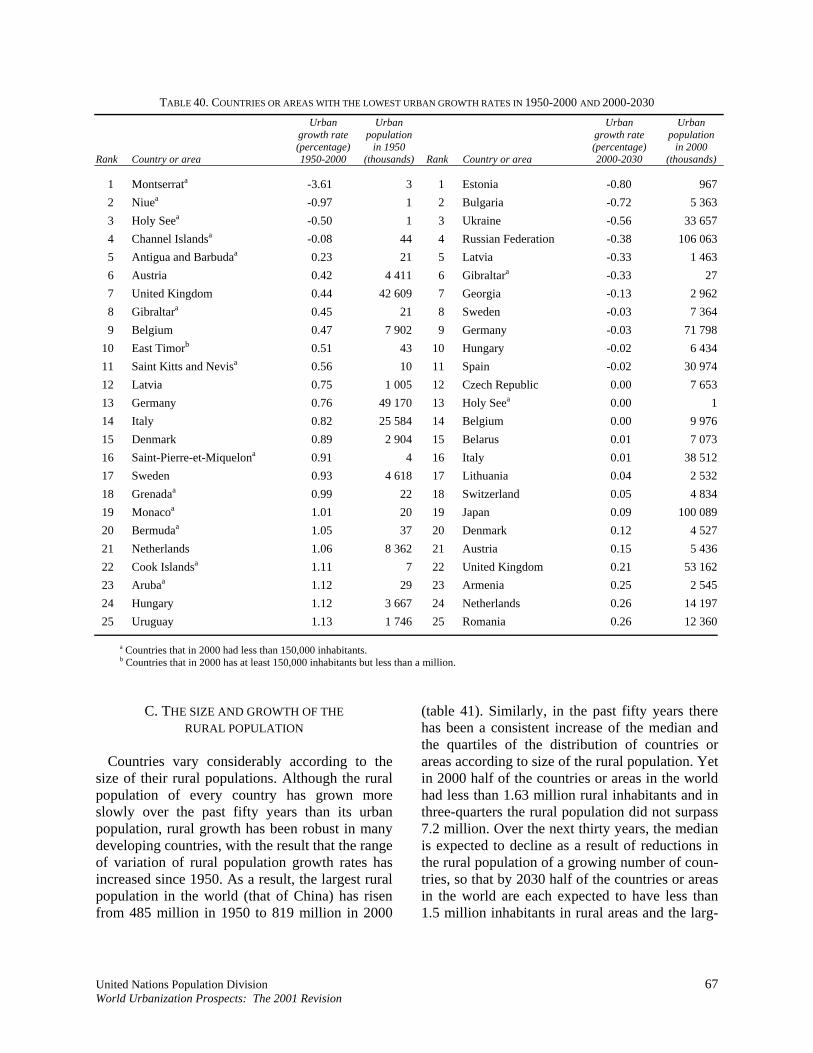
Examination of the countries or areas having the
highest and lowest rates of urban population growth during 1950-2000 shows that those with high urban growth rates tended to have very small urban populations in 1950 (table 39). In fact, the eight areas with the highest urban growth rates in 1950-2000 all had tiny urban populations at the beginning of the period, each with fewer than 20,000 inhabitants. Among the 25 countries with the highest urban growth rates, Bangladesh, Saudi Arabia, and the Sudan were the only three with over half a million urban dwellers in 1950. At the other end of the distribution (table 40), among the 25 countries experiencing the lowest urban growth rates, 14 had fewer than 150,000 inhabitants each in 2000 and at most 44,000 urban dwellers in 1950. Another nine countries with low urban growth rates during 1950-2000 were located in Europe. Their urban populations grew slowly after 1950 partly because natural increase was low and partly because, having already reached high levels of urbanization, the expansion of urban centres through migration or reclassification could no longer occur on a large scale. A similar situation characterized Uruguay, the only medium-sized country of Latin America included in the group
TABLE 38. INDICATORS OF THE DISTRIBUTION OF COUNTRIES AND AREAS ACCORDING TO THE GROWTH RATE OF THE
URBAN POPULATION, 1950-2000 AND 2000-2030
Urban growth rate (percentage)
Indicator 1950-2000 2000-2030
All countries or areas Lower extreme............... -3.6 -0.8 Lower quartile................ 2.0 0.8 Median........................... 3.5 1.8 Upper quartile ................ 4.7 3.0 Upper extreme ............... 12.5 5.7
Interquartile range.......... 2.6 2.2
Countries with largest urban populations Lower extreme............... 0.4 -0.6 Lower quartile................ 1.7 0.3 Median........................... 3.6 1.5 Upper quartile ................ 4.4 2.4 Upper extreme ............... 7.3 4.8
Interquartile range 2.7 2.1 Countries with more than 150,000 inhabitants in 2000
Lower extreme............... 0.4 -0.8 Lower quartile................ 2.3 0.7 Median........................... 3.6 1.9 Upper quartile ................ 4.9 3.2 Upper extreme ............... 12.5 5.7
Interquartile range.......... 2.7 2.5 Countries with less than 150,000 inhabitants in 2000
Lower extreme............... -3.6 -0.3 Lower quartile................ 1.0 0.8 Median........................... 2.2 1.7 Upper quartile ................ 3.5 2.3 Upper extreme ............... 6.0 4.8
Interquartile range.......... 2.5 1.5
experiencing low rates of urban growth during 1950-2000.
Over the course of the next thirty years, all
countries are expected to experience a reduction in their rates of urban population growth, so that the upper extreme of the distribution of urban growth rates for the period 2000-2030 is expected

66 United Nations Population Division World Urbanization Prospects: The 2001 Revision
TABLE 39. COUNTRIES OR AREAS WITH THE HIGHEST URBAN GROWTH RATES IN 1950-2000 AND 2000-2030
Rank Country or area
Urban growth rate (percentage) 1950-2000
Urban population
in 1950 (thousands) Rank Country or area
Urban growth rate (percentage) 2000-2030
Urban population
in 2000 (thousands)
1 Botswana 12.49 1 1 Uganda 5.75 3 299 2 Oman 10.34 11 2 Burundi 5.56 569 3 United Arab Emirates 9.73 17 3 Niger 5.54 2 228 4 Lesotho 8.79 7 4 Yemen 5.50 4 534 5 Mauritania 8.76 19 5 Bhutan 5.42 149 6 Papua New Guinea 8.63 11 6 Burkina Faso 5.32 1 905 7 Swazilandb 8.41 4 7 Somalia 5.14 2 413 8 Comorosb 7.38 6 8 Solomon Islandsb 5.10 88 9 Mozambique 7.29 153 9 Rwanda 4.85 468
10 United Republic of Tanzania 7.27 299 10 Liberia 4.81 1 308 11 Saudi Arabia 7.08 509 11 Afghanistan 4.81 4 762 12 Qatarb 7.01 16 12 Dem. Rep. of the Congo 4.80 15 427 13 Kenya 6.75 350 13 Montserrata 4.75 0 14 Benin 6.53 101 14 Chad 4.67 1 876 15 Western Saharab 6.50 9 15 Ethiopia 4.65 9 762 16 Libyan Arab Jamahiriya 6.38 191 16 Eritrea 4.65 685 17 Cape Verdeb 6.27 12 17 Nepal 4.61 2 730 18 Jordan 6.25 170 18 Mali 4.59 3 427 19 Djiboutib 6.05 26 19 Malawi 4.56 1 665 20 Uganda 6.04 161 20 Angola 4.53 4 492 21 Kuwait 6.04 90 21 Cambodia 4.52 2 216 22 Andorraa 5.99 4 22 Maldivesb 4.27 80 23 Sudan 5.93 579 23 Madagascar 4.26 4 710 24 Bangladesh 5.93 1 774 24 Sierra Leone 4.19 1 614 25 Côte d'Ivoire 5.90 365 25 East Timorb 4.07 55
a Countries that in 2000 had less than 150,000 inhabitants. b Countries that in 2000 has at least 150,000 inhabitants but less than a million.
to be considerably lower than that estimated for 1950-2000 (5.7 per cent versus 12.5 per cent, as shown in table 38). Furthermore, there will be a reduction in the variation of urban growth rates among all countries, so that the interquartile range will decrease from 2.7 to 2.2 percentage points; this reduction being more marked among small countries. However, more countries or areas will have negative rates of urban growth, with the number increasing from 4 in 1950-2000 to 11 in 2000-2030, all of the latter being countries or ar-eas in Europe (table 40). In addition, urban popu-
lation growth rates are expected to be very low in another 12 European countries or areas as well as Armenia and in Japan. That is, the lowest rates of urban population growth projected for 2000-2030 are concentrated in Europe. In contrast, the high-est annual rates of urban population growth pro-jected for 2000-2030, which vary between 4.1 per cent and 5.8 per cent, are expected in countries of Africa and Asia all but two of which (the Democ-ratic Republic of the Congo and Ethiopia) had urban populations with fewer than 5 million in-habitants in 2000 (table 39).
United Nations Population Division 67 World Urbanization Prospects: The 2001 Revision
TABLE 40. COUNTRIES OR AREAS WITH THE LOWEST URBAN GROWTH RATES IN 1950-2000 AND 2000-2030
Rank Country or area
Urban growth rate (percentage) 1950-2000
Urban population
in 1950 (thousands) Rank Country or area
Urban growth rate (percentage) 2000-2030
Urban population
in 2000 (thousands)
1 Montserrata -3.61 3 1 Estonia -0.80 967 2 Niuea -0.97 1 2 Bulgaria -0.72 5 363 3 Holy Seea -0.50 1 3 Ukraine -0.56 33 657 4 Channel Islandsa -0.08 44 4 Russian Federation -0.38 106 063 5 Antigua and Barbudaa 0.23 21 5 Latvia -0.33 1 463 6 Austria 0.42 4 411 6 Gibraltara -0.33 27 7 United Kingdom 0.44 42 609 7 Georgia -0.13 2 962 8 Gibraltara 0.45 21 8 Sweden -0.03 7 364 9 Belgium 0.47 7 902 9 Germany -0.03 71 798
10 East Timorb 0.51 43 10 Hungary -0.02 6 434 11 Saint Kitts and Nevisa 0.56 10 11 Spain -0.02 30 974 12 Latvia 0.75 1 005 12 Czech Republic 0.00 7 653 13 Germany 0.76 49 170 13 Holy Seea 0.00 1 14 Italy 0.82 25 584 14 Belgium 0.00 9 976 15 Denmark 0.89 2 904 15 Belarus 0.01 7 073 16 Saint-Pierre-et-Miquelona 0.91 4 16 Italy 0.01 38 512 17 Sweden 0.93 4 618 17 Lithuania 0.04 2 532 18 Grenadaa 0.99 22 18 Switzerland 0.05 4 834 19 Monacoa 1.01 20 19 Japan 0.09 100 089 20 Bermudaa 1.05 37 20 Denmark 0.12 4 527 21 Netherlands 1.06 8 362 21 Austria 0.15 5 436 22 Cook Islandsa 1.11 7 22 United Kingdom 0.21 53 162 23 Arubaa 1.12 29 23 Armenia 0.25 2 545 24 Hungary 1.12 3 667 24 Netherlands 0.26 14 197 25 Uruguay 1.13 1 746 25 Romania 0.26 12 360
a Countries that in 2000 had less than 150,000 inhabitants. b Countries that in 2000 has at least 150,000 inhabitants but less than a million.
C. THE SIZE AND GROWTH OF THE RURAL POPULATION
Countries vary considerably according to the
size of their rural populations. Although the rural population of every country has grown more slowly over the past fifty years than its urban population, rural growth has been robust in many developing countries, with the result that the range of variation of rural population growth rates has increased since 1950. As a result, the largest rural population in the world (that of China) has risen from 485 million in 1950 to 819 million in 2000
(table 41). Similarly, in the past fifty years there has been a consistent increase of the median and the quartiles of the distribution of countries or areas according to size of the rural population. Yet in 2000 half of the countries or areas in the world had less than 1.63 million rural inhabitants and in three-quarters the rural population did not surpass 7.2 million. Over the next thirty years, the median is expected to decline as a result of reductions in the rural population of a growing number of coun-tries, so that by 2030 half of the countries or areas in the world are each expected to have less than 1.5 million inhabitants in rural areas and the larg-
68 United Nations Population Division World Urbanization Prospects: The 2001 Revision
TABLE 41. INDICATORS OF THE DISTRIBUTION OF COUNTRIES AND AREAS ACCORDING TO THE SIZE OF THE RURAL
POPULATION IN 1950, 1975, 2000 AND 2030 Rural population
(thousands) Indicator 1950 1975 2000 2030
All countries or areas
Lower extreme ........... 0 0 0 0
Lower quartile............ 54 67 90 85
Median ....................... 1 093 1 299 1 627 1 463
Upper quartile ............ 4 039 5 037 7 220 8 689
Upper extreme ........... 485 232 766 362 818 793 833 238
Interquartile range...... 3 985 4 970 7 129 8 604
est rural population in the world, which will then correspond to India, will likely be lower than 835 million (table 41).
The urbanized countries of the developed world
have been experiencing declines in their rural populations for some time. In Europe, this has meant that the distribution of countries by rural population size has become more compressed as the upper extreme has declined (table 42). Europe is in fact the only major area where all the loca-tion parameters of the distribution of countries by rural population size, including the median, have been declining since 1950. By 2030 the largest rural population in Europe will be 27 million, down from 39 million in 2000 and 57 million in 1950. No other region has as yet experienced re-ductions of the rural population such as those ex-perienced by Europe, but between 2000 and 2030 most countries in the Americas are expected to follow similar trends. In the other three major ar-eas, all the indicators of rural population size, which rose from 1950 to 2000, will also continue to grow in the future. Thus the median rural popu-lation in Asia increases from 2.3 million in 1950 to 4.3 million in 2000 and will likely reach 5.1 million in 2030, while the median in Africa rises from 2 million in 1950 to 5.4 million in 2000 and to 7.4 million in 2030. Other location indica-tors are also expected to increase, since most countries in Africa and Asia are projected to see their rural populations grow from 2000 to 2030. Furthermore, the interquartile ranges for Africa and Asia, which rose substantially between 1950 and 2000, are expected to continue increasing be-
tween 2000 and 2030, indicating growing vari-ability in rural population sizes. Trends and pro-jections in Oceania mirror those of Africa and Asia, with increasing trends in the median and interquartile ranges over the two periods.
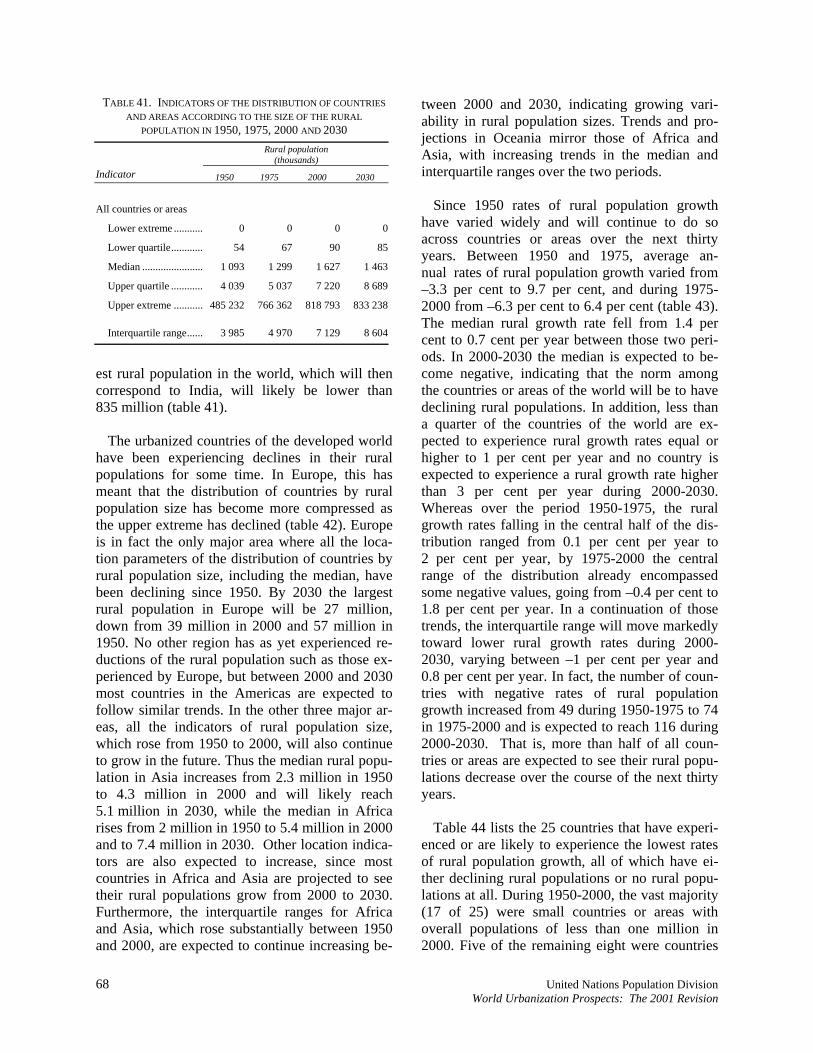
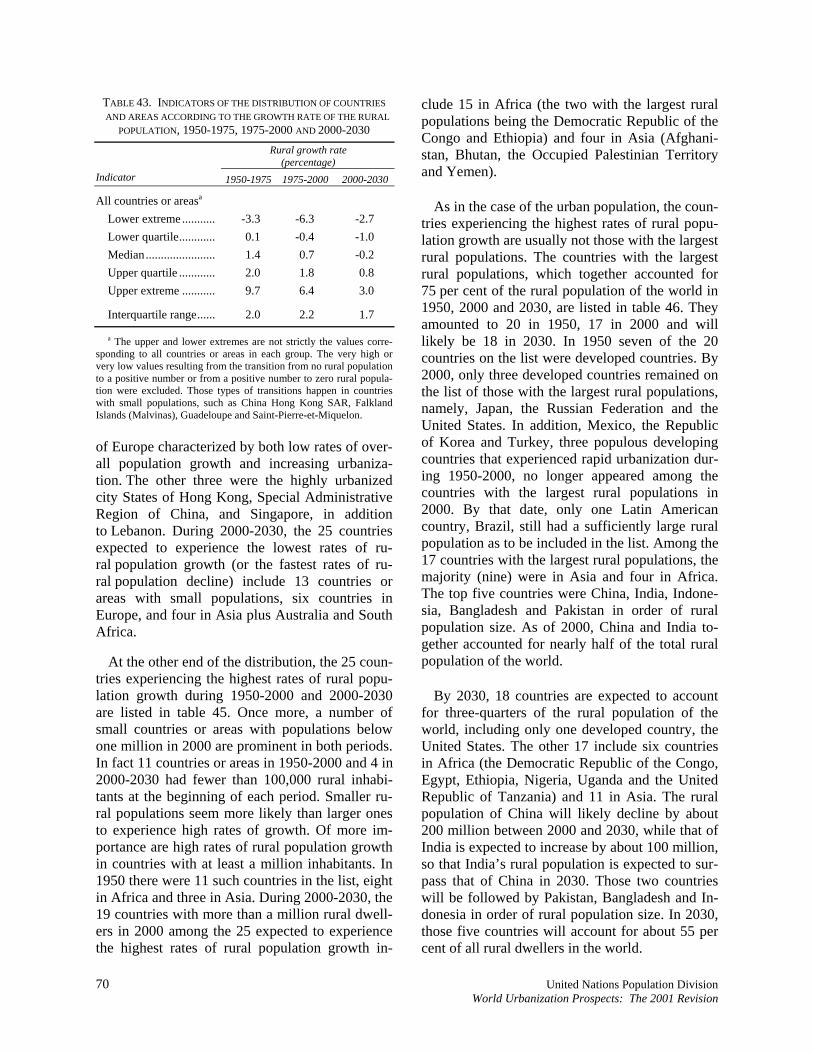
Since 1950 rates of rural population growth
have varied widely and will continue to do so across countries or areas over the next thirty years. Between 1950 and 1975, average an-nual rates of rural population growth varied from –3.3 per cent to 9.7 per cent, and during 1975-2000 from –6.3 per cent to 6.4 per cent (table 43). The median rural growth rate fell from 1.4 per cent to 0.7 cent per year between those two peri-ods. In 2000-2030 the median is expected to be-come negative, indicating that the norm among the countries or areas of the world will be to have declining rural populations. In addition, less than a quarter of the countries of the world are ex-pected to experience rural growth rates equal or higher to 1 per cent per year and no country is expected to experience a rural growth rate higher than 3 per cent per year during 2000-2030. Whereas over the period 1950-1975, the rural growth rates falling in the central half of the dis-tribution ranged from 0.1 per cent per year to 2 per cent per year, by 1975-2000 the central range of the distribution already encompassed some negative values, going from –0.4 per cent to 1.8 per cent per year. In a continuation of those trends, the interquartile range will move markedly toward lower rural growth rates during 2000-2030, varying between –1 per cent per year and 0.8 per cent per year. In fact, the number of coun-tries with negative rates of rural population growth increased from 49 during 1950-1975 to 74 in 1975-2000 and is expected to reach 116 during 2000-2030. That is, more than half of all coun-tries or areas are expected to see their rural popu-lations decrease over the course of the next thirty years.
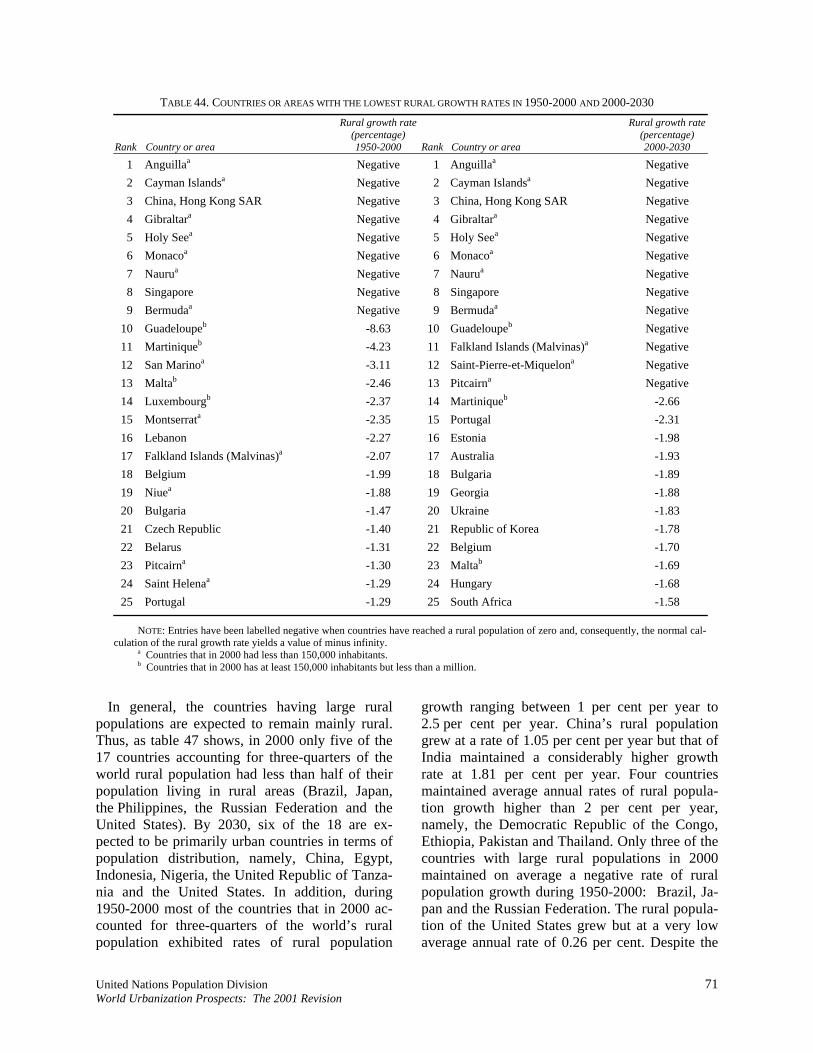
Table 44 lists the 25 countries that have experi-
enced or are likely to experience the lowest rates of rural population growth, all of which have ei-ther declining rural populations or no rural popu-lations at all. During 1950-2000, the vast majority (17 of 25) were small countries or areas with overall populations of less than one million in 2000. Five of the remaining eight were countries

United Nations Population Division 69 World Urbanization Prospects: The 2001 Revision
TABLE 42. INDICATORS OF THE DISTRIBUTION OF COUNTRIES AND AREAS BY MAJOR AREA, ACCORDING TO THE SIZE OF THE RURAL POPULATION IN 1950, 1975, 2000 AND 2030
Rural population (thousands)
Indicator 1950 1975 2000 2030
Africa
Lower extreme ................ 4 4 2 1 Lower quartile ................. 445 630 812 998 Median ............................ 2 029 3 209 5 369 7 389 Upper quartile.................. 3 932 5 993 10 048 13 813 Upper extreme................. 26 769 42 042 63 687 87 624
Interquartile range ........... 3 488 5 363 9 235 12 815 Asia
Lower extreme ................ 0 0 0 0 Lower quartile ................. 445 636 628 872 Median ............................ 2 293 2 890 4 334 5 054 Upper quartile.................. 11 341 16 720 19 485 21 752 Upper extreme................. 485 232 766 362 818 793 833 238
Interquartile range ........... 10 896 16 083 18 857 20 880 Europe
Lower extreme ................ 0 0 0 0 Lower quartile ................. 338 279 188 122 Median ............................ 1 952 1 615 1 808 1 441 Upper quartile.................. 5 725 4 812 3 548 2 098 Upper extreme................. 56 793 45 064 39 428 26 802
Interquartile range ........... 5 388 4 533 3 360 1 976 Americas
Lower extreme ................ 0 0 0 0 Lower quartile ................. 26 36 30 23 Median ............................ 229 374 270 182 Upper quartile.................. 1 944 2 776 2 965 2 941 Upper extreme................. 56 569 58 008 64 553 55 710
Interquartile range ........... 1 918 2 740 2 935 2 918 Oceania
Lower extreme ................ 0 0 0 0 Lower quartile ................. 4 6 7 8 Median ............................ 27 45 50 56 Upper quartile.................. 55 94 131 155 Upper extreme................. 2 046 2 294 3 973 6 053
Interquartile range ........... 51 87 124 147
70 United Nations Population Division World Urbanization Prospects: The 2001 Revision
TABLE 43. INDICATORS OF THE DISTRIBUTION OF COUNTRIES AND AREAS ACCORDING TO THE GROWTH RATE OF THE RURAL
POPULATION, 1950-1975, 1975-2000 AND 2000-2030
Rural growth rate (percentage)
Indicator 1950-1975 1975-2000 2000-2030
All countries or areasa Lower extreme ........... -3.3 -6.3 -2.7 Lower quartile............ 0.1 -0.4 -1.0 Median....................... 1.4 0.7 -0.2 Upper quartile ............ 2.0 1.8 0.8 Upper extreme ........... 9.7 6.4 3.0
Interquartile range...... 2.0 2.2 1.7
a The upper and lower extremes are not strictly the values corre-sponding to all countries or areas in each group. The very high or very low values resulting from the transition from no rural population to a positive number or from a positive number to zero rural popula-tion were excluded. Those types of transitions happen in countries with small populations, such as China Hong Kong SAR, Falkland Islands (Malvinas), Guadeloupe and Saint-Pierre-et-Miquelon. of Europe characterized by both low rates of over-all population growth and increasing urbaniza-tion. The other three were the highly urbanized city States of Hong Kong, Special Administrative Region of China, and Singapore, in addition to Lebanon. During 2000-2030, the 25 countries expected to experience the lowest rates of ru-ral population growth (or the fastest rates of ru-ral population decline) include 13 countries or areas with small populations, six countries in Europe, and four in Asia plus Australia and South Africa.
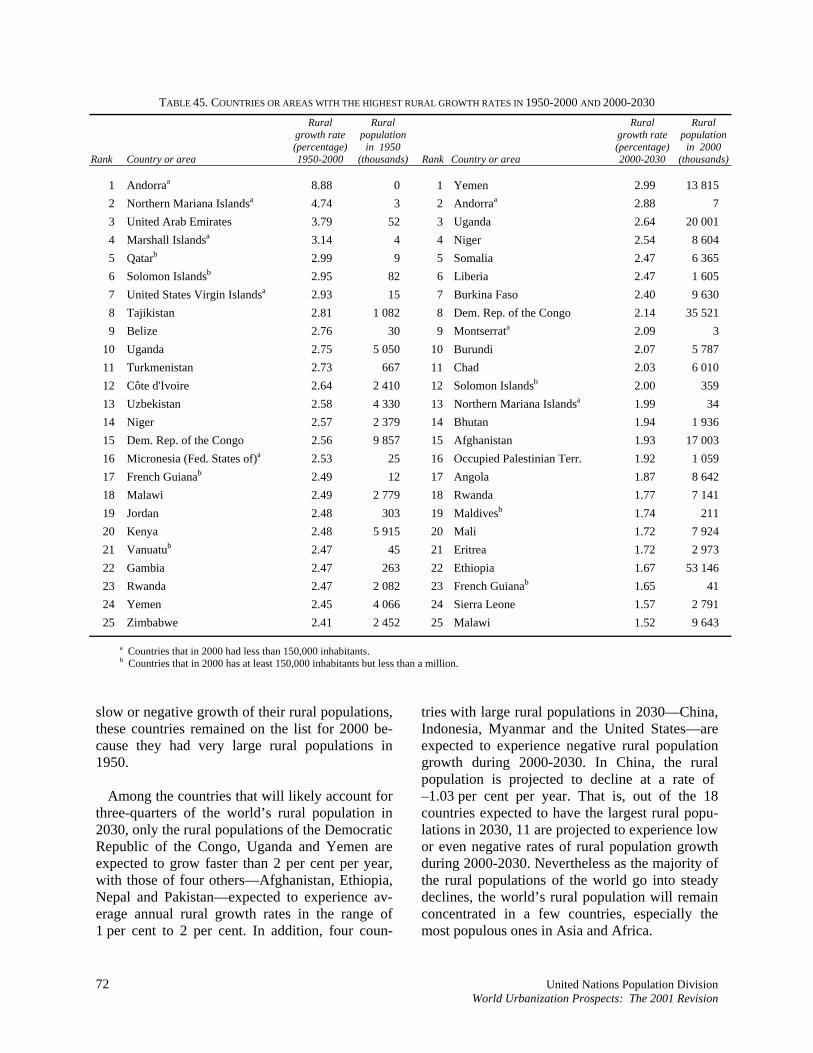
At the other end of the distribution, the 25 coun-tries experiencing the highest rates of rural popu-lation growth during 1950-2000 and 2000-2030 are listed in table 45. Once more, a number of small countries or areas with populations below one million in 2000 are prominent in both periods. In fact 11 countries or areas in 1950-2000 and 4 in 2000-2030 had fewer than 100,000 rural inhabi-tants at the beginning of each period. Smaller ru-ral populations seem more likely than larger ones to experience high rates of growth. Of more im-portance are high rates of rural population growth in countries with at least a million inhabitants. In 1950 there were 11 such countries in the list, eight in Africa and three in Asia. During 2000-2030, the 19 countries with more than a million rural dwell-ers in 2000 among the 25 expected to experience the highest rates of rural population growth in-
clude 15 in Africa (the two with the largest rural populations being the Democratic Republic of the Congo and Ethiopia) and four in Asia (Afghani-stan, Bhutan, the Occupied Palestinian Territory and Yemen).
As in the case of the urban population, the coun-
tries experiencing the highest rates of rural popu-lation growth are usually not those with the largest rural populations. The countries with the largest rural populations, which together accounted for 75 per cent of the rural population of the world in 1950, 2000 and 2030, are listed in table 46. They amounted to 20 in 1950, 17 in 2000 and will likely be 18 in 2030. In 1950 seven of the 20 countries on the list were developed countries. By 2000, only three developed countries remained on the list of those with the largest rural populations, namely, Japan, the Russian Federation and the United States. In addition, Mexico, the Republic of Korea and Turkey, three populous developing countries that experienced rapid urbanization dur-ing 1950-2000, no longer appeared among the countries with the largest rural populations in 2000. By that date, only one Latin American country, Brazil, still had a sufficiently large rural population as to be included in the list. Among the 17 countries with the largest rural populations, the majority (nine) were in Asia and four in Africa. The top five countries were China, India, Indone-sia, Bangladesh and Pakistan in order of rural population size. As of 2000, China and India to-gether accounted for nearly half of the total rural population of the world.
By 2030, 18 countries are expected to account
for three-quarters of the rural population of the world, including only one developed country, the United States. The other 17 include six countries in Africa (the Democratic Republic of the Congo, Egypt, Ethiopia, Nigeria, Uganda and the United Republic of Tanzania) and 11 in Asia. The rural population of China will likely decline by about 200 million between 2000 and 2030, while that of India is expected to increase by about 100 million, so that India’s rural population is expected to sur-pass that of China in 2030. Those two countries will be followed by Pakistan, Bangladesh and In-donesia in order of rural population size. In 2030, those five countries will account for about 55 per cent of all rural dwellers in the world.
United Nations Population Division 71 World Urbanization Prospects: The 2001 Revision
TABLE 44. COUNTRIES OR AREAS WITH THE LOWEST RURAL GROWTH RATES IN 1950-2000 AND 2000-2030
Rank Country or area
Rural growth rate (percentage) 1950-2000 Rank Country or area
Rural growth rate (percentage) 2000-2030
1 Anguillaa Negative 1 Anguillaa Negative 2 Cayman Islandsa Negative 2 Cayman Islandsa Negative 3 China, Hong Kong SAR Negative 3 China, Hong Kong SAR Negative 4 Gibraltara Negative 4 Gibraltara Negative 5 Holy Seea Negative 5 Holy Seea Negative 6 Monacoa Negative 6 Monacoa Negative 7 Naurua Negative 7 Naurua Negative 8 Singapore Negative 8 Singapore Negative 9 Bermudaa Negative 9 Bermudaa Negative
10 Guadeloupeb -8.63 10 Guadeloupeb Negative 11 Martiniqueb -4.23 11 Falkland Islands (Malvinas)a Negative 12 San Marinoa -3.11 12 Saint-Pierre-et-Miquelona Negative 13 Maltab -2.46 13 Pitcairna Negative 14 Luxembourgb -2.37 14 Martiniqueb -2.66 15 Montserrata -2.35 15 Portugal -2.31 16 Lebanon -2.27 16 Estonia -1.98 17 Falkland Islands (Malvinas)a -2.07 17 Australia -1.93 18 Belgium -1.99 18 Bulgaria -1.89 19 Niuea -1.88 19 Georgia -1.88 20 Bulgaria -1.47 20 Ukraine -1.83 21 Czech Republic -1.40 21 Republic of Korea -1.78 22 Belarus -1.31 22 Belgium -1.70 23 Pitcairna -1.30 23 Maltab -1.69 24 Saint Helenaa -1.29 24 Hungary -1.68 25 Portugal -1.29 25 South Africa -1.58
NOTE: Entries have been labelled negative when countries have reached a rural population of zero and, consequently, the normal cal-culation of the rural growth rate yields a value of minus infinity.
a Countries that in 2000 had less than 150,000 inhabitants. b Countries that in 2000 has at least 150,000 inhabitants but less than a million.
In general, the countries having large rural
populations are expected to remain mainly rural. Thus, as table 47 shows, in 2000 only five of the 17 countries accounting for three-quarters of the world rural population had less than half of their population living in rural areas (Brazil, Japan, the Philippines, the Russian Federation and the United States). By 2030, six of the 18 are ex-pected to be primarily urban countries in terms of population distribution, namely, China, Egypt, Indonesia, Nigeria, the United Republic of Tanza-nia and the United States. In addition, during 1950-2000 most of the countries that in 2000 ac-counted for three-quarters of the world’s rural population exhibited rates of rural population
growth ranging between 1 per cent per year to 2.5 per cent per year. China’s rural population grew at a rate of 1.05 per cent per year but that of India maintained a considerably higher growth rate at 1.81 per cent per year. Four countries maintained average annual rates of rural popula-tion growth higher than 2 per cent per year, namely, the Democratic Republic of the Congo, Ethiopia, Pakistan and Thailand. Only three of the countries with large rural populations in 2000 maintained on average a negative rate of rural population growth during 1950-2000: Brazil, Ja-pan and the Russian Federation. The rural popula-tion of the United States grew but at a very low average annual rate of 0.26 per cent. Despite the
72 United Nations Population Division World Urbanization Prospects: The 2001 Revision
TABLE 45. COUNTRIES OR AREAS WITH THE HIGHEST RURAL GROWTH RATES IN 1950-2000 AND 2000-2030
Rank Country or area
Rural growth rate (percentage) 1950-2000
Rural population
in 1950 (thousands) Rank Country or area
Rural growth rate (percentage) 2000-2030
Rural population
in 2000 (thousands)
1 Andorraa 8.88 0 1 Yemen 2.99 13 815 2 Northern Mariana Islandsa 4.74 3 2 Andorraa 2.88 7 3 United Arab Emirates 3.79 52 3 Uganda 2.64 20 001 4 Marshall Islandsa 3.14 4 4 Niger 2.54 8 604 5 Qatarb 2.99 9 5 Somalia 2.47 6 365 6 Solomon Islandsb 2.95 82 6 Liberia 2.47 1 605 7 United States Virgin Islandsa 2.93 15 7 Burkina Faso 2.40 9 630 8 Tajikistan 2.81 1 082 8 Dem. Rep. of the Congo 2.14 35 521 9 Belize 2.76 30 9 Montserrata 2.09 3
10 Uganda 2.75 5 050 10 Burundi 2.07 5 787 11 Turkmenistan 2.73 667 11 Chad 2.03 6 010 12 Côte d'Ivoire 2.64 2 410 12 Solomon Islandsb 2.00 359 13 Uzbekistan 2.58 4 330 13 Northern Mariana Islandsa 1.99 34 14 Niger 2.57 2 379 14 Bhutan 1.94 1 936 15 Dem. Rep. of the Congo 2.56 9 857 15 Afghanistan 1.93 17 003 16 Micronesia (Fed. States of)a 2.53 25 16 Occupied Palestinian Terr. 1.92 1 059 17 French Guianab 2.49 12 17 Angola 1.87 8 642 18 Malawi 2.49 2 779 18 Rwanda 1.77 7 141 19 Jordan 2.48 303 19 Maldivesb 1.74 211 20 Kenya 2.48 5 915 20 Mali 1.72 7 924 21 Vanuatub 2.47 45 21 Eritrea 1.72 2 973 22 Gambia 2.47 263 22 Ethiopia 1.67 53 146 23 Rwanda 2.47 2 082 23 French Guianab 1.65 41 24 Yemen 2.45 4 066 24 Sierra Leone 1.57 2 791 25 Zimbabwe 2.41 2 452 25 Malawi 1.52 9 643
a Countries that in 2000 had less than 150,000 inhabitants. b Countries that in 2000 has at least 150,000 inhabitants but less than a million.
slow or negative growth of their rural populations, these countries remained on the list for 2000 be-cause they had very large rural populations in 1950.
Among the countries that will likely account for
three-quarters of the world’s rural population in 2030, only the rural populations of the Democratic Republic of the Congo, Uganda and Yemen are expected to grow faster than 2 per cent per year, with those of four others—Afghanistan, Ethiopia, Nepal and Pakistan—expected to experience av-erage annual rural growth rates in the range of 1 per cent to 2 per cent. In addition, four coun-
tries with large rural populations in 2030—China, Indonesia, Myanmar and the United States—are expected to experience negative rural population growth during 2000-2030. In China, the rural population is projected to decline at a rate of –1.03 per cent per year. That is, out of the 18 countries expected to have the largest rural popu-lations in 2030, 11 are projected to experience low or even negative rates of rural population growth during 2000-2030. Nevertheless as the majority of the rural populations of the world go into steady declines, the world’s rural population will remain concentrated in a few countries, especially the most populous ones in Asia and Africa.

TABLE 46. COUNTRIES ACCOUNTING FOR 75 PER CENT OF THE WORLD RURAL POPULATION ORDERED BY POPULATION SIZE, 1950, 2000 AND 2030
Rank Country
Population in 1950
(thousands) Cumulative percentage Rank Country
Population in 2000
(thousands) Cumulative percentage Rank Country
Population in 2030
(thousands) Cumulative percentage
1 China 485 232 27.4 1 China 818 793 25.6 1 India 833 238 25.3 2 India 295 866 44.2 2 India 729 893 48.5 2 China 601 199 43.6 3 Indonesia 69 675 48.1 3 Indonesia 125 149 52.4 3 Pakistan 139 438 47.8 4 Russian Federation 56 793 51.3 4 Bangladesh 103 085 55.6 4 Bangladesh 124 059 51.6 5 United States of America 56 569 54.5 5 Pakistan 94 499 58.6 5 Indonesia 102 782 54.7 6 Japan 41 560 56.9 6 United States of America 64 553 60.6 6 Ethiopia 87 624 57.4 7 Bangladesh 40 009 59.1 7 Nigeria 63 687 62.6 7 Nigeria 80 314 59.8 8 Brazil 34 268 61.1 8 Viet Nam 59 321 64.4 8 Dem. Rep. of the Congo 67 566 61.9 9 Pakistan 32 710 62.9 9 Ethiopia 53 146 66.1 9 Viet Nam 64 595 63.9
10 Nigeria 26 769 64.4 10 Thailand 50 352 67.7 10 United States of America 55 710 65.6 11 Viet Nam 24 181 65.8 11 Russian Federation 39 428 68.9 11 Thailand 53 232 67.2 12 Ukraine 22 688 67.1 12 Egypt 38 914 70.1 12 Egypt 45 390 68.6 13 Italy 21 520 68.3 13 Dem. Rep. of the Congo 35 521 71.2 13 Uganda 44 190 69.9 14 Germany 19 206 69.4 14 Myanmar 34 529 72.3 14 Yemen 33 925 70.9 15 France 18 335 70.4 15 Brazil 32 119 73.3 15 Myanmar 33 399 71.9 16 Ethiopia 17 586 71.4 16 Philippines 31 358 74.3 16 Nepal 30 824 72.9 17 Thailand 17 570 72.4 17 Japan 27 007 75.2 17 Afghanistan 30 369 73.8 18 Turkey 16 367 73.3 18 United Republic of Tanzania 29 228 74.7 19 Republic of Korea 16 010 74.2 20 Mexico 15 906 75.1
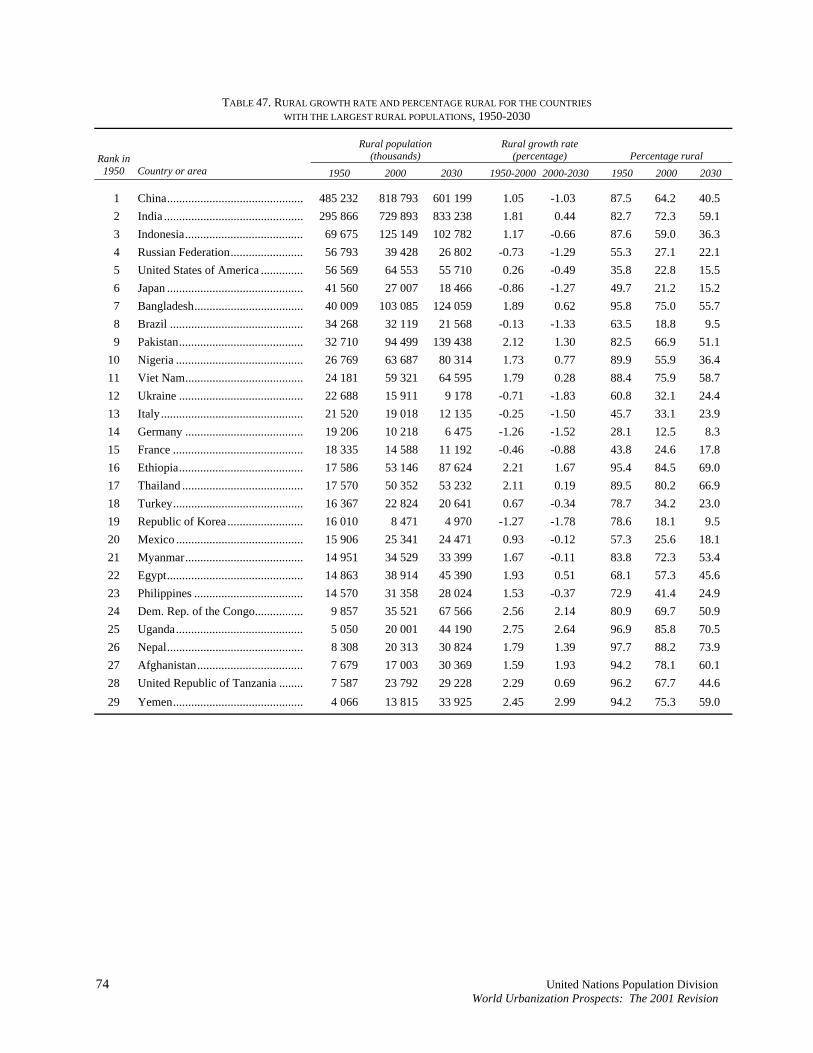
74 United Nations Population Division World Urbanization Prospects: The 2001 Revision
TABLE 47. RURAL GROWTH RATE AND PERCENTAGE RURAL FOR THE COUNTRIES WITH THE LARGEST RURAL POPULATIONS, 1950-2030
Rural population (thousands)
Rural growth rate (percentage) Percentage rural Rank in
1950 Country or area 1950 2000 2030 1950-2000 2000-2030 1950 2000 2030
1 China............................................. 485 232 818 793 601 199 1.05 -1.03 87.5 64.2 40.5 2 India .............................................. 295 866 729 893 833 238 1.81 0.44 82.7 72.3 59.1 3 Indonesia....................................... 69 675 125 149 102 782 1.17 -0.66 87.6 59.0 36.3 4 Russian Federation........................ 56 793 39 428 26 802 -0.73 -1.29 55.3 27.1 22.1 5 United States of America .............. 56 569 64 553 55 710 0.26 -0.49 35.8 22.8 15.5 6 Japan ............................................. 41 560 27 007 18 466 -0.86 -1.27 49.7 21.2 15.2 7 Bangladesh.................................... 40 009 103 085 124 059 1.89 0.62 95.8 75.0 55.7 8 Brazil ............................................ 34 268 32 119 21 568 -0.13 -1.33 63.5 18.8 9.5 9 Pakistan......................................... 32 710 94 499 139 438 2.12 1.30 82.5 66.9 51.1
10 Nigeria .......................................... 26 769 63 687 80 314 1.73 0.77 89.9 55.9 36.4 11 Viet Nam....................................... 24 181 59 321 64 595 1.79 0.28 88.4 75.9 58.7 12 Ukraine ......................................... 22 688 15 911 9 178 -0.71 -1.83 60.8 32.1 24.4 13 Italy............................................... 21 520 19 018 12 135 -0.25 -1.50 45.7 33.1 23.9 14 Germany ....................................... 19 206 10 218 6 475 -1.26 -1.52 28.1 12.5 8.3 15 France ........................................... 18 335 14 588 11 192 -0.46 -0.88 43.8 24.6 17.8 16 Ethiopia......................................... 17 586 53 146 87 624 2.21 1.67 95.4 84.5 69.0 17 Thailand ........................................ 17 570 50 352 53 232 2.11 0.19 89.5 80.2 66.9 18 Turkey........................................... 16 367 22 824 20 641 0.67 -0.34 78.7 34.2 23.0 19 Republic of Korea ......................... 16 010 8 471 4 970 -1.27 -1.78 78.6 18.1 9.5 20 Mexico .......................................... 15 906 25 341 24 471 0.93 -0.12 57.3 25.6 18.1 21 Myanmar....................................... 14 951 34 529 33 399 1.67 -0.11 83.8 72.3 53.4 22 Egypt............................................. 14 863 38 914 45 390 1.93 0.51 68.1 57.3 45.6 23 Philippines .................................... 14 570 31 358 28 024 1.53 -0.37 72.9 41.4 24.9 24 Dem. Rep. of the Congo................ 9 857 35 521 67 566 2.56 2.14 80.9 69.7 50.9 25 Uganda.......................................... 5 050 20 001 44 190 2.75 2.64 96.9 85.8 70.5 26 Nepal............................................. 8 308 20 313 30 824 1.79 1.39 97.7 88.2 73.9 27 Afghanistan................................... 7 679 17 003 30 369 1.59 1.93 94.2 78.1 60.1 28 United Republic of Tanzania ........ 7 587 23 792 29 228 2.29 0.69 96.2 67.7 44.6 29 Yemen........................................... 4 066 13 815 33 925 2.45 2.99 94.2 75.3 59.0