Embed Size (px)
Citation preview

IV. MONETARY DEVELOPMENTS
The monetary policy of the National Bank of Ethiopia (NBE) continued to focus on ensuring price and exchange rate stability as well as maintaining conducive macroeconomic environment for economic growth. The Bank employs both direct and indirect monetary policy instruments to achieve its stated objectives.
4.1. Money Supply and Credit
Broad money supply (M2) reached Birr 46.4 billion at the end of the fourth quarter of 2005/06, indicating quarterly and annual growth rates of 4.7 and 15.3 percent, respectively. Both the quarterly and annual growths in broad money supply came as a result of expansion in domestic credit which offset the decline in net foreign assets (NFA) of the banking system. Domestic credit increased by 0.8 and 22.3 percent on quarterly and annual bases while net foreign assets of the banking system declined by 3.8 and 12.7 percent. Of the components of domestic credit, net claims on the government went down by 0.9 percent on quarterly basis but rose by 16.6 percent annually. Claims on other sectors increased by 2.5 and 28.9 percent on quarterly and annual bases.
Table IV. 1: Factors Influencing Broad Money (In Millions of Birr)
Particulars 2004/05 2005/06 Percentage ChangeQtr. IV Qtr. III Qtr. IV
(June 05) (Mar. 06) (June 06) C/A C/BA B C
1. External Assets (net) 13,868.0 12,582.3 12,109.6 -12.7 -3.82. Domestic Credit 40,305.8 48,928.4 49,295.9 22.3 0.8 . Claims on Central Gov't (net) 21,663.8 25,493.6 25,266.4 16.6 -0.9 . Claims on Non-Central Gov't 18,642.0 23,434.8 24,029.6 28.9 2.5 . Financial Institutions 0.0 0.0 0.0 ----- -- -- . Others 18,642.0 23,434.8 24,029.6 28.9 2.53. Other Items (net) 13,961.8 17,198.8 15,028.1 7.6 -12.64. Broad Money (M2) 40,212.1 44,311.8 46,377.4 15.3 4.7
Source: National Bank of Ethiopia

Narrow Money (M1), which is the sum of currency outside banks and net demand deposits, also showed a quarterly growth rate of 3.9 percent to reach Birr 23.8 billion. This quarterly growth came about due to 3.0 percent increment in currency outside banks and 4.7 percent increase in net demand deposits. Similarly, quasi-money (the sum of time and savings deposits) showed a quarterly growth rate of 5.5 percent during the same period. Year-on-year basis, both narrow money and quasi money went up by 11.8 and 19.3 percent, respectively.

Table IV.2: Components of Broad Money (In Millions of Birr)
Particulars 2004/05 2005/06 Percentage ChangeQtr. IV Qtr. III Qtr. IV
(June 05) (Mar. 06) (June 06) C/A C/BA B C
1. Narrow Money Supply 21,289.8 22,919.6 23,811.9 11.8 3.9 . Currency outside banks 10,021.4 11,086.8 11,422.9 14.0 3.0 . Demand Deposits (net) 11,268.4 11,832.7 12,389.0 9.9 4.72. Quasi-Money 18,922.3 21,392.3 22,565.5 19.3 5.5 . Savings Deposits 17,310.5 19,688.8 20,485.5 18.3 4.0 . Time Deposits 1,611.8 1,703.5 2,080.0 29.1 22.1

3. Broad Money Supply 40,212.1 44,311.8 46,377.4 15.3 4.7
Source: National Bank of Ethiopia

4.2 Developments in Reserve Money and Monetary Ratios
At the end of June 2006, reserve money reached Birr 21.2 billion, indicating a quarterly decline of 6.9 percent solely as a result of 18.7 percent drop in deposits of commercial banks at the National Bank of Ethiopia (NBE) which offset an increase of 3.4 percent in currency in circulation. Similarly, a 34.0 percent annual decline in commercial banks' deposit at NBE and 14.6 percent rise in currency in circulation resulted in an 11.8 percent annual drop in reserve money. The fall in banks' reserves was attributed to the impact of the sale of additional treasury bills to banks during the quarter. Consequently, excess reserves of commercial banks dropped significantly by 21.6 and 42.6 percent on quarterly and annual bases, respectively.
Currency in circulation accounted for 59.3 percent of the base money during the review quarter compared with 45.6 percent a year earlier.
Table IV. 3: Monetary Aggregates and Ratios
(In millions of Birr unless otherwise indicated)
Particulars
2004/05 2005/06
Qtr. IV Qtr. III Qtr. IV Percentage Change
(June 05) (Mar. 06) (June 06)
A B C C/A C/B
1. Reserve Requirement (CB's) 1,828.4 2,038.2 2,120.9 16.0 4.1
2. Actual Reserve (CB's) 12,855.6 10,113.1 8,452.1 -34.3 -16.4
3. Excess Reserve (CB's) 11,027.2 8,075.0 6,331.2 -42.6 -21.6
4. Reserve Money 24,029.3 22,753.9 21,181.9 -11.8 -6.9

. Currency in Circulation 10,961.7 12,149.4 12,560.2 14.6 3.4
. Banks deposits at NBE 13,067.5 10,604.5 8,621.7 -34.0 -18.7
5. Money Multiplier (Ratio):
. Narrow Money to Reserve Money 0.9 1.0 1.1 26.9 11.6
. Broad Money to Reserve Money 1.7 1.9 2.2 30.8 12.4
6. Other Monetary Ratios (%):
. Currency to Narrow Money 51.5 53.0 52.7 2.4 -0.5
. Currency to Broad Money 27.3 27.4 27.1 -0.7 -1.2
. Narrow Money to Broad Money 52.9 51.7 51.3 -3.0 -0.7
. Quasi Money to Broad Money 47.1 48.3 48.7 3.4 0.8
Source: National Bank of Ethiopia
Looking at monetary ratios, narrow money to broad money ratio declined to 51.3 percent, in contrast to 51.7 percent at the close of the preceding quarter and 52.9 percent at the corresponding quarter of the preceding fiscal year. On the other hand, quasi money to broad money ratio slightly increased to 48.7 percent from 48.3 percent at the close of the preceding quarter and 47.1 percent at the end of the same quarter of last year. Broad money multiplier also increased to 2.2 from 1.7 at the corresponding quarter of 2004/05. Similarly, narrow money multiplier rose from 0.9 to 1.1 in the same period.

4.3 Interest Rate Developments
There was no change in both the minimum and maximum interest rates paid by commercial banks on saving deposits which remained at 3.0 and 3.15 percent per annum during the fourth quarter of 2005/06. The weighted demand deposit rate also remained at its preceding quarter level of 0.06 percent. Average interest rate on time deposits, however, went up marginally from 3.79 percent during the preceding quarter to 3.97 percent during the review quarter. Average lending rate of commercial banks remained at 10.5 percent since March 2003. Considering the 8.0 percent annual core (non-food) inflation registered during June 2006, deposit interest rates, weighted average yields on T-bills and government bond yields all were negative in real terms. Average real cost of borrowing (real lending rate), however, was positive (2.5 percent).

Table IV 4: Interest Rate Structure of Banks and Micro-finance Institutions
(In percent per annum)
2004 2005 2006Items Mar. June Mar. June Mar. June 1.Saving Deposit Rates ● Minimum 3.00 3.00 3.00 3.00 3.00 3.00● Maximum 3.15 3.15 3.15 3.15 3.15 3.15Average Saving Rate 3.08 3.08 3.08 3.08 3.08 3.082.Time Deposit (Weighted)
● Up to 1 year 3.39 3.40 3.45 3.47 3.52 3.60● 1 - 2 years 3.63 3.64 3.69 3.71 3.79 4.01● Over 2 years 3.83 3.84 3.92 3.94 4.06 4.30Average Time Dep. Rate 3.62 3.62 3.69 3.71 3.79 3.973. Weighted Demand Deposit Rate 0.04 0.05 0.05 0.05 0.06 0.064. Lending Rate
● Minimum 7.00 7.00 7.00 7.00 7.00 7.00● Maximum 14.00 14.00 14.00 14.00 14.00 14.00Average Lending Rate 10.50 10.50 10.50 10.50 10.50 10.505. Weighted Ave. T-bills Rate 0.69 0.53 0.07 0.05 0.04 0.04
6. Average Bond Yield* 3.78 3.78 4.00 4.004.00 4.00
Source: National Bank of Ethiopia, commercial banks and micro-finance institutions NB: *Shows average bond yield on outstanding government bonds

4.4 Activities of the Banking System
4.4.1. Resource Mobilization
During the fourth quarter of 2005/06, total resources mobilized by the banking system through deposits, collection of loans and borrowing reached Birr 4,525.9 million, indicating a quarterly rise of Birr 228.2 million (5.3 percent). An increase of Birr 455.4 million (17.1 percent) in loan collection was the major factor for this quarterly rise in resource mobilization that offsetted declines of Birr 413.3 million (25.1 percent) and Birr 9.2 million (9.7 percent) in net change in deposits and net borrowings, respectively.


A) Deposit Mobilization
At the end of June 2006, deposit liabilities of the banking system reached Birr 44.5 billion, 19.0 percent higher than the end June 2005 position. (See Table IV 6).
Component wise, demand deposits, which accounted for 47.8 percent of the total deposits, reached Birr 21.3 billion, showing quarterly and annual growth rates of 0.5 and 19.6 percent, respectively. Savings deposit, with 46.1 percent share from total deposit liabilities, increased by 4.0 and 18.3 percent, respectively and reached Birr 20.5 billion. On the other hand, time deposits, which constituted 6.1 percent of the total deposit liabilities of the banking system, rose by 2.8 and 18.5 percent compared to the balance at the close of the preceding quarter and the same quarter of last year.
The share of government owned banks from total deposit liabilities of banks, declined from 73.9 percent at the end of June 2005 to 70.6 percent this year while that of private commercial banks increased from 26.2 percent to 29.4 percent in the same period.
B) Collection of Loans
Loan collection by the banking system during the fourth quarter of 2005/06 reached Birr 3,124.8 million, reflecting a quarterly surge of 17.1 percent. This was attributed to 11.0 percent increases in loan collection of public banks and 23.7 percent of private banks. Government owned banks collected Birr 1,550.4 million (or 49.6 percent) while private banks collected Birr 1,574.4 million (50.4 percent).

C) Borrowing
Outstanding borrowing of the banking system was Birr 2,047.2 million at the end of June 2006, indicating quarterly and annual growth rates of 5.8 and 15.9 percent. Domestic borrowing showed a quarterly increase of 5.8 percent and an annual surge of 15.2 percent. Foreign borrowing increased by 6.1 percent and 19.4 percent during the same period. About 83.4 percent of the outstanding borrowing was mobilized from domestic sources. Development Bank of Ethiopia (DBE) constituted 95.0 percent of the outstanding borrowing and the balance was borrowings by Construction & Business Bank (CBB).
Table IV 5. Outstanding Borrowing by Sources at the Close of June 2006
(In Million of Birr)
Banks 2004/05 2005/06Quarter IV Quarter III Quarter IV
Internal External Total Internal External Total Internal External TotalDBE 1,348.2 284.3 1,632.5 1,505.5 319.9 1,825.4 1,604.9 339.3 1,944.2 CBB 134.1 - 134.1 108.8 - 108.8 103.0 - 103.0 Grand Total 1,482.3 284.3 1,766.6 1,614.3 319.9 1,934.2 1,707.9 339.3 2,047.2
Source: DBE and CBB
Table IV 6: Stock of Deposits Mobilized by the Banking System as at end of June, 2006 (In Million of Birr)

Types of Deposits 2004/05 2005/06 % ChangeQuarter IV % Share Quarter III % Share Quarter IV % Share
A B C C/A C/BDemand Deposit 17,778.10 47.6 21,149.60 48.9 21,264.00 47.8 19.6 0.5Savings Deposit 17,324.40 46.3 19,691.50 45.6 20,488.20 46.1 18.3 4.0Time Deposit 2,284.63 6.1 2,387.40 5.5 2,706.80 6.1 18.5 13.4Total 37,387.13 100.0 43,228.50 100.0 44,459.00 100.0 18.9 2.8
Source: Commercial Banks
4.4.2 Disbursement of Fresh Loans
New loans disbursed by the banking system during the fourth quarter of 2005/06 reached Birr 3,208.6 million, 4.4 percent lower than the amount disbursed in the preceding quarter. Of the total new loan disbursement, 98.5 percent was channeled to the private sector. International trade was the largest recipient sector with a share of 35.4 percent followed by domestic trade (19.2 percent). Loan disbursement to agriculture, housing & construction and transport & communication sectors accounted for 10.9, 10.6 and 10.5 percent, respectively.
Table IV 7: Summary of Resource Mobilization & Disbursement of the Banking System During the Fourth Quarter of 2005/06 ended on June 30 2006
(In Million Birr)
Particulars Public Banks Private Banks Grand Total(1) (2) (3) = (1) + (2)
Qtr. III Qtr. IV % Change Qtr. III Qtr. IV % Change Qtr. III Qtr. IV % Change1.Deposits (net change) 919.3 349.6 -62.0 724.6 880.9 21.6 1,643.9 1,230.5 -25.1
-Demand 877.3 65.3 -92.6 263.1 49.2 -81.3 1,140.4 114.5 -90.0
-Saving 112.0 366.2 226.9 452.8 430.5 -4.9 564.8 796.7 41.1
-Time -70.1 -81.8 16.8 8.7 401.2 4,511.5 -61.4 319.4 -620.5

2. Borrowing (net change) 94.5 85.3 -9.7 0.0 0.0 0.0 94.5 85.3 -9.7
-Local 94.5 85.3 -9.7 0.0 0.0 0.0 94.5 85.3 -9.7
-Foreign 0.0 0.0 0.0 0.0 0.0 0.0 0.0 0.0 0.0
3. Collecton of Loans 1,396.8 1,550.4 11.0 1,272.6 1,574.4 23.7 2,669.4 3,124.8 17.1
4. Total Resources Mobilized
(1+2+3) 2,300.6 2,106.0 -8.5 1,997.1 2,419.8 21.2 4,297.7 4,525.9 5.3
5. Disbursement 1,195.8 1,381.4 15.5 2,159.6 1,827.2 -15.4 3,355.4 3,208.6 -4.4
6. Change in Liquidity (4-5) 1,460.4 1,498.9 2.6 -162.5 704.9 -533.9 1,297.9 2,203.9 69.8
Memorandum Item:
A. Outstanding Credit* 26,393.4 28,396.3 7.6 10,671.5 11,235.0 5.3 37,064.8 39,631.2 6.9
B. Outstanding Interbank Lending
277.6 274.9 -1.0 0.0 0.0 0.0 277.6 274.9 -1.0
Source: Commercial Banks and staff Computation
* Outstanding Credit Excludes Corporate and Coupon Bonds

4.4.3 Outstanding Credit
At the end of June 2006, the stock of outstanding credit of the banking system (including Treasury bills and government bonds) reached Birr 39.6 billion, 36.2 percent higher than the total credit recorded in the same quarter of 2004/05. Of the total outstanding loans, claims on the private sector (including cooperatives) accounted for 59.2 percent while claims on central government and public enterprises stood at 32.5 and 7.6 percent, respectively. In terms of economic sectors, credit to industry constituted 15.9 percent followed by international trade with 13.2 percent. Other major recipient sectors were agriculture, domestic trade and housing & construction with loans to the tune of 8.6, 8.4 and 8.1 percent.
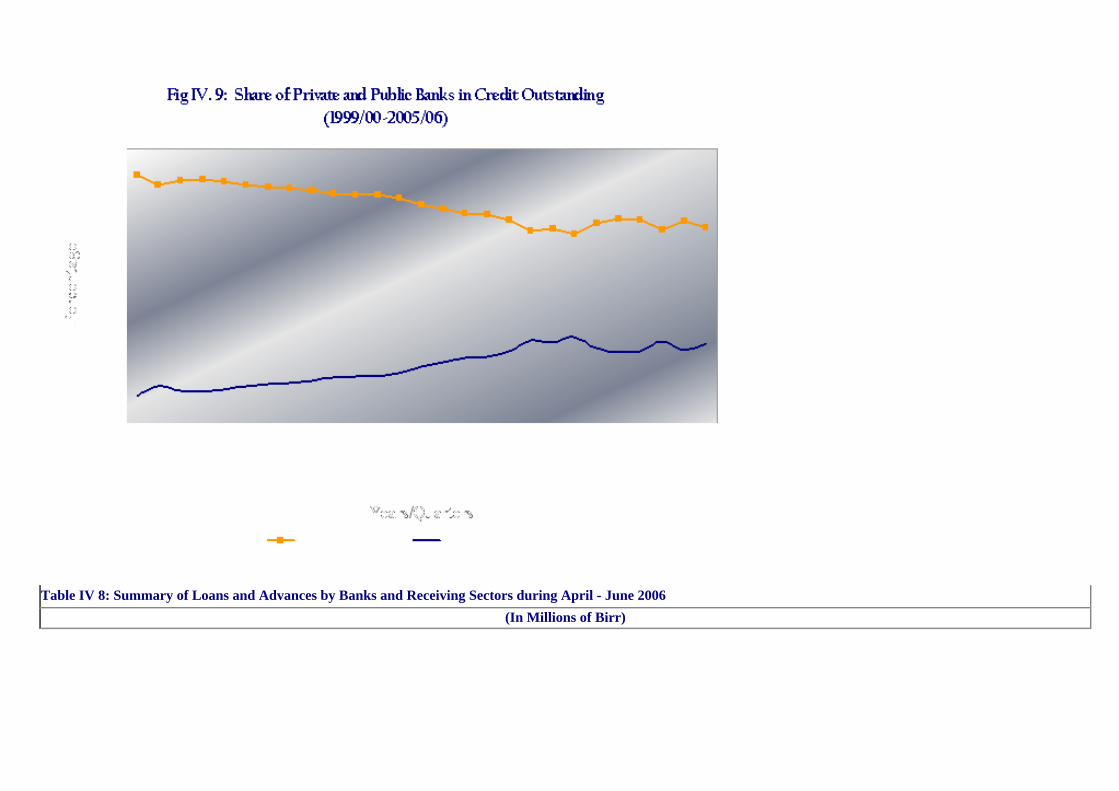
Table IV 8: Summary of Loans and Advances by Banks and Receiving Sectors during April - June 2006(In Millions of Birr)
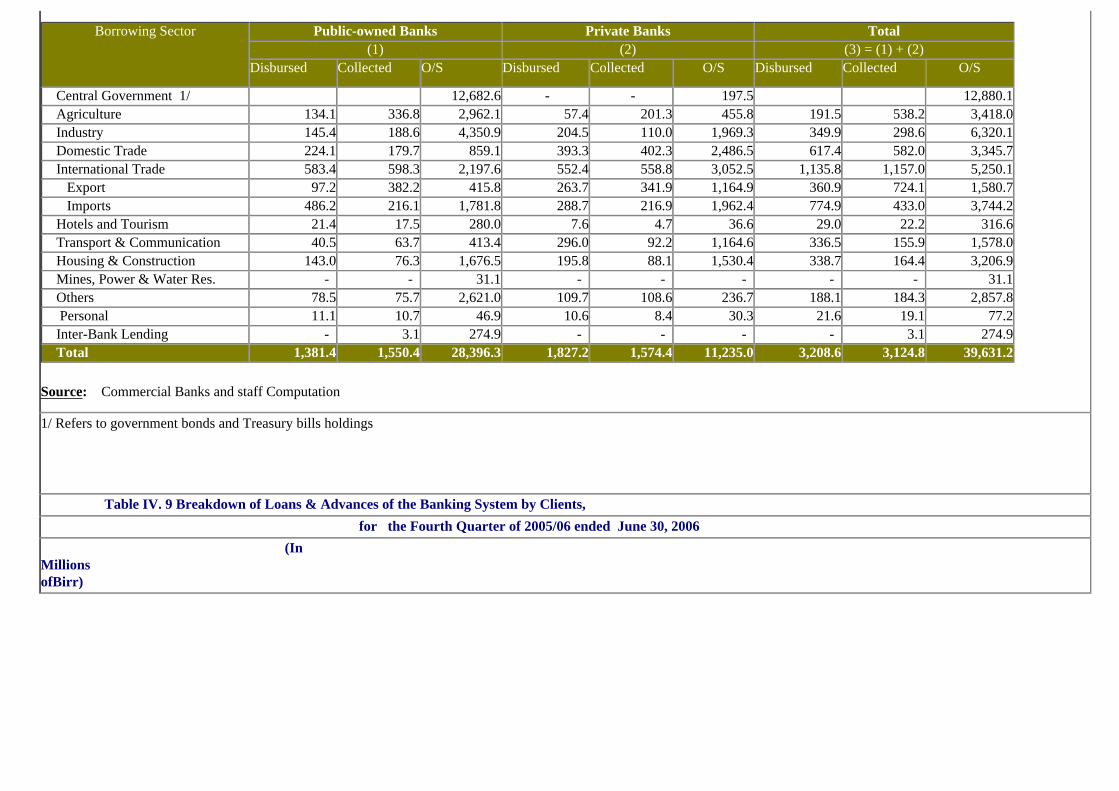
Borrowing Sector Public-owned Banks Private Banks Total (1) (2) (3) = (1) + (2)
Disbursed Collected O/S Disbursed Collected O/S Disbursed Collected O/S
Central Government 1/ 12,682.6 - - 197.5 12,880.1 Agriculture 134.1 336.8 2,962.1 57.4 201.3 455.8 191.5 538.2 3,418.0 Industry 145.4 188.6 4,350.9 204.5 110.0 1,969.3 349.9 298.6 6,320.1 Domestic Trade 224.1 179.7 859.1 393.3 402.3 2,486.5 617.4 582.0 3,345.7 International Trade 583.4 598.3 2,197.6 552.4 558.8 3,052.5 1,135.8 1,157.0 5,250.1 Export 97.2 382.2 415.8 263.7 341.9 1,164.9 360.9 724.1 1,580.7 Imports 486.2 216.1 1,781.8 288.7 216.9 1,962.4 774.9 433.0 3,744.2 Hotels and Tourism 21.4 17.5 280.0 7.6 4.7 36.6 29.0 22.2 316.6 Transport & Communication 40.5 63.7 413.4 296.0 92.2 1,164.6 336.5 155.9 1,578.0 Housing & Construction 143.0 76.3 1,676.5 195.8 88.1 1,530.4 338.7 164.4 3,206.9 Mines, Power & Water Res. - - 31.1 - - - - - 31.1 Others 78.5 75.7 2,621.0 109.7 108.6 236.7 188.1 184.3 2,857.8 Personal 11.1 10.7 46.9 10.6 8.4 30.3 21.6 19.1 77.2 Inter-Bank Lending - 3.1 274.9 - - - - 3.1 274.9 Total 1,381.4 1,550.4 28,396.3 1,827.2 1,574.4 11,235.0 3,208.6 3,124.8 39,631.2
Source: Commercial Banks and staff Computation
1/ Refers to government bonds and Treasury bills holdings
Table IV. 9 Breakdown of Loans & Advances of the Banking System by Clients, for the Fourth Quarter of 2005/06 ended June 30, 2006 (In Millions ofBirr)
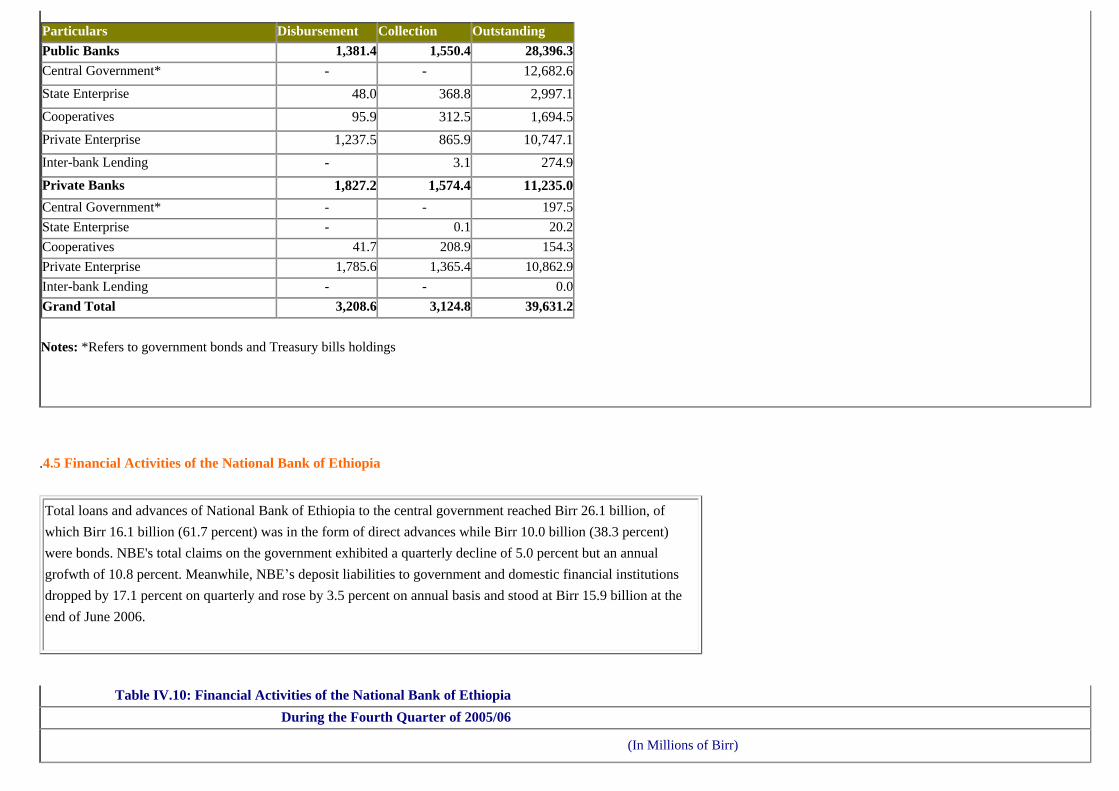
Particulars Disbursement Collection OutstandingPublic Banks 1,381.4 1,550.4 28,396.3Central Government* - - 12,682.6State Enterprise 48.0 368.8 2,997.1Cooperatives 95.9 312.5 1,694.5Private Enterprise 1,237.5 865.9 10,747.1Inter-bank Lending - 3.1 274.9Private Banks 1,827.2 1,574.4 11,235.0Central Government* - - 197.5State Enterprise - 0.1 20.2Cooperatives 41.7 208.9 154.3Private Enterprise 1,785.6 1,365.4 10,862.9Inter-bank Lending - - 0.0Grand Total 3,208.6 3,124.8 39,631.2
Notes: *Refers to government bonds and Treasury bills holdings
.4.5 Financial Activities of the National Bank of Ethiopia
Total loans and advances of National Bank of Ethiopia to the central government reached Birr 26.1 billion, of which Birr 16.1 billion (61.7 percent) was in the form of direct advances while Birr 10.0 billion (38.3 percent) were bonds. NBE's total claims on the government exhibited a quarterly decline of 5.0 percent but an annual grofwth of 10.8 percent. Meanwhile, NBE’s deposit liabilities to government and domestic financial institutions dropped by 17.1 percent on quarterly and rose by 3.5 percent on annual basis and stood at Birr 15.9 billion at the end of June 2006.
Table IV.10: Financial Activities of the National Bank of Ethiopia During the Fourth Quarter of 2005/06
(In Millions of Birr)
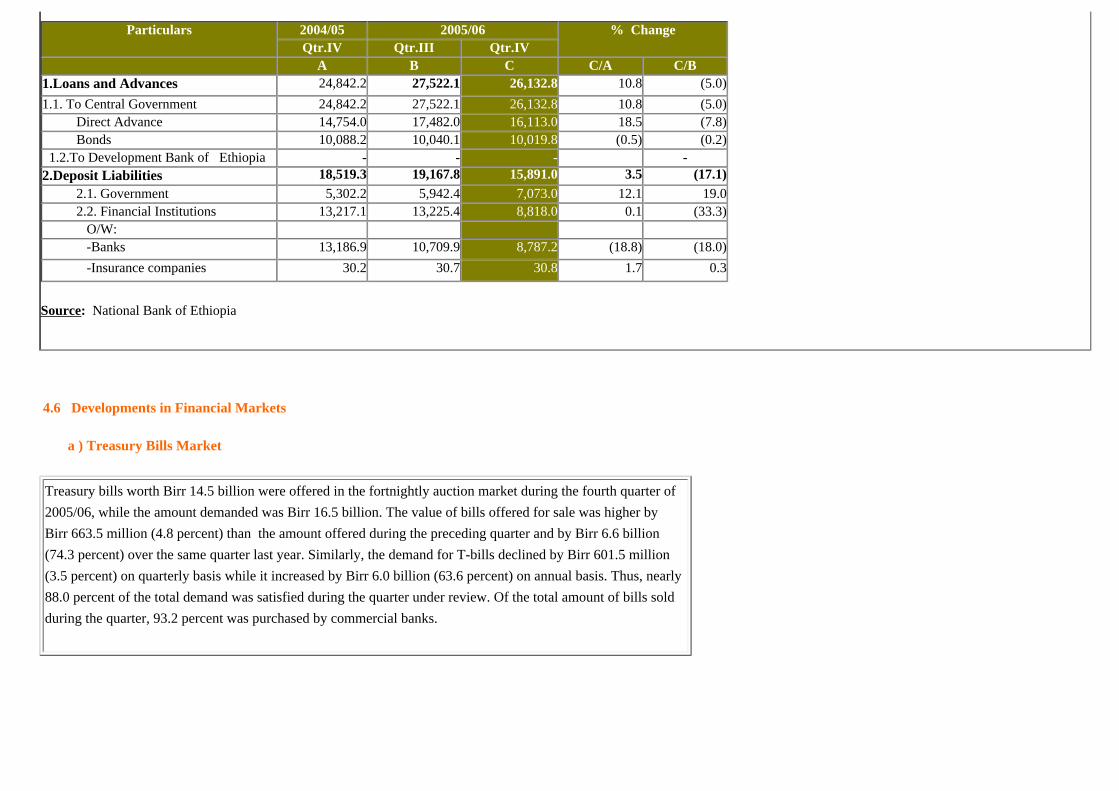
Particulars 2004/05 2005/06 % ChangeQtr.IV Qtr.III Qtr.IV
A B C C/A C/B1.Loans and Advances 24,842.2 27,522.1 26,132.8 10.8 (5.0)1.1. To Central Government 24,842.2 27,522.1 26,132.8 10.8 (5.0) Direct Advance 14,754.0 17,482.0 16,113.0 18.5 (7.8) Bonds 10,088.2 10,040.1 10,019.8 (0.5) (0.2) 1.2.To Development Bank of Ethiopia - - - - 2.Deposit Liabilities 18,519.3 19,167.8 15,891.0 3.5 (17.1) 2.1. Government 5,302.2 5,942.4 7,073.0 12.1 19.0 2.2. Financial Institutions 13,217.1 13,225.4 8,818.0 0.1 (33.3) O/W: -Banks 13,186.9 10,709.9 8,787.2 (18.8) (18.0) -Insurance companies 30.2 30.7 30.8 1.7 0.3
Source: National Bank of Ethiopia
4.6 Developments in Financial Markets
a ) Treasury Bills Market
Treasury bills worth Birr 14.5 billion were offered in the fortnightly auction market during the fourth quarter of 2005/06, while the amount demanded was Birr 16.5 billion. The value of bills offered for sale was higher by Birr 663.5 million (4.8 percent) than the amount offered during the preceding quarter and by Birr 6.6 billion (74.3 percent) over the same quarter last year. Similarly, the demand for T-bills declined by Birr 601.5 million (3.5 percent) on quarterly basis while it increased by Birr 6.0 billion (63.6 percent) on annual basis. Thus, nearly 88.0 percent of the total demand was satisfied during the quarter under review. Of the total amount of bills sold during the quarter, 93.2 percent was purchased by commercial banks.
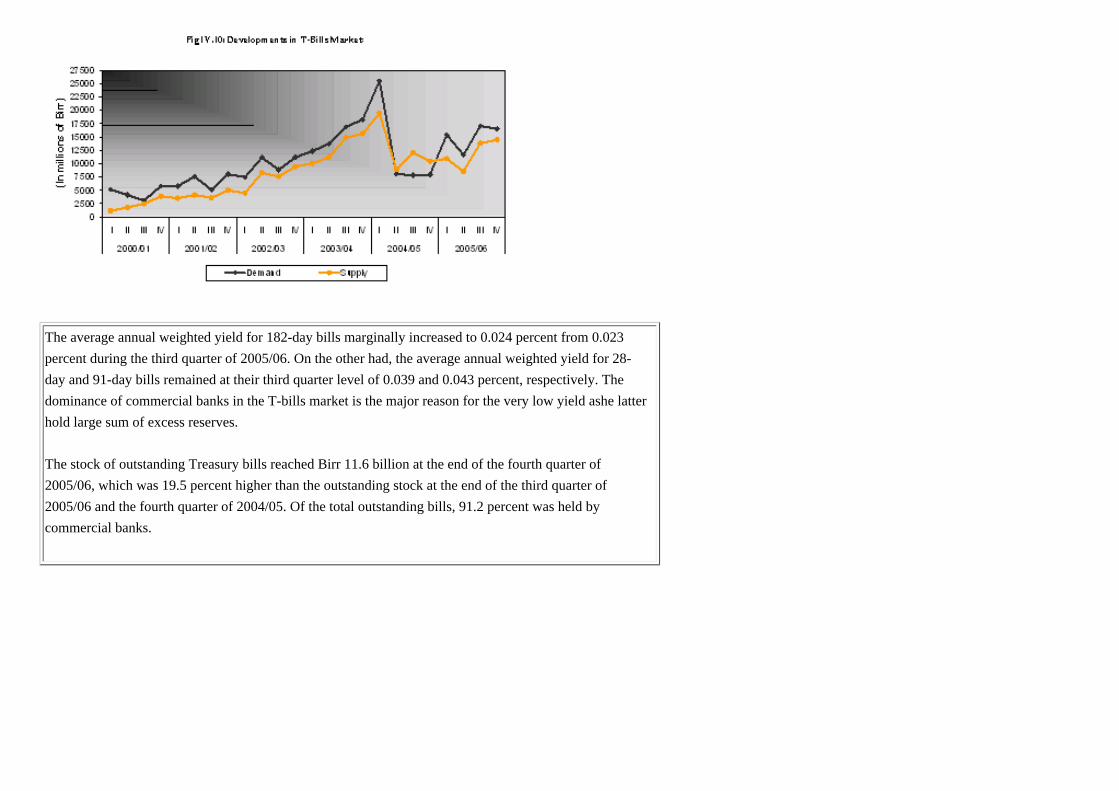
The average annual weighted yield for 182-day bills marginally increased to 0.024 percent from 0.023 percent during the third quarter of 2005/06. On the other had, the average annual weighted yield for 28-day and 91-day bills remained at their third quarter level of 0.039 and 0.043 percent, respectively. The dominance of commercial banks in the T-bills market is the major reason for the very low yield ashe latter hold large sum of excess reserves.
The stock of outstanding Treasury bills reached Birr 11.6 billion at the end of the fourth quarter of 2005/06, which was 19.5 percent higher than the outstanding stock at the end of the third quarter of 2005/06 and the fourth quarter of 2004/05. Of the total outstanding bills, 91.2 percent was held by commercial banks.

Table IV 11: Results of Treasury Bills Auction
2004/05 2005/06 Percentage Qtr.IV Qtr.III Qtr.IV A B C C/B C/aNumber of Bidders 48 4835 -27.1 -27.1Number of Bids Accepted 56 49 35 -28.6 -37.5Amount Demanded(Mn.Birr) 10,437.2 17,074.016,472.5 -3.5 57.8 28-day bill 6,643.0 9,272.08,290.5 -10.6 24.8 91-day bill 2,285.0 5,600.0 7,141.0 27.5 212.5 182-day bill 1,509.2 2,202.0 1,041.0 -52.7 -31.0Amount Supplied(Mn.Birr) 7,932.0 13,822.0 14,485.5 4.8 82.6 28-day bill 4,686.0 7,601.0 7,429.5 -2.3 58.5 91-day bill 2,205.0 4,115.0 6,015.0 46.2 172.8 182-day bill 1,041.0 2,106.0 1,041.0 -50.6 0.0Amount Sold(Mn.Birr) 7,932.0 13,822.0 14,485.5 4.8 82.6 Banks 7,282.0 12,879.0 13,495.6 4.8 85.3 Non-Banks 650.0 943.0 989.9 5.0 52.3

Average Weighted Price for Successful bids(Birr) 28-day bill 99.995 99.997 99.997 0.0 0.0 91-day bill 99.988 99.989 99.989 0.0 0.0 182-day bill 99.983 99.989 99.988 0.0 0.0Average Weighted Yeild for Successful bids(%) 28-day bill 0.065 0.039 0.039 0.0 -39.7 91-day bill 0.048 0.043 0.043 1.0 -9.7 182-day bill 0.034 0.023 0.024 6.9 -28.2Outstanding bills at the end of Period (Mn.Br.) 6,395.0 9,738.5 11,638.5 19.5 82.0 Banks 4,995.0 8,464.5 10,612.3 25.4 112.5 Non-Banks 1,400.0 1,274.0 1,026.2 -19.5 -26.7
Source: National Bank of Ethiopia
b) Inter- Bank Money Market
No inter-bank money market transaction was effected during the quarter under review as virtually all commercial banks were laden by excess reserves. Since its introduction some five years ago, merely thirteen transactions involving Birr 187.4 million were held among few commercial banks with an interest rate ranging between 7 and 11 percent. The maturity period of these loans widely ranged from overnight to 5 years.
Table IV. 12: Inter-bank Money Market Transactions

No. Borrower
Lender
Amount Borrowed (In Mn.Br.)
Interest Rate
Transaction Date
Maturity Period
1 NIB Int'l Bank Awash International Bank 7.0 11 16/11/00 Overnight2 Wegagen Bank Commercial Bank of Ethiopia 10.0 8 03/01/01 5 years3 NIB Int'l Bank ,, 10.0 8 31/03/01 3 months4 Wegagen Bank ,, 10.0 8 22/03/01 1 year5 NIB Int'l Bank ,, 3.6 8 31/05/01 6 months6 NIB Int'l Bank ,, 3.7 8 31/06/01 6 months7 NIB Int'l Bank ,, 0.8 8 30/11/01 6 months8 NIB Int'l Bank Bank of Abyssinia 29.0 7 31/12/02 3.5 months9 NIB Int'l Bank ,, 19.0 7 31/01/03 3.5 months10 NIB Int'l Bank ,, 20.3 7 28/02/03 3.5 months11 NIB Int'l Bank ,, 29.0 7 31/03/03 3.5 months12 Nib Int'l Bank Commercial Bank of Eth. 25.0 7.5 07/07/03 5.2 month13 Nib Int'l Bank Bank of Abyssinia 20.0 7.5 26/03/05 Over draft Total/ Average 187.4 7.8
Source: Commercial Banks