Embed Size (px)
Citation preview

0)
._J
No. DTICELECTE
DEVELOPMENT OF S CT 0 718
STANDARDS FORVEHICLE INPUT LOADS
CONTRACT NUMBER DAE07-87-C-R062MAY 1988
JOHN OBRADOVICHNKF ENGINEERING. INC.RESTON. VIRGINIA 22001
By NKF REPORT NO. 1SS-O01/FD
DISTRIBUTION AUTHORIZED TO U.S.GOVERNMENT AGENCIES ONLY To Pw4QTmG* Administrative Or
.......... _-T - ...... . Ope'a"tional Uso16 MAY 1918. OTHER REQUESTS FOR THISDOCUMENT SMALL BE REFERRED TO TACOM.ATTN: AMSTA-DL, WARREN. MI 48397S000
U.S. ARMY TANK-AUTOMOTIVE COMMANDRESEARCH, DEVELOPMENT & ENGINEERING CENTERWarren, Michigan 48397-5000 8 8 1 0 6 0 0 1

NOTICES
This roport is not to be construed as an official Department of theArmy position
Si
Mention of any trade names or manufacturers in this report shall not beconstrued as an official endorsement or approval of such products orcompanies by the U.S. Government.
Destroy this report when it is no longer needed. Do not return it tothe originator.

UNCLASSI FIED
REPORT DOCUMENTATION PAGEla. RE PORT SECURITY CLASSIFICATION 1b. RESTRICTIVE MARKINGS Administrative or
UNCLASSIFIED None OperationalTs2a. SECURITY CLASSIFICATION AUTHORITY 3.DISTRIBUTION AVAILABILITY OF REPORT
UNCLASSI FIED CHUL itributioj ahorized to U.S. .Gov~rqment2D9ZLASSIFIATONOONGDING SCEDL lb .:, pl. I~ y(Cont'd on pg. 2)NA
4. PERFORMING ORGANIZATION REPORT NUMSER(S) S. MONITORING ORGANIZATION REPORT NUMBER(SI
NKF Report No. 8858-001/FD 13366
Ga. NAME OF PERFORMING ORGANIZATION 6b. OFFICE SYMBOL 4.. NAME OF MONITORING ORGANIZATION
NKF Engineering, Inc. I'U.S. Army Tn-Automotive Command____________________
I_ AMXSY-CM ANSTA- To Tan
fic. ADDRESS /Cky. Sstcm and ZIP C.ele/ 7b. ADDRESS (C0ty. Starc so ZIP Codej
Reston, Virginia 22091 Warren, Michigan 48397-5000
Ga. NAME OF FUNDING/SP0t.ISORING ILb OFFICE SYMBOL 9. PROCUREMENT INSTRUMENT IDENTIFICATION NUMBERORGANIZATION If affiwe )U.S. Army Tank-Automotive CAmd -1 AMSTA-TDP DAAE7-87-C-R062
Bc. ADDRESS jCIuy. Sestat sad ZIP Cools) 10. SOURCE OF FUNDING NUMBERS
Warren, Michigan 48397-G000 ELEMENT NO. NO. NO. 1ACCESSION NO.
it. TITLE (ImApoed Smaway C~aasMkcaai&a
* (U) Develooment of Standard for Vehicle Input Loads, Final Re port12. PERSONEL AUTHOR(S)
* John N. Obradovich
16. SUPPLEMENTARY NOTATION
17. COSATI CODES 18. SUBJECT TERMS lCoai... a* reverse 0 ntces.,y a"d West* by Week .mhnbelFELD IGROUP ISUBGROUP-'
I I : Vehicle design, shock, vibration, design standards,
19ASRClC..vkts e" Mfeven AF wee.uety sod MAujwk, by bbch awuubil 60 I 1WhprIZ2 .
A 6-month study involving literature surveys, compilation and analysis of test data, re-view of design and procurement specifications, and limited application of dynamic simulationcomputer models was directed at reviewing existing standards from vehicle manufacturers andthe o pen literature in order to make a determination of whether and how a suitable designstandard for vehicle suspension systems and frames could be developed, and to develop such astandard in terms of loads (as multiples oft *the acceleration of gravity -- g's), as a func-tion of vehicle type, terrain, and speed. Study results indicate that the originallyenvisionled simple design standard is not feasibIre, but a pratical approach to the incrementaldevelopment of design development "tools" that ca~ effectively perform the function of thedesign standard has been defined. j< R
20. DISTRIBUTION AVAILABILITY OF ABSTRACT I21. ABSTRACT SECURITY CLASSIFK.ATIONC1 UNCLASSIFIEDI/UNLIMITED C3 SAME AS RPT. 0 OTIC USERS UNCLASSIFIED
22a. NAME OF RESPONSIBLE INDIVIDUAL 22b. TELEPHONE I,044k Arai Cade) 22c. OFFICE SYMBOL
Roger Smith (313) 574-577 1 AMSTA-TDPDDFOM 43,84MA APR ed~ioama be use ume taftausea SECURITY CLASSIFICATION OF THIS PAGE
DDho FOM17,9 AoNak dkheas are obokSlaU.LSSl-E

-UNCLASSIFIED
SECURIrY CLASSIFICATION OF THIS PAGE
Block 3. (Continued)
Other requests f r this document shall be referred to rACOM, Attn: AMSTA-DOL, Warren, MI48397-5000.
SECURITY CLASSIFICATION OF THIS PAGE
2 UNCLASSIFIED

TABLE OF CONTENTS
t ion Page
1'INTRODUCTION .. . . . . . . . . . . . . . . . . . . . . . . . 9
OBJECTIVES ............................................... 9
3. CONCLUSIONS .............................................. 9
RECOMJMENDATIONS........................................... 9
0. DISCUSSION................... ............................ 10-1. Overview ........................... ..................... 10 -E2. valu-atlon of Test and Simulation Data ..................... 236 ~Dsign Criteria Implications ......... ...*..................43 .5 ~Desig~n Criteria Develoent .- A Practical Approach .......... 48
5 1.WOS Element 1.1--Data Cwpilation .......................... 615 .2.WBS Element 1.2--Data Analysis and Evaluation .............. 655- .3. WBS Element 1.3--Data Base Development ..................... 655. .4. WBS Element 1.4--Data Base Implementation .................. 66
r4 WMS Element 2.0--Simulation Evaluation, Utilization, andDevelopment............................6
S6. WBS Element 3.1--Vehicle Technical Design GuideDevelopment .................................66
5.4 7. L-SA Elements 3.2 and 3.3--Us of Data Base andSimulations .............................................. 867
5.4 WBS Element 4.0--Preliminary Test Plan Development ......... 675.4 . WBS Element 5.0--Reports.................................. 67
LIS-, OF REFERENCES............................................... 69
DISI IBUTION LIST............................................. Dist-1
Acces!'ion F or
;A~ L Y4 I I l
. 10
3

4

LIST OF ILLUSTRATIONS
Figure Title Page
5-1. Test Data/Simulation Comparison .............................. 13
5-2. Sample Data from AMSAA "Catalog" ............................. 18
5-3. Design Load Variation with Vehicle Condition ................. 20
5-4. Comparison of Simulation and Test Data (Full-Scale Tests).... 21
5-5. Comparison of Simulation and Test Data (Subscale Tests) ...... 22
5-6. M113A1 Design Load Envelope .................................. 24
5-7. M113A1 Armored Personnel Carrier ............................. 25
5-8. M113A1 Input Data for VEHDYN Simulation ...................... 27
5-9. M113A1 Simulation CG Response for 8.3-Inch Obstacle at10 .5 mph ..................................................... 34
5-10. M113A1 APO Test and Simulation Comparison, CO Responseto 8-Inch Obstacle ........................................... 35
5-11. M113A1 APO Test and Simulation Comparison, CO Responseto 10-Inch Obstacle .......................................... 36
5-12. M113A1 APO Test and Simulation Comparison, Driver's SeatResponse to 8-Inch Obstacle .................................. 37
5-13. M113A1 APO Test and Simulation Comparison, D,-iver' SeatResponse to 10-Inch Obstacle ................................. 38
5-14. Test Obstacles for FUC/Hughes Tests .......................... 39
5-15. M113 Accelerometer Locations for FMC/Hughes Tests ............ 40
5-16. M113A1 FMC/Hughes Test and Simulation Comparison, Point AResponse ..................................................... 41
5-17. M113A1 FMC/Huglies Tist and Simulation Comparison, Point DResponse ............................................ ........ 42
5-18. Excerpt from MIL-STD-810D .................................... 44
5-19. M113A1 Simulation CG Response for 8.3 to 20-InchObstac les .............................. ..................... 45
5

LIST OF ILLUSTRATIONS (Continued)
Figure Title Page
5-20. M113A1 Simulation RW Number 1 Response for 8.3 to 20-InchObstacles ................................................. 46
61. M113A1 Simulation RW Number 3 Response for 8.3 to 20-Inch52 Obstacles................................................. 47
5-22. 131SmltoCGRsosfo .- nhOsal......4
52.M113A1 Simulation CG Response for 8.-Inch Obstacle .......... 490
5-24. M113A1 Simulation CG Response for 9-Inch Obstacle ........... 50
5-26. M113A1 Simulation CG Response for 10.-Inch Obstacle......... 52
5-25. M113A1 Simulation CG Response for 12.-Inch Obstacle ......... 523
5-26. M113A1 Simulation CG Response for 16-Inch Obstacle ........... 53
5-28. M113A1 Simulation RW Number 1 Response for 8.3-InchObstacle.................................................. 55
5-29. M113A1 Simulation RW Number 1 Response for 9-Inch Obstacle ... 56
5-30. M113A1 Simulation RW Number 1 Response for 10-Inch Obstacle.. 57
5-31. M113A1 Simulation RW Number 1 Response for 12.3-InchObstacle.................................................. 58
5-32. M113A1 Simulation RW Number 1 Response for 16-Inch Obstacle 59
5-33. M113AI Simulation RW Number 1 Response for 20-Inch Obstacle 60
5-34. Overail Approach .......................................... 62
5-35. Work Breakdown Structure (WBS) .............................. 63
6

LIST OF TABLES
Table Title Page
5-1. Available CSTA Test Data by Vehicle Category ................ 12
5-2. AMSAA Test Data Vehicle List............................... 14
5-3. M113A1 Output Data for VEHDYN Simulation .................... 28I
5-4. Partial List of Manufacturers.............................. 64
7I

4
I
I
I
4
I
*4]
I
I
I
8
I

1.0. INTRODUCTION
This final technical report, prepared by NKF E.gineering, Inc., for theU.S. Army Tank-Automotive Command (TACOM) under Contract DAAEO7-87-C-R062, describes Phase I in the Development of Standards for VehicleInput Loads. This was a 6-month study involving literature surveys,compilation and analysis of test data, review of design and procurementspecifications, and limited application of dynamic simulation computermodels.
2.0. OBJECTIVES
The overall objective of the program was to review existing standardsfrom vehicle manufacturers and the open literature in order to make adetermination of whether and how a suitable design standard for vehiclesuspension systems and frames could be developed, and to develop such astandard in terms of loads (as multiples of the acceleration ofgravity--g's), as a function of vehicle type, terrain, and speed.
3.0. CONCLUSIONS
Study results have provided considerable insight into the issues underinvestigation, and have indicated that the originally envisioned simpledesign standard is not practical, primarily because it didn't considerthe effects of component natural frequency and the substantial loadvariations among different vehicle locations. However, the investiga-tion has led to a practical approach to the incremental development ofdesign development "tools" that can effectively perform the function ofthe design standard that was originally sought. A brief elaboration ofthe basis for this primary conclusion about the simple design standardis presented below.
As alluded to above, it has been determined that a simple design stand-ard of the type initially sought is not feasible. This is largely dueto the frequency dependence of the design criteria and the considerablevariability that this implies for different vehicle types, terrains,and speeds. This effort has significantly clarified the status of thedesign process and the need for design 'tools' that can perform thefunction of a design standard, a standard which would be the basis forthe initial design paper *prototype* that can be analyzed using availa-ble engineering tools. A practical plan for developing the requireddesign tools and standards has been defined and is briefly outlined inthe next section.
4.0. RECOMMENDATIONS
This study has clearly indicated a course of action that could signifi-cantly facilitate design development by providing meaningful design
9

criteria or standards at all phases of design and product development.This course of action has been defined so as to provide almost immedi-ate benefits while also laying the groundwork for future growth andincreased effectiveness, i.e., "incremental development." In generalterms, the recommended effort consists of four parts:
- Data base development and implementation;
* Simulati4.,n evaluation, utilization, and development;
* Vehicle technical design guide development; and
* Test plan devslopment.
The development of these recomuendations is derived from and related tothis Phase I effort, in overview terms, in Section 5.1, and is definedin detail in Section 5.4.
5.0. DISCUSSION
This section describes thd detailed methods and results of the Phase Iinvestigation, including: the approach to the accomplishment of theprogram objectives, the evolution of the previously discussed conclu-sion that definition of a set of simple design criteria is not feasi-ble, supporting data and rationale for this conclusion, evaluation oftest and simulation data to assess the status of existing data andtools that could be used o develop design standards, the implicationsof this status for design criteria development in this Phase I study,and the definition of a practical approach to the development of acomprehensive system of engineering tools that would enable a readydetermination of the design criteria for any given vehicle.
5.1. Overview
In the Phase I effort, vehicle design criteria were sought throughextensive computerized literature searches of data on vehicle design,specifications development, and testing. These searches were supple-mented by selected contacts of vehicle manufacturers from a comiprehern-sive list of manufacturers that was developed in this study. Early inthe effort, it was evident that virtually no design criteria existed inthe available literature and manufacturers could not readily identifythe criteria used, and were generally unable to make more extensive in-house searches without compensation that was beyond the scope of thePhase I effort to provide. Trhe difficulties involved were increased bythe passage of time since the actual vehicle design development, andthe turnover of design personnel.
The open literature indicated that the most systematic and effectivedetsign approaches used detailed structural analyses and simulations torefine the final design, butl little was said about the design criteria
10

used to develop the initial design that was the basis for these de-tailed analyses. It appears that much of this is based on the use ofproprietary "rules of thumb' and in-house informal data bases tLatenable preliminary designs to be developed as extensions of previous'reference" vehicles. A principal finding in the literature was thatthe frequency dependence of any design criteria was a critical consid-eration.
As it became clear that existing design criteria would not be readilyavailable, an alternative approach was defined and pursued. This con-sisted of obtaining test specifications and test data, and comparingthem with the results of vehicle simulations. The hope was that thesimulations would at least have trends that were consistent with thetest data, and desiqn criteria could be developed by simply applyingmultipliers to the the results from the simulations. Pursuant to this,a copy of the NATO Reerence Mobility Model (NRMM) was obtained throughTACOM and the dynamic simulation module of it was extracted and modi-fied (slightly) for operation on the NKF Engineering DEC VAX computers.
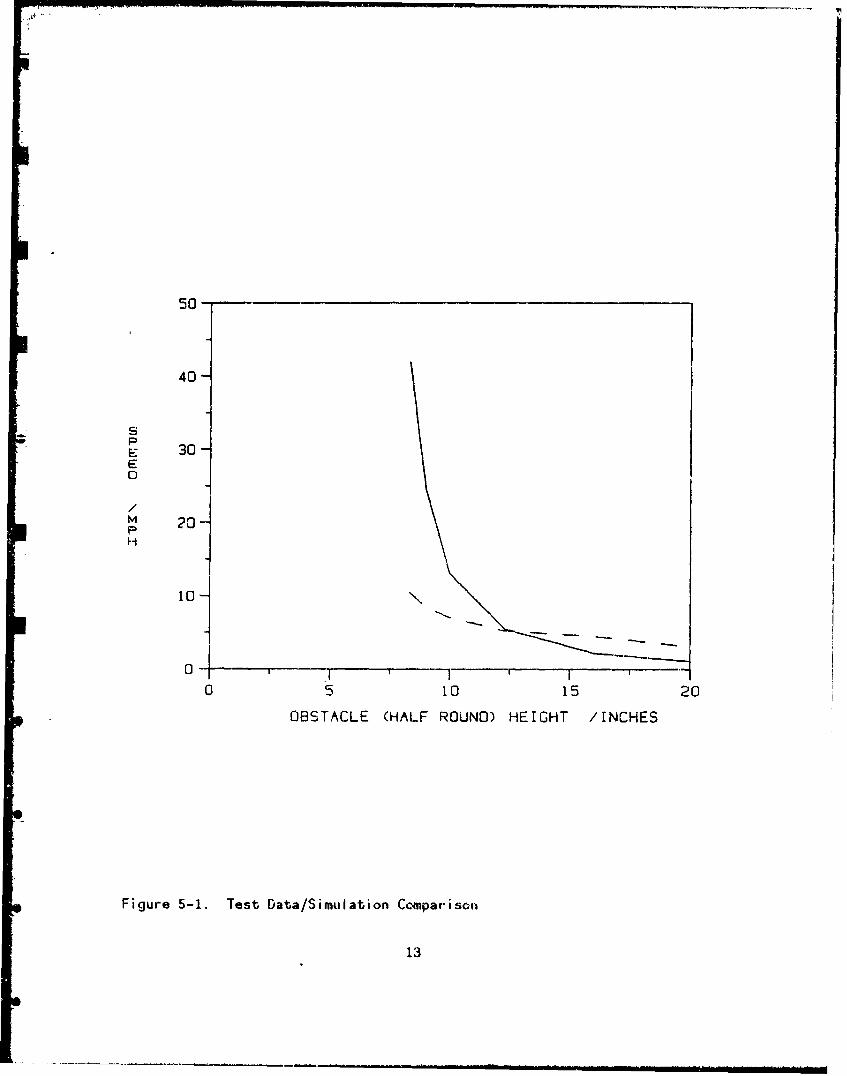
A comprehensive review of the vehicle test data in the files of theCombat Systems Test Activity (CSTA) at the Aberdeen Proving Ground was.made for the seven vehicle categories defined earlier in the study (seeTable 5-1). As trial simulations were run (for the M113A1 vehicle), itbecame evident that no simple "'multipliers" could be applied to thesimulation outputs that would result in their agreement-with vehicletest data. This is illustrated by the plots in Figure 5-1, which com-pare the maximum allowable vehicle speed versus obstacle height (ahalf-round obstacle) as derived from test data with those obtained fromthe Army's vehicle dynamic simulation program, which is part of theNRMM. The maximum allowable speeds are based on a limitation of a2.5-g 3cceleration at the base of the driver's seat. Figure 5-1 showsthat the test results (solid line) indicate a much greater speed forobstacle heights that are less than 10 inches. Similar vesults wereobtained for other comparisons.
In the course of the Phase I effort, test data for many vehicles wereidenitified, but generally one could not readily access the data thatwould be relevant to 3 particular design problem. Access within test-usually funded to catalog or index their test data. For example, thedata listed in Table 5-1 were identified by systematically examiningthe report files at the CSTA. The situation within user organizations(users of test data) is not significantly better, though for differentreasons. They have made extensive use of the test data by derivingneeded information therefrom. This has usually ben done over anextended period of time in a variety of evolutionary ways and hence itis difficult to determine the source of the test data used in anyparticular instance. For example, the Army Materiel Systems AnalysisActivity (AMSAA) uses test data to develop simulation inputs formobility studies and has systematically cataloged these data for manyvehicles (see Table 5-2 for a listing). Figure 5-2 is a sample pageing organizations is difficult because these organizations are not
11

Table 5-1. Avaiiable CSTA Test Data by Vehicle Category
VEHICLE CATEGORY CSTA VEHICLE TEST DATA
1eavy tracked vehicles M60, Ml
Medium tracked vehicles M109, Milo
Light tracked vehicles M2/M3, M113, M548
Heavy trucks HEMTT, M.A.N. IPT, M813
Medium trucks M923, M925, M36A2
Light trucks I w, CUCV
12
50 -
40-
-30S
1 0 -
0
0 520152
OBSTACLE (HALF ROUND) HEIGHT /INCHES
Figure 5-1. Test Data/Simulation Comparison
13

Table 5-2. AMSAA Test Data Vehicle List
VEHICLE I DESCRIPTION
ACE (M9) Armored Combat Earth MoverXIFV Armored Infantry Fighting Vehicle
CUCV Candidate Ford F250 Pickup (351 4BBL Eng)
CUCV Candidate Ford Bronco (302 2BBL Eng)
CUCV Candidate Dodge W-250 Pickup (318 4BBL Eng) I
CucV Candidate Dodge Ramcharger (318 2 BBL Eng)
CUCV Candidate Jeep J-20 Pickup (360 2BBL Eng)
CUCV Candidate Jeep Cherokee (360 2BBL Eng)
CUCV Cargo (MlO08) GM, Diesel Engine, Commercial UtilitylI Cargo Vehicle--Cargo Version
CUCV utility (MIO§) G GM, Diesel Engine, Commercial UtilitylL Cargo Vehicle--Utility Version
"CAD GAGE LAV CAD Gage 4x4 V-150 Armored Car
COMMANDO Cadillac Gage V-300 Armored Car
D7 BulldozerV Fast__ Attack__Vehicle_(4x2)
FAV 4 Fast Attack Vehicle (4x2)'FA* Fast Attack Vehicle (4x4)I
, STI Fire Support Team Vehicle
,4',7F rqo Zg977) JHeavy Expanded Mobility TacticalI Truck, Cargo Version (Oshkosh)
I-fJ'F7W-nker ,78) 1 Heavy Expanded Mobility TacticalI .... Truck, Tanker Version (Oshkosh)IRMSW Cargo (MQ') i High Mobility Multipurpose Wheeled
1 __-1 1 Vehicle, Cargo Version
I HMMWV Weapons Carrier ! High 1obility Multipurpose WheeledI (M966) Vehicle Weapons Carrier VersionMLRS (M993) 1 plL3unch Rocket System
M1 I b-aiV r, BttIe Tank (105mm Gun) III
MIA1 f Abrams Main Rattle lank (l2Omm Gun)
14

• .Table 5-2. (Continued) AMSAA Test Data Vehicle List
L_ VEHICLE _ _DESCRIPTION
M2 Bradley Fighting Vehicle
M35X2 6x6 Truck, Cargo, 2.5 Ton
M48A3 J Main Sattle Tank (90m Gun)
948A5 JMain Battle Tank (109,.u Gun)
M49 6x6 Truck, 1200 Wal. Tanker, 2.5 Ton
-U[OA3 Main Battle Tank (105., Gun)
U Recoery IVehicle, MiM88 Recovery Vehicle, Medium, Armored'
1 88A1 Recovery 'Vehicle, Medium,"Ar'mored '
M1O6A1 Mortar, Self Propelled, 4.2 Inch .
M19 Self-Propelled Howitzer, 155 MM
M ~Truck 6x6 Truck, Shop Van, 2.5 Ton
M11OA2 Howitzer, Self-Propeiled, 8 Inch
-M113A1 Armored Personnel Carrier
M113ADE1 Armored Personnel Carrier
M113A2 Armored Personnel Carrier
M114A1 Carrier, Command and Reconnaisance
IM114PI Product Improved-M114A
M151A2 4x4 Jeep, .25 Ton
IM151A3 4x4 Jeep, .25 Ton .
'M151 TOW 4x4 Jeep, .25 Ton with TOW Missile I
IM342 6x6 Truck, 2.5 Ton
M548 Tracked Cargo Carrier
WM548E1 Tracked Cargo Carrier
15

Table 5-2. (Continued) AMSA Test Data Vehicle List
VEHICLE DESCRIPTIONI ~IM551 I Sheridan Light TankM559I 4x4 GOER Fuel Truck, 2500 Gallon
I 6x6 AMA GOAT 1.25 Ton Truck
"M678 I Recovery Vehicle, Light, ArmorediEM56C I 8X8 5 Ton Truck, CargoM718 I 4x4 Ambulance, .25 TonM725 I 4x4 Ambulance, 1.25 TonM746 I Heavy Equipment Transporter (MET) 8x81
* I _____________________I Tractor .M8M'1 ' 6x6 5 Ton TruckI _ _ _ _ _ _ _ _ _ _ _ .....__ _ _ _ _ _ _ _ I . . .
M813A1 6x6 5 Ton Truck, Cargo, Oopsides
M813 6X6'5 Ton Tr,ck, Empty I
M814WW {6x6 Ton Truck, Long Wheel Base
F1816R I6x6 5 Ton Truck, WreckerM817 6x6 5 Ton Truck, Dump
M820 6x6 5 Ton Truck, Van
M821 6x6 5 Ton Truck, Bridge Tr nsportS (Stakeside)Tt
M88OI 4x4 1.25 Ion Truck, Util ty
S81885 4x4 Wnbulance, 1.25 Tr
1901 Improved TOW Vehic' 113 Based
S911 8x6 Tractor, F v, EquipmentI Transport,
'M915 1 6x4 AC I ctor, 5 Ton
IV9-23 6< Ton Tractor
M926 6x6 5 Ton, Pr-"r#er
_ 16

Table 5-2. (Continued) AMSAA Test Data Vehicle List
VEHICLE I DESCRIPTION
ROLAND (M975) Air Defense System
SEE Small Replacement Excavator
I T-120 Wrecker, Armored, Tracked I
XM956 6x6 2.5 Ton Truck
XR-311 Light Scout Vehicle "
17

am
... s.e
S,11.• i11"11.a* llum nlHl3 Al gi: ~ l
'.a Wei .I .
.1 W ., !. Um.:
I'.
0. O M Oi e USCI~ .00 16 06 a. . . 3 . .o ..
* &1 A : I fhlAll I.:I. -. 1413
Ii. e I U.
5-' . . .. . .1 ., meu• -.
S4. 4.4 F .bi* &
OS IA=UIM SP ONT. HUIHT SC 41iC LIPITM SP R!"
"11I3 At 1111u.HI3 AI ti~L
8. .•
'1.1 i I 1 t.dme a. L 4. 1i.0
Im .... :6
61. ts 4 .6 .
asI*"O c3.* 6 .0 4.8 4;. Y6.0j 4O a O 68 a ~ 1. 0. i.0 ;.0 A. 1.0 a . 64.0SICIgI4T 1alfpe. ULwrIV. MOX0MSS IM Ik VIES
Figure 5-2. Sample Data from ANSAA "Catalog"
18

from this "catalog.* Efforts to identify the test data used to gener-ate the information shown in Figure 5-2 led to the mobility testingorganization at the Army Corps of Engineers Waterways Experiment Sta-tion (WES) in Vicksburg, Mississippi. They have the data on file bytest date, and the data for particular tests cannot be readilyaccessed.
It was concluded that reconciliation of the test data (needed becausedata from different sources differed significantly) and the simulationresults was beyond the scope of the Phase I effort, and emphasis wasshifted to defining a practical approach that could effectively andincrementally provide the needed engineering design information andtools.
The Phase I effort has shown a feasible path to the development ofdesign tools that can effectively provide design standards for a fullrange of vehicles, terrains and speeds. Phase I has indicated theexistence of a large amount of unintegrated test and specificationsdata that can be the bases for these design tools, and has shown thatthe design criteria should be derived from operational factors thathave been determined to control vehicle speed in different terrains.These factors are the obstacle heights associated with a 2.5-g acceler-ation at the base of the driver's seat, id a surface roughness associ-ated with a 6-watt power level at the drder's seat. For example, thespeed limitations for the M113A1, based on these factors are shown inFigure 5-2. In general terms, these existing data need to be inte-grated into a usable data base and tools and methods need to be devel-oped for utilizing the data base, and the aforementioned speed-limitingfactors, to determine design loads for specific vehicles.
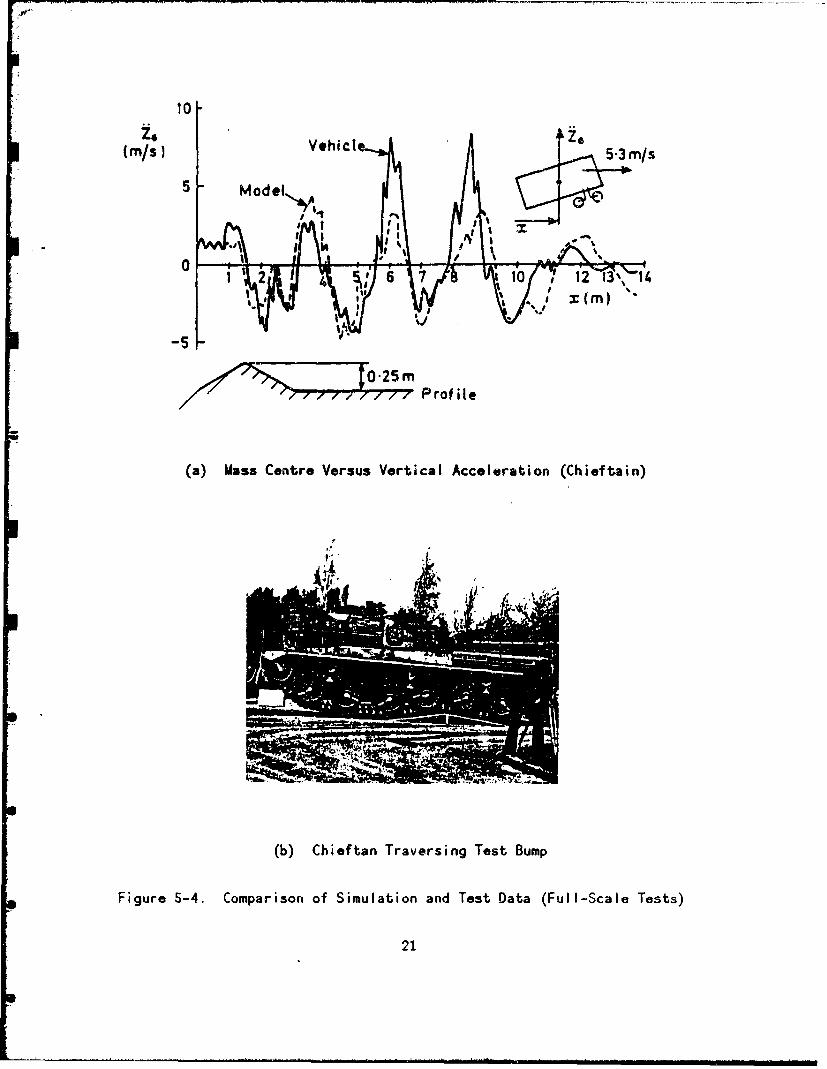
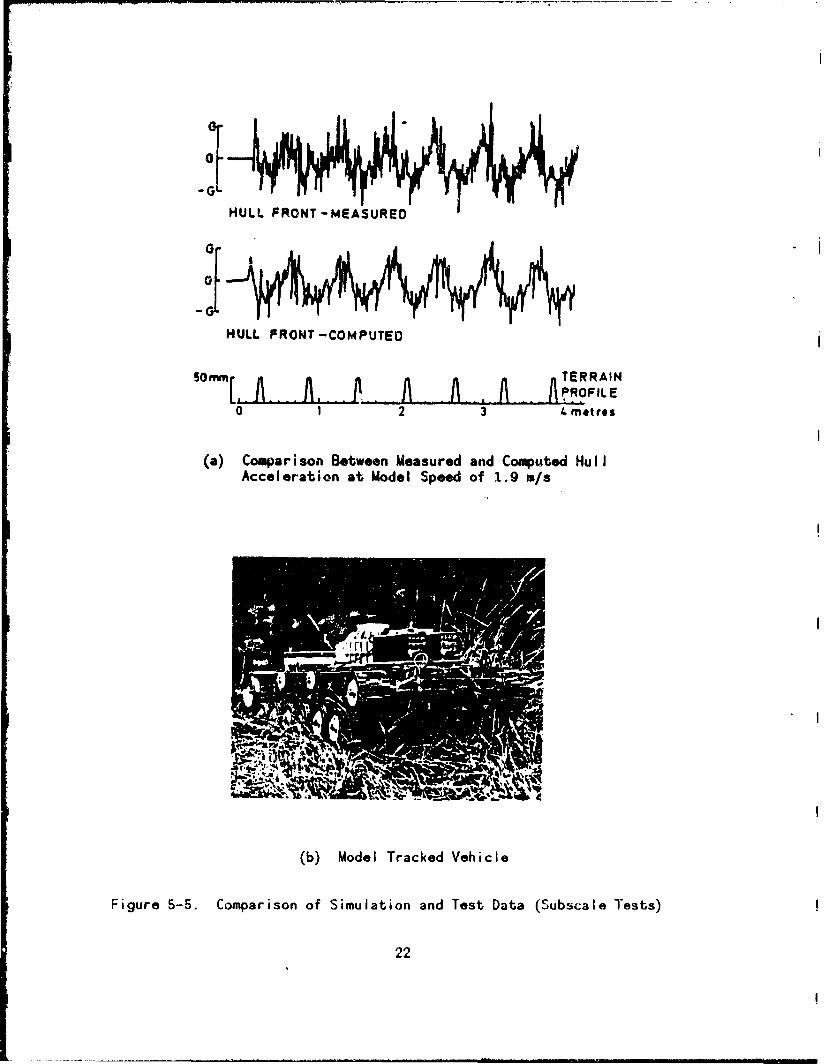
Data base development should include grading the quality of the dataand assuring its proper characterization; this is essential for a trulyuseful data base, and is feasible when the test data are evaluated byengineering personnel before incorporation into the data base. 'Thenecessity of this kind of data evaluation is illustrated by the testresults shown in Figure 5-3 which shows test data that are significant-ly different because of different conditions of the vehicle samplesinvolved. The experienced accelerations (basis for vehicle designloads) are shown to be different for the 'same' vehicle when the tracktension is different or the degree of vehicle wear is different. Thisprobably would surprise nobody, but it is the kind of thing that isoften not specified when test data for a given vehicle type are pre-sented in various reports. These kinds of inconsistencies need to beidentified, or at least it needs to be noted that the conditions wereuncertain, for the inputs to the data base to prevent pseudo anomalies.The feasibility of this approach and its potential for success can beillustrated by comparisons of simulations with test data for situationsin which the conditions of the vehicles were relatively well known andreflected in the simulations. Figures 5-4 and 5-5 illustrate suchconditions for two vehicles, the Chieftain Main Battle Tank and aSuspension Research Vehicle.
19

'LS 2min
Figure 5-3. Design Load Variation with Vehicle Condition
20
10
Vehict(M/S - /
Prof He
(a) Mass Centre Versus Vertical Acceleration (Chieftain)
T f
(b) Chieftan Traversing Test Bump
Figure 5-4. Comparison of Simulation and Test Data (Full-Scale Tests)
21
HULL FRONT -MEASURED
HULL FRONT -COMPUTED
so flfl A A A TERRAIN
012 3 1.metro$
(a) Comparison Between Measured and Computed HullAcceleration at Model Speed of 1.9 rn/s
(b) Model Tracked Vehicle
Figure 5-5. Comparison of Simulation and Test Data (Subscale Tests)
22
Phase I results indicate that it is likewise feasible to provide sim-plified vehicle design input leads, more complicated than those origin-ally envisioned, and which show a frequency dependence for the loads.A feasible approach to this is illustrated by the plots in Figure 5-6which were generated during the Phase I effort using the aforementioneddynamic module from the NATO Reference Mobility Model. These curvesshow the design accelerations for the fifth roadwheel on an M113A1running over four different heights of half-round obstacles, ranging insize from about 8 to 20 inches. The vehicle speed for each obstacleheight was sot to the maximum allowable value based on a limit of 2.5g's at txj base of the driver's seat. Each of the 4 curves shown isfor a different obstacle height; it is clear that a limiting envelopecan be drawn around these curves that could serve as a single designcurve that would encompass design loads for a range of speeds andobstacle heights. In its simplest practical form this approach couldinclude -wo such plots, one for components on the vehicle unsprung massand one for components on the sprung mass. Obviously, more definitivedesign lo&O4s would be better, but there could be instances where thisapproach -culd be adequate, and better than what would otherwise beavailable. This simplified approach shows the important incrementalcharacter of the defined approach; that is, useful information would beprovided at a rwiuber of different levels of definitiveness, and theapproach includes provisions for evolutionary growth to a full state-of-the-art Computer-Aided Engineering (CAE) system.
5.2. Evaluation of Test and Simulation Data
This section discusses the key detailed comparisons made of vehicletest data and the results of computer simulations. lest data were mostreadily available for the M113 Armored Personnel Carrier (Figure 5-7),and for this reason, it was used in these comparisons to determinewhether simple multipliers for simulation results could provide reason-able design criteria. These comparisons have been made using data fromGovernment testing at the Aberdeen Proving Ground (APG) and the WES,and manufacturer's data from Food Machinery and Chemical Corporationtesting conducted by the Hughes Aircraft Company. The computer simula-tions have all been made using the VEHDYN vehicle-dynamics module fromthe NRMM.
Frequency dependent shock response in terms of multiples of the accel-eration of gravity, have generally been determined using the methodsdescribed in Harris' "Shock and Vibration Handbook." l These methodsprovide the equivalent static-g load as a function of the naturalfrequency of a single-degree-of-freedom system which is deemed to havethe same natural frequency as the vehicle component under considera-tion. Other comparisons have been made in terms of accelerationresponse at a particular vehicle location as a function of the vehicletest conditions. The type of comparison made has been determined bythe form of the available test data and the necessary economies of theproject. Generally, post-processing of VEHDYN output was minimized,while assuring meaningful comparisons.
23

400-
A 3001A
E
C 200-
0
s
1 10 100 1000
FRI-QUENCY /HZ
Figure 5-6. M113A1 Design Load Envelope
24

HEIGHT. g 1/4LENGTH - 191 1/2WIDTH .106 3/4
(a) Front Quarter View
ALL DIMENSIONS ARE IN INCHE.
(b) Rear Quarter View
Figure 5-7. M113A1 Armored Personnel Carrier
25
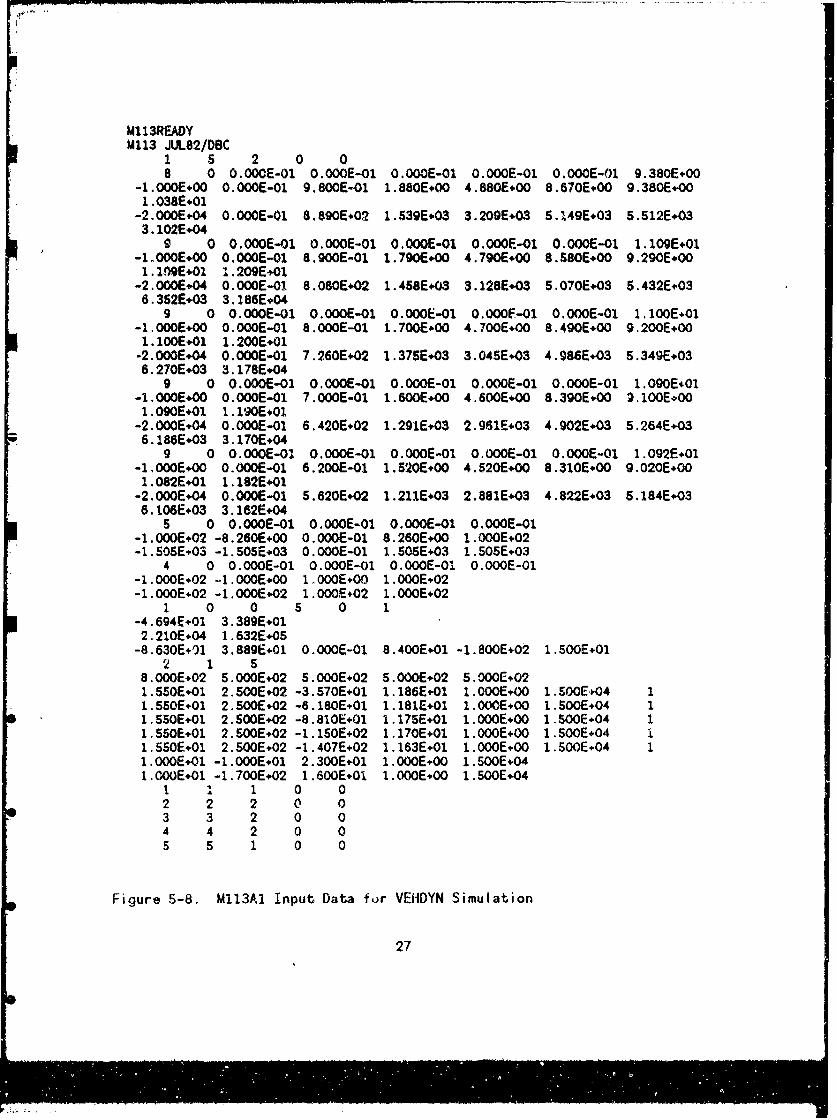
The input data for the NRMM/VFHDYN simulation are shown in Figure 5-8and were obtained from the TACOM simulation division via the StevensInstitute of Technology. This figure is included here to document thebasis for the compa-isons made in this investigation, and detailedinterpretation requires using Creighton's 'Revised Vehicle DynamicsModule: User's Guide for Computer Program VEHDYN I1.o2
The VEHDYN output, as simplified for this investigation, is shown inTable 5-3 for a representative case. As noted on the first page ofthis figure, the simulated M113A1 vehicle is passing over an 8-inchhalf-round obstacle at 10 miles per hour. The output shows the accel-erations versus time, as the vehicle rides over the obstacle, for thecenter of gravity and the axles of each of the five roadwheels. Theseacceleration histories were input to shock spectra software to generatethe shock responses alluded to above. Note that a number of "strikethroughs' occurred during this simulation--involving all but the centerroadwheel (RW number 3). That is, the roadwheel suspensions eitherbottomed or were fully extendwd. Similar incidents occurred during thetests used in the comparisons. Similar results to those of Table 5-3have been used to plot the acceleration of the vehicle center ofgravity versus time (see Figure 5-9) for an M113A1 traveling at 10.5miles per hour over an 8.3-inch half-round obstacle.
A comparison of WES test data and simulation results has been discussedpreviously (see Figure 5-1). This comparison indicates the maximumspeed at which the M113A1 can traverse obstacle hnights (half rounds)of less than 10 inches (based on a limiting acceleration of 2.5 g's atthe base of the driver's seat) is much lower for the simulation thanfor the WES test data.
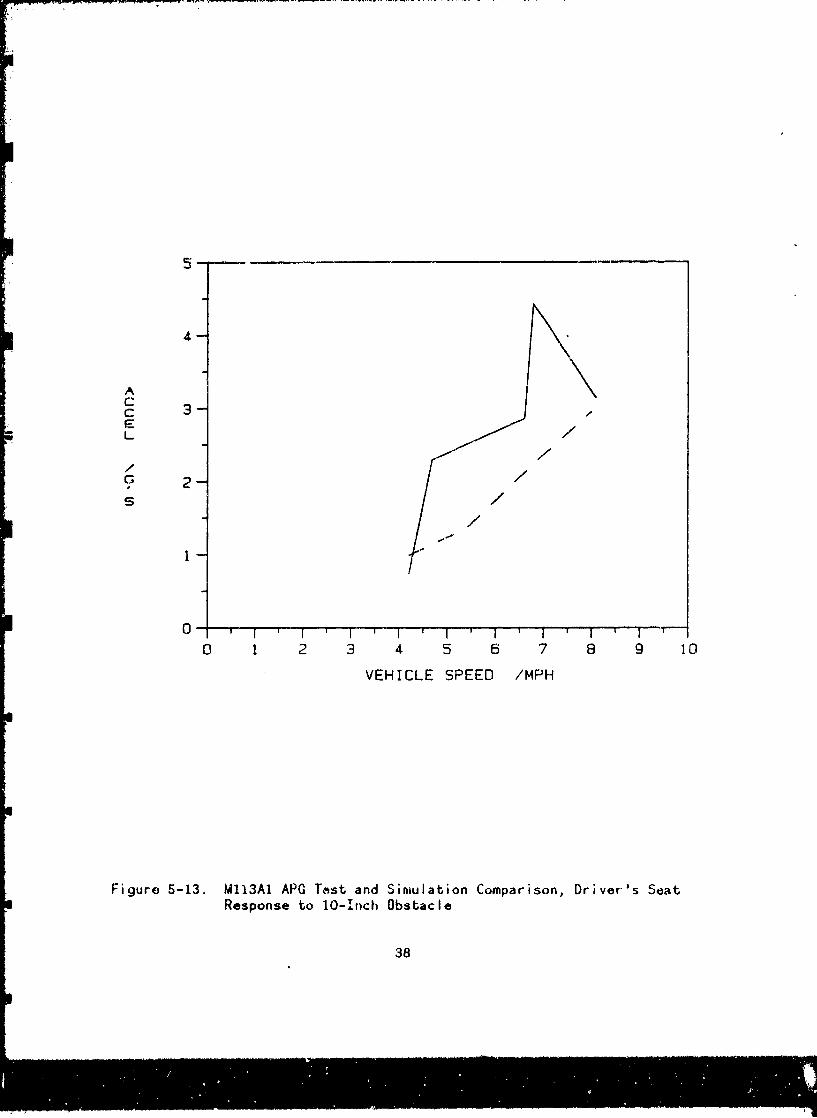
Comparisons of center-of-gravity and base-of-driver's-seat accelera-tions for APG tests and VEHDYN simulations are shown in Figures 5-10through 5-13. Note that the simulation accelerations are generallyhigher for the center of gravity and !ower for the base of the driver'sseat. However, the shapes of the curves prevent the confidentestablishment of any definitive relationship between the teubting andsimulation results.
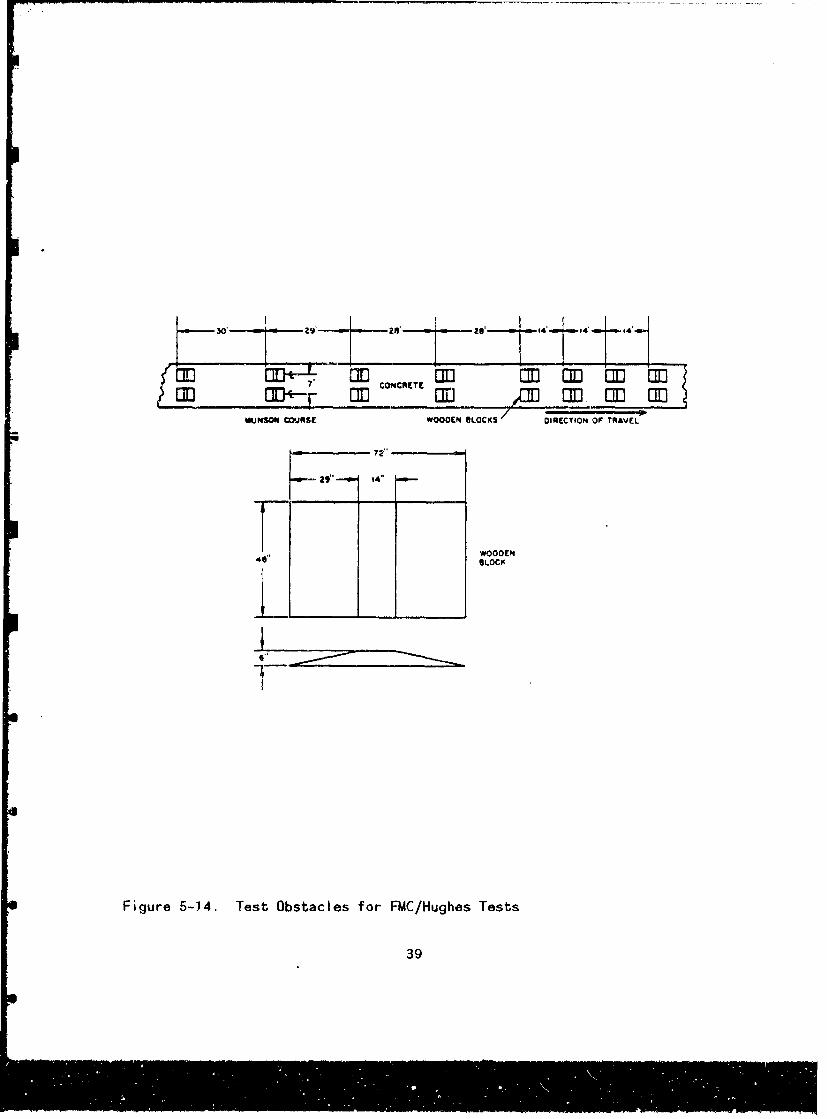
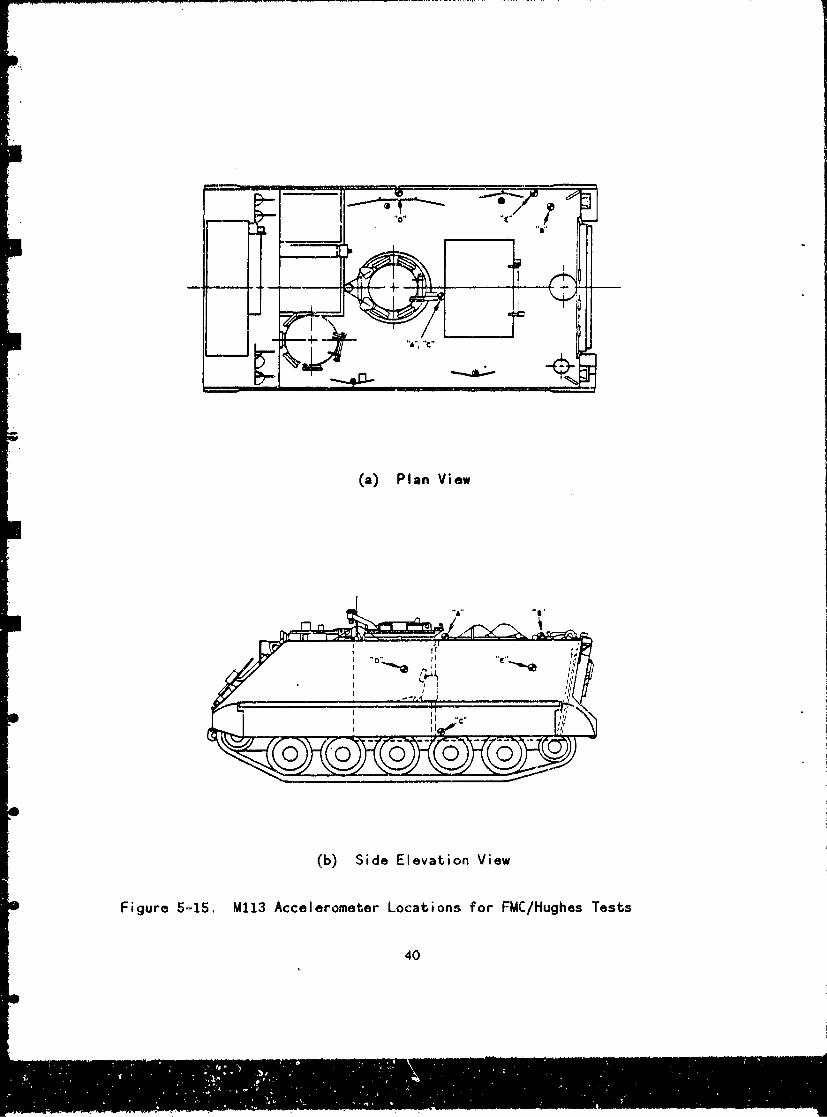
The FMC/Hughes test data were obtained from Pomonik's *Dynamic Environ-ment of M-113 Armored Personnel Carrier,'3 and though for somewhat dif-ferent set of conditions (an M113 vice an M113A1, and a sequence of6-inch bumps at 13 miles per hour vice an 8.3-inch bump at 10.5 milesper hour), the comparison was still instructive as corroboration of thetrends seen in the APG and WES test data comparisons. The test coursefu': the FMC/Hughes testing is shown in Figure 5-14 and the test vehiclewith accelerometer locations is shown in Figure 5-15. The FMC/Hughestest results contained shock responses ;n the shock spectrum format4
and similar shock responses were generated from VEHDYN simulation out-puts to make the comparisons shown in Figures 5-16 and 5-17. For bothpoints "A" and "D," the shock response is consider.ably greater for thetests than for the simulation; the simulation data are for the vehicle
26
M113READYM113 JUL82/DBC
1 5 2 0 08 0 O.OOCE-0l 0.OOOE-01 0.0006-01 0.0006-01 0.0006-01 9.380E+00
-1 .0006.00 0. OOOE-02. 9. 800E-01 1 .880E+00 4. 880E.00 8.6870E+00 9. 380E+001 .038E+01
-2.00064.04 0.OOOE-0l 8.890E.02 1.639E.03 3.209E.03 5.149E+03 5.512E.033.102E+04
2 0 0.0006-01 0.0006-01 0.0006-01 0.0006E-01 0.0006-01 1.109E+01-1.0006.00 0.0006-01 8. 900-01 1.790E.00 4. 790E.00 8.580E+00 9.2906.00
1.209E+01 1.209E.01-2.0006.04 0.0006-01 8.080E.02 1.468E.03 3.128E.03 5. 070E+03 5. 432E4.036.352E.03 3.186#04
9 0 0.0006-01 0.0006-01 0.0006-01 0.0006-01 0.0006-01 1.100E+01-1.0006.00 0.0006-01 8.000E-01 1. 700E+00 4.700E+00 8 .490E.00 9. 200E+00
1.100E.01 1.200E+01-2.00064.04 0.0006-01 7.260E.02 1.375E+03 3.045E+03 4.986E.03 5.349E+038.270E.03 3.178E+04
9 0 0.0006-01 0.0006-01 0.0006-01 0.0006-01 0.OOOE-01 1.090E+01-1.0006.00 0.0006-01 7.0006-01 1.600E.00 4.600E.00 8. 390E'.00 2 .1006.001.090E.01 1.190E.01
-2.0006.04 0.0006-01 6.420E.02 1.291E.03 2.961E.03 4.9026.03 5.264E.036.186.03 3.170E.04
9 0 0.0006-01 0.0006-01 0.0006-01 0.0006-01 0.000E-01 1.092E.01-1.0006.00 0.000E-01 6.200E-01 1.6206.00 4.520E.00 8.3106.00 9.020E.00
1.082E.01 1.182E.01-2.0006.04 0.0006-01 5.820E.02 1.211E.03 2.881E.03 4.822E.03 5.184E+036.1086.03 3.162E+04
5 0 0.0006-01 0.0006-01 0.0006-01 0.0006-01-1.0006.02 -8.260E.00 0.0006-01 8.260E.00 1 .000E+02-1.5SOSE+03 -1. 505E+03 0.0006-01 1 .506.03 1 .5056.03
4 0 0.0006-01 0.0006-01 0.0006-01 0.0006-01-1.0006.02 -1.0006.00 1,0006.00 1.0006.02-1.0006.02 -1.0006.02 1.0006.02 1.0006.02
1 0 0 5 0 1-4.694E+01 3.389E.012.210E.04 1.632E.05
-8.630E.'01 3,889E.01 0.0006-01 8.400E.01 -1.800E.02 1.500E.012 1 5
8.0006.02 5.0006.02 5.0006.02 5.0006.02 5.0OOE+021.5506.01 2.500E+02 -3.570E.01 1.1866.01 1. O00Ei00 1 .5006.04 11.550E.01 2.500E+02 -8.180E.01 1.181E.01 1.0006.00 1.5006.04 11.5506.01 2.500E.02 -8.810E+01 1.175E.01 1.000E.00 1.500E.04 11.550E.01 2.500E.02 -1.150E.02 1.170E.01 1.0006.00 1.5006.04 I1.550E.01 2.500E.02 -1.407E.02 1.1636+01 1.OOOE.00 1.5O0E+04 11.0006.01 -1 .0006.01 2.3006.01 1 .0006.00 1 .5006.041 .0006.01 -1 .700E.02 1 .600E.01 1 .0006.00 1 .500E+0411 1 0 02 2 2 0 03 3 2 0 04 4 2 0 05 5 1 0 0
Figure 5-8. M113A1 Input Data for VEHDYN Simulation
27

Table 5-3. Sample VEHDYN Output
VEHICLE M113A1 PROFILE 8INHRVEHICLE SPEEDL 10.0 MPH ( 176.0 IPS) -
INTEGRATION STEP SIZE DT=0.002000 SEC "VEHICLE WILL RUN FOR 2.05 SECONDS ( .,FEET)OUTPUT INCREMENTS: DTPRNT= 0.010000 ',-- ITPLOT=10.000000 SEC,
DTPWR= 0.01001., SECABSORBED POWER STARTS AT -1.00 FEET, FILTER CUTOFF FREQUENCY=I00.0 HZ.VEHICLE ID. M113 JUL82/DBCPROFILE ID. AN 8 INCH HIGH HALF ROUJD OBSTACLE
--------------------ACCELERATIONS-------------------------
TIME CG RW #1 RW #2 RW #3 RW #4 RW fS
0.000 0.000 -0.001 -0.001 -0.001 0.000 0.0000.010 0.000 -0.001 -0.001 0.000 0.001 0.0020.020 0.000 -0.001 0.000 0.000 0.000 0.0010.030 0.000 0.000 0.000 0.000 0.000 0.0000.040 0.000 0.000 0.000 0.000 0.000 0.0000.050 0.000 0,000 0.000 0.000 0.000 0.0000.060 0.000 0.000 0.000 0.000 0.000 0.0000.070 0.000 0.000 0.000 0.000 0.000 0.0000.080 0.000 0.000 0.000 0.000 0.000 0.0000.090 0.000 0.000 0.000 0.000 0.000 0.0000.100 0.000 0.000 0.000 0.000 0.000 0.0000.110 0.000 0.000 0.000 0.000 0.000 0.0000.120 0.000 0.000 0.000 0.000 0,000 0.0000.130 0.000 0.000 0.000 0.000 0.000 0.0000.140 0.000 0.000 0.000 0.000 0.000 0.0000.150 0.000 0.000 0.000 0.000 0.000 0.0000.160 0.000 0.000 0.000 0.000 0.000 0.0000.170 0.000 0.000 0.000 0.000 0.000 0.0000.180 0.000 0.000 0.000 0.000 0.000 0.0000.190 0.000 0.000 0.000 0.000 0.000 0.0000.200 0.000 0.000 0.000 0.000 0.000 0.0000.210 0.000 0.000 0.000 0.000 0.000 0.0000.220 0.000 0.000 0.000 0.000 0.000 0.0000.230 0.000 0.000 0.000 0.000 0.000 0.0000.240 0.000 0.000 0.000 0.000 0.000 0.0000.250 0.000 0.000 0.000 0.000 0.000 0.0000.260 0.000 0.000 0.000 0.000 0.000 0.0000.270 0.000 0.000 0.000 0.000 0.000 0.0000.280 0.000 0.000 0.000 0.000 0.000 0.0000.290 0.000 0.OOC 0.000 0.000 0.000 0.0000.300 0.000 0.000 0.000 0.000 0,000 0.0000.310 0.000 0.COO 0.000 0.000 0.000 0.0000.320 0.000 0.000 0.000 0.000 0.000 0.0000.330 0.000 0.000 0.000 0.000 0.000 f.000
28

Table 5-3. (Continae.&r-_.c;ample VEHDYN Output
------------------- ACCFLERATIONS-----------------------
TIME CG RW #1 RW #2 RW #3 RW #4 RW #5
0.340 0.000 0.000 0.000 0.000 0.000 0.0000.350 0,000 0.000 0.000 0.000 0.000 0.0000.360 0.000 0.000 0.000 0.000 0.000 0.0000.370 0.000 0.000 0.000 0.000 0.003 0.0000.380 0.000 0.000 0.000 0.000 0.000 0.0000.390 0.000 0.000 0.000 0.000 0.000 0.0000.400 0.000 0.000 0.000 0.000 0.000 0.0000.410 0.000 0.000 0.000 0,000 0.000 0.0000.420 0.000 0.000 0.000 0.000 0.000 0.0000.430 0.000 0.000 0.000 0.000 0.000 0.0000.440 0.000 0.000 0.000 0.000 0.000 0.0000.450 0.000 0.000 0.000 0.000 0.000 0.0000.460 0.000 0.000 0.000 0.000 0.000 0.000C.470 0.000 0.000 0.000 0.000 0.000 0.0000.480 0.000 0.000 0.000 0.000 0.000 0.0000.490 0.000 0.000 0.000 0.000 0.000 0.0000.500 0.000 0.000 0.000 0.000 0.000 0.0000.510 0.000 0.000 0.000 0.000 0.000 0.0000.520 0.000 0.000 0.000 0.000 0.000 0.0000.530 0.000 0.000 0.000 0.000 0.000 0.0000.540 0.000 0,000 0.000 0.000 0.000 0.0000.550 0.000 0.000 0.000 0.000 0.000 0.0000.560 0.000 0.000 0.000 0.000 0.000 0.0000.570 0.000 0.000 0.000 0.000 0.000 0.0000.580 0.000 0.000 0.000 0.000 0.000 0.0000.590 0.000 0.000 0.000 0.000 0.000 0.0000.600 0.000 0.000 0.000 0.000 0.000 0.0000.610 0.000 0.000 0.000 0.000 0.000 0.0000.620 0,000 0.000 0.000 0.000 0.000 0.0000.630 0.000 0.000 0.000 0.000 0.000 0.0000.640 0.000 0.000 0.000 0.000 0.000 0.0000.650 0.000 0.000 0 000 0.000 0.000 0.0000.660 0.000 0.000 0.000 0.000 0.000 0.0000.670 0.000 0.000 0.000 0.000 0.000 0.0000.680 0.000 0.000 0.000 0.000 0.000 0.0000.690 0.000 0.000 0.000 0.000 0.000 0.0000.700 0.000 0.000 0.000 0.000 0.000 0.0000.710 0.000 0.000 0.000 0.000 0.000 0.0000.720 0.000 0.000 0.000 0.000 0.000 0.0000.730 0.000 0.000 0.000 0.000 0.000 0.0000.740 0.000 0.000 0.000 0.000 0.000 0.0000.75C 0.000 0.000 0.000 0.000 0.000 0.0000.760 -0.074 2.160 -0.020 -0.054 -0.031 -0.0100.770 -0.026 -2.007 0.061 0.001 -0.005 -0.011
29

Table 5-3. (Continued) Sample VFHDYN Output
------------------- ACCELERATIONS-------------------
TIME CG RW #1 RW #2 RW #3 RW #4 RW #5
0.780 0.021 17.857 0.081 0.034 -0.005 -0.0630.790 0.125 48.104 1.413 0.070 -0.041 -0.1750.800 0.281 -9.122 2.725 0.170 0.082 0.0640.810 0.422 -34.645 0.935 0.227 0.157 0.1770.820 0.346 -32.974 0.749 0.011 0.100 0.1050.830 0.177 5.375 -1.215 -0.290 -0.091 -0.0310.840 0,471 28.551 -2.218 -0.169 -0.216 -0.0640.850 0.565 -8.839 -0.077 0.097 -0.043 0.0150.860 0.617 -15.239 0.310 0.221 0.209 0.071
JOUNCE STRIKE-THROUGH OCCURRED FOR INDEP. SUSPENSION #1 (UNIT #1)FROM TIME= 0.850 UNTIL 0.864 SEC.
0.870 0.180 13.573 -0.139 0.069 0.133 -0.0260.880 0.247 -3.466 0.113 -0.131 -0.127 -0.0030.890 0.137 -11.543 0.083 -0.092 -0.151 -0.0220.900 0.089 -9.124 -0.747 0.078 0o061 -0.0240.910 0.022 0,363 -1.966 0.083 0.155 -0.0120.920 -0.047 2.233 -2.686 -0.129 0.002 -0.0110.930 -0.117 -6.197 8.314 -0.286 -0.144 -0.0560.940 -0.139 -8.551 51.498 1.074 -0.072 -0.2100.950 -0.110 -1.708 -1.481 3.547 0.161 -0.0110.960 -0.065 6.557 -36,191 4.221 0.308 0.1740.970 -0.131 13.002 -39.593 3.584 0.241 0.1240.980 -0.210 14.740 14.301 -0.228 0.060 -0.010
REBOUND STRIKE-THROUGH OCCURRED FOR INDEP. SUSPENSION #1 (UNIT #1)FROM TIME= 0.986 UNTIL 0.988 SEC.
0.990 0.089 3.959 45.620 -2.648 -0.157 -0.0311.000 0.204 4.071 -19.180 -1.905 -0.234 0.1061.010 0.236 3.271 -37.393 -2.040 -0.084 0.1061.020 0.205 -0.627 -3,749 -3.502 0.038 0.0261.030 0.168 -4.179 31.588 -4.513 -0.114 -0.0251.040 0.162 -4.319 -2.718 -2.805 -0.378 -0.0211.050 -0.001 -0.440 -24.866 -0.761 -0.351 -0.0731.060 -0.122 -0.913 -16.479 -0.294 0.055 -0.0931.070 -0.304 -1.382 8.009 -0.231 0.390 -0.0881.080 -0.426 -1.236 5.921 46.917 0.630 -0.2091.090 -0.388 -2.226 3.264 27.706 1.914 -0.0951.100 -0.320 -3.193 8.435 -29.998 3.579 0.2591.110 -0.464 -2.767 20.896 -38.103 4.645 0.280
REBOUND STRIKE-THROUGH OCCURRED FOR INDEP. SUSPENSION #2 (UNIT #1)FROM TIME= 1.108 UNTIL 1.118 SEC.
1.120 -0.264 -0.599 10.328 -31.037 1.884 0.2771.130 -0.244 2.333 2.999 44.150 -2.707 0.0891.140 -0.178 6.441 -1.578 27.272 -3.786 0.0251.150 0.146 -0.625 -3.503 -31.770 -2.492 0.138
30

Table 5-3. (Continued) Sample VEHDYN Output
----------------------ACCELERATIONS-----------------------
TIME CG RW #1 RW #2 RW #3 RW #4 RW #5
1.160 0.179 -0.541 -6.561 -34.149 -2.721 0.075REBOUND STRIKE-THROUGH OCCURRED FOR INDEP. SUSPENSION #1 (UNIT #1)
FROM TIME= 1.134 UNTIL 1.164 SEC.1.170 0.102 -0.031 -10.310 2.590 -3.757 -0.0901.180 0.002 -0.303 -10.418 33.828 -4.226 -0.2131.190 -0.054 -0.603 -6.976 -5.297 -1.784 -0.2301.200 -0.188 -0.834 -2.463 -26.220 0.581 -0.2401.210 -0.360 -1.019 1.075 -18.165 0.921 -0.2261.220 -0,573 -0.469 3.478 5.300 8.408 -0.2141.230 -0.965 -0.642 17".441 9.067 53.562 0.1621.240 -0.622 -0.883 8.117 8.595 4.476 1.116
REBOUND STRIKE-THROUGH OCCURRED FOR INDEP. SUSPENSION #2 (UNIT #1)FROM TIME= 1.228 UNTIL 1.244 SEC.
1.250 -0.259 -0.617 -2.354 6.576 -34.368 0.9281.260 -0o178 -0.716 -5.326 10,942 -40.025 -0.0451.270 -0.219 -0.708 -6.079 8.359 3.281 -0.7381.280 -0.242 -0,599 -3.892 4.708 49.624 -0.0891.290 -0,120 -0.634 -1.175 2.544 -11.174 1.1,041.300 -0.015 -0.625 1.891 -0.729 -38.794 0.8661.310 -0.042 -0.545 4.170 -6.147 -8.602 0.0221.320 -0.056 -0.446 3.927 -9.996 32.847 0.0681.330 -0.004 -0.415 2.558 -8.497 -0.194 0.7351.340 0.036 -0.397 -0.195 -5.762 -26.418 0.5681.350 0.000 -0.441 -3.207 -3.533 -13.290 -0.1211.360 -0.109 -0.571 -5.543 -1.489 16.044 -0.3731.370 -0.223 -0.711 -5.821 1.445 7.514 0.3131.380 -0.098 -0.611 -5.332 4.125 -18.324 27.3771.390 -0.174 -0.606 -2.991 4.165 -12.773 21.9541.400 -0.246 -0.889 0.374 2.310 7.167 -20.4271.410 -0.720 -1.417 18.655 0.747 7.313 -31.551
REBOUND STRIKE-THROUGH OCCURRED FOR INDEP. SUSPENSION #2 (UNIT #1)FROM TIME= 1.402 UNTIL 1.418 SEC.
1.420 -0.606 -0.684 -1.712 3.625 4.085 -2.9061.430 -0.311 -0.585 -4.178 5.359 13.832 8.680
REBOUND STRIKE-THROUGH OCCURRED FOR INDEP. SUSPENSION #i (UNIT #1)FROM TIME= 1.216 UNTIL 1.436 SEC.
1.440 -0.051 9.805 -5.087 0.454 18.980 4.7221.450 0.079 13.277 4.210 -3.062 7.320 -8.7091.460 -0.006 -6.290 11.198 -1.681 2.525 -2.2021.470 0.069 -10.651 -1.523 2.358 -2.763 -0.5691.480 0.158 1.661 -8.257 2.793 -7.255 -5.0451.490 0.223 11.217 -4.193 -0.256 -10.130 -4.6711.500 0.246 -1.727 8.650 -1.649 -10.127 -3.1771.510 0.248 -8.318 5.114 -2.657 -8.835 -1.609
31
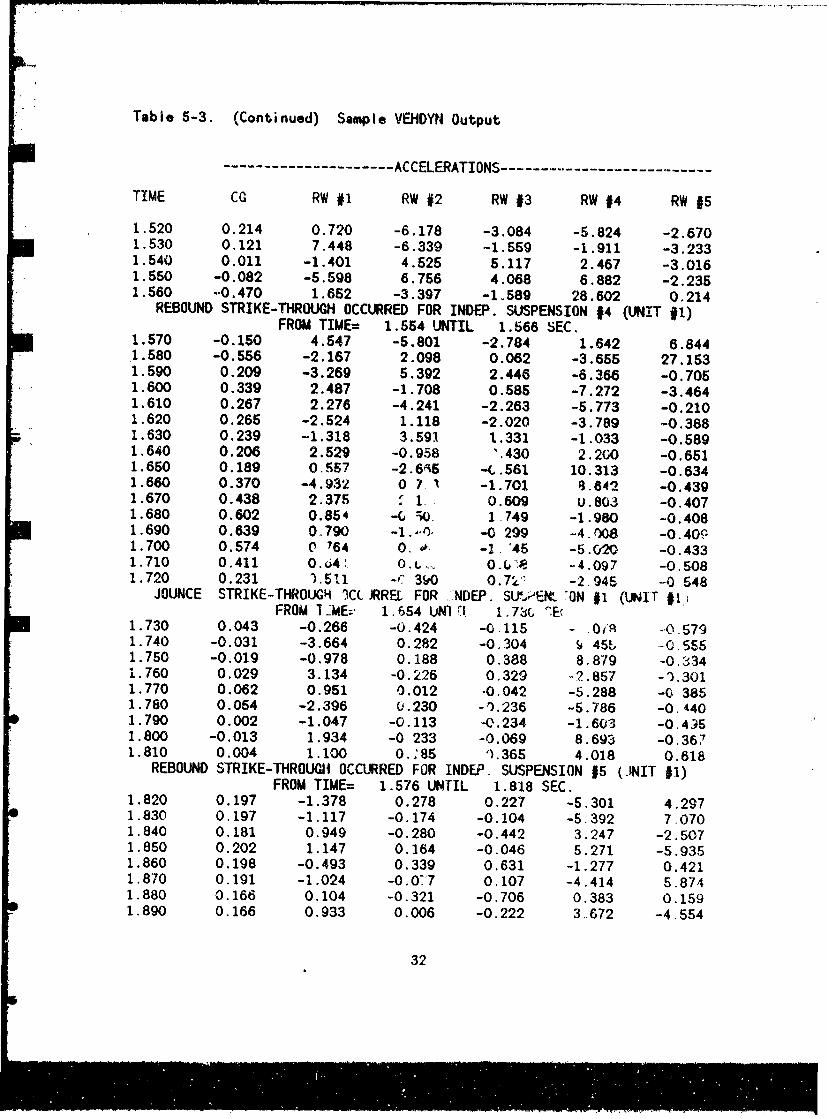
Table 5-3. (Continued) Sample VEHDYN Output
--------------------- ACCELERATIONS
TIME CG RW #1 RW #2 RW #3 RW #4 RW #5
1.520 0.214 0.720 -6.178 -3.084 -5.824 -2.6701.530 0.121 7.448 -6.339 -1.559 -1.911 -3.2331.540 0.011 -1.401 4.525 5.117 2.467 -3.0161.550 -0.082 -5.598 6.756 4.068 6.882 -2.2351.560 -0.470 1.652 -3.397 -1.589 28.602 0.214
REBOUND STRIKE-THROUGH OCCURRED FOR INDEP. SUSPENSION #4 (UNIT #1)FROM TIME= 1.554 UNTIL 1.566 SEC.
1.570 -0.150 4.547 -5.801 -2.784 1.642 6.8441.580 -0.556 -2.167 2.098 0.062 -3.655 27.1531.590 0.209 -3.269 5.392 2.446 -6.366 -0.7051.600 0.339 2.487 -1.708 0.585 -7.272 -3.4641.610 0.267 2.276 -4.241 -2.263 -5.773 -0.2101.620 0.265 -2.524 1.118 -2.020 -3.789 -0.3881.630 0.239 -1.318 3.591 1.331 -1.033 -0.5891.640 0.206 2.529 -0.958 '.430 2.200 -0.6511.650 0.189 0.557 -2.6%5 --L.561 10.313 -0.6341.660 0.370 -4.932 0 7 1 -1.701 8.642 -0.4391.670 0.438 2.375 " 1.. 0.609 U.803 -0.4071.680 0.602 0.854 -0 -W) 1.749 -1.980 -0.4081.690 0.639 0.790 -1. -0 299 -4. %8 -0.4091.700 0.574 0 764 0. , -1. '45 -5.020 -0.4331.710 0.411 0. 64 !.. O.t, ,.- 0O- i ", -4.097 -0.5081.720 0.231 1.511 -' 3V0 0.7'4" -2 945 -0 548
JOUNCE STRIKE-THROUGH 3CC JRREL FOR ..'NDEP. SY,,r4N' 'ON #1 (UNIT #1.FROM I__'E-- 1.654 UNV ! 1. 73, -E
1.730 0.043 -0.266 -0.424 -04115 - 0jF -05791.740 -0.031 -3.664 0.282 -0.304 < 451 -0.5551.750 -0.019 -0.978 0.188 0.388 8,879 -0,3341.760 0.029 3.134 -0.226 0.329 -2.857 -').3011.770 0.062 0.951 0.012 -0.042 -5.288 -0 3851.780 0.054 -2.396 0.230 -1.236 -5.786 -0.4401.790 0.002 -1.047 -0.113 .-0.234 -1.603 -0.451.800 -0.013 1.934 -0 233 -0.069 8.693 -0.3671.810 0.004 1.100 0..85 1.365 4.018 0.618
REBOUND STRIKE-THROUGH OCCURRED FOR INDEP. SUSPENSION #5 (.JNIT #1)FROM TIME= 1.576 UNTIL 1.818 SEC.
1.820 0.197 -1.378 0.278 0.227 -5.301 4.2971.830 0,197 -1.117 -0.174 -0.104 -5.392 7.0701.840 0.181 0.949 -0.280 -0.442 3.247 -2.5071.850 0.202 1.147 0.164 -0.046 5.271 -5.9351.860 0.198 -0.493 0.339 0.631 -1.277 0.4211.870 0.191 -1.024 -0.0:7 0.107 -4.414 5.87.41.880 0.166 0.104 -0.321 -0.706 0.383 0.1591.890 0.166 0.933 0.006 -0.222 3-672 -4.554
32

!,
Table 5-3. (Continued) Sample VEHDYN Output
--------------------- ACCELERATIONS-----------------------
TIME CG RW #1 RW #2 RW #3 RW #4 RW #5
1.900 0.147 0.282 0.322 0.752 0.655 -0.9411.910 0.129 -0.604 0.109 0.385 -2.800 4.0901.920 0.101 -0.475 -0.253 -0.666 -0.743 0.9931.930 0.087 0.272 -0.195 -0.519 1.873 -3.2321.940 0.060 0.554 0.165 0.544 1.044 -1.1421.950 0.035 0.123 0.265 0.629 -1.351 2.8201.960 0.006 -0.313 -0.033 -0.355 -0.692 1.0491.970 -0.015 -0.292 -0.268 -0.661 0.707 -2.2571.980 -0.062 0.103 -0.111 0.142 0.508 -0.1601.990 -0.071 0.469 0.199 0.619 -0.312 1.0022.000 -0.107 0.535 0.233 0.044 -0.100 0.6372.010 -0.134 0.918 0.010 -0.505 0.125 -0.7962.020 -0.188 1.245 -0.174 -0.201 0.005 0.1262.030 -0.179 -0.225 -0.048 0.352 -0.034 0.1202.040 -0.201 -0.584 0.120 0.272 -0.008 3.0282.045 -0.215 -0.604 0.124 0.024 -0.005 0.002
THERE WERE 8 REBOUND AND 2 JOUNCE SPRING STRIKE-THROUGHS DURING THISEVENT. TERRAIN-NEGOTIATION PHASE COMPLETED.
33

L 2-
A-
TIM
Fiur 5-.o 1A iuainC epnefr83Ic btcea
0. mph 15
34

4
A C/C 3-
0 - --
0 510 15
VEHICLE SPEED /MPH
Figure 5-10. M113A1 APG Test and Simulation Comparison, CG Response to8-Inch Obstacle
35

4-
ACC 3-/EL/
9 2/S/
0-
0 5 10 15VEHICLE SPEED /MPH
Figure 5-11. M113A1 APG Test and Simulation Comparison, CG Response to10-Inch Obstacle
36

5 //
4-
/AA /C 3E L// / /G 2-/
0 - I0 2 4 6 8 10 12 14
VEHICLE SPEED /MPH
Figure 5-12. M113A1 APG Test and Simulation Comparison, Driver's SeatResponse to 8-Inch Obstacle
37
5---
4-
A
Cc 3-,
CEL/
G79g 2-s /
1
0 - I ' I p I ' I ' I ' I ' . . .. '
0 1 2 3 4 5 6 7 8 9 10
VEHICLE SPEED /MPH
Figure 5-13. M113A1 APG Tast and Simulation Comparison, Driver's SeatResponse to 10-Inch Obstacle
38
WuNSON CURSE WOODEN BLOCKCS DIRECTION Of TPAVEL7
Figure 5-14. Test Obstacles for FMC/Hughes Tests
39
(a) Plan View
(b) Side Elevation View
Figure 5.-15. M113 Accelerometer Locations for FMC/Hughes Tests
40

35-
30-
25-
Ac
E 20-
15-
/ 15-
I10 100 1000
FRETOUENCY /HZ
Figure 5-16. M113A1 FMC/Hughes Test and Simulation Comparison, Point AResponse
41

30-
25-
E 20-
/ 15-
10
1!0 100 1000
FREQUENCY /HZ
Figure 5-17. M113A1 FMC/Hughes Test znd Simulation Comparison, Point DResponse
42
center of gravity instead of the locations "A" and 'DO, so the compari-son is not direct. This comparison was made using the most nearlycomparable results from simulations that were made for other purposes,and would have been refined if these preliminary comparisons, and thosewith the APG and WES tests, had indicated it would be useful.
The detailed comparisons discussed in this section help to substantiatethe conclusion referred to in the overview above, namely, that theapplication of simple multipliers to simulation results to providedesign criteria is not feasible--suggesting that a combination of acomprehensive data base of procurement specifications, test and opera-tional data, valid simulations, and a technical design guide (basedthereon) are needed to orovide the required design tools.
5.3. Design Criteria Implications
The findings of this investigation have important design criteriaimplications for military vehicle systems. This section elaborates onthese implications.
The single most important implication is that meaningful vehicle designcriteria must be based on component natural frequency because the rangeof g-loads is impractically large to be equally applied to all compo-nents. This approach has been used for some years for items trans-ported by vehicles, but the direct and explicit application to thevehicles themselves has not been systematically done. To a limitedaxtent, these criteria have been provided in MIL-STD-810 (EnvironmentalTest Methods and Engineering Guidelines), as illustrated in Figure5-18. The g-levels shown in this figure are to be used "if measureddata is not available.' Results of this investigation indicate it isimperative that test data be used. This requires a compilation andengineering screening of available test data and the development ofprocedures for their use in the development of design criteria.
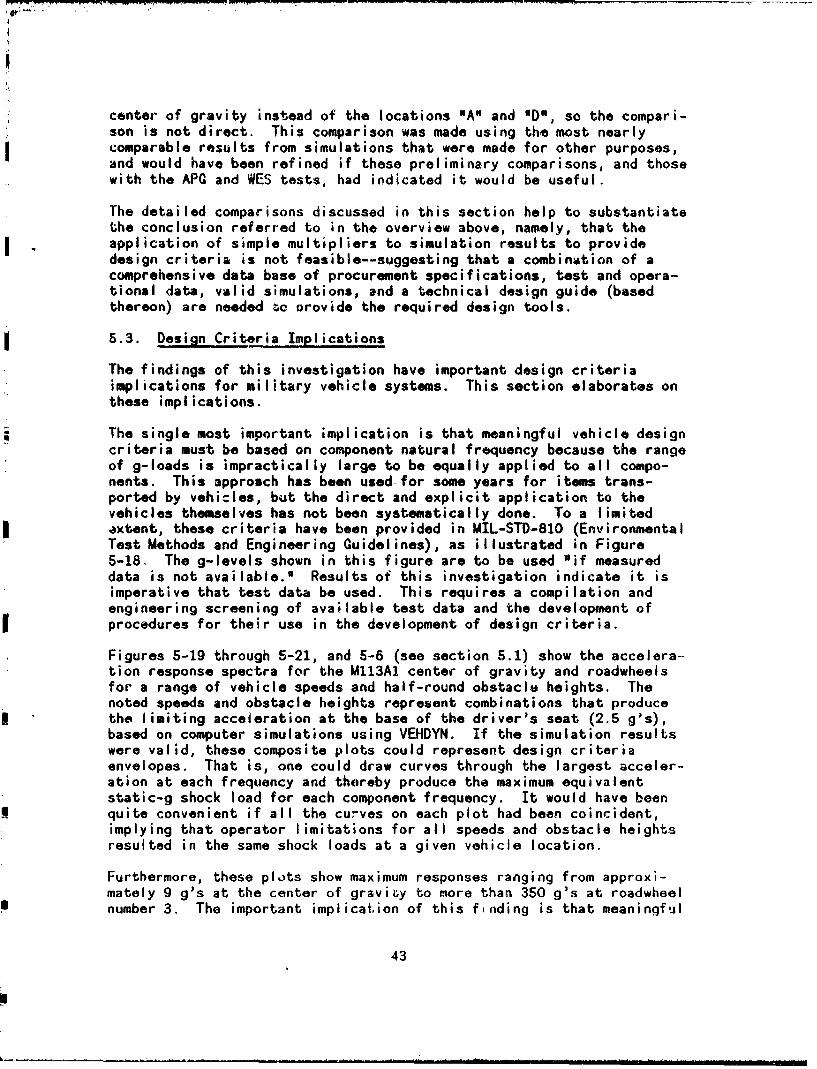
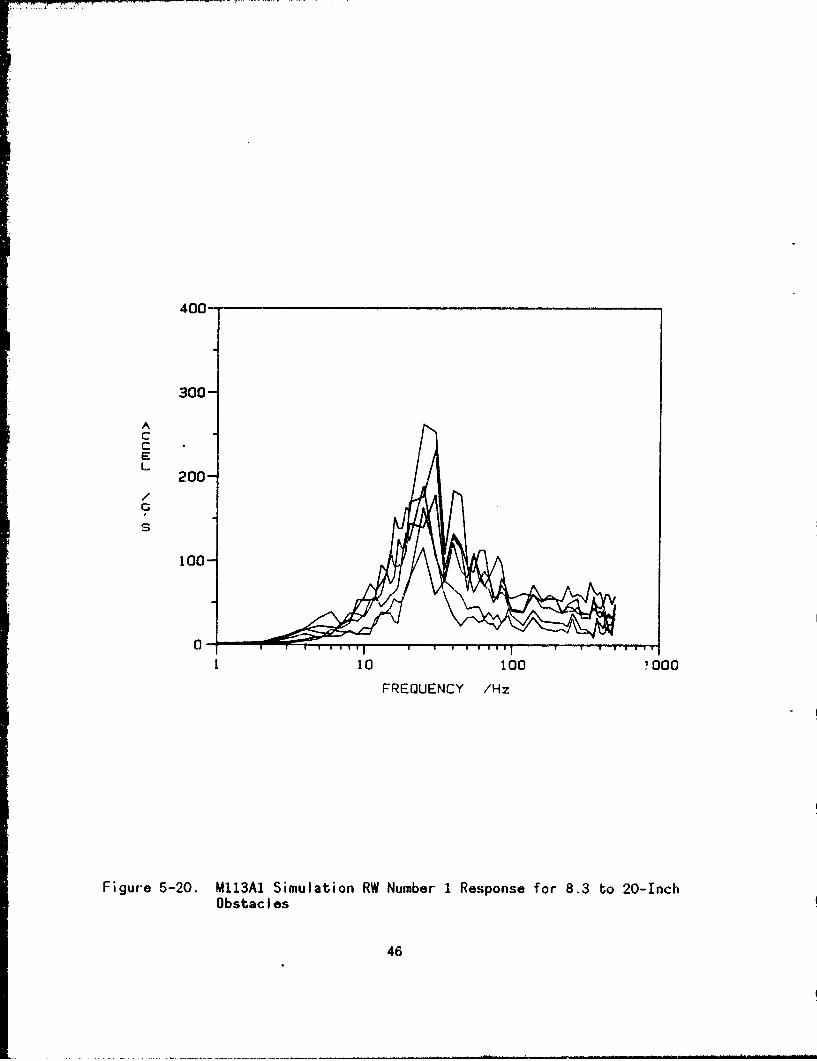
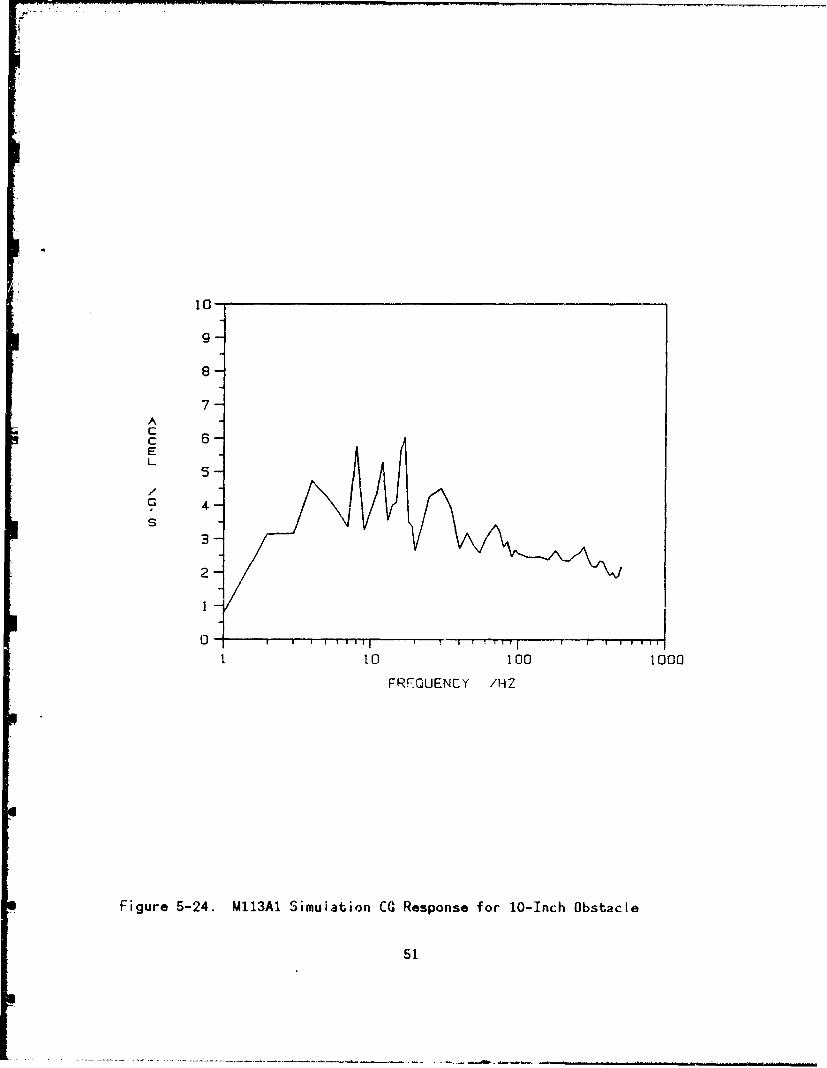
Figures 5-19 through 5-21, and 5-6 (see section 5.1) show the accelera--tion response spectra for the M113A1 center of gravity and roadwheelsfor a range of vehicle speeds and half-round obstacle heights. Thenoted speeds and obstacle heights represent combinations that producethe limiting acceieration at the base of the driver's seat (2.5 g's),based on computer simulations using VEHDYN. If the simulation resultswere valid, these composite plots could represent design criteriaenvelopes. That is, one could draw curves through the largest acceler-ation at each frequency and thereby produce the maximum equivalentstatic-g shock load for each component frequency. It would have beenquite convenient if all the curves on each plot had been coincident,implying that operator limitations for all speeds and obstacle heightsresulted in the same shock loads at a given vehicle location.
Furthermore, these plots show maximum responses ranging from approxi-mately § g's at the center of graviry to more than 350 g's at roadwheelnumber 3. The important implication of this finding is that meaningful
43

100__ _ --
90 -
80 -1- ' I• 7- 80 __ _ - - -rsh : : T ____oud ~un=.
60/
-50 -
__________ tFunctional Test For Ground Equipment
0 & Crash Haad Tet For Flight Equipment
II
~'30
0 _____6 botv Functional Test For Fligt Euipment
0_____20.4 o 00o
10 20 30 4o 50 60 7080 100 200 300 400 500600 000 200090 700 900
Frequency (Hz)
(a) Test Accelerations Versus Frequency
TEST PEAK CROSS OVERPROCEDURE ACCELERATION TE FREQUENCY
Functional TestFor Flight Equipment 20 gl.t 6-9 ms 45 Hz
Functional. TestFor Ground Equipment 40 g's 6-9 m3 45 Hz
Crash Hazard Te3,For Flight Equipment 40 g's 6-9 ms 45 Hz
Crash Hazard TestFor Ground Equipment 75 g's 3.5-5 m3 80 Hz
(b) Test Requirements for Specific Procedures
Figure 5-18. Excerpt from MIL-STD-810D
44

10-
9-
8-
7-
CC 6-EL
5
C 4-
3-
2-
01 1 w l
110 100 1000
FREQUENCY /HZ
Figure 5-19. M113A1 Simulation CG Response for 8.3 to 20-InchObstacles
45
400-
300-
ACCEI-)
200-/c
S
100-
10 100 ' 000
FREQUENCY /Hz
Figure 5-20. M113A1 Simulation RW Number 1 Response for 8.3 to 20-InchObstac I es
46
400-
300
AC
E
200/
S
100-
10 100 1000
FREQUENCY /HZ
Figure 5-21. M113AI Simulation RW Number 3 Response for 8.3 to 20-InchObstacles
47

design criteria must be related to both frequency and vehicle location.Note that Figura 5-21 shows accelerations in excess of 350 g's at road-wheel number 3 for components having natural frequencies near 25 hertz.In general, this would indicate to a designer that the component shouldbe rigidly mounted to the axle so the component would have a naturalfrequency in excess of 500, thus having a design load of less than 25g)s instead of more than 350 g's.
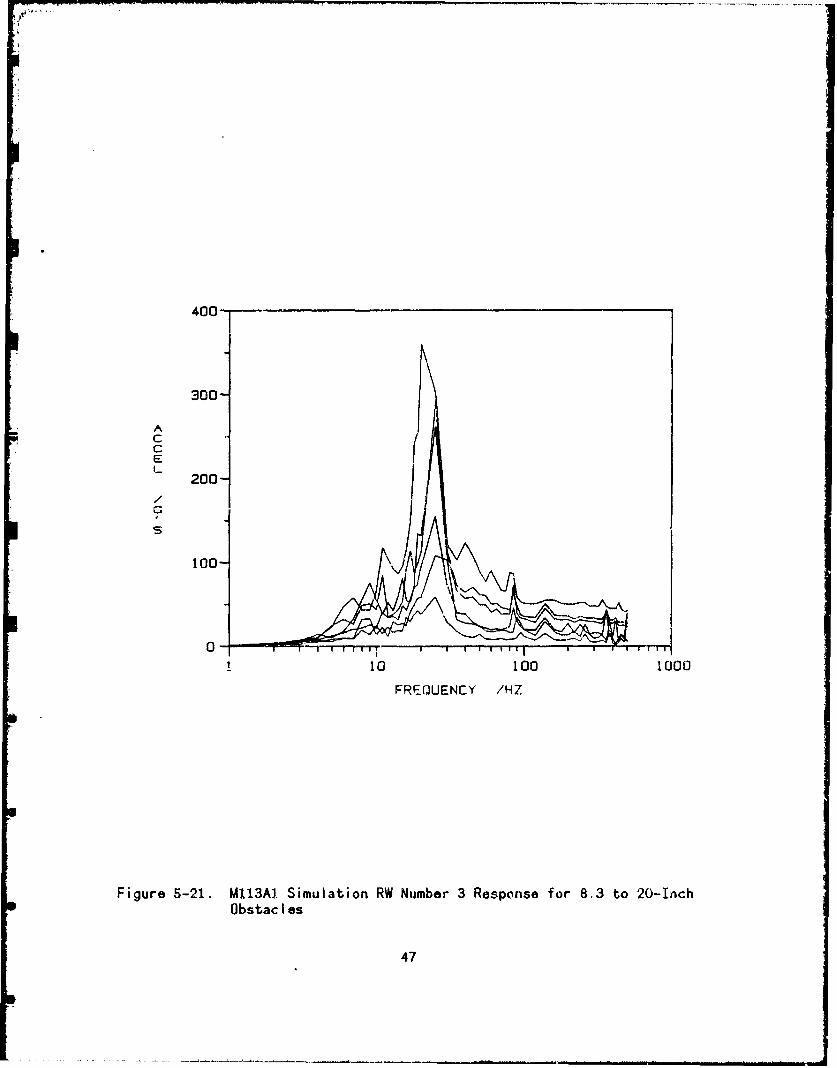
Plots of the individual curves from Figures 5-19 (center of gravity)and 5-20 (roadwheel number 1) are shown in Figures 5-22 through 5-27,
and 5-28 through 5-33, respectively, in order to better show theirdifferences.
In much of the literature, design criteria appear to be based on pastdesigns or 'referencem vehicles. The usefulness of this approach canbe readily seen from the preceding discussion. The use of "reference"designs could be greatly facilitated by the development of the database alluded to earlier; it would enable virtually any designer toselect his "reference" from a greater population and to have access tovalidated detailed design and test data.
In addition to the implications of the importance of relating designcriteria to frequency and vehicle location, there are two other majorimplications: 1) Practical design criteria cannot be specified tocover all likely vehicle conditions, and 2) Special efforts arerequired for development of design loads in the transverse and longi-tudinal directions, since only vertical load conditions are availablefrom current operational/mobility considerations. Because of theseractors, a more reasonable approach involves development and main-
4enance of the previously described data base and the design criteria,evelooment toois These tools could be used to tailor the design.... era for a Pa-ticular application, using the best data available,
a icr wokilc come from this comprehensive and validated engineering data
.es _ , erra Development - A Practical Approach
k .. .i >b act ve of the approach described in this section is toprc. do a %*&eis for determining vehicle input loads suitable for designatr( .esigr -a.idat'oo -f vehicle frames and suspension systems.
Stipp.lning objectives for the overall objective are bst. defined interms of their associated end products: 1) Vehicle Design Load DataBase. 2) Vehicle Technical Design Guide, 3) Simulation Reconuiendations,aril 4) Test Plan Outline. This approach would develop a data base foruse in design which is based on operational requirements, previouslyused design criteria, procurement specifications, QA requirements, andtest data. In conjunction with the data base development, a technicaldesign guide would be prepared which would enable the selection and/ordetermination of suitable design standards for particular vehicle sus-pension systems and frames, in terms of loads (as multiples of theacceleration of gravity--Kg's"), as a function of vehicle type,
48

tO-
a-
ACC 6EL
3-
2-
1 10 100 1000
FREQUENCY /HZ
Figure 5-22. M113A1 Simulation CG Response for 8.3-Inch Obstacle
49
8-
7-ACCE
5 -
3
2-
1-
FRFEQUENCY /HZ
Figure 5-23. M113A1 Simulation CG Response for 9-Inch Obstacle
5o
10-
9
8-
7ACC 6EL
5/-
C o 4-
S
3
2 -
1
0 1 1 1" 1 1"l' w i ill
o10 100 1000
FRFQUENCY /HZ
Figure 5-24. M113A1 Simulation CG Response for 10-Inch Obstacle
51

10-
9-
8-
7-ACCEL
4-
25

10-
8
7ACC 6E
L 5 -
0 43-2 -
1 10 100 1000
FREQUENCY /HZ
Finure 5-26. M113A1 Simulla.inn CG Re.-;ponse for i6-Inch Obstacle
53

9 -
7-A
C 6-E
5-
4S
3-
2-
1t1 100 1000
FREQUENCY /HZ
Figure 5-27. Ml13A1 Simulation CG Response for 20-Inch Obstacle
54

400-
300-
AccEL
200-/C
100-
0-1 10 100 1000
FREQUENCY /Hz
Figure 5-28. M113AI Simulation RW Number 1 Response for 8.3-InchObstacle
55

400j
300-
E
200-/°p CFS
100
0 1 1 1 t I IT I I I I I I di
1 10 100 1000
FP ..UENCY /Hz
Figure 5-29. M113A1 Simulation RW Number 1 Response for 9-InchObstacle
56

400-
300-
ACcEL
200-/
100-
0 T IOO IOO0
1 10 100 1000
FREQUENCY /Hz
Figure 5-30. M113A1 Simulation RW Number 1 Response for 10-InchObstacle
57

400-
300-
ACCEL
200
S
too-
10 100 1000
FREQUENCY /Hz
Figure 5-31. M113A1 Simulation RW Number I Response for 12.3-Inch
Obstac Ie
58

400-
300
ACCEL
200-/
S
100-
0- fill1 10 100 1000
FREQUENCY /Hz
Figure 5-32. M113A1 Simulation RW NL'nber 1 Response for 16-InchObstacle
59

400-
300-
AC
E
200-
100-
0 -10t 100 1000
FREQUENCY /Hz
Figure 5-33. M113A1 Simulation RW Number 1 Response for 20-InchObstacle
60
terrain, speed, and component natural frequency. This technical designguide development would use available simulation models, and minormodifications thereto, to assure valid :haracterizations of availabledata and to reconciie ambiguities. The simulations used would beevaluated, and recommendations for their improvement should be made, interms of software development and vehicle system and/or model testing.
An overview of the defined approach is shown in Figure 5-34. This is adependency network and shows the logical relationships among thevarious WBS elements which are listed hierarchically in Figure F-35.This network is largely self-explanatory, but a couple of featuresshould be clarified. First, the broken line from WOS 2.4 to WBS 2.2indicates a "feedback" loop or iterative process. That is, implementedimprovements in any simulation models would be used in evaluating thetest data. Second, items marked with an asterisk are directly associ-ated with specific end products: Data Base, Technical Design Guide,Simulation Recommendations, and Test Plan Outline.
In what follows, the detailed approach is discussed in terms of theindividual WBS t-lements shown in Figures 5-34 and 5-35. The discussionis limited to tiose WBS elements that are not self-explanatory.
5.4.1. WBS Elent 1.1--Data Compilation. Design data would be com-piled mainly fr,. manufacturers rince 'he earlier work determinednothing signifi4ant can be found in the open literature. A partiallisting of manufacturers that should be contacted is shown in Table5-4. This should be supplemented, as appropriate, using informationfrom Army procurement operations. Specific manufacturer contactsshould be sought from the respective Army program management offices.Initial contacts should be made by telephone and these should befollowed by mailings of questionnaires that are to be filled out bymanufacturer's personnel.
The two principal sources of test data are expected to be the CSTA atthe Aberdeen Proving Ground in Aberdeen, Maryland; and the WES inVicksburg, Mississippi. Relevant contacts were made at these organiza-tions as part of the Phase I project, and it has been determined thatthey have many of the data needed to build a useful data base.
The same manufacturers contacted for design data should be queriedregarding test data, and the emphasis should be on those manufacturerswho are known, from reports in the literature, to have performed rele-vant testing. During Phase I, limited quantities of input data werefound in the literature in papers written by contractor personnel, butthese publications were generally lacking important details that wouldbe required prior to inclusion in the planned data base.
Procurement specifications should be obtained for purposes of relatingthe specifications therein to design and operational requirements, sothese can be compared with test plans and tests for the same vehicles.
61

-7~
Figure 5-34. Overall Approach
62

1.0 Data Bass Development and Implementation1.1 Date Compilation
1.1.1 Design Data1.1.2 Test Data
1.1.2.1 TECOM/CSTA1.1.2.2 COE/WES1.1.2.3 Manufacturers1.1.2.4 Literature1.1.2.6 Other
1.1.3 Operational Requirements1.1.4 Procurement Specifications1.1.6 QA Requirements
1.2 Data Analysis and Evaluation1.2.1 Vehicle Types and Applications Priorities Establishment1.2.2 Data Quality Definitions Est abllshment1.2.3 Data Consistency Evaluation1.2.4 Shock and Vibration Spectra Development1.2.5 Identification of Doat Uncertainties
1.3 Data Base Developmt1.3.1 UNIX (AW) Data Base Structure Definition1.3.2 ]WORMIX Date Base Structure Definition1.3.3 Expert Shell Evaluation and Selection
1.4 Data Base IMplamentatlon1.4.1 Implementation Plan Development1.4.2 Assistance in Initial Government Site Implementation
2.0 Simulation Evaluation, Utilization, and Development2.1 Vehicle Simulation Software Survey, U.S. and Foreign2.2 Simulations Utilization and Evaluation2.3 Identification of Needed Improvemants in Simulations2,4 Simulations Improvements Implementation
3.0 Development of Methodology for Determining Design Standards for VehicleInput Loads3.1 Vehicle Technical Design Guide Development
3.1.1 Guide Outline Development3.1.2 Development of Simplified Design Standard Guidelines3.1.3 Document Preparation
3.2 Use of Data Baeo (Selection of Reference Vehicle, etc.)3.3 Use of Simulations
4.0 Preliminary Teat Plan Development4.1 Evaluation of Potential Advantages of Improved Vehicle
Characteristics for Simulations4.2 Plan Outline for Incrementally Obtaining Needed Data
4.2.1 Full-Scale Vehicle(s)4.2.2 Subscale Vehicle Model(s)
6.0 Reports6.1 Quarterly6.2 Draft Final6.3 Final
Figure 5-35. Work Breakdown Structure (WBS)
63

Table 5-4. Partial List of Manufacturers
The LTV Corp. General Motors Corp. (GMC)AM General Division Military Vehicles OperationLivonia, MI Indianapolis, IN
Bowen-McLaughlin-York Co. (BMY) Holmes InternationalA Division of Harsco Corporation Chattanooga, TNYork, PA
Napco International, Inc.Cadillac Gage Co. Tank Automotive SystemsWarren, MI Minneapolis, MN
Evans Industries, Inc. Oshkosh Truck Corp.Mineral Wells, TX Oshkosh, WI
FMC Corp. Twin Bay Industries, Inc.Ordnance Division Elk Rapids, MISanta Clara, CA
Vehicle Systems DevelopmentGeneral Automotive Int'l Corp. Corp.Ann Arbor, MI Upland, CA
General Dynamics Corp.Land Systems DivisionWarren, MI
64

5.4.2. WBS Element 1.2--Data Analysis and Evaluation. A general anal.-ysis of the data should be performed to determine the form in which itshould be incorporated in the data base. It would not be practical, oradvisable, to incorporate all relevant test data into the data base otthis time. That is, the initial data base should include a combinationof directly usable data and extensive references and indexes to otherdata sources to enable obtaining additional detailed data when appro-priate. The analyses should also be directed at making assessments ofthe quality of the data, both in terms of its reliability and thecertainty of the test conditions. The reliability of the data shouldbe assessed, in part, using eN,.stia s;j'jlntion models and minormodifications thereof.
The data base development .;,ouJ i: A. rvning and evaluating thVdata to make an assessment 4 it . qua;,ty, i.e., the developme-t neecsto utilize "knowledge enginee,-:np .,v-.hods. A useful data bas4 canno.simply be an indiscriminate com:.lation of a&h /tant data. Idwal.ythe data should initially be given qtality ta g, enabling a poten-tial user to use the data if .iiay 1it-d infoi-ation is available, butto do so with an indication if the ,ja;'Y ,** -hs data as provided by aquality rating and brief re:,ion;Ie f c- bi . Eventually, inselected instances, it could k. ,ppriY9riat: to :iqrade given data bymaking *corrections* based on u;her d~-aid ,i' e-mulations, etc. mhedirectly usable test data sho;id ., iai.-.,td in the data bae in aform that gives the frequency dependence of te design loads, usingshock spectra and power-spectral-density methods. This will requirethat all of the data be analyzed and that some of it be "prociteANbefore incorporation in the data base.
Analysis of the operational requirements, procurement specifications,and quality assurance requirements should center on the extraction andsummarization of the relevant design load data.
5.4.3. WBS Element 1.3--Data Base Development. Data base developmentshould emphasize content vice structure, but the data base must havethe flexibility to introduce additional structure at a future date.This approach would assure that resources are used mainly for theacquisition and processing of usable information rather than 'softwaredevelopment.'
Software and operating systems exist within the Government that arecompatibl, with this approach. The data base development would bebased on the use of software that runs on the UNIX operating systemwhich is widely available within the Government on systems ranging frommicrocomputers to large supercomputers (Cray's, etc.). More specifi-cally, the defined approach is based on initial development thatutilizes the UNIX higher-level programming language AWK because of itsflexibility and simplicity. As a little more structire becomes advis-able, the AWK data base can readily be transformed into a relationaldata base using the indicated INFORMIX software which is available forUNIX and MS-DOS microcomputers, Cray supercomputers and a variety of
65

hardware systems ranking between these in capabilities. This approachwould provide an immediately usable data base with a minimum of soft-ware effort, while having inherent growth potential in structure,usability, and automation.
5.4.4. WBS Element 1.4--Data Base Implementation. A plan should bedeveloped for implementation of this data base at various U.S. Armyuser sites, which should include TACOM, the Test and EvaluationCommand/Combat Systems Test Activity (TECOM/CSTA), the Army MaterielCommand/Army Materiel Systems Analysis Activity (AMC/AMSAA), and theArmy Corps of Engineers/Waterways Experiment Station (COE/WES), etc.This list should be updated based on discussions with the cognizantTACOM personnel. The plan should also provide for the future mainte-nance and upgrading of the data base system. The plan should includean approach that provides for growth from the relational data baseINFORMIX to the use of an 'Expert Shell,' then to a "full ExpertSystem," and perhaps eventually to a state-of-the-art "Artificial-Intelligence* system.
An initial implementation installation should be made at TACOM.Instructions for broader implementation should be included in the finalreport, and magnetic-modium copies of data base materials should bedelivered to facilitate these implementations.
5.4.5. WBS Element 2.0--Simulation Evaluation, Utilization, and Devel-opment. A key source of potential benefit in the development of designcriteria/standard information is vehicle simulation. A greater inte-gration of ongoing design, simulation, analysis, and testing effortswithin TACOM and other US. Army activities could provide immeasurablebenefits in this area. Existing simulation dynamic models, and minormodifications of them, should be used in evaluating test data beforeincorporation into the data base. This effort would also have theobjective of providing feedback to the simulation developers, withinthe Army and industry, to assist them in refining their models.Vehicle simulation is on the threshold of being able to provide greatbenefits in terms of faster development of higher-quality products atpotentially lower costs, and the integration of these efforts with thedevelopment of the data base is an important ingredient of the definedapproach.
5.4.6. WBS Element 3.1--Vehicle Technical Design Guide Development.The vehicle Technical Design Guide should be an important and usefulsupplement to the data base. The design guide would be directly usableby design personnel for many applications in which accessing the database would not be necessary. It could also be a good guide to thedesigner in his determination of when and how to access the data base.In addition, the concurrent development of such a design guide documentand the data base can take maximum advantage of the thinking that goesinto the data base development, and would, in itself, facilitateeffective data base development.
66

5.4.7. WBS Elements 3.2 and 3.3--Use of Data Base and Simulations.Instructions in the use Jf the data base and the recommended simula-tions, for use in determine vehicle input design loads for a givenapplication, should be included in the Final Report. The instructionsshould include step-by-step illustrative examples.
5.48. WBS Element 4.0--Preliminary Test Plan Development. A pre-liminary test plan should be prepared for vehicle testing which pro-vides dynamic characteristics for simulation. This p;an shou'd coverone or more selected vehicles. Review of the literature, NKF experi-ence with dynamic simulations, and comparisons of siiulati.n and testdata, suggest that significant improvements in simulition realism canbe achieved (using existing dynamic model formulatior f improvedvehicle characteristics could be made available. An micalapproach to obtaining these data could consist of Iii besting offull-scale vehicles complemented by more extensive toi;L_:ag of a sub-scale model or models. These approaches should be ccnsidered in thetest plan development.
5.4.9. WBS Element 5.0--Reports. Progress reports should be preparedregularly which briefly summarize the technical progress and status ofthe effort.
A draft final report should be prepared approximately 30 days beforethe conclusion of the effort, and the Final Report itself should beprepared within 2 weeks after receipt of reviewer comments on the draftreport. A draft copy of the Technical Design Guide and a Data BaseDescription should be attachments to the draft final report.
67

j
"9
I
~1
I
73
I
I
68
I

LI77 OF REFERENCES
1 Harris, Cyril M., et al. ad., NShock and Vibration Hardbook,M secondedition, McGraw-Hla _76.
2 Creighton, D. C., "Revised Vhicie Dynamics Module: User's Guidefor Computer Program ViLFiDYN II," Department of the Army Water-ways Experiment Station, Vicksburg Mississippi, May 1986.
3 Pomonik, G. M., et al., "Dynamic Environment ,;f M-113 Armored Per-sonnel Carrier,' Shock and Vibration Bulletin No. 35 Part 5,February 1966.
4 Harris, Cyril M., et al. ed., "Shock and Vibration Handbook," secondedition, McGraw-Hill, 1976.
69

70

DIS'.PTI'I3N LIST
Cop es
Command%:- 2Defense )ecqnical Information CenterBldg. 5, Cameron StationA'"n DDAC£Alexaniria, VA 22304-990
Mz iager 2Defetse Logistics Stiies Information ExchangeATTN, AMXMC-L'Fort Le", VA 23801-6044
Comander 2U.S. Army Tank-Auto&mtive CommandATTN: AMSTA-DDLWarren, MI 48397-5000
CommanderU.S. Army Tank-Automotive CommandATTN: AMSTA-CF (Mr. G. Orlicki)Warren, MI 48397-5000
CommanderU.S. Army Tank-Automotive CommandATTN: AMCPM-ABMSWarren, MI 48397-5000
CommanderU.S. Army Tank-Automotive CommandATTN: AMCPM-BFVSWarren, MI 48397-5000
CommanderU.S. Army Tank-Automotive CommandATTN: AMCPM-M60Warren, MI 48397-5000
CommanderU.S. Army Tank-Automotive CommandATTN: AMCPM-MI13Warren, MI 48397-5000
CommanderU.S. Army Tank-Automotive CommandATTN: AMCPM-MgWarren, MI 48397-5000
Dist-1

CommanderU.S. Army Tank-Automotive CommandATTN: AMCPM-FAASWarren, MI 48397-5000
CommanderU.S. Army Tank-Automotive CommandATTN: AMCPEO-CCV-SWarren, MI 48397-5000
CommanderU.S. Army Tank-Automotive CommandATTN: AMSTA-ZWarren, MI 48397-5000
CommanderU.S. Army Tank-Automotive CommandATTN: AMCPM-TVLWarren, MI 48397-5000
CommanderU.S. Army Tank-Automotive CommandATTN: AMCPM-TVMWarren, MI 48397-5000
CommanderU.S. Army lank-Automotive CommandATTN: AMCPM-TVHWarren, MI 48397-5000
CommanderU.S. Army Tank-Automotive CommandPTTN. ASNC-TACWarren, MI 48397-5000
DirectorAMSAAATTN: AMXSY-MP (Mr. Cohen)Aberdeen Proving Ground, MD 21005-5071
Dist-2