Embed Size (px)
Citation preview

It’s Worse Than We Thought
Global Warming Prepared for Philazine by Philip Woodard – 2008 – all rights reserved ©

Free Template from www.brainybetty.com 2
Conservative Estimates
• Scientists are temperamentally conservative
• Almost all their original estimates about the effects of global warming have underplayed the actual measured consequences
• When their original estimates have been re-measured against actual changes, the effects have most often been more dire than they originally predicted

Free Template from www.brainybetty.com 3
NASA’s Dr. James Hansen
• One of the world's leading climate scientists warned in October 2008 that the EU and its international partners must urgently rethink their targets for cutting carbon dioxide3.1
• He says scientists have grossly underestimated the scale of the problem
• “The target we have all been aiming for is a disaster - a guaranteed disaster”
• Arctic Ice is melting 20 years ahead of schedule

Free Template from www.brainybetty.com 4
Effects Will Last for a 1000 Years
• A 2009 study found that changes in surface temperature, rainfall, and sea level are largely irreversible
• If carbon dioxide (CO2) emissions are stopped at around 450 ppm, the effects will last at least 1,000 years issues4.1

Free Template from www.brainybetty.com 5
Ocean Acidification
• Too much CO2 in the oceans leads to acidification; marine life starts to die
• This so-called 'tipping point' had been predicted to occur when atmospheric CO2 levels hit 550 parts per million, around the year 2060
• Current thinking has revised that tipping point to far lower atmospheric CO2 levels – around 450 ppm: the goal set by many scientists to try to attain.

Free Template from www.brainybetty.com 6
Two More Examples
• Nitrogen trifluoride, a green house gas that traps about 17,000 times more heat than carbon dioxide, wasn’t even counted in the 1997 Kyoto protocols6.1
– A gas from the manufacture of liquid crystal displays– 2006 estimate was 1,200 metric tons in the atmosphere– 2008 estimate was 5,400 metric tons in the atmosphere
• NASA scientist says melting ice will cause a 50 cm rise by 2100– Rate of ice loss from Greenland has tripled since 2004
Free Template from www.brainybetty.com 7
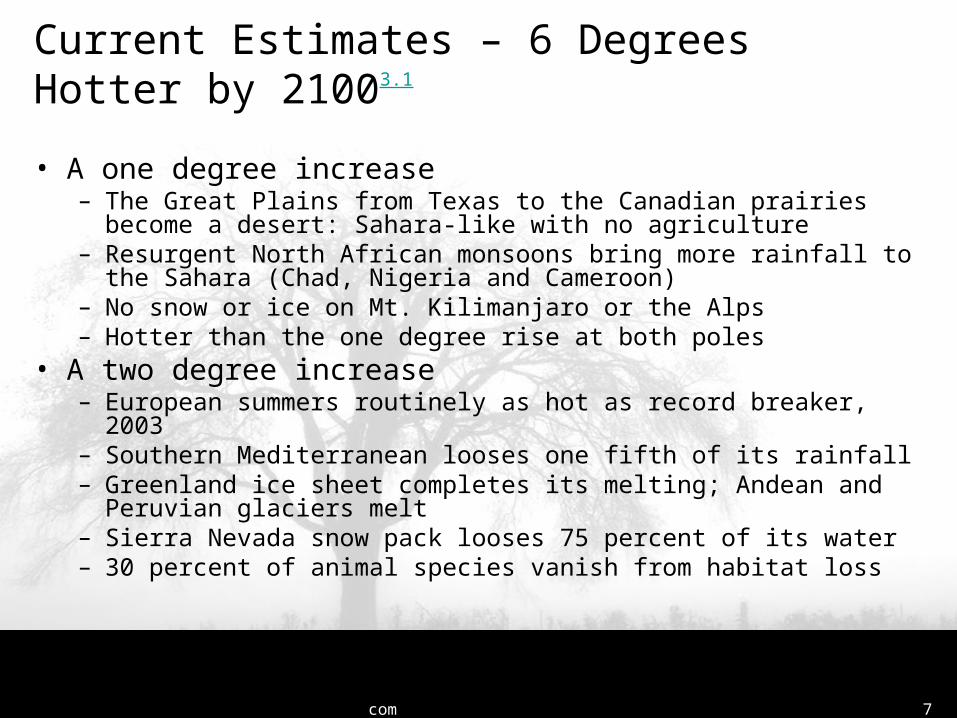
Current Estimates – 6 Degrees Hotter by 21003.1
• A one degree increase – The Great Plains from Texas to the Canadian prairies become a
desert: Sahara-like with no agriculture– Resurgent North African monsoons bring more rainfall to the Sahara
(Chad, Nigeria and Cameroon)– No snow or ice on Mt. Kilimanjaro or the Alps– Hotter than the one degree rise at both poles
• A two degree increase – European summers routinely as hot as record breaker, 2003– Southern Mediterranean looses one fifth of its rainfall– Greenland ice sheet completes its melting; Andean and Peruvian
glaciers melt– Sierra Nevada snow pack looses 75 percent of its water– 30 percent of animal species vanish from habitat loss

Free Template from www.brainybetty.com 8
Glaciers

Free Template from www.brainybetty.com 9
Current Estimates – 6 Degrees Hotter by 2100• A three degree increase
– Guaranteed if we don’t significantly reduce atmospheric carbon by 2018– Amazonian basin dries up – no longer a jungle but a desert
• This is a tipping point bringing about by itself another one degree rise– Much of the planet becomes uninhabitable – Southern Africa and Australia
are barren deserts• 100s of millions or billions of refugees migrate north looking for food• Winter flooding threatens low-lying Western European regions
• A four degree increase – Arctic and Siberian permafrosts melt
• Another tipping point bringing about another one degree rise all by itself – Italy, Spain, Greece and Turkey have Saharan like climates– Sea levels rise by between 9 and 88 cm (3.5 inches to 35 inches)
• A 36-inch increase in sea levels would swamp every city on the East Coast of the United States, from Miami to Boston

Free Template from www.brainybetty.com 10
Warming Forecasts
Free Template from www.brainybetty.com 11
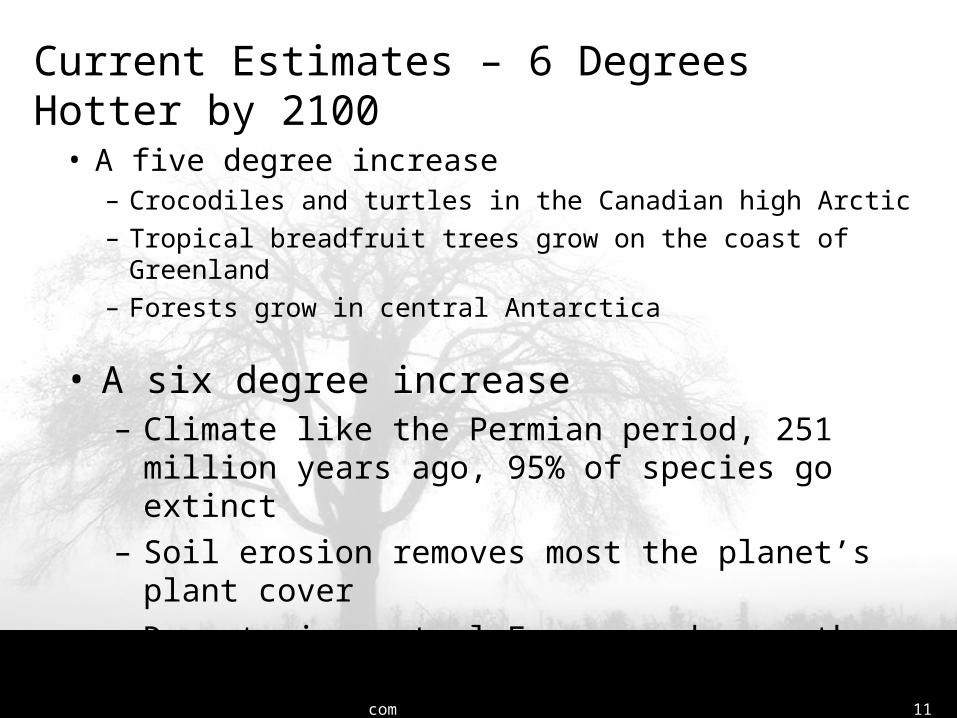
Current Estimates – 6 Degrees Hotter by 2100
• A six degree increase – Climate like the Permian period, 251 million years
ago, 95% of species go extinct– Soil erosion removes most the planet’s plant cover
– Deserts in central Europe and near the Arctic Circle
• A five degree increase – Crocodiles and turtles in the Canadian high Arctic– Tropical breadfruit trees grow on the coast of Greenland– Forests grow in central Antarctica

Free Template from www.brainybetty.com 12
Polar Ice Caps – The Big Deal
• Sea level rise: with 5,773,000 cubic miles of water in ice caps, glaciers, and permanent snow, a complete melt means the seas would rise about 230 feet
• Ocean desalinization: fresh water will make oceans less salty, changing ocean currents and atmospheric temperatures
• Species die off: Only the most adaptable of Arctic species will survive
• No ice means no reflection: darker colored ocean water will absorb more sunlight, further warming the Earth

Free Template from www.brainybetty.com 13
Glacier Melting Since 1970

Free Template from www.brainybetty.com 14
What We
Know for
Sure
• Global surface temperatures have increased 0.74 ± 0.18 °C (1.33 ± 0.32 °F) during the 100 years ending in 2005

Free Template from www.brainybetty.com 15
Global surface temperatures have spiked since the Industrial Revolution in 1800
Earth’s Temperature: Last 2000 Years
Free Template from www.brainybetty.com 16
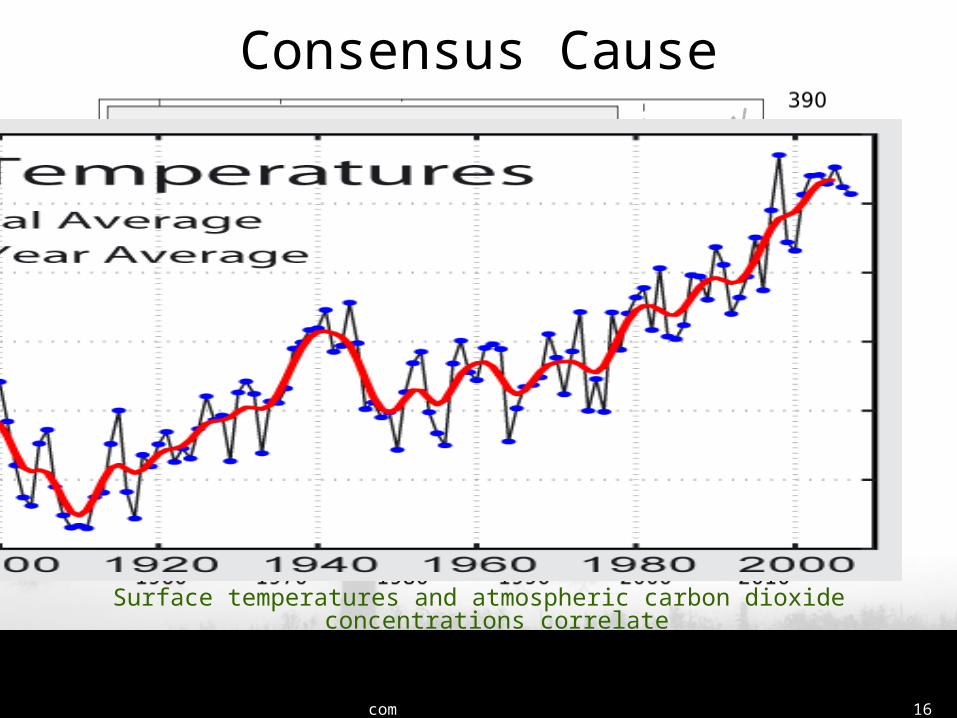
Surface temperatures and atmospheric carbon dioxide concentrations correlate
Consensus Cause
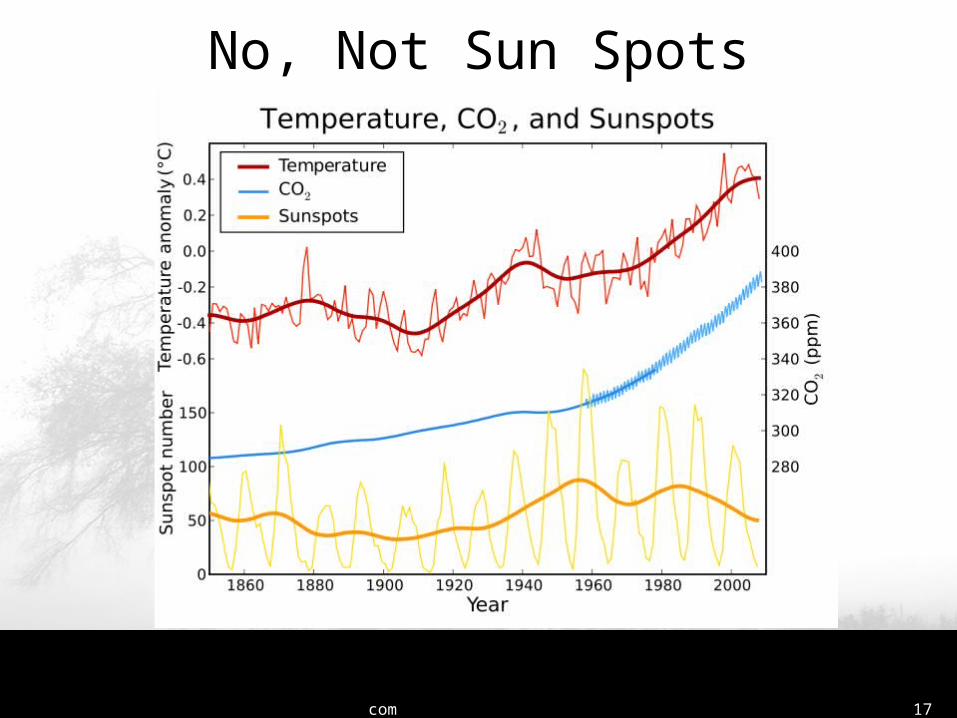
Free Template from www.brainybetty.com 17
No, Not Sun Spots

Free Template from www.brainybetty.com 18
Atmospheric Gases
• From 1750 to 2000 (about 250 years) a half-trillion tons of carbon were burned
• From 2000 to 2040 (about 40 years) another half trillion tons are scheduled to burn
Free Template from www.brainybetty.com 19
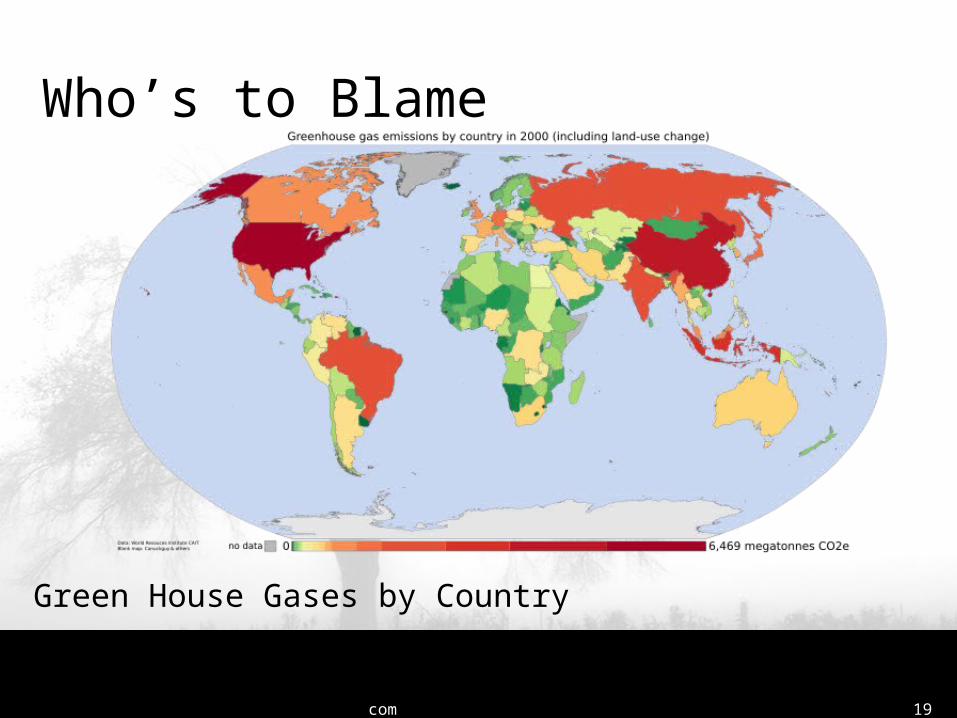
Who’s to Blame
Green House Gases by Country

Free Template from www.brainybetty.com 20
Current U.S. Energy Consumption
Free Template from www.brainybetty.com 21
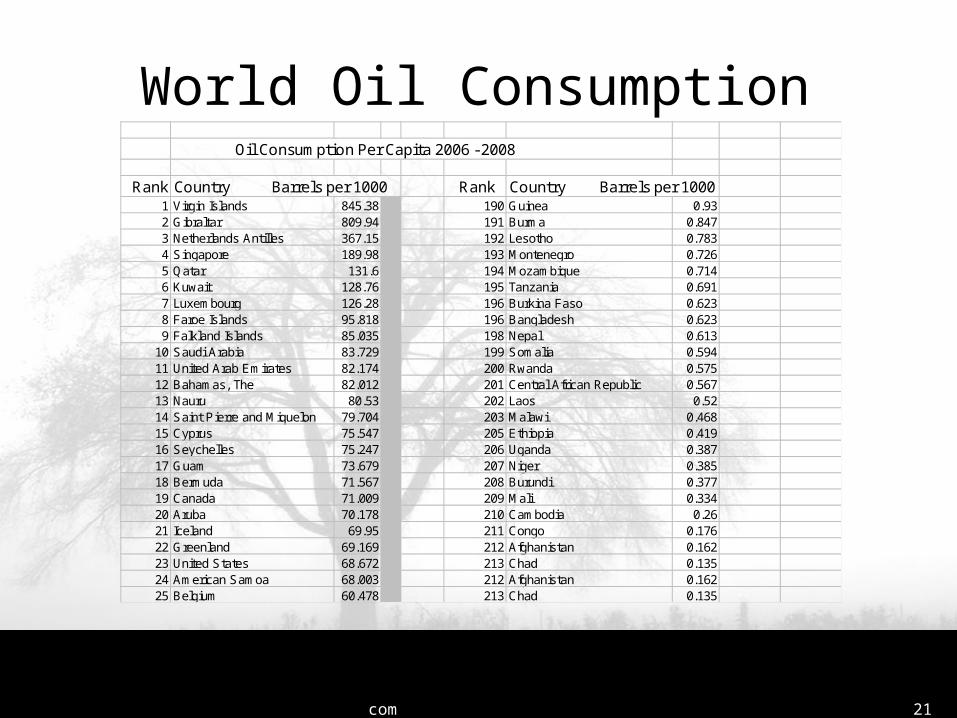
World Oil Consumption Oil Consumption Per Capita 2006 - 2008
Rank Country Barrels per 1000 Rank Country Barrels per 10001 Virgin Islands 845.38 190 Guinea 0.932 Gibraltar 809.94 191 Burma 0.8473 Netherlands Antilles 367.15 192 Lesotho 0.7834 Singapore 189.98 193 Montenegro 0.7265 Qatar 131.6 194 Mozambique 0.7146 Kuwait 128.76 195 Tanzania 0.6917 Luxembourg 126.28 196 Burkina Faso 0.6238 Faroe Islands 95.818 196 Bangladesh 0.6239 Falkland Islands 85.035 198 Nepal 0.613
10 Saudi Arabia 83.729 199 Somalia 0.59411 United Arab Emirates 82.174 200 Rwanda 0.57512 Bahamas, The 82.012 201 Central African Republic 0.56713 Nauru 80.53 202 Laos 0.5214 Saint Pierre and Miquelon 79.704 203 Malawi 0.46815 Cyprus 75.547 205 Ethiopia 0.41916 Seychelles 75.247 206 Uganda 0.38717 Guam 73.679 207 Niger 0.38518 Bermuda 71.567 208 Burundi 0.37719 Canada 71.009 209 Mali 0.33420 Aruba 70.178 210 Cambodia 0.2621 Iceland 69.95 211 Congo 0.17622 Greenland 69.169 212 Afghanistan 0.16223 United States 68.672 213 Chad 0.13524 American Samoa 68.003 212 Afghanistan 0.16225 Belgium 60.478 213 Chad 0.135
Free Template from www.brainybetty.com 22
What’s Happened by 2009 – Part One
• One in eight bird species, or 1,226 of almost 10,000 bird species, are at risk of extinction19.1
• 2007 marked highest ever summer temperatures in the Arctic -- 9◦ F or 5◦ C above historic averages
• 28 of Yosemite’s animal species are moving their range to higher elevations – 1600 feet higher
• 150,000 people, says the World Health Organization, die every year by climate-change-related issues19.2
• Greenland and Antarctic Ice sheets are melting• Terrestrial carbon is being released from the permafrost
regions• Methane hydrates are being released from coastal
sediments

Free Template from www.brainybetty.com 23
Temperature Changes
1900 - 200016.1

Free Template from www.brainybetty.com 24
Historic Draughts -- 2008

Free Template from www.brainybetty.com 25
What’s Happened by 2009 – Part Two
• Glaciers not at the North and South poles have decreased by 50% since the end of the 19th century17.1
• Summer lasts longer in the Northern hemisphere – just in the last five years17.2
– High temperatures in October are about 1 degree above their historic averages
– In September high temperatures are almost 2 degrees above their historic averages
• Precipitation is increasing, particularly at northern mid-high latitudes with much of the increase coming in more frequent heavy rainfall events

Free Template from www.brainybetty.com 26
Spruce Trees Break Thru Arctic Tundra

Free Template from www.brainybetty.com 27
What’s Happened by 2009 – Part Three
• Mean sea level has been rising at an average rate of 1.7 mm/year (plus or minus 0.5mm) over the past 100 years. Since 1993, sea has been rising 3.3 mm/year: doubling the average increase
• Average global temperatures have increased 1.8◦
F or 1◦ C over the past 100 years• Northern Hemisphere snow cover has remained
below average since 1987 and has decreased by about 10% since 1966
• Lake Chad, which supports 20 million people, has shrunk to 5% of its size in 1973

Free Template from www.brainybetty.com 28
Current Patterns of Warming

Free Template from www.brainybetty.com 29
What’s Happened by 2009 – Part Four
• The nine hottest years on record have all occurred in the last eleven years– The warmest year on record – 2005
• Inhabitants of some small and low island countries are abandoning their islands– Carteret Islands are off the coast of Bougainville, Papua New
Guinea. 2,600 people are forced to move
• Parts of Australia, China, the Middle East, Argentina, California, and Texas are experiencing droughts simultaneously
• In American south west, fire frequency is up by 400 percent and land burned is up by 650 percent since 1970 21.1

Free Template from www.brainybetty.com 30
Current Patterns of Warming
Free Template from www.brainybetty.com 31
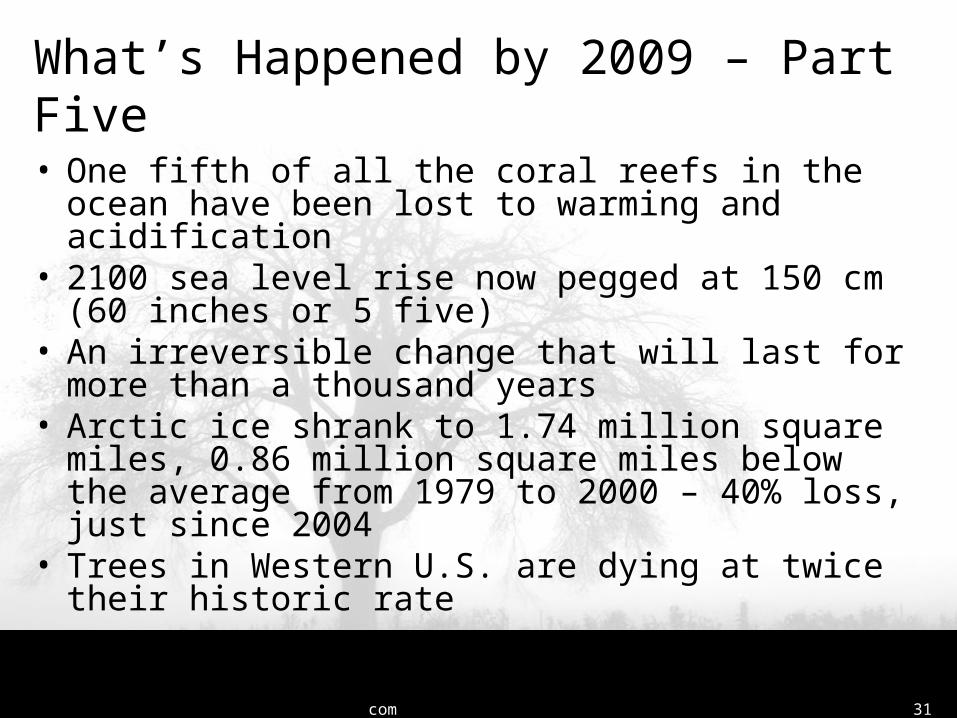
What’s Happened by 2009 – Part Five
• One fifth of all the coral reefs in the ocean have been lost to warming and acidification
• 2100 sea level rise now pegged at 150 cm (60 inches or 5 five)
• An irreversible change that will last for more than a thousand years
• Arctic ice shrank to 1.74 million square miles, 0.86 million square miles below the average from 1979 to 2000 – 40% loss, just since 2004
• Trees in Western U.S. are dying at twice their historic rate
Free Template from www.brainybetty.com 32
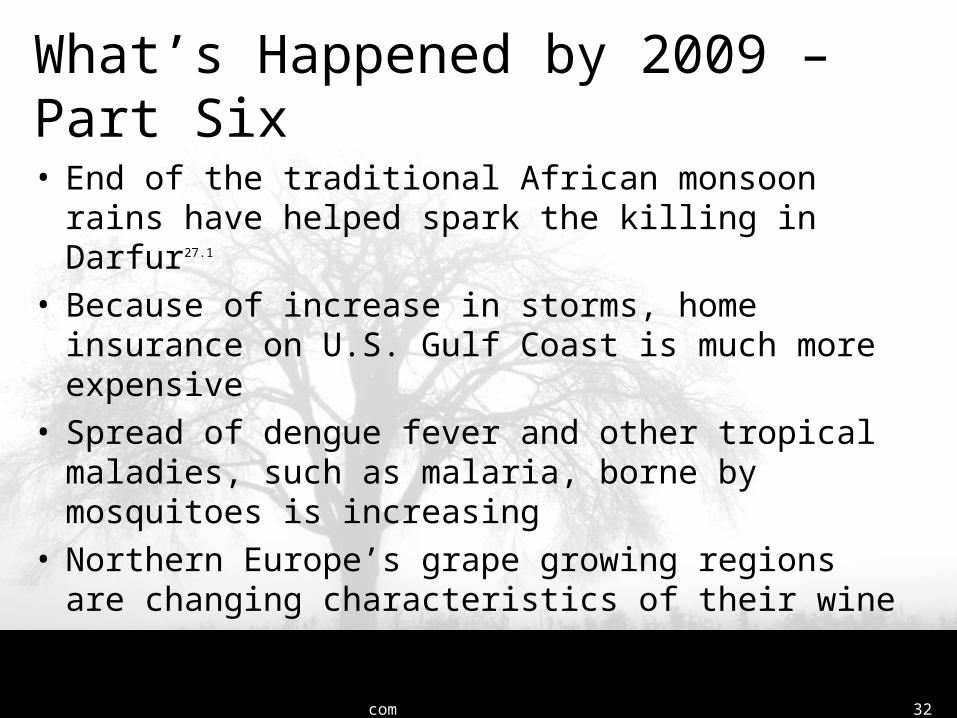
What’s Happened by 2009 – Part Six
• End of the traditional African monsoon rains have helped spark the killing in Darfur27.1
• Because of increase in storms, home insurance on U.S. Gulf Coast is much more expensive
• Spread of dengue fever and other tropical maladies, such as malaria, borne by mosquitoes is increasing
• Northern Europe’s grape growing regions are changing characteristics of their wine

Free Template from www.brainybetty.com 33
What’s Happened by 2009 – Part Seven
• Australia’s Great Barrier Reef hit its tipping point in 1990– Shrinking ever since– Gone by 2050
• Ten ice shelves have receded or collapsed around the Antarctic peninsula in the past 50 years– In total, about 25,000 sq km of ice shelves have been
lost, changing maps of Antarctica – the shelves had been in place for at least 10,000 years
– Antarctica's ice sheets contain enough water to raise world sea levels by 57 meters

Free Template from www.brainybetty.com 34
What’s Happened by 2009 – Part Eight
• Chacaltaya, an 18,000 year-old glacier, tucked away at 17,388 feet above sea level has completely melted
• The level of Lake Mead, Nevada – U.S. largest reservoir has dropped by 100 feet since 2000
• In U.S. average and peak wind speeds have noticeably slowed since 1973, especially in the Midwest and the East

Free Template from www.brainybetty.com 35
What’s Happened by 2009 – Part Nine• The Alps have been dividing themselves into two
distinct regions: a wet one in the north and a dry one in the south
• Tibet is having its worst drought in the last 30 years
• Carbon Dioxide levels in the atmosphere are the highest in the last 2.1 million years
• Band of tropical rainfall has been moved steadily north for the last 300 years (1.8 km per year)

Free Template from www.brainybetty.com 36
What’s Happened by 2009 – Part Ten
• Carbon dioxide concentrations in the atmosphere highest for the last 20 million years

Free Template from www.brainybetty.com 37
One Key is Conservation
• Escalators in the U.S. are estimated to use 2.6 billion kilowatt hours per year, equivalent to powering 375,000 houses at a cost of roughly U.S. $260 million
Free Template from www.brainybetty.com 38
Endnotes 3.1 Ed Pilkington , “Climate Target is Not Radical Enough,” The Guardian, April 7,
2008 4.1 “Global Warming is Irreversible,” BBC website, January 27, 2009 BACK
6.1 Mark Lynas, “Six Steps to Hell,” The Guardian, April 23, 2007 BACK
19.1 Alister Dolye, “Birds' Decline Shows Wider Damage Rueters News, October 9, 2008 BACK
19.2 Doug Struck, “Climate Change Drives Disease To New Territory, Washington Post, May 5, 2006 BACK
17.1 Green Facts web site, Update 2007 BACK
17.1 Munichre, web site, “Retreat of the Glaciers,” 2008 BACK
17.2 Shaun McKinnon, “It's Official: Summer's Heat Lingers Longer into Fall,” Arizona Republic, Oct. 25, 2008 BACK
21.1 Nature Conservancy, website, “Climate Change Impacts,” Oct. 25, 2008 BACK
21.1 Scientific American, website, “Ten Places Affect by Climate Change,” Dec. 23, 2008 BACK