Embed Size (px)
Citation preview

October 2012
MANAGEMENT BRIEF
IBM i for Midsize Businesses Minimizing Costs and Risks
for Midsize Businesses
International Technology Group 609 Pacific Avenue, Suite 102 Santa Cruz, California 95060-4406 Telephone: + 831-427-9260 Email: [email protected] Website: ITGforInfo.com

Copyright © 2012 by the International Technology Group. All rights reserved. Material, in whole or part, contained in this document may not be reproduced or distributed by any means or in any form, including original, without the prior written permission of the International Technology Group (ITG). Information has been obtained from sources assumed to be reliable and reflects conclusions at the time. This document was developed with International Business Machines Corporation (IBM) funding. Although the document may utilize publicly available material from various sources, including IBM, it does not necessarily reflect the positions of such sources on the issues addressed in this document. Material contained and conclusions presented in this document are subject to change without notice. All warranties as to the accuracy, completeness or adequacy of such material are disclaimed. There shall be no liability for errors, omissions or inadequacies in the material contained in this document or for interpretations thereof. Trademarks included in this document are the property of their respective owners.
International Technology Group i
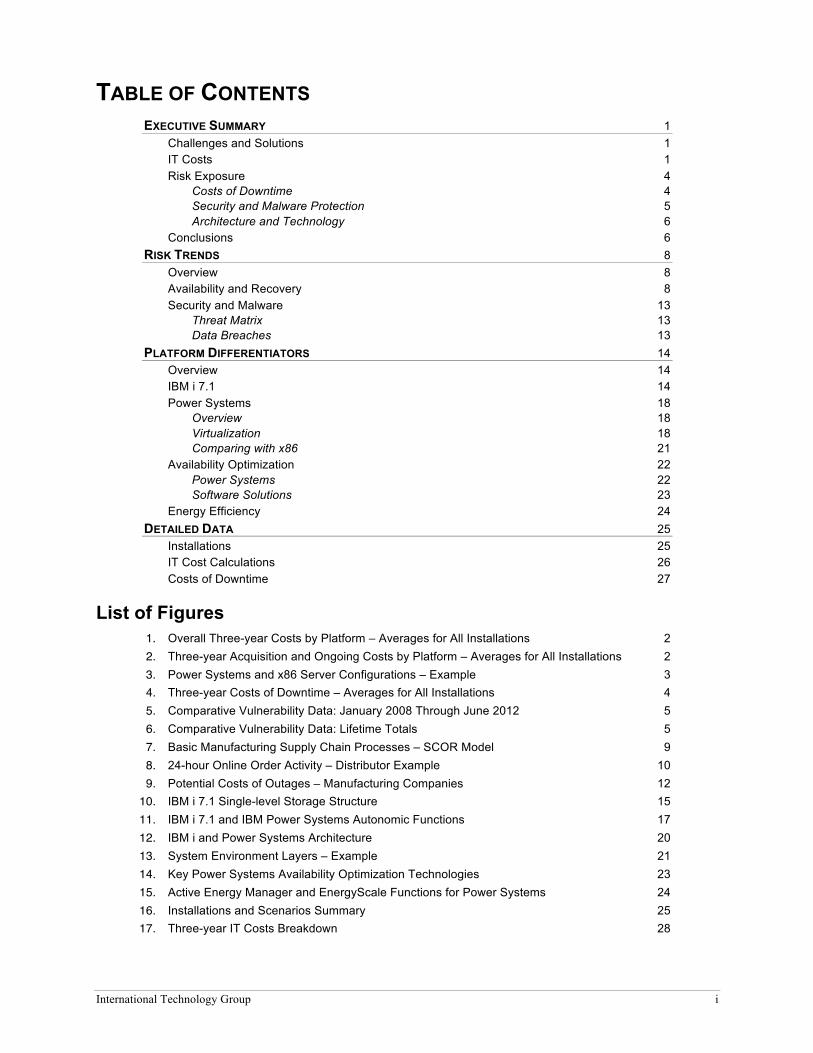
TABLE OF CONTENTS EXECUTIVE SUMMARY 1
Challenges and Solutions 1 IT Costs 1 Risk Exposure 4
Costs of Downtime 4 Security and Malware Protection 5 Architecture and Technology 6
Conclusions 6 RISK TRENDS 8
Overview 8 Availability and Recovery 8 Security and Malware 13
Threat Matrix 13 Data Breaches 13
PLATFORM DIFFERENTIATORS 14 Overview 14 IBM i 7.1 14 Power Systems 18
Overview 18 Virtualization 18 Comparing with x86 21
Availability Optimization 22 Power Systems 22 Software Solutions 23
Energy Efficiency 24 DETAILED DATA 25
Installations 25 IT Cost Calculations 26 Costs of Downtime 27
List of Figures 1. Overall Three-year Costs by Platform – Averages for All Installations 2 2. Three-year Acquisition and Ongoing Costs by Platform – Averages for All Installations 2 3. Power Systems and x86 Server Configurations – Example 3 4. Three-year Costs of Downtime – Averages for All Installations 4 5. Comparative Vulnerability Data: January 2008 Through June 2012 5 6. Comparative Vulnerability Data: Lifetime Totals 5 7. Basic Manufacturing Supply Chain Processes – SCOR Model 9 8. 24-hour Online Order Activity – Distributor Example 10 9. Potential Costs of Outages – Manufacturing Companies 12
10. IBM i 7.1 Single-level Storage Structure 15 11. IBM i 7.1 and IBM Power Systems Autonomic Functions 17 12. IBM i and Power Systems Architecture 20 13. System Environment Layers – Example 21 14. Key Power Systems Availability Optimization Technologies 23 15. Active Energy Manager and EnergyScale Functions for Power Systems 24 16. Installations and Scenarios Summary 25 17. Three-year IT Costs Breakdown 28

International Technology Group 1
EXECUTIVE SUMMARY
Challenges and Solutions The challenges faced by midsize businesses remain daunting. An uncertain economic outlook, slow market growth and cost pressures continue to affect most industries. Yet, in most geographies, IT spending by midsize businesses is increasing. Technology continues to offers the potential for greater competitiveness, improved operating efficiency and higher productivity.
Investment priorities vary. Mobile devices and social media are major targets, while interest in cloud computing continues to grow. Adoption of new tools to collect, analyze and exploit information has become pervasive. These and other new technologies offer the potential for far-reaching change in the way businesses compete.
Certain things, however, do not change. Companies continue to require core systems that “run the business.” Enterprise resource planning (ERP) systems, and core business-critical systems in banking, retail, insurance and other industries, remain the backbone of IT infrastructures. As new technologies are deployed within organizations, the role of these systems becomes increasingly significant.
The cost/benefit equation for platforms supporting these systems may be simply stated. If core systems cease functioning, so does the business. If performance or functionality is impaired, key processes across organizations may be impacted.
This report deals with this cost/benefit equation. Specifically, it compares the IBM i 7.1 operating system deployed on Power Systems with two alternatives: use of Microsoft Windows Server 2008 and SQL Server 2008, and use of x86 Linux with Oracle Database 11g, both deployed on Intel-based servers.
There are sharp distinctions between IBM i 7.1 and Power Systems, and these alternatives. Architectures and software environments are significantly different. IBM i 7.1 and Power Systems are optimized to deliver levels of availability and security that are – by wide margins – higher than those of x86-based equivalents. Risk exposure is correspondingly less.
Such capabilities would justify a cost premium. In practice, however, overall IT costs for use of IBM i 7.1 and Power Systems may be significantly lower than for x86 equivalents. Higher levels of consolidation and more efficient use of system resources, along with lower system and database administration overhead deliver economies that are seldom realized in Windows and x86 Linux environments.
IT Costs In six representative installations in midsize manufacturing, distribution and retail companies, three-year IT costs for use of IBM i 7.1 and Power Systems average 44 percent less than for x86 servers with Microsoft Windows Server and SQL Server, and 57 percent less than for x86 servers with Linux and Oracle databases.
Costs included hardware acquisition and maintenance; license and support costs for operating systems, databases and other systems software; personnel costs for system and database administration; and facilities (primarily energy) costs.
Figure 1 summarizes these results.

International Technology Group 2
Figure 1: Overall Three-year Costs by Platform – Averages for All Installations
Comparisons are between latest-generation versions of all platforms. These include IBM Power 720 and 740 systems configured with POWER7 processors and PowerVM virtualization; and dual- and four-socket x86 servers equipped with Intel E5 and E7 processors. VMware ESXi 5 is employed with Windows and x86 Linux servers.
Costs for use of IBM i 7.1 and Power Systems are lower across the board. For example, initial acquisition costs for hardware and software licenses average 24 percent less than for Windows and 47 percent less than for x86 Linux/Oracle servers. Ongoing costs average 51 percent and 61 percent less respectively. Figure 2 summarizes these results.
Figure 2: Three-year Acquisition and Ongoing Costs by Platform – Averages for All Installations
Individual x86 servers and software suites may be less expensive, but proliferation inflates costs. Separate servers are deployed to handle database, application and Web serving, and to support test, development and production instances. Hardware, software and maintenance costs are multiplied accordingly. Greater administrative complexity increases personnel costs.
Although VMware is employed to help reduce numbers of x86 servers, its effects are incremental. Reflecting overall industry experience, VMware hypervisors in these comparisons host test, development and comparatively light-duty production systems.
Higher per processor performance, along with more granular partitioning and real-time workload management mean that the level of concentration achieved with IBM i 7.1 and Power Systems is significantly greater.
In one of the comparisons presented in this report, for example, 10 physical Windows servers, two of which act as VMware hosts, are required to handle the same applications, workloads and instances that run on two partitioned Power Systems configured in a PowerHA SystemMirror for i failover cluster.
IBM i 7.1/Power Systems
Windows Servers
x86 Linux/Oracle
Hardware Maintenance SoLware licenses SoLware support Personnel FaciliNes
1,118.3
862.2
480.2
$ Thousands
IBM i 7.1/Power Systems
Windows Servers
x86 Linux/Oracle
AcquisiNon costs
Ongoing costs
1,118.3
862.2
480.2
$ Thousands

International Technology Group 3
Figure 3 illustrates this comparison. High levels of concentration may also be realized by standalone Power Systems with IBM i.
Figure 3: Power Systems and x86 Server Configurations – Example
In this example, applications include production, test and development instances of ERP, SCM, customer relationship management (CRM), business intelligence (BI) and e-commerce systems. In the x86 server configuration, failover clusters are employed for Windows database servers.
Windows and x86 Linux/Oracle server costs escalate further when allowance is made for additional tools for system administration, security and other functions to provide capabilities equivalent to those included in the base IBM i 7.1 offering.
Personnel costs for use of IBM i 7.1 and Power Systems reflect lower staffing levels. Numbers of full time equivalent (FTE) administrators for Windows and x86 Linux/Oracle servers average 2.3 and 2.6 times higher respectively.
Higher costs for x86 Linux/Oracle compared to Windows servers primarily reflect Oracle database pricing and lower x86 Linux system administrator and Oracle 11g database administrator productivity compared to Microsoft equivalents.
Details of installations, along with methodology and assumptions employed, and cost breakdowns may be found in the Detailed Data section of this report.
PowerHA SystemMirror for i
Production ERP, CRM & E-‐commerce
Production BI & SCM Development & test
Power 740
4 Partitions
Power 720
6 Partitions
POWER SYSTEMS
Production ERP, CRM
Failover Cluster
x86 SERVERS
SCM BI
Application & Web servers E-‐commerce Development & test
(VMware)
Development & test (VMware)

International Technology Group 4
Risk Exposure
Costs of Downtime
It is a truism that downtime costs money. Operations may be disrupted, personnel and capacity idled, orders and shipments delayed, and a wide range of business activities affected. Customers may also be alienated and business lost.
Not only unplanned (i.e. accidental) outages, but also repeated planned outages for such tasks as software updates and modifications, and scheduled maintenance can impact the bottom line. Globalization, Internet commerce and competitive pressures increasingly require 24/7 availability. Even if the business itself is not functioning, key systems must.
The impact of downtime is often underestimated. Companies may calculate that, say, an hour of downtime represents $50,000 in lost sales. Typically, such calculations are based on average sales volume per hour. In practice, the damage may be significantly greater, and longer lasting.
This is particularly the case for businesses that operate supply chains. As companies have moved to “just in time” and “lean” strategies that cut cycle times and minimize inventories, vulnerability to disruptions has increased. There is growing evidence that in tightly integrated, lean structures disruptions at any point may “cascade” through the entire supply chain.
Multiplier effects apply. The actual bottom-line impact is routinely three to ten times greater than a simple lost sales calculation would indicate.
There are marked differences between platforms in this area. The availability strengths of IBM i and Power Systems have been widely documented. Users have consistently reported higher levels of uptime than for any other platform employed by midsize businesses.
In the same companies that form the basis of IT cost calculations, costs of downtime average 84 percent less than for use of Windows, and 79 percent less than for x86 Linux/Oracle servers. Figure 4 illustrates these disparities.
Figure 4: Three-year Costs of Downtime – Averages for All Installations
Calculations for all companies include costs of supply chain disruption. Costs for manufacturing and distribution companies also include customer-related costs such as late delivery and imperfect order fees. Retail company costs also include costs of lost sales and in-store disruption. The basis of these calculations is again described in the Detailed Data section of this report.
766.1
3,669.6
4,787.0
IBM i 7.1/Power Systems
x86 Linux/Oracle
Windows Servers
$ Thousands
International Technology Group 5
Security and Malware Protection
Hacking and infection by malware (malicious code) remain ubiquitous threats for organizations of all sizes. Most midsize businesses experience both on a regular basis. Many intrusions are not detected for long periods, or not detected at all.
The bottom-line implications may be substantial. Businesses that experience customer data breaches may incur fines and other regulatory penalties, along with costs of remedial actions such as notifications, credit monitoring subscriptions and query handling. Risks of customer loss and reputational damage may also be significant.
Even if customer data is not compromised, other types of sensitive information may be stolen, and malicious damage to systems and software may occur.
In security and malware protection, differences between IBM i 7.1, and Windows and x86 Linux servers are not merely significant – they are dramatic. IBM i 7.1 is one of the most secure operating systems in existence. Security violations are rare, and malware incidents are virtually unknown. There are no known native IBM i viruses.
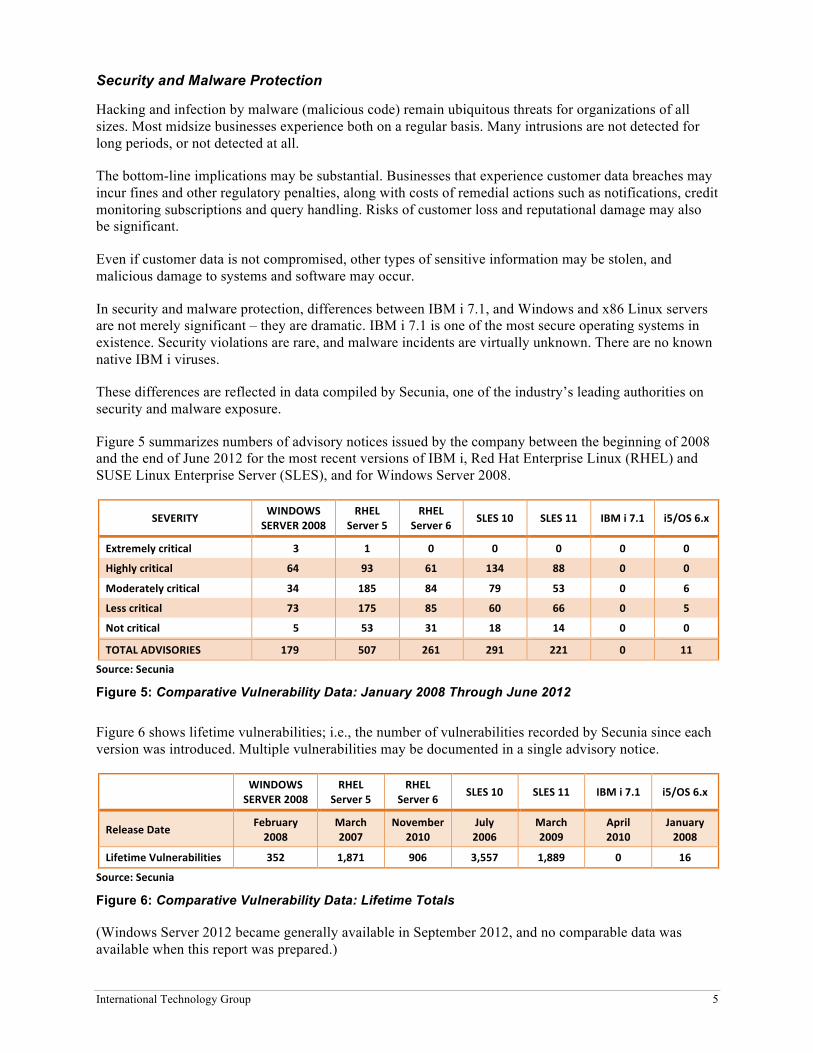
These differences are reflected in data compiled by Secunia, one of the industry’s leading authorities on security and malware exposure.
Figure 5 summarizes numbers of advisory notices issued by the company between the beginning of 2008 and the end of June 2012 for the most recent versions of IBM i, Red Hat Enterprise Linux (RHEL) and SUSE Linux Enterprise Server (SLES), and for Windows Server 2008.
SEVERITY WINDOWS SERVER 2008
RHEL Server 5
RHEL Server 6
SLES 10 SLES 11 IBM i 7.1 i5/OS 6.x
Extremely critical 3 1 0 0 0 0 0
Highly critical 64 93 61 134 88 0 0
Moderately critical 34 185 84 79 53 0 6
Less critical 73 175 85 60 66 0 5
Not critical 5 53 31 18 14 0 0
TOTAL ADVISORIES 179 507 261 291 221 0 11
Source: Secunia
Figure 5: Comparative Vulnerability Data: January 2008 Through June 2012
Figure 6 shows lifetime vulnerabilities; i.e., the number of vulnerabilities recorded by Secunia since each version was introduced. Multiple vulnerabilities may be documented in a single advisory notice.
WINDOWS SERVER 2008
RHEL Server 5
RHEL Server 6
SLES 10 SLES 11 IBM i 7.1 i5/OS 6.x
Release Date February 2008
March 2007
November 2010
July 2006
March 2009
April 2010
January 2008
Lifetime Vulnerabilities 352 1,871 906 3,557 1,889 0 16
Source: Secunia
Figure 6: Comparative Vulnerability Data: Lifetime Totals
(Windows Server 2012 became generally available in September 2012, and no comparable data was available when this report was prepared.)

International Technology Group 6
The significance of IBM i 7.1 security strengths is reinforced by two factors. One is that, most security authorities recognize, firewall-based perimeter defenses are no longer enough. Penetration of these has become increasingly common, and they do not prevent escalating threats of insider abuse. Higher levels of protection are required for core business databases.
The second is that, since the onset of recession, businesses have become reluctant to increase spending on IT security, and many have reduced it. Threats, however, have continued to increase. Organizations have been faced with a choice between greater expenditure or greater risk. Use of IBM i 7.1 enables them to avoid this choice. Better security may be maintained at a lower cost.
Architecture and Technology
The availability, security and malware protection strengths of IBM i 7.1 and Power Systems relative to Windows and x86 Linux/Oracle servers reflect fundamental differences in architecture and technology.
High levels of availability reflect features built into the IBM i 7.1 kernel and embedded into Power hardware and microcode (firmware). The overall simplicity and integration of IBM i 7.1, and its automation features also assist in minimizing outages.
Certain Power Systems reliability, availability and serviceability (RAS) features may also be found in x86 servers. However, the microelectronics technology used in Power Systems is a great deal more advanced. Clustered failover solutions for IBM i 7.1 and Power Systems are more robust and have longer track records of stable and successful operation.
IBM i 7.1 and Power Systems also benefit from technologies transferred from mainframe systems, which deliver the highest availability levels of any major platform. According to IBM, the company’s Power and System z (mainframe) design teams jointly developed the availability optimization features of the latest generation Power Systems.
The strengths of IBM i 7.1 in security and malware protection reflect the operation system’s object-based architecture. Objects are encapsulated in a manner that places strict controls on data as well as system code, making it extremely difficult for unauthorized instructions to execute. Additional capabilities for IP security and other functions are overlaid on this structure.
Conclusions IBM i has a longstanding reputation for stability and robustness. Users routinely characterize it as “highly stable...extremely robust…completely dependable…rock-solid.” Such terms are not commonly applied to Windows or x86 Linux servers.
IBM i 7.1 is the latest version of an IBM system environment that has been employed, in some cases for more than 20 years, by hundreds of thousands of midsized businesses worldwide. It was designed to meet the needs of these customers for a simple, reliable, secure and easy-to-administer platform to support core business systems.
In an era when the IT world has veered toward ever-greater complexity, IBM i has retained these characteristics. More than any other server environment available today, it is designed to minimize the complexities with which organizations must deal.
This is particularly the case in two areas:
1. Integration. Core operating system features – including a unique object-based kernel and single-level storage – are tightly integrated with the DB2 for i relational database; an integrated file system; Web application and services servers; and more than 300 management tools.

International Technology Group 7
Components are not simply bundled. They are engineered to interact with each other in a simple and efficient manner, and extensive testing is carried out to ensure that they do so. This testing extends not only across IBM hardware and software, but also across key independent software vendor (ISV) solutions.
The implications are important. Integration does not simply increase administrator productivity. It also affects performance – efficient software structures generate lower system overhead – and quality of service. Tightly integrated, tested systems are less likely to experience outages. There are fewer potential points of failure.
Equivalent functionality in Windows and x86 Linux server environments typically requires that users acquire, install, configure and administer multiple software products from different vendors. This increases deployment complexity, and magnifies integration and administration challenges.
In addition to increasing FTE staffing, poorly integrated environments are more likely to degrade performance, and maintenance of availability, security, disaster recovery coverage and other quality of service variables becomes a great deal more problematic.
2. Automation. IBM i was designed to automatically handle a wide range of functions – including configuration, tuning, software updates, availability and security optimization and other common operational tasks – for which most other systems require extensive manual intervention.
Core automation features have been reinforced by use of advanced artificial intelligence technologies and new POWER7 performance optimization features. Although the most visible effect of automation is that it reduces FTE staffing, other benefits are also realized.
A system that can determine workload requirements and reallocate system resources in a matter of milliseconds, for example, will use capacity more efficiently than one that is dependent on administrator or operator intervention. Automation also reduces the potential for human errors leading to performance bottlenecks, outages, data loss or corruption and other negative effects.
Other unique IBM i features also merit attention. The kernel incorporates one of the most elegant and sophisticated implementations of workload management available for any server platform today. In addition, the Technology Independent Machine Interface (TIMI) allows system technologies to be updated without changes to applications software.
Over the last few years, the IT industry has, ironically, rediscovered the advantages of reduced complexity. The principal value propositions for cloud computing – faster deployment and provisioning, more effective use of virtualization to enable consolidation, reduced administrative overhead and others – have been enjoyed by IBM i users for decades.
The ability to minimize complexity strikes at the heart of the technology challenges facing midsize businesses today. Excessive complexity has undermined the IT strategies of many large organizations. In a midsize business with limited resources and technical skills, the impact may be a great deal more serious and longer lasting.
A core business system typically has a lifecycle of five to ten years. Platform choices will affect costs, complexities and risk exposure for years to come. IBM i 7.1 on Power Systems offers the potential to reduce all three.

International Technology Group 8
RISK TRENDS
Overview Key industry trends mean that the significance of IBM i strengths in availability and disaster recovery, and in security and malware resistance are increasing over time. These trends are discussed in more detail in this section.
The following section, Platform Differentiators, deals with differences in architecture and technology between IBM i 7.1 and Power Systems, and Windows, x86 Linux and Intel-based hardware platforms that affect comparative costs, complexities and risks. These differences, and their implications for businesses, are often underestimated.
The last section, Detailed Data, provides additional information on the methodology employed for IT costs and costs of downtime calculations. More granular cost breakdowns are also provided.
Availability and Recovery Decades of experience have shown that, in most industries, downtime costs money. During the last decade, however, avoidance of downtime has become increasingly critical for a broad range of systems used by midsize businesses. Effective disaster recovery – i.e. the ability to resume operations and recover data rapidly in the event of a severe outage – is also increasingly mandated.
These shifts have been driven by a number of trends, including the following:
• Integration. Core business systems in most industries have progressively expanded to integrate a broader range of transactional processes, as well as new analytical and collaborative functions. This evolution has been particularly apparent for ERP and supply chain management (SCM) systems, but has also affected other core systems employed in a wide range of industries.
Examples include core merchandising systems in retail; core banking systems; policy management revenue and service delivery systems in insurance companies; customer information and billing systems in telecommunications and utilities; reservation systems in travel and hospitality; and revenue and service delivery systems in government and others.
Businesses, however, have found that the benefits of broader functionality and organization-wide process integration have a side effect: they become fundamentally dependent upon their systems. Quite simply, an outage may grind the entire business to a halt.
Vulnerabilities have been magnified in many businesses by consolidation of core systems. Standardization in the wake of mergers and acquisitions, as well as the adoption of shared services structures for order processing, finance, human resources (HR), customer service and other functions have contributed to this trend.
Vulnerability to disruptions also expands when organizations deploy new tools for planning and forecasting, business intelligence, e-commerce, mobile computing and other informational applications. Even if these are deployed on different platforms, they draw upon core databases. If core systems are down, they will at best be working with stale data.
• Globalization. A growing number of midsize businesses operate internationally, or employ foreign suppliers, channel partners or both. Large segments of manufacturing industry, in particular, have moved to China and other offshore bases.

International Technology Group 9
As a result, certain processes – including those related to procurement, logistics and, in many cases, sales, order management and customer service – now routinely occur on a 24/7 basis.
The impact of disruptions tends to be greater for regional and global supply chains. For example, rescheduling shipments may be a significantly more demanding process for businesses dealing with offshore suppliers and logistics contractors.
• Supply chain strategies. For years, in manufacturing, distribution, retail and other industries, best practice supply chain strategies have focused on “lean” operating models and streamlined process structures. There is an important implication: as inventory buffers removed or reduced, and process delays are eliminated, the potential impact of disruptions increases.
The effects of such strategies may permeate the entire supply chain. At the corporate or business unit level, for example, forecasting and planning cycles may be reduced from weeks to days, or to 24 hours or less.
In some sectors, manufacturers are now receiving continuous demand signals from their customers, recalibrating plans and forecasts, and initiating procurement, production and logistics actions on a daily or even hourly basis.
At the other end of the spectrum, cross docking (i.e., the immediate transshipment of goods between arriving and departing vehicles, without intermediate storage) in distribution centers may increase both efficiency and vulnerability to disruption.
In consumer products and retailing, techniques such as Efficient Customer Response (ECR), Collaborative Planning, Forecasting and Replenishment (CPFR), Continuous Replenishment and Vendor Managed Inventory (VMI) have reinforced these effects.
There is growing evidence that, in such environments, the effects of an outage may “cascade” through the entire supply chain. Not only internal operations, but also customers, suppliers, logistics contractors and other business partners may be affected. Moreover, the impact may continue to be felt long after service has been restored.
The implications of cascading may be simply illustrated. Even a basic manufacturing supply chain will typically involve most or all of the processes summarized in figure 7.
SOURCE
§ Identify sources of supply § Select supplier(s) § Negotiate with supplier(s)
§ Schedule product deliveries § Receive product § Verify product
§ Transfer product § Authorize supplier payment
MAKE
§ Schedule production § Set up production § Issue product
§ Produce § Inspect/test product § Package product
§ Stage product § Release to delivery
DELIVER
§ Process inquiry & quote § Receive, enter & validate order § Reserve inventory resources § Reserve delivery resources § Determine delivery date
§ Consolidate orders
§ Build loads § Route shipments
§ Select carrier(s)/rate(s) § Receive product § Pick product § Pack product
§ Load product § Generate shipping docs § Ship product § Customer receipt & verify
§ Install product § Invoice customer
Figure 7: Basic Manufacturing Supply Chain Processes – SCOR Model

International Technology Group 10
This presentation is based on selected segments of the Supply Chain Operations Reference (SCOR) model developed by the Supply Chain Council. These processes may be replicated hundreds or thousands of times every day for different products, customers, production lines and distribution centers. A disruption at any point may affect the entire sequence of processes.
A delay in delivering components to a plant, for example, might cause finished product deadlines to slip. This may in turn impact transportation schedules and warehouse operations, resulting in further delays and causing disruption to spread. The effects are cumulative.
Industry-specific effects may also be significant. For example, food and beverage suppliers face risks of spoilage if operations are disrupted. Traceability of ingredients and final products may also be impaired. Retailers and distributors risk stock-outs, whose impact may be particularly serious if they occur during peak sales seasons.
• E-commerce and M-commerce. The trend across many industries is toward Internet-based customer and supplier self-service systems that handle processes such as inventory availability queries, order placement and customer service.
The Internet is, almost by definition, a 24/7 medium, and the expectation is that online systems should be accessible at any time. Figure 8, for example, illustrates the frequency of online orders placed with a wholesale distributor over a 24-hour period.
Figure 8: 24-hour Online Order Activity – Distributor Example
Many of the company’s smaller customers often did not have time to check inventories and place orders until late evening or early morning. Inability to access the distributor’s online system at this time would, at best, be inconvenient, and could easily result in lost sales. If the experience were repeated, customers might defect.
M-commerce – meaning use of mobile devices such as tablets and smartphones for key business interactions – also places a premium on uptime. Online interaction with customers may now occur continuously and irregularly, magnifying risks that business may be lost if an outage is experienced.
Retailers, for example, must deal with growing use of mobile devices in stores. According to recent market research surveys, more than 40 percent of U.S. tablet and smartphone owners use these for comparison-shopping while visiting retail outlets, and some estimates put the ratio at over 60 percent. Similar trends are occurring in other geographies.
12 1 2 3 4 5 6 7 8 9 10 11 12 1 2 3 4 5 6 7 8 9 10 11 12
Ord
ers
per H
our
AM Time PM

International Technology Group 11
It has long been a principle that, in e-commerce, “customers are only a few clicks away from competitors” and that online outages translate rapidly into lost sales. M-commerce extends this effect to stores. Increasingly, any customer may be “only a few clicks away from competitors.”
• Customer impacts. Economic conditions, changing expectations and mounting competition in many industries have made business customers as well as consumers less tolerant of vendor failings. Although the costs of operational disruption may be substantial, the largest bottom-line impact of outages often involves customers.
A customer who is impacted directly (e.g., because an online self-service system is down) or indirectly (e.g., because supplier order management, production or delivery operations are disrupted) by an outage will inevitably be dissatisfied.
Dissatisfaction may translate into immediate lost sales or (in financial services and other industries) transaction value. The long-term impact, however, may be significantly higher.
For example, experience with e-commerce and, more recently, M-commerce has shown that some customers who are deflected to a competitor may not return. Even if they do, they are more likely to divide future purchases between multiple suppliers.
“Word of mouth” may also discourage others. Traditionally, these typically included family members, co-workers and friends. In the age of social media, however, online reviews and comments about negative experiences may reach thousands or millions of prospective customers.
Even if customers are not lost, there can be a number of potential bottom-line effects. For business-to-business suppliers, these might include late delivery and imperfect order penalties. It may also be necessary to offer special discounts or terms and conditions in order to win back the customer’s business.
A less visible, but potentially more significant erosion of confidence might also occur. This could cause the customer to hedge by diverting some future purchases to other suppliers in order to reduce dependence. In addition, the customer might be reluctant to rely upon the company for future strategic orders, particularly where these were time-sensitive.
No manufacturer or distributor wants to hear that customers consider them a “high-risk supplier.”
An additional set of “strategic” costs may be incurred. These will tend to occur if outages are severe, protracted or both. Share prices may be impacted. Other effects such as reduced brand value; increased risk provision; higher insurance premiums; and a variety of reputational, legal and compliance problems may be experienced.
System outages may have a wide range of potential cost impacts. Figure 9, for example, shows a representative list of these for manufacturing companies.
Another effect should be highlighted. Disruptions tend to raise error rates. This may occur across multiple stages of the supply chain, and may cause additional customer dissatisfaction, along with penalties and resolution costs.

International Technology Group 12
STRATEGIC COSTS Charge against earnings
Financial metrics/ratios
Share price decline
Share price volatility
Cost of capital
Increased risk provision
Reduced brand value
Insurance premiums
Damaged reputation - Financial markets - Customers/prospects - Banks - Business partners - M&A candidates
Impaired credit
Liquidity exposure
Legal exposure - Customers - Third parties - Shareholders
Compliance exposure - Regulatory reporting - Impaired inspection - Impaired traceability
CUSTOMER-‐RELATED COSTS Lost short-‐term sales
Lost short-‐term profit
Lost future sales/profit
Late delivery penalties
Imperfect order penalties
Product defect penalties
Customer rebates
Buyback pricing/concessions
Additional customer service cost
OPERATIONAL COSTS Idle capacity
- Overall supply chain - Procurement - Plant operations - Logistics/distribution - Transportation - Warehouses - Third-‐party services
Personnel costs - Idleness/underutilization - Reduced productivity - Additional work required - Overtime/shift premiums - Additional T&E costs
Finance processes - Delayed billing/receivables - Inventory carrying cost - Cash flow cost - Delayed close
Costs of change - Procurement change - Revised order processing - Special order cost - Production schedule change - Line change cost - Costs of logistics change - Supplier premiums - Expedited transportation - Additional handling cost - Additional inventory cost - Additional checking cost
Error-‐related costs - Order processing errors - Product defect - Specification error - Manufacturing error - Quality failure - Shipment error - Damaged product - Wrong packaging - Routing error - Wrong delivery time
Other costs - Lost promotional expenditure - Lost marketing expenditure - IT costs - Administrative costs - Overhead
Figure 9: Potential Costs of Outages – Manufacturing Companies
The potential significance of such effects was highlighted by a study co-authored by Kevin Hendricks of the University of Western Ontario and Vinod Singhal of the Georgia Institute of Technology. After reviewing the financial results of more than 800 public companies that had experienced severe supply chain disruptions, the authors concluded that company stocks experienced 33 to 40 percent lower returns relative to industry benchmarks over a three-year period because of these.
The study also reported declines of 7 percent in sales growth, 107 percent in operating income, 114 percent in return on sales, 93 percent in return on assets, and increases in cost of sales, selling, general and administrative (SG&A) expenses and inventory levels.
There is also a growing body of evidence from other industries that the effects of major system disruptions may have a significant – and protracted – effect on key measures of financial performance.
A clear conclusion emerges. Whether outages result in operational disruption, customer-related costs and/or strategic costs, they have a significant bottom-line impact. Maintenance of the highest possible level of availability and recovery for core business systems should be a central goal of IT strategy.

International Technology Group 13
Security and Malware
Threat Matrix
Security and malware attacks are now so common that security authorities have largely abandoned efforts to quantify their frequency. The U.S. government-supported Computer Emergency Response Team (CERT), for example, stopped reporting numbers of incidents in 2003. CERT takes the position that attacks are now so common that it is no longer meaningful to aggregate totals.
The number of malware variants – including viruses, Trojans, worms, spyware, rootkits, backdoors and assorted hybrids of these – circulating on the Internet and intranets continues to expand. Security firm Symantec Corporation, for example, reports that it detected more than 400 million unique variants during 2011, a more than 40 percent increase over 2010.
Although most organizations have invested in information security for more than a decade, the extent of improvement is questionable. The sophistication of cybercriminals continues to evolve, as do the technologies and techniques they employ. Because organizations are often reluctant to report incidents, threat statistics are often unreliable.
Until recently, cybercriminals tended to attack large corporations and government agencies. They are now increasingly targeting midsize businesses. These are also vulnerable to – and usually less well protected than their larger counterparts against – the actions of individual hackers, disgruntled employees and others who may hold grudges against them.
Security analysts report consistent growth in “gateway” attacks, which seek to create covert breaches that can be exploited over time, and in the prevalence of spyware (malware that collects and forwards information from computers without the knowledge of users). Increasingly, the fact that breaches are not detected does not mean that they are not occurring.
Use of bots – malware that allows an attacker to gain control over a computer for illicit purposes – has also expanded. Estimates of the number of bot-infected computers worldwide range from 12 million to more than 200 million.
Economic conditions have accelerated growth of all types of cybercrime.
Data Breaches
Midsize users increasingly risk intrusions that expose sensitive data. The bottom-line impact of such incidents may be substantial.
In most countries, privacy laws expose businesses to penalties in the event of data breaches, and other costs may also be substantial. In the United States, for example, most estimates put the average cost of a data breach in the range of $150 to $300 per record exposed. A leading industry authority, the Ponemon Institute, put the overall average cost of breaches in 2011 at more than $5 million each.
These averages include direct costs, including notification; remedial action such as security fixes, subscriptions to credit monitoring services and costs of marketing initiatives to retain disaffected customers; as well as indirect costs due to lost business, customer defections and other effects. In individual cases, costs may be significantly higher.

International Technology Group 14
PLATFORM DIFFERENTIATORS
Overview IBM i 7.1 and Power Systems represent the convergence of two major technology streams:
1. IBM i 7.1 is the latest version of an IBM operating system that originated with the AS/400 in 1988, and has been progressively enhanced to incorporate new technologies.
These include latest-generation SQL relational technology, C/C++, Java and Eclipse, the PHP Web enablement language, XML, MySQL database, Apache Web server, the IBM Rational Enterprise Generation Language (EGL) and others.
As a result, IBM i users have been able to take full advantage of the Internet and, more recently, mobile technologies, to employ popular “open” development tools, and to draw upon large pools of third-party tools and add-ons conforming to widely supported industry standards.
IBM has also continued to invest in established IBM i technologies such as the RPG II, COBOL and CL languages. IBM Rational Open Access (ROA) for RPG, for example, enables mobile access to native RPG applications from devices such as iPhones, iPads, web browsers and Android phones.
IBM i 7.1 is supported by more than 2,500 ISVs – including most major vendors of ERP and industry-specific core business systems – along with systems integrators and professional services firms worldwide. It enjoys one of the highest levels of customer loyalty for any platform.
2. Power Systems are built upon the seventh generation of IBM POWER reduced instruction set computing (RISC) architecture. POWER7-based systems, which also support the IBM AIX UNIX-based operating system and Power versions of RHEL and SLES Linux, have consistently outperformed competitive RISC and x86 platforms in a wide range of industry benchmarks.
POWER7-based systems also incorporate industry-leading advances in chip density, memory technology, multithreading virtualization, workload management, availability optimization, energy efficiency and other areas. In the UNIX server market, Power Systems have progressively increased their share since 2008, and by the end of 2011 had reached the 50 percent mark.
For midsize organizations considering whether to employ IBM i 7.1 on Power Systems, or Windows or x86 Linux servers, it is important to understand the differences between these environments.
IBM i 7.1 The current IBM i version 7.1, introduced in April 2010, as well as IBM i 6.1 are supported on Power Systems. Binary compatibility has been retained for earlier IBM i, AS/400, System/36 and System/38 applications.
Major features include the following:
• System integration. IBM i includes not only core operating system functions. It also includes DB2 for i, an integrated file system, WebSphere Application Server (WAS), Tivoli Directory Server, Java Virtual Machine (JVM) environments, and tools handling system, database, storage, backup and recovery, communications, security, operations and other management tasks.
International Technology Group 15
DB2 for i is an i-optimized version of IBM DB2 platform also offered by the company for Windows, Linux, UNIX and mainframe systems. It is a full-functional SQL relational database enabling high levels of transactional as well as query performance, along with industry-leading data compression, encryption and Extensible Markup Language (XML) compatibility.
Components share a common, high-productivity administrator interface through IBM Systems Director Navigator for i, which forms part of the larger IBM Systems Director portfolio of operational management tools.
Integration of DB2 for i allows database and system administration tasks to be handled by the same individuals. Users of other platforms typically require a database administrator (DBA). In the cost comparisons presented in this report, FTE staffing for Windows and x86 Linux servers includes SQL Server and Oracle DBAs respectively.
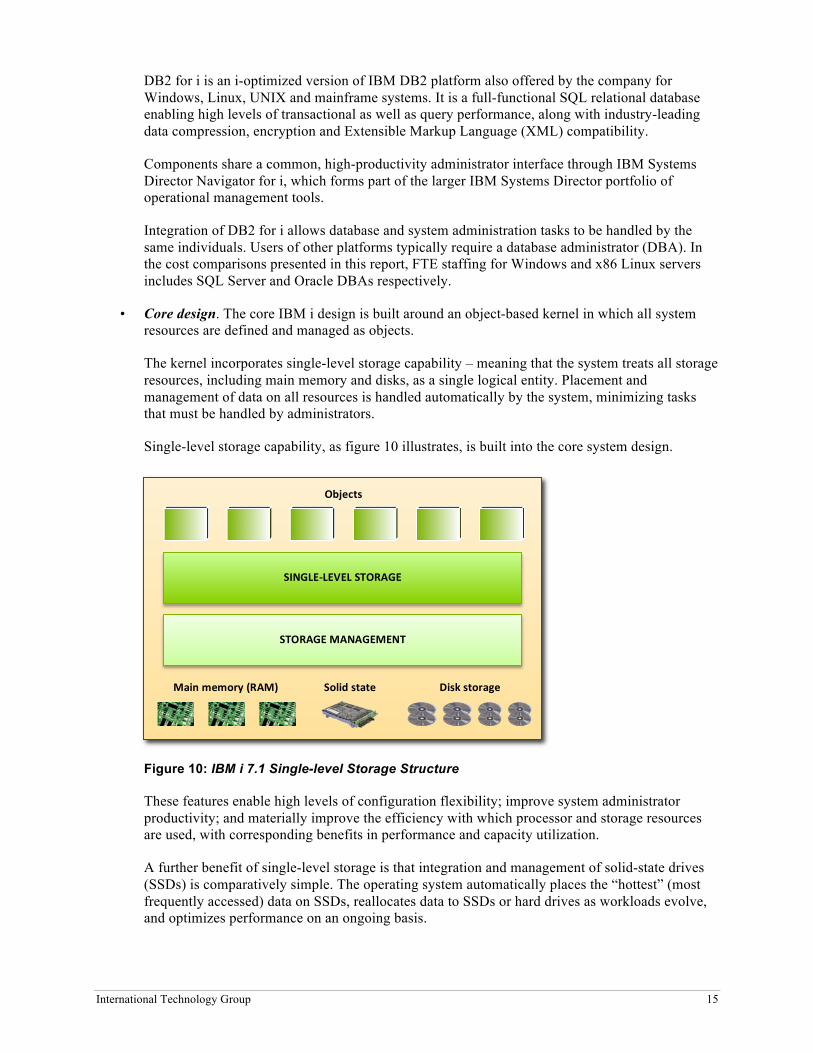
• Core design. The core IBM i design is built around an object-based kernel in which all system resources are defined and managed as objects.
The kernel incorporates single-level storage capability – meaning that the system treats all storage resources, including main memory and disks, as a single logical entity. Placement and management of data on all resources is handled automatically by the system, minimizing tasks that must be handled by administrators.
Single-level storage capability, as figure 10 illustrates, is built into the core system design.
Figure 10: IBM i 7.1 Single-level Storage Structure
These features enable high levels of configuration flexibility; improve system administrator productivity; and materially improve the efficiency with which processor and storage resources are used, with corresponding benefits in performance and capacity utilization.
A further benefit of single-level storage is that integration and management of solid-state drives (SSDs) is comparatively simple. The operating system automatically places the “hottest” (most frequently accessed) data on SSDs, reallocates data to SSDs or hard drives as workloads evolve, and optimizes performance on an ongoing basis.
SINGLE-‐LEVEL STORAGE
STORAGE MANAGEMENT
Objects
Main memory (RAM) Disk storage Solid state

International Technology Group 16
This provides basic automated storage tiering capability without array-based tools, and without the additional storage administration overhead that is normally generated by this approach. No application changes are required.
IBM i users have realized gains in high-throughput applications such as large batch runs (reductions of 20 to 50 percent in elapsed time are common) and initial program loads (IPLs). A no-charge SSD Analyzer Tool may be employed to determine which workloads would benefit from use of SSDs.
The IBM i kernel also includes the Technology Independent Machine Interface (TIMI), which acts as a “virtual” instruction set with which applications interact, regardless of the instruction set of underlying processor hardware. The TIMI allows users to update underlying hardware platforms without obliging users to recompile applications software.
• Workload management. Since its inception, IBM i has incorporated industry-leading workload management (in IBM i terminology, work management) capabilities designed to handle diverse workloads such as online, batch and collaborative processing in a highly efficient manner.
The backbone of these capabilities is provided by IBM i subsystems, which leverage the IBM i object-based architecture – individual workloads or applications (e.g., ERP, CRM, e-mail, Web serving) are described and managed independently. The system allocates memory, limits consumption of resources by individual workloads, and manages scheduling, tuning and other tasks automatically, or based on priorities set by users.
Subsystems are integral to the IBM i design, and may be employed independently of or in conjunction with PowerVM virtualization.
• Security and malware resistance. The strengths of IBM i’s object-based design are reinforced by tight integration of security functions with compiler, directory server and object-based file system structures. In contrast, security functions for Windows and x86 Linux are implemented as software overlays. The level of integration is significantly less.
IBM i 7.1 also contains a comprehensive IP security suite, including support for the principal industry security standards and encryption techniques.
Extensive access control and audit facilities are included, and single sign-on is enabled using an industry-leading IBM autonomic technology, Enterprise Identity Mapping (EIM), which maps user IDs across all middleware and application components.
IBM i 7.1 strengths offer a further advantage. The time and effort that must be spent on routine security and malware protection tasks, and in patching and auditing is a great deal less than for Windows and x86 Linux servers.
• Automation. Core IBM i automation strengths have been reinforced by autonomic technologies. Autonomic computing – meaning the application of artificial intelligence technologies to IT administration and optimization tasks – has been a major IBM development focus since the 1990s, and the company is the recognized industry leader in this area.
Four categories of autonomic functions – self-configuring, self-optimizing, self-protecting and self-healing – are implemented in IBM i and Power Systems. These functions, which represent one of the most advanced implementations of autonomic technologies within the IBM product line, are summarized in figure 11.
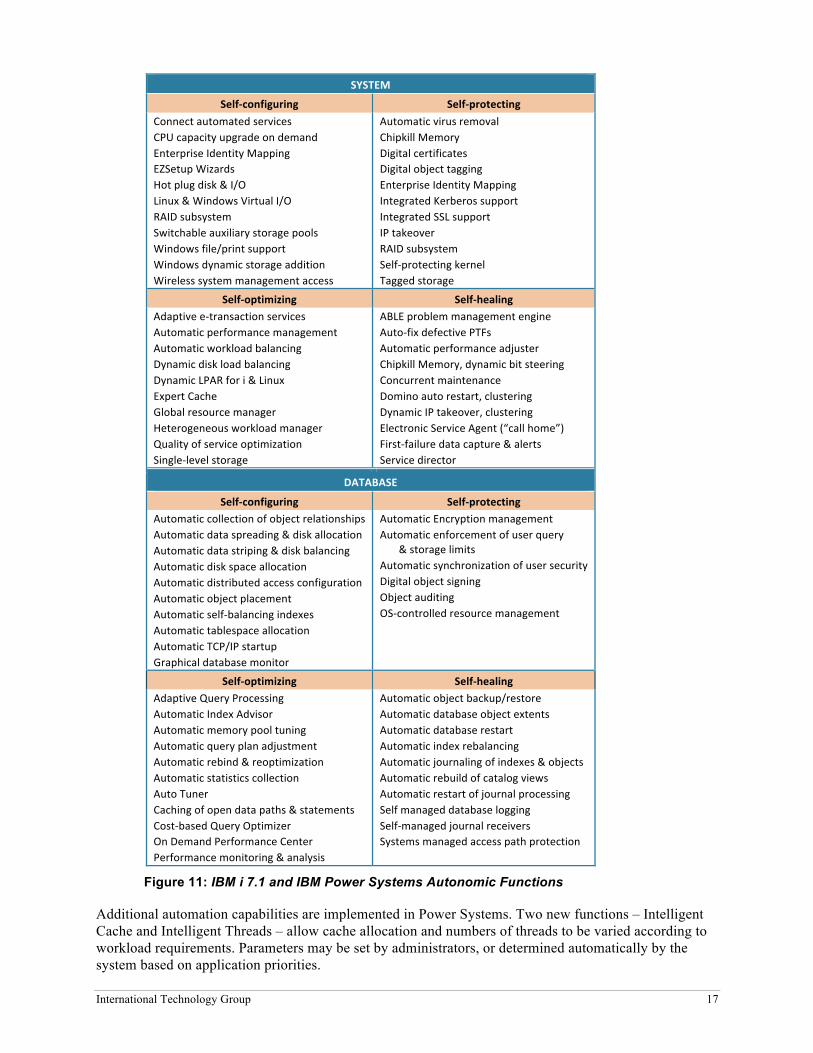
International Technology Group 17
SYSTEM
Self-‐configuring Self-‐protecting
Connect automated services CPU capacity upgrade on demand Enterprise Identity Mapping EZSetup Wizards Hot plug disk & I/O Linux & Windows Virtual I/O RAID subsystem Switchable auxiliary storage pools Windows file/print support Windows dynamic storage addition Wireless system management access
Automatic virus removal Chipkill Memory Digital certificates Digital object tagging Enterprise Identity Mapping Integrated Kerberos support Integrated SSL support IP takeover RAID subsystem Self-‐protecting kernel Tagged storage
Self-‐optimizing Self-‐healing Adaptive e-‐transaction services Automatic performance management Automatic workload balancing Dynamic disk load balancing Dynamic LPAR for i & Linux Expert Cache Global resource manager Heterogeneous workload manager Quality of service optimization Single-‐level storage
ABLE problem management engine Auto-‐fix defective PTFs Automatic performance adjuster Chipkill Memory, dynamic bit steering Concurrent maintenance Domino auto restart, clustering Dynamic IP takeover, clustering Electronic Service Agent (“call home”) First-‐failure data capture & alerts Service director
DATABASE
Self-‐configuring Self-‐protecting Automatic collection of object relationships Automatic data spreading & disk allocation Automatic data striping & disk balancing Automatic disk space allocation Automatic distributed access configuration Automatic object placement Automatic self-‐balancing indexes Automatic tablespace allocation Automatic TCP/IP startup Graphical database monitor
Automatic Encryption management Automatic enforcement of user query & storage limits Automatic synchronization of user security Digital object signing Object auditing OS-‐controlled resource management
Self-‐optimizing Self-‐healing Adaptive Query Processing Automatic Index Advisor Automatic memory pool tuning Automatic query plan adjustment Automatic rebind & reoptimization Automatic statistics collection Auto Tuner Caching of open data paths & statements Cost-‐based Query Optimizer On Demand Performance Center Performance monitoring & analysis
Automatic object backup/restore Automatic database object extents Automatic database restart Automatic index rebalancing Automatic journaling of indexes & objects Automatic rebuild of catalog views Automatic restart of journal processing Self managed database logging Self-‐managed journal receivers Systems managed access path protection
Figure 11: IBM i 7.1 and IBM Power Systems Autonomic Functions
Additional automation capabilities are implemented in Power Systems. Two new functions – Intelligent Cache and Intelligent Threads – allow cache allocation and numbers of threads to be varied according to workload requirements. Parameters may be set by administrators, or determined automatically by the system based on application priorities.

International Technology Group 18
A broader characteristic of IBM i 7.1 is that its different components are implemented in a highly synergistic manner. For example, DB2 for i exploits the underlying object-based structure and single-level storage capabilities of the operating system. Multithreading, virtualization, workload management and other functions are also closely integrated.
IBM i 7.1 is also supported on Power processors in new IBM PureFlex Systems, which combine IBM Power, System x (x86) and midrange Storwize V7000 disk arrays in a single integrated platform. PureFlex systems also implement common management services across the full range of operating systems, systems software and hypervisors supported by the platform.
Power Systems
Overview
Power Systems have been the recognized industry leader in server performance since the mid-2000s. To some extent, this has been a function of the performance delivered by successive generations of POWER processors. However, other factors also come into play.
In Power Systems, system-level performance has been optimized at all levels of design and implementation – including microelectronics and module-level components, internal communications, I/O and system-level hardware and software.
Key capabilities include highly effective compiler- and operating system-level performance acceleration, including chip simultaneous multithreading; low levels of symmetric multiprocessing (SMP) overhead; and extensive system-level integration and optimization of performance-related features.
A key differentiator is that Power Systems are optimized not only to deliver high levels of performance for single applications and workloads, but also for the mixed workload environments that are typically generated by core systems in midsize businesses. Transactional, as well as query and collaborative workloads may be handled concurrently in a highly efficient manner.
The level of integration of virtualization and workload management capabilities is also higher than for Windows and x86 Linux servers, and availability optimization and energy efficiency features are built into the core system design.
Current-generation Power Systems may be equipped with quad-, six- or eight-core processors with frequencies of 3.0 to 4.0 GHz, supporting up to four simultaneous threads. Processors incorporate industry-leading on-chip cache, memory compression features and resiliency features.
Power Systems include single-socket (710 and 720), two-socket (730 and 740) and four-socket (770 and 780) models covering a wide range of prices, and performance and expandability levels; and the high-end Power 795, which is configurable to 32 sockets (256 cores). There are also single- and two-socket blade models equipped with quad-core POWER7 3 GHz processors. All models support IBM i 7.1 and i 6.1.
Power Systems and IBM i support use of the principal IBM disk storage platforms – including enterprise-class System Storage DS8000 and XIV Storage System, midrange Storwize V7000 and entry-level DS3000 arrays – as well as the IBM SAN Volume Controller (SVC) cross-platform storage virtualization solution. A wide range of tape systems and standards are supported.
IBM i support for use of removable disk storage (RDX) storage devices on Power Systems has also been announced. RDX is a comparatively new SATA-based drive technology that offers an alternative to conventional entry tape drives for backup and recovery.
International Technology Group 19
Virtualization
Effective virtualization requires more than the ability to create virtual machines.
Multiple mechanisms are required to create and modify partitions, share system resources between these, and change resource allocations as needs change. It is also necessary to prioritize availability of resources to different applications based on business criticality; monitor and control workload execution processes; and meet service-level performance and uptime targets.
PowerVM virtualization meets these requirements. Capabilities include three types of partitioning:
1. Logical partitions (LPARs) are microcode-based partitions that may be configured in increments as small as 1/10th core. The technology was originally developed for IBM mainframes.
As a general principle, this approach (often referred to as hard partitioning) offers better isolation of workloads than software-based techniques. Workloads running in different partitions are less likely to interfere with each other, enabling higher levels of concentration. LPARs also provide additional security functions.
System resources used by LPARs may be dedicated (Static LPARs), or shared according to application priorities (Dynamic LPARs). Static LPARs are typically employed for applications with high levels of business criticality.
Hard partitioning is supported on Hewlett-Packard Integrity and Oracle Sun M-Series UNIX server platforms, albeit in a more limited form than on Power Systems. Integrity systems have suffered a severe loss of market share during 2011 and 2012. Sun M-Series servers, first introduced in 2007, are now rarely seen in competitive bids.
No equivalent capability is available for Intel-based servers with Windows, x86 Linux and/or x86 virtualization tools, or for newer Oracle Sun servers.
2. Micro-partitions are software-based partitions. They are typically employed to support instances requiring limited system resources, and to improve load balancing for large, complex workloads. Micro-partitions may be configured in initial increments of 1/10th core, and subsequent increments as small as 1/100th core.
LPARs and micro-partitions are supported by mechanisms that allow processor, memory and I/O resources to be pooled and re-allocated in an extremely granular manner. The system monitors resource utilization every 10 milliseconds, and may change allocations as rapidly.
Business-critical workloads may run in dedicated LPARs, using dedicated physical processors. However, other workloads may be executed based on assigned priorities using combinations of threads, partitions and shared processor pools. The system allows workloads to run on one or more processor cores within shared pools.
3. Virtual I/O Servers allow operating system instances running in multiple LPARs to share a common pool of LAN adapters as well as Fiber Channel, SCSI and RAID devices; i.e., it is not necessary to dedicate adapters to individual partitions. Hardware, maintenance and energy cost savings may be realized.
The overall architecture, illustrated in figure 12, integrates with IBM i to allow users to manipulate a wider range of variables – including subsystems, threads, processors, cache, main memory and I/O, multiple types of partition, multiple threads and dedicated or pooled processors – with higher levels of granularity and flexibility than any competitive platform.

International Technology Group 20
Figure 12: IBM i and Power Systems Architecture
In this figure, Virtual I/O Servers are duplicated to provide redundancy.
RESOURCE SHARING
Processors, Cache, Memory, I/O Threads
VIRTUAL I/O SERVER VIRTUAL I/O SERVER
Physical processors
DEDICATED PROCESSORS
Physical processors
SHARED PROCESSOR POOL
Virtual processors
SHARED PROCESSOR POOL
Virtual processors
Virtual LAN
LPAR
Micro-partitions
Virtual tape
LPAR
Virtual disks
LPAR
LPAR
LPAR
Micro-partitions LPAR
POWERVM HYPERVISOR
IBM i 7.1 Object-‐based architecture • Single-‐level storage
System integration & automation
WORKLOAD MANAGEMENT
Subsystem Subsystem Subsystem Subsystem

International Technology Group 21
PowerVM and x86 Virtualization
In comparison to PowerVM, x86 virtualization tools employ only a single, software-based partitioning method. While they may be able to support diverse workloads, they do so less efficiently than Power Systems. System overhead may be significantly larger.
Differences in two other areas should also be highlighted.
1. Workload management. Partitioning creates the potential for high levels of capacity utilization. However, the extent to which this occurs in practice depends on mechanisms that allocate system resources between, and monitor and control workload execution processes across partitions. If these mechanisms are ineffective, a high proportion of system capacity may be idle over time.
Most workloads experience fluctuations, and processes (e.g., online, batch, collaborative) may vary. Unexpected spikes may also occur. When multiple applications are concentrated on a single physical platform – particularly if these generate mixed workloads – highly granular, real-time monitoring and resource assignment will be required.
If systems cannot provide such capabilities, administrators will tend to limit the number and size of partitions to prevent workloads interfering with each other. This is one of the key weaknesses of such tools as VMware and Hyper-V, and helps explain why most installations of these realize only a fraction of their architectural potential.
2. Complexity. Ironically, solutions intended to reduce complexity by enabling consolidation of physical x86 servers have often had the reverse effect. Implementation has often proved to be a longer and more difficult process than anticipated, and skill requirements and staffing levels have tended to escalate.
As figure 13 illustrates, virtualization inevitably increases complexity by introducing a new layer of architecture into system environments.
Figure 13: System Environment Layers – Example
In an IBM i 7.1 system environment, the bottom four layers are integrated by IBM in a highly efficient manner. The company’s close relationships with ISVs also mean that the applications layer is better tested and optimized for the overall IBM stack than is the case for Windows and x86 Linux servers.
A VMware environment, in contrast, will typically include components from Intel or Advanced Micro Devices (AMD); the server hardware manufacturer; operating system, database and/or application suppliers; and VMware itself. The number of vendors may be significantly larger if storage and networks, and third-party tools are included.
HARDWARE
VIRTUALIZATION
OPERATING SYSTEM
DATABASES/MIDDLEWARE
APPLICATIONS

International Technology Group 22
Another difference is that VMware and (to a lesser extent) other x86 virtualization tools have become common hacker and malware targets. Businesses deploying these may find that their vulnerabilities increase, while patching workloads expand.
PowerVM is less vulnerable. The National Vulnerability Database maintained by the U.S. National Institute of Standards and Technology (NIST), for example, recorded 39 medium and high severity vulnerabilities for VMware, and 13 for Xen and KVM during 2011. None were reported for PowerVM over the same period.
Availability Optimization
Power Systems
A first set of availability optimization features is built into Power Systems hardware and microcode. It includes the following:
• Basic capabilities include high levels of component reliability and redundancy, along with hot swap capabilities enabling devices to be replaced without taking systems offline. Redundant and hot swap components include disk drives, PCI adapters, fans, blowers, power supplies and, on high-end models, system clocks, service processors and power regulators.
• Monitoring, diagnostic and fault isolation and resolution facilities are built into all major Power system components, including processors, main memory, cache and packaging modules, as well as adapters, power supplies, cooling and other devices. In many cases, multiple layers of protection and self-test are implemented.
Key functionality is provided by IBM-developed Chipkill and First Failure Data Capture (FFDC) technologies. Chipkill is significantly more reliable than conventional error correction code (ECC) techniques. FFDC employs embedded sensors that identify and report failures to a separately powered Service Processor, which also monitors environmental conditions.
The Service Processor can automatically notify system administrators or contact an IBM Support Center (electronic support or call home service) to report events requiring service intervention.
• Fault masking capabilities prevent outages in case failures do occur. For example, in the event an instruction fails to execute due to a hardware or software fault, the system will automatically repeat the operation. If the failure persists, the operation will be repeated on a different processor and, if this does not succeed, the failed processor will be taken out of service.
In addition, memory sparing enables alternate memory modules to be activated in the event of failures; and enhanced memory subsystem enables memory controller and cache sparing.
Availability optimization features of Power Systems are summarized in figure 14. Additional capabilities are provided for high-end Power 770, 780 and 795 models.
LPARs contribute to reduction of planned outages. Software modifications may be made and new versions installed and assured without disrupting operations. Backups may be performed, and batch workloads executed concurrently with online processes.
A further capability, Live Partition Mobility, was introduced for IBM i 7.1 in April 2012. This allows movement of active LPARs between Power Systems without disrupting operations. Service interruptions of one or two seconds may occur due to network latency. These are, however, rarely noticeable to users.

International Technology Group 23
Software Solutions
Avoidance of planned as well as unplanned outages is a central IBM i design parameter. High levels of stability, integration and automation minimize risks of unplanned outages caused by software failures and human error, and reduce both the frequency and duration of planned outages.
BASIC CAPABILITIES
Redundancy, hot-‐swap & related Redundant/hot-‐swap disks, PCI adapters, GX buses, fans & blowers, power supplies, power regulators & other components.
Redundant disk controllers. I/O paths & oscillators.
Concurrent system clock repair.
Concurrent firmware update Server microcode may be updated without taking systems offline.
Concurrent maintenance Allows processors, memory cards & adapters to be replaced, upgraded or serviced without taking systems offline.
MONITORING, DIAGNOSTICS & FAULT ISOLATION/RESOLUTION
Hardware-‐assisted memory scrubbing
Automatic daily test of all system memory. Detects & reports developing memory errors before they cause problems.
Chipkill error checking Employs RAID-‐like striping of data across memory devices to provide redundancy & enable reinstatement of original data. Significantly more reliable than conventional error correction code (ECC) technology.
First Failure Data Capture (FFDC) Employs 1,000+ embedded sensors that identify errors in any system component. Root causes of errors are determined without the need to recreate problems or run tracing or diagnostics programs.
FAULT MASKING
Processor instruction retry
Alternate processor recovery
Processor-‐contained checkstop
If an instruction fails to execute due to a hardware or software fault, the system automatically retries the operation. If the failure persists, the operation is repeated on a different processor &, if this does not succeed, the failed processor is taken out of service (checkstopped). Only LPARs supported by the failed processor are affected.
Dynamic processor sparing Allows idle Capacity Upgrade on Demand (CUoD) processors to be automatically activated as replacements for failed processors.
Partition availability priority In the event of a processor failure, maintains LPAR-‐based workloads based on assigned priorities; i.e., remaining processor capacity is assigned to the highest-‐priority workloads.
Memory sparing Enables redundant memory to be activated in the event of failure.
Enhanced memory subsystem Enables memory controller & cache sparing.
Enhanced cache recovery Detects & purges processor & cache errors. Recovers original data.
Dynamic I/O line bit repair (eRepair) Detects & bypasses failed memory pins.
PCI bus parity error retry Retries an I/O operation if an error occurs.
Figure 14: Key Power Systems Availability Optimization Technologies
Specialized features further minimize risks of data loss in the event of an unplanned outage. These include Remote Journaling (file and system changes may be automatically copied to a second server), Save While Active (backups may be performed without taking systems offline) and Independent Auxiliary Storage Pools (IASPs) (data may be mirrored to local or remotely located alternate systems).
Additional protection may be provided by IBM or third-party clustered failover solutions, IBM PowerHA SystemMirror for i, for example, builds upon IASP technology to provide more advanced database mirroring, failover and recovery. Synchronous or asynchronous replication may be employed.

International Technology Group 24
Although the amount of time required to failover and restart systems and reinstate data may vary, the “best practice” norm for use of PowerHA SystemMirror for i is that operations may be fully restored within two hours with little or no data loss. Users have achieved mainframe-class failover and recovery even for complex large-scale transactional workloads.
Energy Efficiency The high levels of concentration and capacity utilization enabled by Power Systems can deliver significant energy savings by enabling users to employ fewer physical servers.
This effect is magnified by industry-leading energy efficiency features. These include the following:
• Active Energy Manager software provides energy conservation functions that include monitoring, recording and analysis of energy usage and thermal loading; and the ability to allocate energy on a server-by-server basis as well as to set thresholds for individual server energy usage based on application priorities, time of day and other factors.
• EnergyScale technology is a set of built-in capabilities that employ an embedded controller, temperature sensors located throughout systems, and microcode to provide additional energy conservation functions. Combined use of Active Energy Manager and EnergyScale technology enables the functions summarized in figure 15.
FUNCTION DESCRIPTION
Thermal monitoring & reporting Monitor & display ambient temperatures, including inlet & exhaust temperatures; display & analyze trends.
Power trending Track & display power usage data; display & analyze trends.
Power saver mode Set/schedule reduction of voltage & frequency by fixed percentage within pre-‐determined to be safe operating limit.
Power capping Set/schedule “hard” & “soft” (flexible) energy usage caps; automatically throttle back voltage & frequency if system approaches cap.
CPU trending Determine actual CPU speed of processors for which power saver or power capping is active; display & analyze trends.
Dynamic power savings Automatically adjust voltage & frequency settings based on workload; select whether server operations should be optimized for energy efficiency or performance.
Power efficient fan control Setting of fan speed based on server usage & ambient temperatures; altitude input.
Processor core nap mode Automatic processor stop when idle
EnergyScale for I/O Automatic power-‐off of pluggable PCI adapters when idle.
Guaranteed Safety Features designed to ensure continued operation of the system during adverse power or thermal conditions.
Figure 15: Active Energy Manager and EnergyScale Functions for Power Systems
Power 750 models, and dual-socket configurations of Power 730 and 740 servers are qualified under the Energy Star program, which is managed by the U.S. Environmental Protection Agency and Department of Energy. The program sets industry standards for power supply and system energy efficiency.
Some functionally similar energy efficiency capabilities are implemented in hardware, software or both in x86 server platforms. However, as in other areas, POWER7 based systems benefit from more effective system-level design, superior microelectronics technology, and more in-depth integration and optimization across different hardware, microcode and software components.
International Technology Group 25
DETAILED DATA
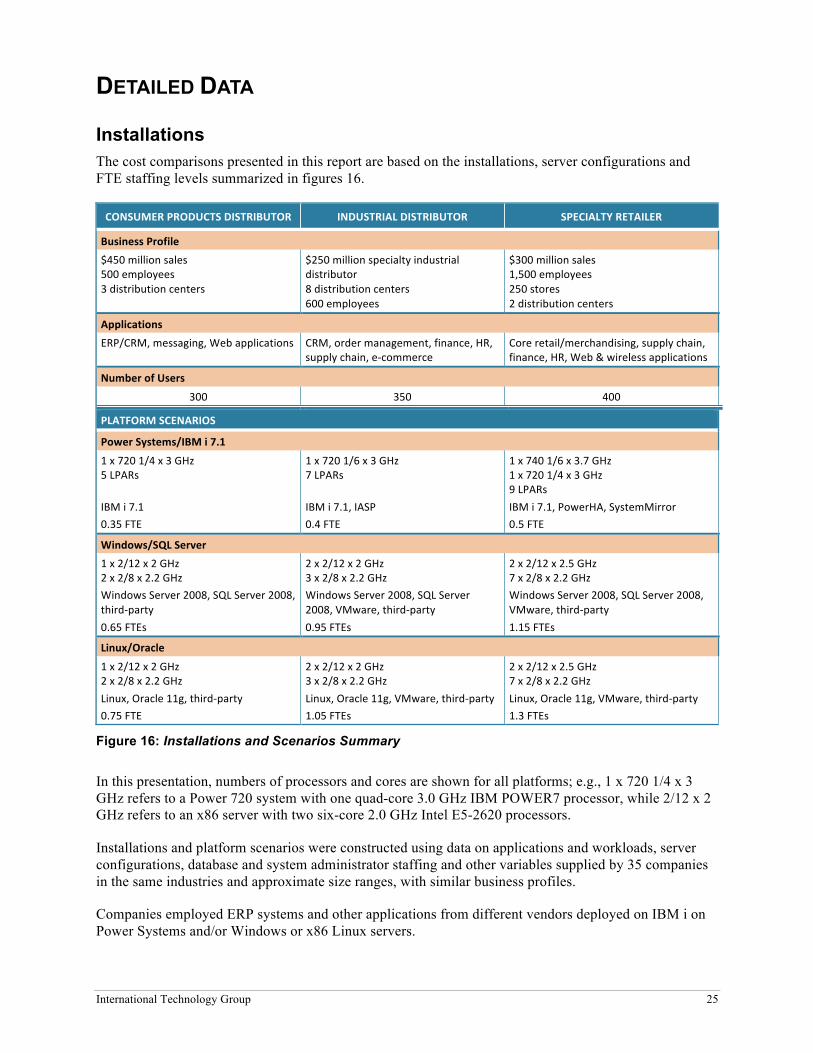
Installations The cost comparisons presented in this report are based on the installations, server configurations and FTE staffing levels summarized in figures 16.
CONSUMER PRODUCTS DISTRIBUTOR INDUSTRIAL DISTRIBUTOR SPECIALTY RETAILER
Business Profile
$450 million sales 500 employees 3 distribution centers
$250 million specialty industrial distributor 8 distribution centers 600 employees
$300 million sales 1,500 employees 250 stores 2 distribution centers
Applications
ERP/CRM, messaging, Web applications CRM, order management, finance, HR, supply chain, e-‐commerce
Core retail/merchandising, supply chain, finance, HR, Web & wireless applications
Number of Users
300 350 400
PLATFORM SCENARIOS
Power Systems/IBM i 7.1
1 x 720 1/4 x 3 GHz 5 LPARs
IBM i 7.1
0.35 FTE
1 x 720 1/6 x 3 GHz 7 LPARs
IBM i 7.1, IASP
0.4 FTE
1 x 740 1/6 x 3.7 GHz 1 x 720 1/4 x 3 GHz 9 LPARs
IBM i 7.1, PowerHA, SystemMirror
0.5 FTE
Windows/SQL Server
1 x 2/12 x 2 GHz 2 x 2/8 x 2.2 GHz
Windows Server 2008, SQL Server 2008, third-‐party
0.65 FTEs
2 x 2/12 x 2 GHz 3 x 2/8 x 2.2 GHz
Windows Server 2008, SQL Server 2008, VMware, third-‐party
0.95 FTEs
2 x 2/12 x 2.5 GHz 7 x 2/8 x 2.2 GHz
Windows Server 2008, SQL Server 2008, VMware, third-‐party
1.15 FTEs
Linux/Oracle
1 x 2/12 x 2 GHz 2 x 2/8 x 2.2 GHz
Linux, Oracle 11g, third-‐party
0.75 FTE
2 x 2/12 x 2 GHz 3 x 2/8 x 2.2 GHz
Linux, Oracle 11g, VMware, third-‐party
1.05 FTEs
2 x 2/12 x 2.5 GHz 7 x 2/8 x 2.2 GHz
Linux, Oracle 11g, VMware, third-‐party
1.3 FTEs
Figure 16: Installations and Scenarios Summary
In this presentation, numbers of processors and cores are shown for all platforms; e.g., 1 x 720 1/4 x 3 GHz refers to a Power 720 system with one quad-core 3.0 GHz IBM POWER7 processor, while 2/12 x 2 GHz refers to an x86 server with two six-core 2.0 GHz Intel E5-2620 processors.
Installations and platform scenarios were constructed using data on applications and workloads, server configurations, database and system administrator staffing and other variables supplied by 35 companies in the same industries and approximate size ranges, with similar business profiles.
Companies employed ERP systems and other applications from different vendors deployed on IBM i on Power Systems and/or Windows or x86 Linux servers.

International Technology Group 26
DISCRETE MANUFACTURER PROCESS MANUFACTURER AGRIBUSINESS COMPANY
Business Profile
$500 million sales 2,500 employees 5 manufacturing & distribution centers
$1 billion manufacturer of food & beverage products
6 manufacturing plants
2,000 employees
$1.5 billion sales 5,000 employees
10 production & distribution centers
Applications
ERP, CRM, supply chain, BI, e-‐commerce ERP, CRM, supply chain, e-‐commerce, departmental
ERP, procurement, BI, Web query, e-‐commerce, compliance, EDI
Number of Users
600 500 1,200
PLATFORM SCENARIOS
IBM i 7.1/ POWER SYSTEMS
1 x 740 1/6 x 3.7 GHz 1 x 720 1/4 x 3 GHz 10 LPARs
IBM i 7.1, PowerHA, SystemMirror
0.75 FTE
2 x 740 1/8 x 3.3 GHz 12 LPARs
IBM i 7.1, PowerHA, SystemMirror
0.65 FTE
2 x 740 2/12 x 3.7 GHz 17 LPARs
IBM i 7.1, PowerHA, SystemMirror
0.95 FTE
WINDOWS SERVER
2 x 4/24 x 1.86 GHz 1 x 2/8 x 2.4 GHz 7 x 2/8 x 2.2 GHz
Windows Server 2008, SQL Server 2008, VMware, third party
1.65 FTEs
2 x 4/32 x 2.13 GHz 6 x 2/12 x 2 GHz 1 x 2/8 x 2.4 GHz 1 x 2/8 x 2.2 GHz
Windows Server 2008, SQL Server 2008, VMware, third party
1.55 FTEs
2 x 4/32 x 2.13 GHz 1 x 4/24 x 1.86 GHz 1 x 2/12 x 2 GHz 2 x 2/8 x 2.4 GHz 7 x 2/8 x 2.2 GHz
Windows Server 2008, SQL Server 2008, VMware, third party
2.25 FTEs
x86 LINUX/ORACLE
2 x 4/24 x 1.86 GHz 1 x 2/8 x 2.4 GHz 7 x 2/8 x 2.2 GHz
Linux, Oracle 11g, VMware, third-‐party
1.9 FTEs
2 x 4/32 x 2.13 GHz 6 x 2/12 x 2 GHz 1 x 2/8 x 2.4 GHz 1 x 2/8 x 2.2 GHz
Linux, Oracle 11g, VMware, third-‐party
1.8 FTEs
2 x 4/32 x 2.13 GHz 1 x 4/24 x 1.86 GHz 1 x 2/12 x 2 GHz 2 x 2/8 x 2.4 GHz 7 x 2/8 x 2.2 GHz
Linux, Oracle 11g, VMware, third-‐party
2.5 FTEs
Figure 16 (cont.): Installations and Scenarios Summary
IT Cost Calculations IT costs were calculated as follows:
• Server costs include hardware and software license acquisition, along with three-year hardware maintenance and software update and support subscriptions. Maintenance and support costs are for vendor 24/7 coverage. Calculations were based on vendor list prices discounted to reflect prevailing street prices.
Power Systems were configured with IBM i 7.1 and PowerVM Standard or Enterprise Edition. In the four largest installations, POWER7 based systems form two-way failover clusters using IBM PowerHA SystemMirror for i.
x86 servers employed for comparisons were branded models equipped with Intel Xeon E5-2400, E5-2600 and E7-4800 series processors.

International Technology Group 27
Windows servers were configured with Windows Server 2008 R2 and, for database serving and development systems, SQL Server 2008 R2 Standard or Enterprise Edition. License costs for Microsoft software include Client Access Licenses (CALs). Software support costs are for Microsoft Software Assurance.
x86 Linux servers were configured with a major commercial Linux distribution, along with Oracle 11g Standard Edition or Enterprise Edition. Oracle configurations also include Diagnostics and Tuning Packs providing functionality equivalent to that incorporated by IBM in i 7.1, and by Microsoft in SQL Server 2008 at no additional charge.
Windows and x86 Linux/Oracle servers were also configured with third-party system management and security tools providing functionality corresponding to that of the IBM i 7.1 base offering. VMware ESXi 5 was employed for test and development serving, and for some production applications in the five largest installations.
Production Windows and x86 Linux/Oracle database servers in the five largest installations were configured in two-way clusters using a common third-party failover solution.
• Personnel costs were calculated based on annual average salaries of $87,851 for i 7.1 and Power Systems administrators handling database as well as system administration tasks; $75,908 and $76,889 for Windows and x86 Linux system administrators respectively; and $90,339 and $99,538 for SQL Server and Oracle DBAs respectively.
Salaries were increased by 52.6 percent to allow for benefits, bonuses, training and other personnel-related items. Overall costs were calculated for a three-year period.
• Facilities costs include data center occupancy and energy consumption by servers and by the data center infrastructure equipment supporting these.
Energy costs were calculated using vendor electricity consumption values for server configurations and data center equipment. Specific utilization levels and hours of operation for the installation were then applied, and a conservative assumption for average price per kilowatt/hour was employed to determine three-year costs.
Detailed breakdowns of IT costs are presented in figure 17.
Costs of Downtime Costs of downtime were calculated using a two-phase process.
First, average costs per hour of downtime were calculated for all companies using appropriate industry- and organization-specific values. “Average,” in this context, means that costs are based on overall annual volumes of business activity divided by hours of operation (in all three cases, 24 x 365 = 8,760).
The following costs were calculated:
• For manufacturers and distributors, supply chain disruption costs included costs incurred for planning and operational processes between initial customer queries and final delivery.
Calculations include costs of idle and underutilized capacity, including personnel; handling of delivery delays (including distribution center and transportation costs); additional inventory carrying costs; costs of customer billing delays; and costs of change for affected processes. Calculations also include costs of customer penalties such as late delivery and imperfect order fees, and remedial costs such as buyback rebates.

International Technology Group 28
Company Health Products
Distributor Industrial Distributor
Specialty Retailer
Discrete Manufacturer
Process Manufacturer
Agribusiness Company
IBM i 7.1/POWER SYSTEMS
Hardware 9,876 11,999 26,571 26,571 46,875 64,124
Maintenance 928 928 3,843 3,843 5,829 5,829
Software 20,699 52,377 100,953 118,560 203,036 304,545
Software support 6,617 22,794 47,297 55,444 98,754 149,592
Personnel 140,764 160,873 201,091 301,636 261,418 382,073
Facilities 3,396 4,275 8,124 8,320 9,979 11,147
TOTAL ($) 182,280 253,246 387,879 514,374 625,891 917,310
WINDOWS SERVER
Hardware 14,800 24,787 44,008 66,833 83,784 95,956
Maintenance 3,375 5,626 8,163 11,127 11,504 14,817
Software 58,547 87,509 103,410 169,110 234,453 315,600
Software support 46,526 68,964 79,736 125,028 171,473 215,227
Personnel 239,092 349,951 422,756 606,419 571,668 821,529
Facilities 5,948 8,013 11,237 19,769 25,597 30,964
TOTAL ($) 368,288 544,849 669,311 998,286 1,098,480 1,494,093
x86 LINUX/ORACLE
Hardware 14,800 24,787 44,008 66,833 83,784 95,956
Maintenance 3,375 5,626 8,163 11,127 11,504 14,817
Software 104,253 150,362 161,328 291,623 340,564 469,557
Software support 79,996 117,069 134,272 218,686 238,673 332,420
Personnel 289,920 405,888 499,072 736,193 700,993 952,576
Facilities 5,948 8,013 11,237 19,769 25,597 30,964
TOTAL ($) 498,292 711,745 858,080 1,344,230 1,401,115 1,896,290
Figure 17: Three-year IT Costs Breakdown
For manufacturing companies, calculations also allow for the effects of delays on production operations, including costs of supplier order, production scheduling and setup, and other changes.
• For the retail company, calculations included supply chain disruption costs as well as lost sales due to stockouts and, for the company’s Internet channel, inability to quote product availability and process customer orders due to outages.
Allowance was also made for costs due to disruption of store operations, including increased markdowns, set-up delays, handling and administrative costs for late and imperfect deliveries, and remedial actions such as re-ordering, display changes and restocking.
Second, average costs of downtime per hour were multiplied by numbers of hours of downtime per year for each platform. These were calculated based on user inputs. The focus was placed on downtime for underlying hardware and software platforms, rather than application downtime. Annual costs of downtime for each platform were then multiplied for three-year totals.
All IT costs and costs of downtime values were for the United States.

ABOUT THE INTERNATIONAL TECHNOLOGY GROUP ITG sharpens your awareness of what’s happening and your competitive edge
. . . this could affect your future growth and profit prospects
International Technology Group (ITG), established in 1983, is an independent research and management consulting firm specializing in information technology (IT) investment strategy, cost/benefit metrics, infrastructure studies, deployment tactics, business alignment and financial analysis.
ITG was an early innovator and pioneer in developing total cost of ownership (TCO) and return on investment (ROI) processes and methodologies. In 2004, the firm received a Decade of Education Award from the Information Technology Financial Management Association (ITFMA), the leading professional association dedicated to education and advancement of financial management practices in end-user IT organizations.
The firm has undertaken more than 120 major consulting projects, released more than 250 management reports and white papers and more than 1,800 briefings and presentations to individual clients, user groups, industry conferences and seminars throughout the world.
Client services are designed to provide factual data and reliable documentation to assist in the decision-making process. Information provided establishes the basis for developing tactical and strategic plans. Important developments are analyzed and practical guidance is offered on the most effective ways to respond to changes that may impact complex IT deployment agendas.
A broad range of services is offered, furnishing clients with the information necessary to complement their internal capabilities and resources. Customized client programs involve various combinations of the following deliverables:
Status Reports In-depth studies of important issues
Management Briefs Detailed analysis of significant developments
Management Briefings Periodic interactive meetings with management
Executive Presentations Scheduled strategic presentations for decision-makers
Email Communications Timely replies to informational requests
Telephone Consultation Immediate response to informational needs
Clients include a cross section of IT end users in the private and public sectors representing multinational corporations, industrial companies, financial institutions, service organizations, educational institutions, federal and state government agencies as well as IT system suppliers, software vendors and service firms. Federal government clients have included agencies within the Department of Defense (e.g., DISA), Department of Transportation (e.g., FAA) and Department of Treasury (e.g., US Mint).
International Technology Group 609 Pacific Avenue, Suite 102 Santa Cruz, California 95060-4406 Telephone: + 831-427-9260 Email: [email protected] Website: ITGforInfo.com