Embed Size (px)
Citation preview
Page 1 of 78
ISTEP+ Item Specifications
Mathematics 10
Item Specifications
for the Indiana Assessment
Grade 10 Mathematics
These item specifications serve as a foundational resource in the assessment development process. This
document is the first in a series of documents that will be made available in the future.
Item specifications identify the standards being assessed. In addition they provide information about
each of the related items including: evidence elicited, depth of knowledge (DOK), content limits and
constraints, item types, and sample item stems. Panels of content teachers at each grade level,
representative of Indiana student populations and in partnership with the Department of Education
developed the item specifications.
Overview
The rows of each item specification highlight key features of items included on Indiana assessments as
follows:
Reporting Category: The broad content category for the standard representing a segment or domain
of content approved by educators as key for reporting. Examples across content
areas may include: Number Sense in Mathematics (7.NS); Physical Science in
Science (4.PS); and Writing in English/Language Arts (9-10.W).
Standard: Each Indiana Academic Standard is noted under the Reporting Category.
Evidence Statement(s): Statements that describe the knowledge and skills that an assessment item
should elicit from students.
Content Limit(s)/
Constraint(s): Statements that list the boundaries or limits of assessment items for that
standard.
Depth of Knowledge: Webb’s Depth of Knowledge categorizes items by the complexity of thinking
required. Descriptions of each level are: (1) recall and reproduction, (2) skills
and concepts, (3) strategic thinking, and (4) extended thinking. For a complete
description of each go to:
https://www.doe.in.gov/sites/default/files/assessment/depth-knowledge-
powerpoint-algebra-i.pdf
Item Type(s): Five possible item types including multiple choice (MC), constructed response
(CR), technology-enhanced (TE), gridded response (GR), and extended response
(ER).
Sample Item Stem(s): Examples of item stems that satisfy the requirements of the specification.
Sample Item(s): Full example items that satisfy the requirements of the specifications.

Page 2 of 78
ISTEP+ Item Specifications
Mathematics 10
Reporting Category
Number Sense, Expressions, and Computation
Standard AI.RNE.1 Understand the hierarchy and relationships of numbers and sets of numbers within the real number system.
Evidence Statement(s)
N/A
Content Limit(s)/ Constraint(s)
Assessed in the classroom.
Depth of Knowledge
2
Item Type(s) Multiple Choice (MC), Technology-Enhanced (TE), Gridded Response (GR)
Sample Item Stem(s)
N/A
Page 3 of 78
ISTEP+ Item Specifications
Mathematics 10
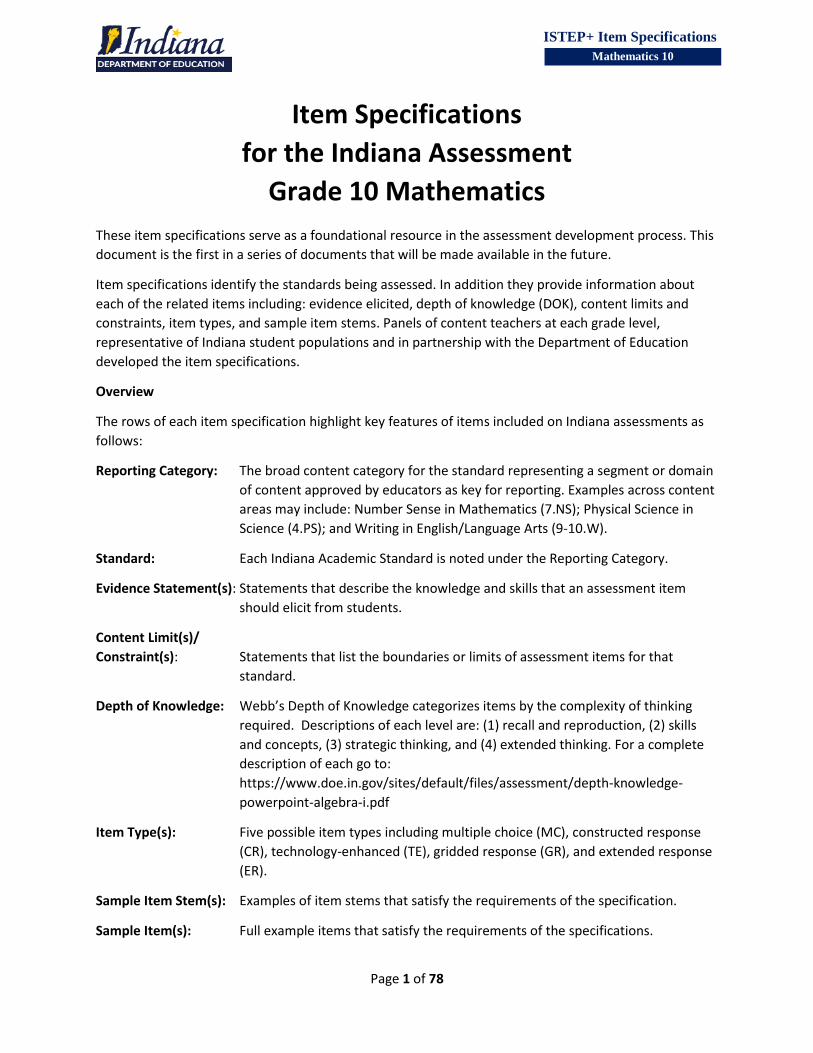
Reporting Category
Number Sense, Expressions, and Computation
Standard AI.RNE.2 - Explain why the sum or product of two rational numbers is rational; that the sum of a rational number and an irrational number is irrational; and that the product of a nonzero rational number and an irrational number is irrational.
Evidence Statement(s)
Students can identify true or false statements about sums or products of rational and/or irrational numbers. Students can create true statements about sums or products of rational and/or irrational numbers.
Content Limit(s)/ Constraint(s)
None
Depth of Knowledge
2
Item Type(s) Multiple Choice (MC), Technology-Enhanced (TE), Gridded Response (GR), Constructed Response (CR), Extended Response (ER)
Sample Item Stem(s)
Complete these statements to describe operations with rational and irrational numbers.
Sample Item (CR)
Page 4 of 78
ISTEP+ Item Specifications
Mathematics 10
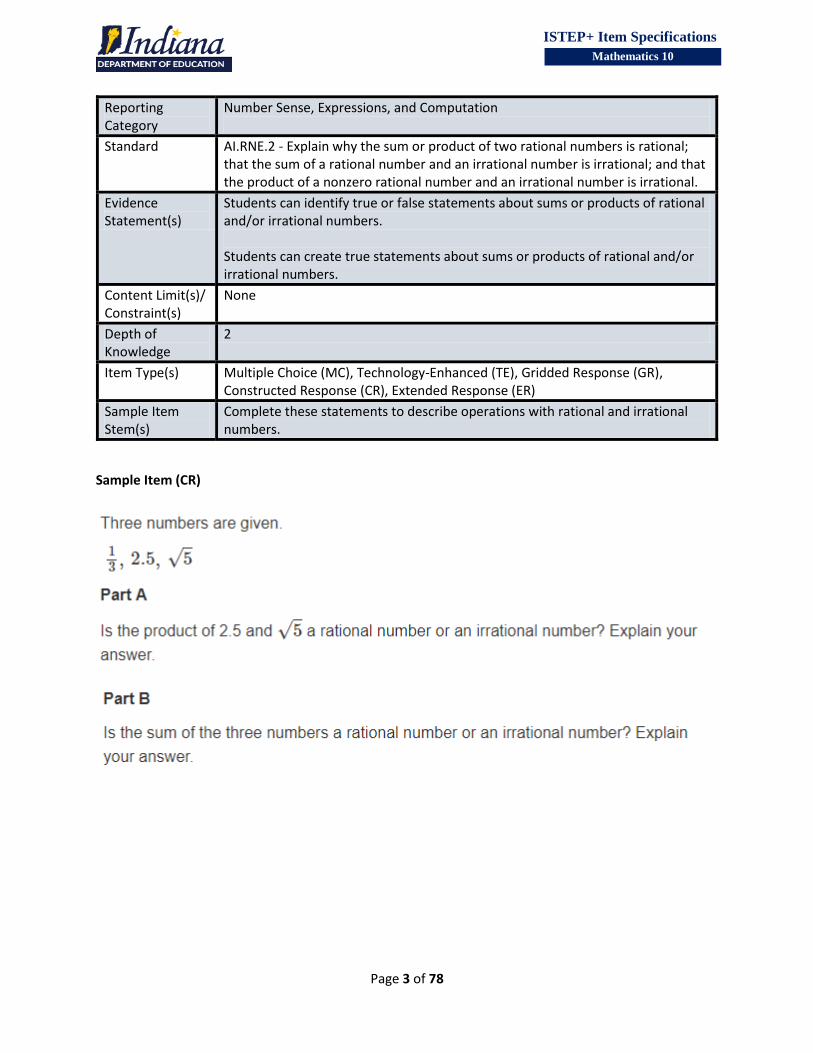
Reporting Category
Number Sense, Expressions, and Computation
Standard AI.RNE.3 - Rewrite and evaluate numeric expressions with positive rational exponents using the properties of exponents.
Evidence Statement(s)
Students can identify expressions equivalent to a given exponential expression by combining or simplifying exponents. Students can complete a process of simplifying a given exponential expression by combining or simplifying exponents.
Content Limit(s)/ Constraint(s)
Exponents should be limited to square and cube roots.
Depth of Knowledge
2
Item Type(s) Multiple Choice (MC), Technology-Enhanced (TE), Gridded Response (GR)
Sample Item Stem(s)
Which expression is equivalent to … ? The steps to simplify the expression … are shown. Arrange the steps in the order that could have been followed.
Page 5 of 78
ISTEP+ Item Specifications
Mathematics 10
Reporting Category
Number Sense, Expressions, and Computation
Standard AI.RNE.4 - Simplify square roots of non-perfect square integers and algebraic monomials.
Evidence Statement(s)
Students can identify expressions equivalent to a given expression involving square roots of non-perfect square integers and algebraic monomials. Students can generate expressions equivalent to a given expression involving square roots of non-perfect square integers and algebraic monomials.
Content Limit(s)/ Constraint(s)
None
Depth of Knowledge
2
Item Type(s) Multiple Choice (MC), Technology-Enhanced (TE), Gridded Response (GR)
Sample Item Stem(s)
Which expression is equivalent to … ? Fill in the blank so that the expression shown below is equivalent to … ?
Page 6 of 78
ISTEP+ Item Specifications
Mathematics 10
Reporting Category
Number Sense, Expressions, and Computation
Standard AI.RNE.5 - Simplify algebraic rational expressions, with numerators and denominators containing monomial bases with integer exponents, to equivalent forms.
Evidence Statement(s)
Students can identify equivalent rational expressions containing numerators and denominators of monomial bases with integer exponents.
Content Limit(s)/ Constraint(s)
None
Depth of Knowledge
2
Item Type(s) Multiple Choice (MC), Technology-Enhanced (TE), Gridded Response (GR)
Sample Item Stem(s)
Which expression is equivalent to the expression shown?

Page 7 of 78
ISTEP+ Item Specifications
Mathematics 10
Reporting Category
Number Sense, Expressions, and Computation
Standard AI.RNE.6 - Factor common terms from polynomials and factor polynomials completely. Factor the difference of two squares, perfect square trinomials, and other quadratic expressions.
Evidence Statement(s)
Students can identify equivalent expressions involving factored polynomials. Students can explain or justify a method for factoring a polynomial.
Content Limit(s)/ Constraint(s)
None
Depth of Knowledge
2
Item Type(s) Multiple Choice (MC), Technology-Enhanced (TE), Gridded Response (GR), Constructed Response (CR), Extended Response (ER)
Sample Item Stem(s)
Which expression is equivalent to … ? Completely factor the polynomial ….
Page 8 of 78
ISTEP+ Item Specifications
Mathematics 10
Reporting Category
Number Sense, Expressions, and Computation
Standard AI.RNE.7 - Understand polynomials are closed under the operations of addition, subtraction, and multiplication with integers; add, subtract, and multiply polynomials and divide polynomials by monomials.
Evidence Statement(s)
Students can identify equivalent expressions involving addition, subtraction, and multiplication of polynomials. Students can identify equivalent expressions involving division of polynomials by monomials. Students can create equivalent expressions involving addition, subtraction, and multiplication of polynomials. Students can create equivalent expressions involving division of polynomials by monomials.
Content Limit(s)/ Constraint(s)
Items should only assess second part of standard - "add, subtract, multiply, and divide."
Depth of Knowledge
2
Item Type(s) Multiple Choice (MC), Technology-Enhanced (TE), Gridded Response (GR)
Sample Item Stem(s)
Which expression is equivalent to … ? Select coefficient values to complete the expression shown.
Page 9 of 78
ISTEP+ Item Specifications
Mathematics 10
Reporting Category
Number Sense, Expressions, and Computation
Standard 8.NS.1 - Give examples of rational and irrational numbers and explain the difference between them. Understand that every number has a decimal expansion; for rational numbers, show that the decimal expansion terminates or repeats, and convert a decimal expansion that repeats into a rational number.
Evidence Statement(s)
Students can identify decimal equivalents to fractions. Students can identify the number line plot that represents a given irrational number. Students can explain conversion of fractions into decimals.
Content Limit(s)/ Constraint(s)
Items should be limited to using common irrational numbers (pi, square root of 2, square root of three). Items should not use log conversion. Use of repeating fractions is acceptable (ex. 1/9).
Depth of Knowledge
1
Item Type(s) Multiple Choice (MC), Technology-Enhanced (TE), Gridded Response (GR), Constructed Response (CR), Extended Response (ER)
Sample Item Stem(s)
Which decimal number is equivalent to … ? Which number line shows a point that best represents the value … ? Write the fractions … as decimals. Classify the decimal equivalents in terms of repeating or terminating decimals and rational or irrational numbers. Is the number … a rational or irrational number? Explain why it is rational or irrational.
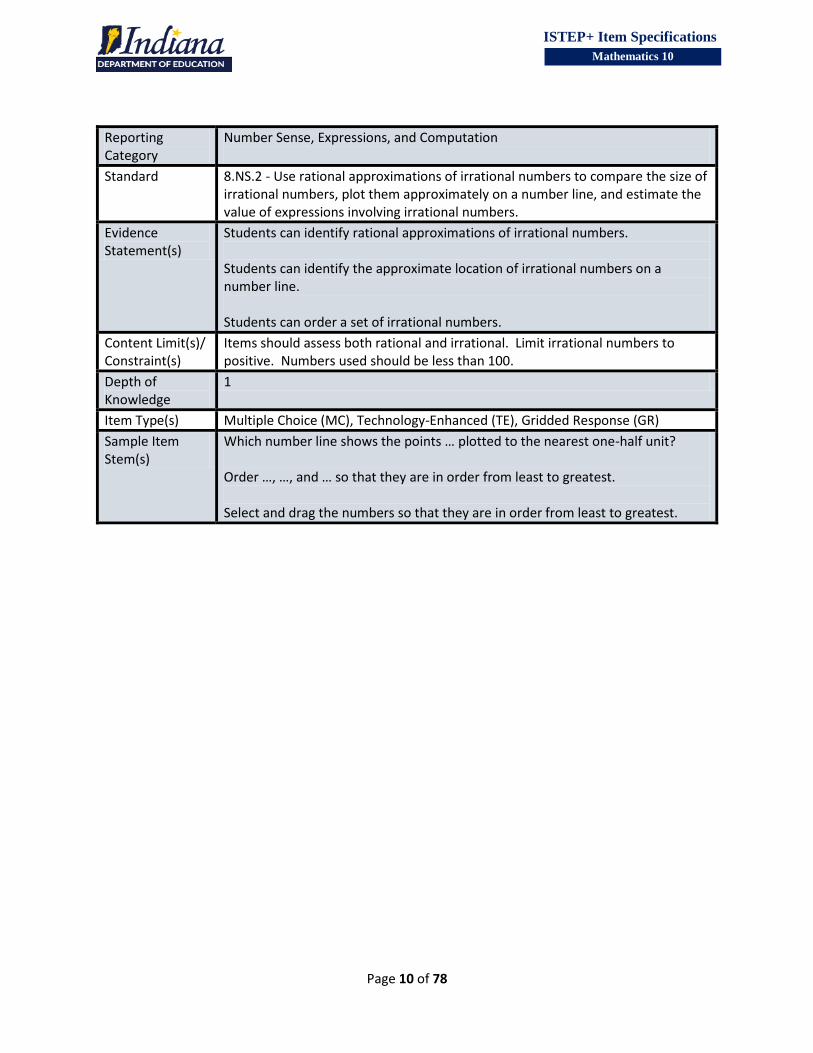
Page 10 of 78
ISTEP+ Item Specifications
Mathematics 10
Reporting Category
Number Sense, Expressions, and Computation
Standard 8.NS.2 - Use rational approximations of irrational numbers to compare the size of irrational numbers, plot them approximately on a number line, and estimate the value of expressions involving irrational numbers.
Evidence Statement(s)
Students can identify rational approximations of irrational numbers. Students can identify the approximate location of irrational numbers on a number line. Students can order a set of irrational numbers.
Content Limit(s)/ Constraint(s)
Items should assess both rational and irrational. Limit irrational numbers to positive. Numbers used should be less than 100.
Depth of Knowledge
1
Item Type(s) Multiple Choice (MC), Technology-Enhanced (TE), Gridded Response (GR)
Sample Item Stem(s)
Which number line shows the points … plotted to the nearest one-half unit? Order …, …, and … so that they are in order from least to greatest. Select and drag the numbers so that they are in order from least to greatest.
Page 11 of 78
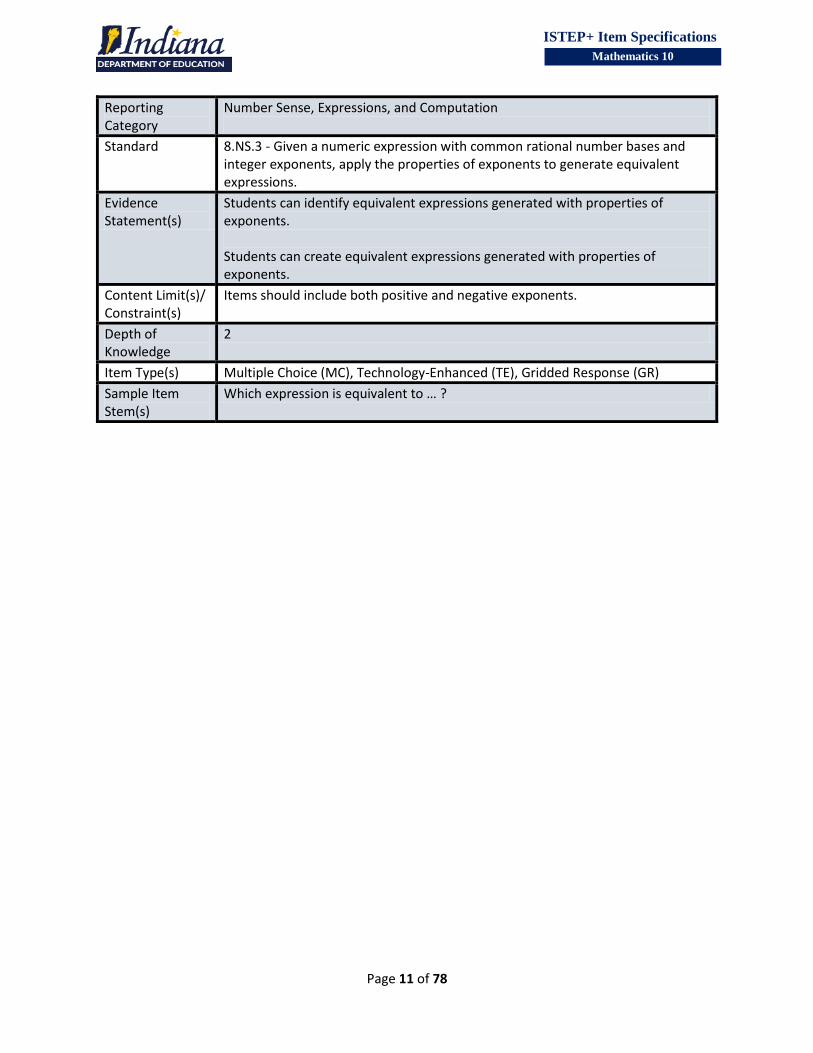
ISTEP+ Item Specifications
Mathematics 10
Reporting Category
Number Sense, Expressions, and Computation
Standard 8.NS.3 - Given a numeric expression with common rational number bases and integer exponents, apply the properties of exponents to generate equivalent expressions.
Evidence Statement(s)
Students can identify equivalent expressions generated with properties of exponents. Students can create equivalent expressions generated with properties of exponents.
Content Limit(s)/ Constraint(s)
Items should include both positive and negative exponents.
Depth of Knowledge
2
Item Type(s) Multiple Choice (MC), Technology-Enhanced (TE), Gridded Response (GR)
Sample Item Stem(s)
Which expression is equivalent to … ?
Page 12 of 78
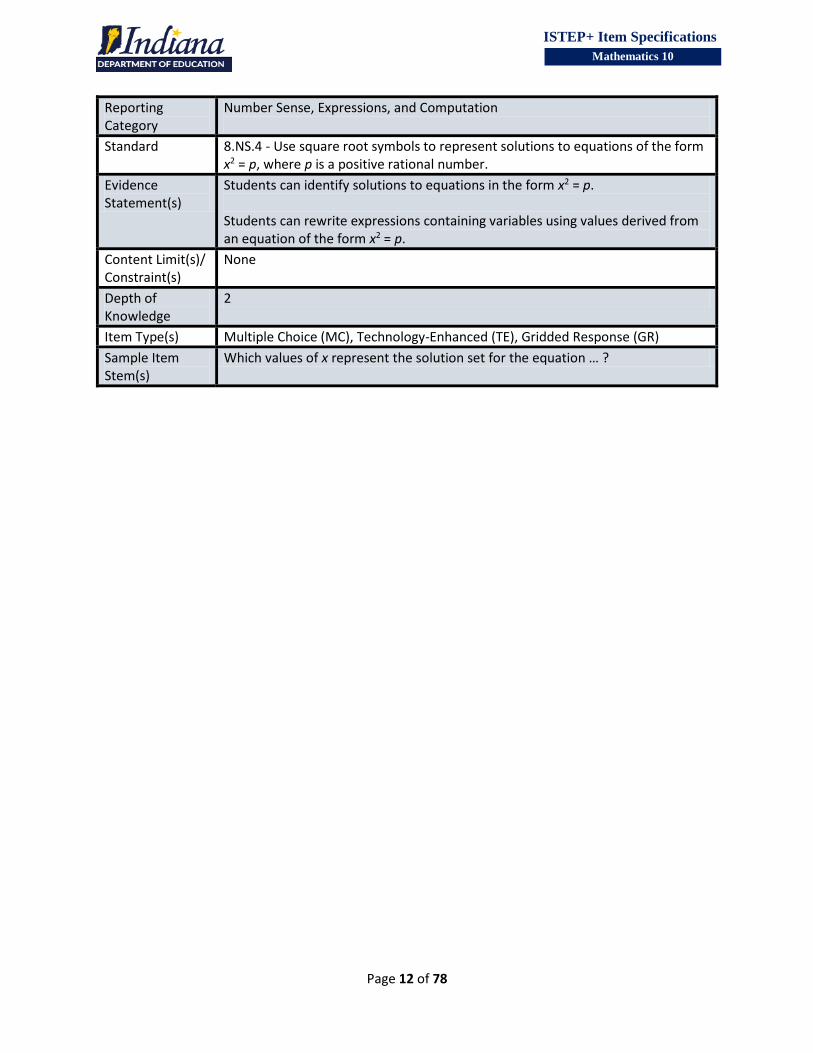
ISTEP+ Item Specifications
Mathematics 10
Reporting Category
Number Sense, Expressions, and Computation
Standard 8.NS.4 - Use square root symbols to represent solutions to equations of the form x2 = p, where p is a positive rational number.
Evidence Statement(s)
Students can identify solutions to equations in the form x2 = p. Students can rewrite expressions containing variables using values derived from an equation of the form x2 = p.
Content Limit(s)/ Constraint(s)
None
Depth of Knowledge
2
Item Type(s) Multiple Choice (MC), Technology-Enhanced (TE), Gridded Response (GR)
Sample Item Stem(s)
Which values of x represent the solution set for the equation … ?
Page 13 of 78
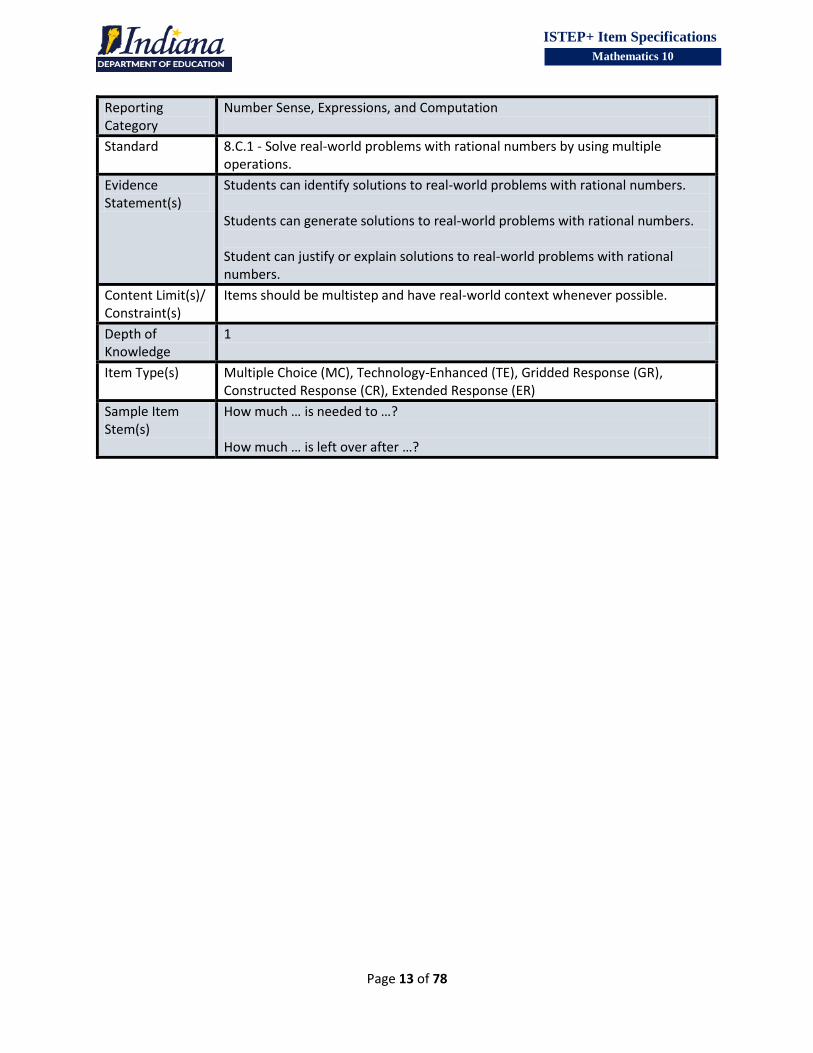
ISTEP+ Item Specifications
Mathematics 10
Reporting Category
Number Sense, Expressions, and Computation
Standard 8.C.1 - Solve real-world problems with rational numbers by using multiple operations.
Evidence Statement(s)
Students can identify solutions to real-world problems with rational numbers. Students can generate solutions to real-world problems with rational numbers. Student can justify or explain solutions to real-world problems with rational numbers.
Content Limit(s)/ Constraint(s)
Items should be multistep and have real-world context whenever possible.
Depth of Knowledge
1
Item Type(s) Multiple Choice (MC), Technology-Enhanced (TE), Gridded Response (GR), Constructed Response (CR), Extended Response (ER)
Sample Item Stem(s)
How much … is needed to …? How much … is left over after …?
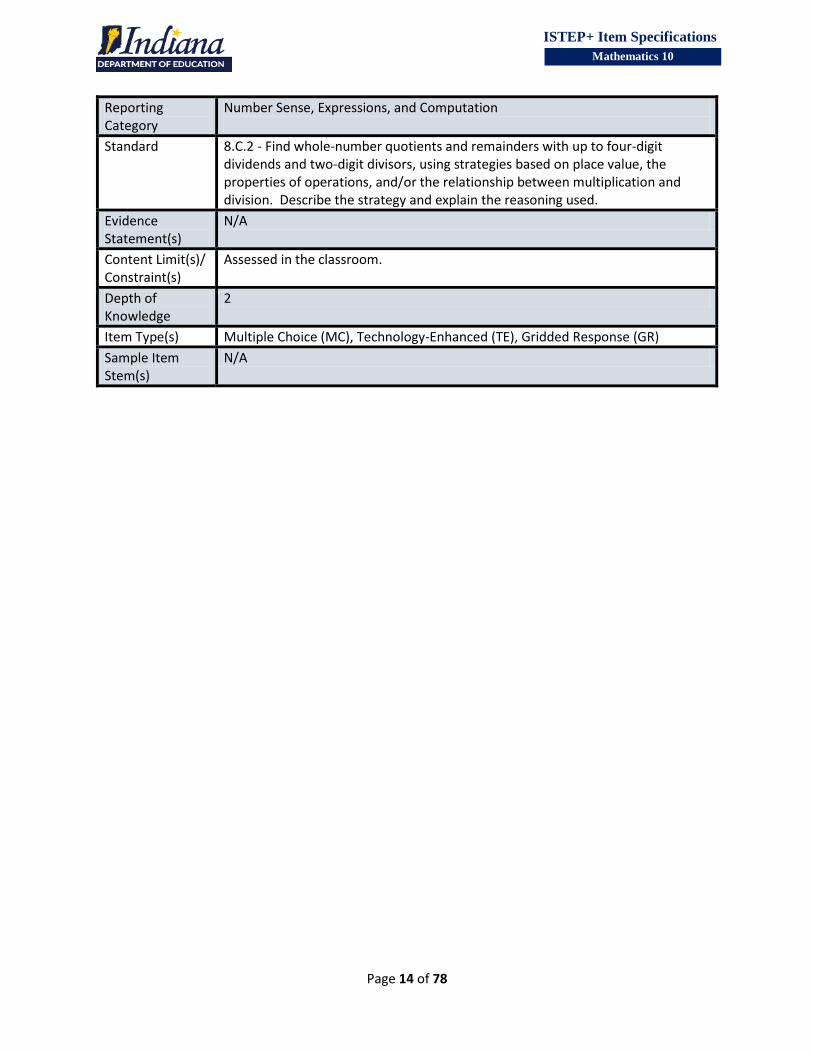
Page 14 of 78
ISTEP+ Item Specifications
Mathematics 10
Reporting Category
Number Sense, Expressions, and Computation
Standard 8.C.2 - Find whole-number quotients and remainders with up to four-digit dividends and two-digit divisors, using strategies based on place value, the properties of operations, and/or the relationship between multiplication and division. Describe the strategy and explain the reasoning used.
Evidence Statement(s)
N/A
Content Limit(s)/ Constraint(s)
Assessed in the classroom.
Depth of Knowledge
2
Item Type(s) Multiple Choice (MC), Technology-Enhanced (TE), Gridded Response (GR)
Sample Item Stem(s)
N/A

Page 15 of 78
ISTEP+ Item Specifications
Mathematics 10
Reporting Category
Geometry and Measurement
Standard 8.GM.1 - Identify, define and describe attributes of three-dimensional geometric objects (right rectangular prisms, cylinders, cones, spheres, and pyramids). Explore the effects of slicing these objects using appropriate technology and describe the two-dimensional figure that results.
Evidence Statement(s)
Students can identify features of a given three-dimensional geometric object. Students can relate cross sections of three-dimensional geometric objects to the two-dimensional figure that results.
Content Limit(s)/ Constraint(s)
None
Depth of Knowledge
2
Item Type(s) Multiple Choice (MC), Technology-Enhanced (TE), Gridded Response (GR)
Sample Item Stem(s)
How many … does a … have? What shape is made by …? Match each figure to … shape.
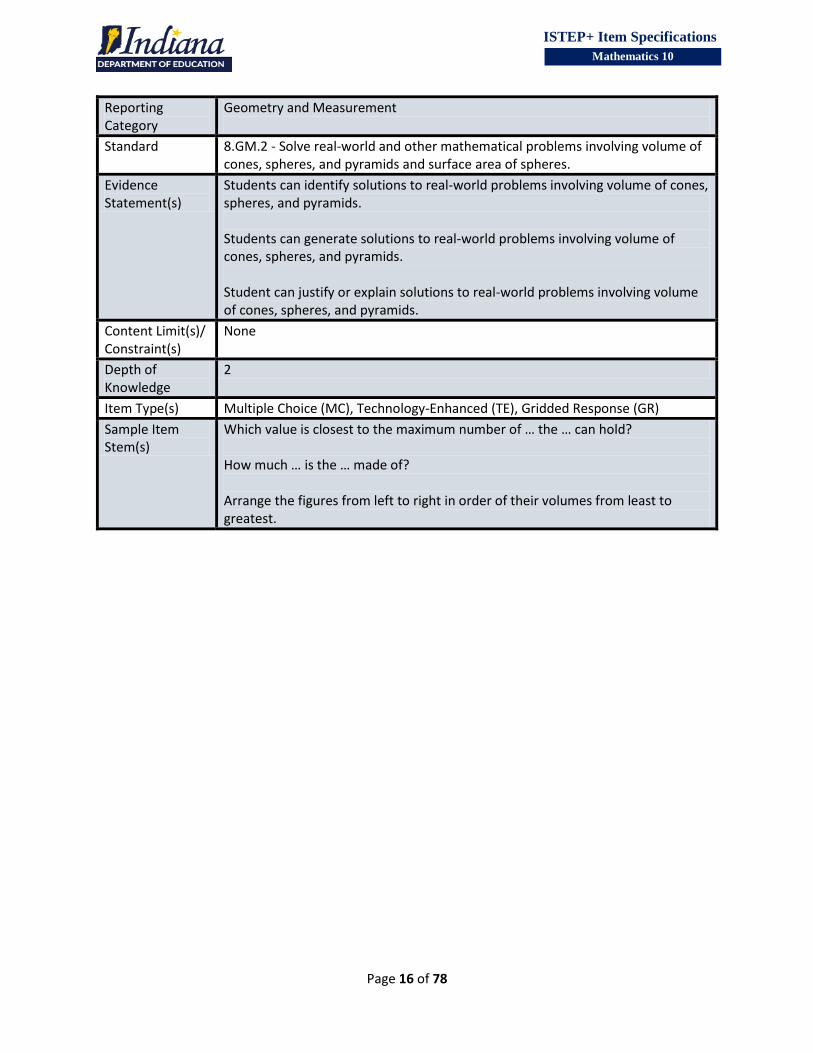
Page 16 of 78
ISTEP+ Item Specifications
Mathematics 10
Reporting Category
Geometry and Measurement
Standard 8.GM.2 - Solve real-world and other mathematical problems involving volume of cones, spheres, and pyramids and surface area of spheres.
Evidence Statement(s)
Students can identify solutions to real-world problems involving volume of cones, spheres, and pyramids. Students can generate solutions to real-world problems involving volume of cones, spheres, and pyramids. Student can justify or explain solutions to real-world problems involving volume of cones, spheres, and pyramids.
Content Limit(s)/ Constraint(s)
None
Depth of Knowledge
2
Item Type(s) Multiple Choice (MC), Technology-Enhanced (TE), Gridded Response (GR)
Sample Item Stem(s)
Which value is closest to the maximum number of … the … can hold? How much … is the … made of? Arrange the figures from left to right in order of their volumes from least to greatest.
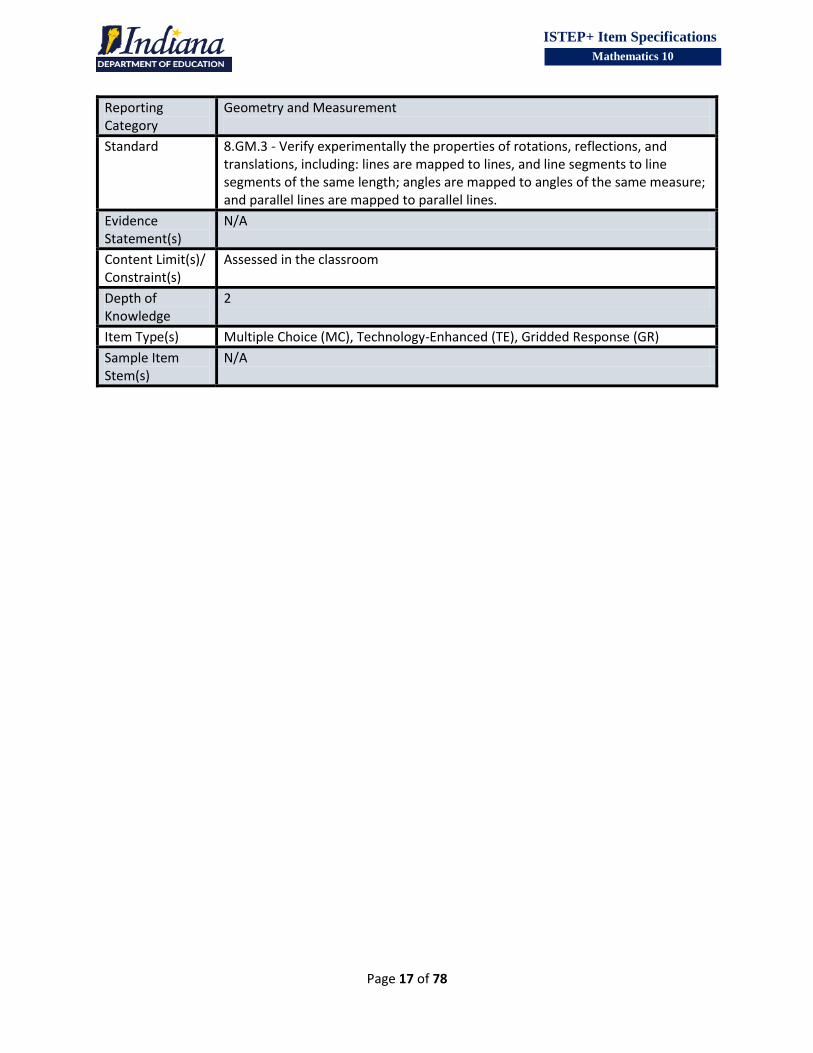
Page 17 of 78
ISTEP+ Item Specifications
Mathematics 10
Reporting Category
Geometry and Measurement
Standard 8.GM.3 - Verify experimentally the properties of rotations, reflections, and translations, including: lines are mapped to lines, and line segments to line segments of the same length; angles are mapped to angles of the same measure; and parallel lines are mapped to parallel lines.
Evidence Statement(s)
N/A
Content Limit(s)/ Constraint(s)
Assessed in the classroom
Depth of Knowledge
2
Item Type(s) Multiple Choice (MC), Technology-Enhanced (TE), Gridded Response (GR)
Sample Item Stem(s)
N/A
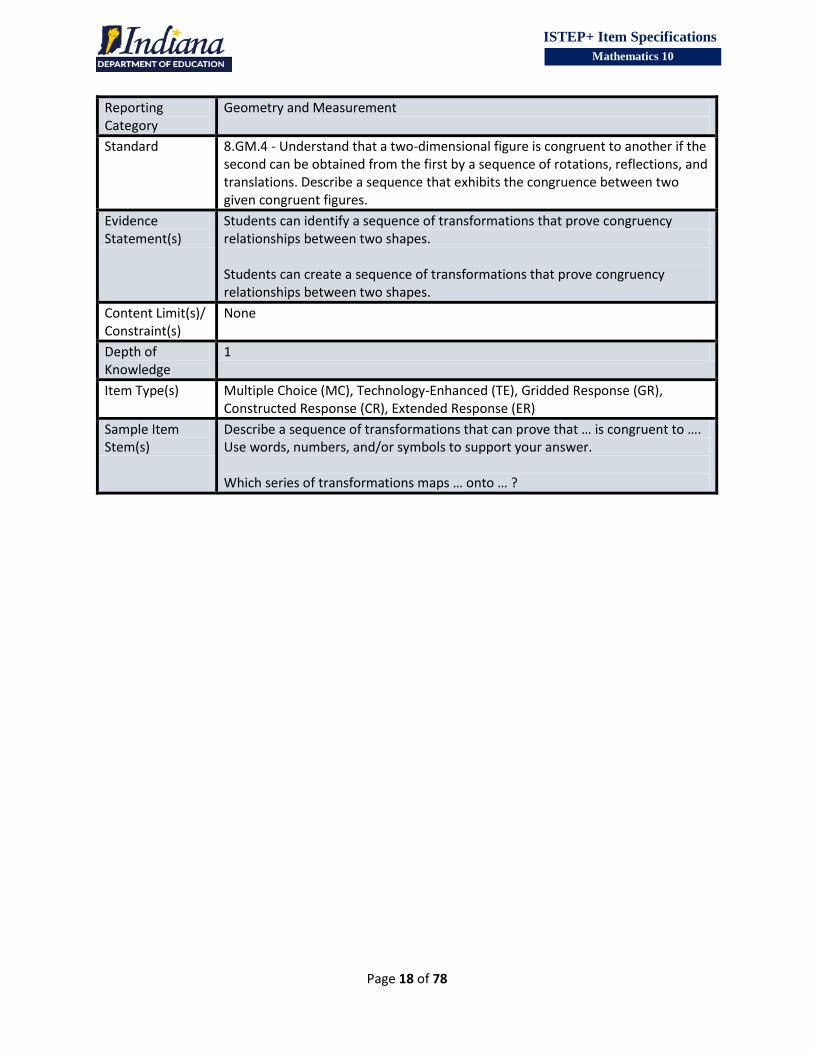
Page 18 of 78
ISTEP+ Item Specifications
Mathematics 10
Reporting Category
Geometry and Measurement
Standard 8.GM.4 - Understand that a two-dimensional figure is congruent to another if the second can be obtained from the first by a sequence of rotations, reflections, and translations. Describe a sequence that exhibits the congruence between two given congruent figures.
Evidence Statement(s)
Students can identify a sequence of transformations that prove congruency relationships between two shapes. Students can create a sequence of transformations that prove congruency relationships between two shapes.
Content Limit(s)/ Constraint(s)
None
Depth of Knowledge
1
Item Type(s) Multiple Choice (MC), Technology-Enhanced (TE), Gridded Response (GR), Constructed Response (CR), Extended Response (ER)
Sample Item Stem(s)
Describe a sequence of transformations that can prove that … is congruent to …. Use words, numbers, and/or symbols to support your answer. Which series of transformations maps … onto … ?
Page 19 of 78
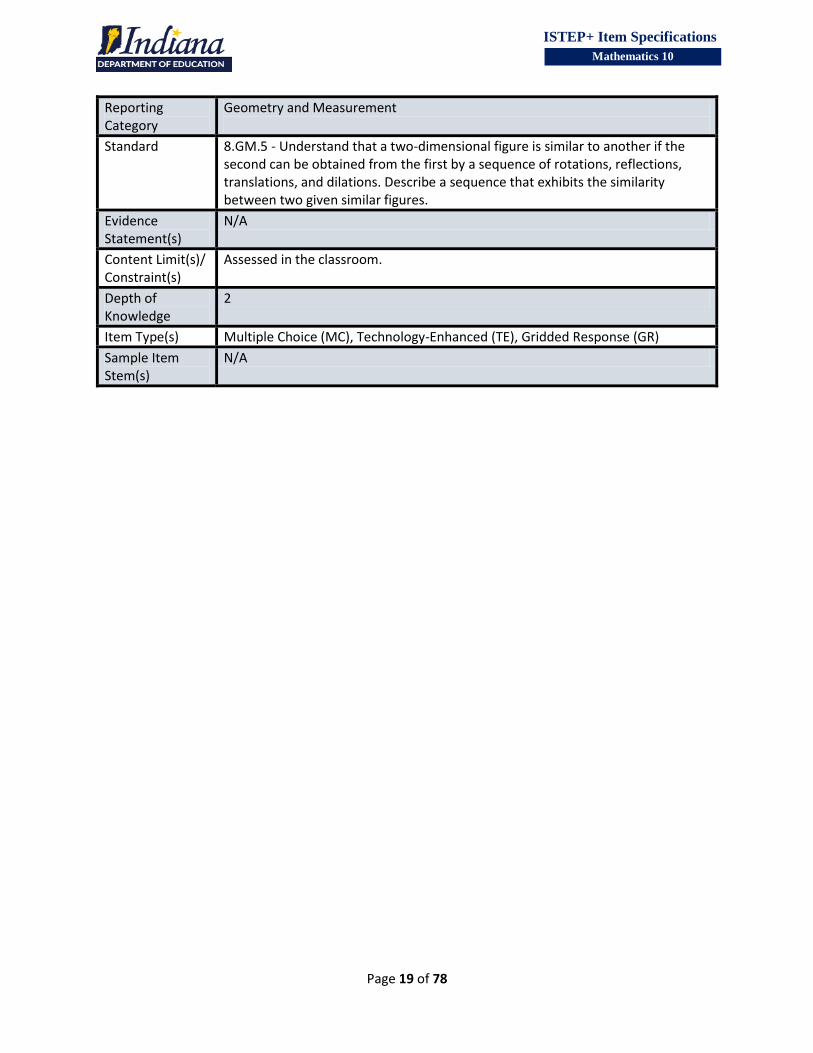
ISTEP+ Item Specifications
Mathematics 10
Reporting Category
Geometry and Measurement
Standard 8.GM.5 - Understand that a two-dimensional figure is similar to another if the second can be obtained from the first by a sequence of rotations, reflections, translations, and dilations. Describe a sequence that exhibits the similarity between two given similar figures.
Evidence Statement(s)
N/A
Content Limit(s)/ Constraint(s)
Assessed in the classroom.
Depth of Knowledge
2
Item Type(s) Multiple Choice (MC), Technology-Enhanced (TE), Gridded Response (GR)
Sample Item Stem(s)
N/A
Page 20 of 78
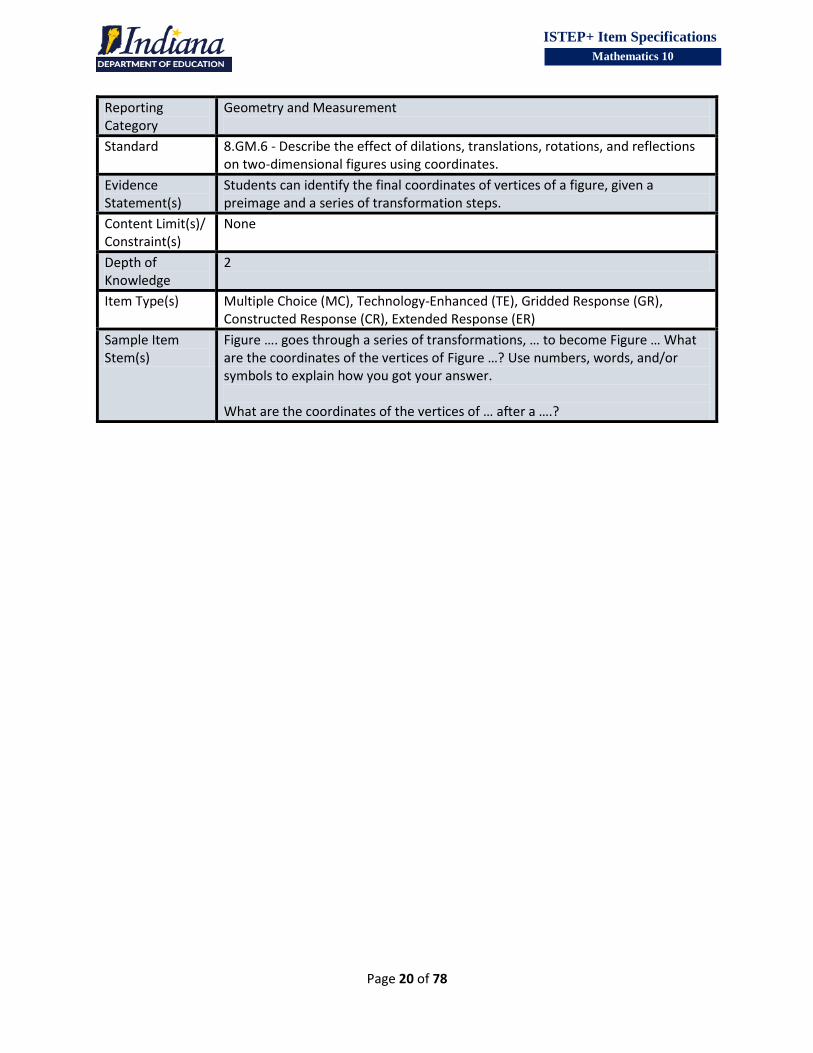
ISTEP+ Item Specifications
Mathematics 10
Reporting Category
Geometry and Measurement
Standard 8.GM.6 - Describe the effect of dilations, translations, rotations, and reflections on two-dimensional figures using coordinates.
Evidence Statement(s)
Students can identify the final coordinates of vertices of a figure, given a preimage and a series of transformation steps.
Content Limit(s)/ Constraint(s)
None
Depth of Knowledge
2
Item Type(s) Multiple Choice (MC), Technology-Enhanced (TE), Gridded Response (GR), Constructed Response (CR), Extended Response (ER)
Sample Item Stem(s)
Figure …. goes through a series of transformations, … to become Figure … What are the coordinates of the vertices of Figure …? Use numbers, words, and/or symbols to explain how you got your answer. What are the coordinates of the vertices of … after a ….?
Page 21 of 78
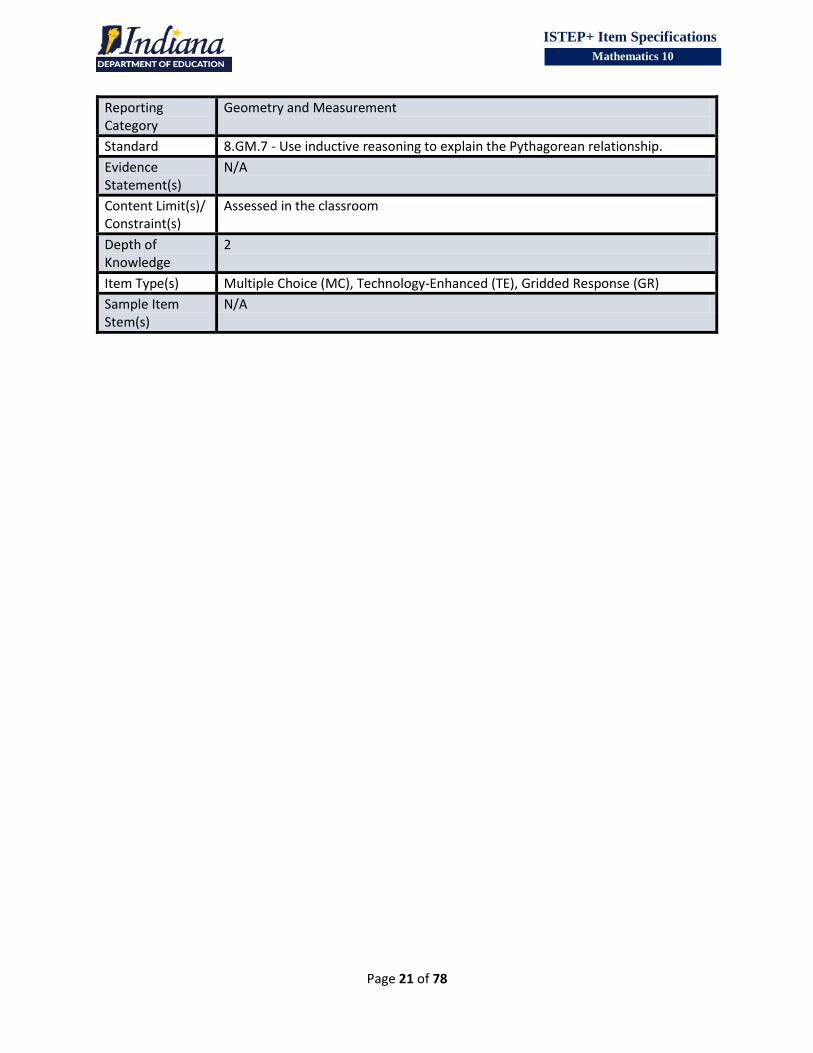
ISTEP+ Item Specifications
Mathematics 10
Reporting Category
Geometry and Measurement
Standard 8.GM.7 - Use inductive reasoning to explain the Pythagorean relationship.
Evidence Statement(s)
N/A
Content Limit(s)/ Constraint(s)
Assessed in the classroom
Depth of Knowledge
2
Item Type(s) Multiple Choice (MC), Technology-Enhanced (TE), Gridded Response (GR)
Sample Item Stem(s)
N/A
Page 22 of 78
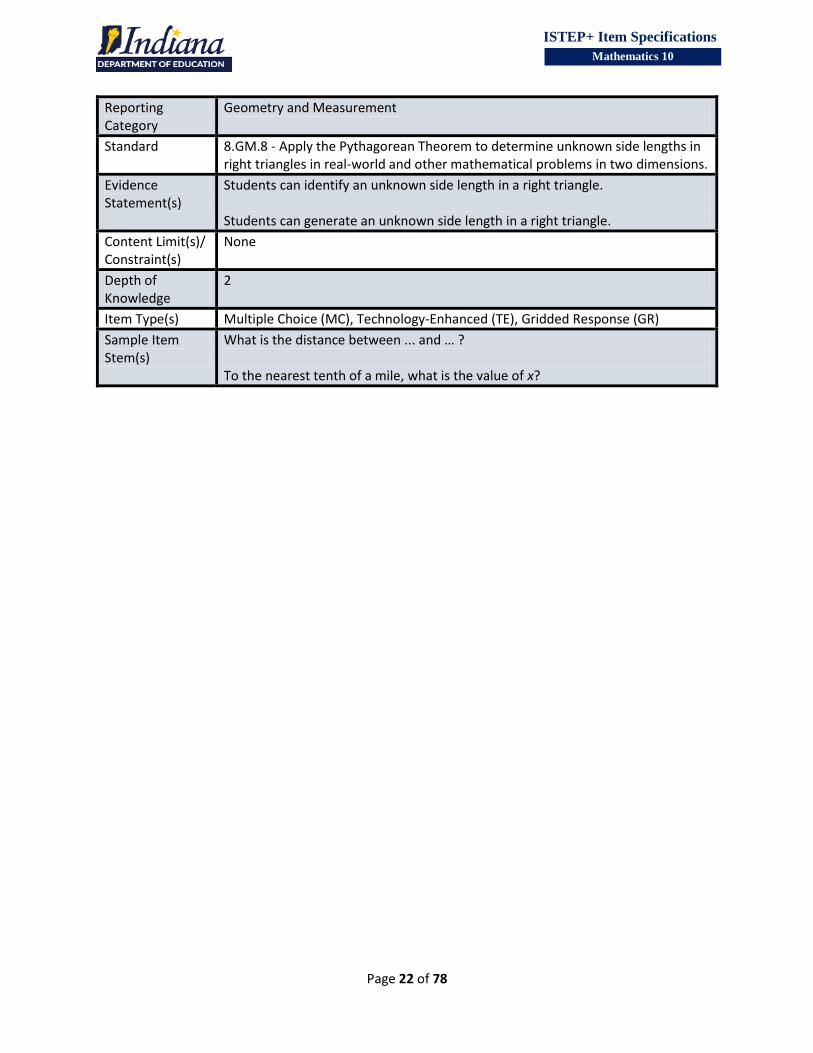
ISTEP+ Item Specifications
Mathematics 10
Reporting Category
Geometry and Measurement
Standard 8.GM.8 - Apply the Pythagorean Theorem to determine unknown side lengths in right triangles in real-world and other mathematical problems in two dimensions.
Evidence Statement(s)
Students can identify an unknown side length in a right triangle. Students can generate an unknown side length in a right triangle.
Content Limit(s)/ Constraint(s)
None
Depth of Knowledge
2
Item Type(s) Multiple Choice (MC), Technology-Enhanced (TE), Gridded Response (GR)
Sample Item Stem(s)
What is the distance between ... and … ? To the nearest tenth of a mile, what is the value of x?
Page 23 of 78
ISTEP+ Item Specifications
Mathematics 10
Reporting Category
Geometry and Measurement
Standard 8.GM.9 - Apply the Pythagorean Theorem to find the distance between two points in a coordinate plane.
Evidence Statement(s)
Students can identify an unknown distance between two points given on a coordinate plane. Students can generate an unknown distance between two points given on a coordinate plane.
Content Limit(s)/ Constraint(s)
Numbers used on coordinate plane should be integers.
Depth of Knowledge
2
Item Type(s) Multiple Choice (MC), Technology-Enhanced (TE), Gridded Response (GR), Constructed Response (CR), Extended Response (ER)
Sample Item Stem(s)
What is the shortest distance between … and … on the grid? Round your answer to the nearest tenth of a unit. Use words, numbers, and/or symbols to explain how you found your answer. To the nearest tenth, what is the distance, in kilometers, between … and …?
Page 24 of 78
ISTEP+ Item Specifications
Mathematics 10
Reporting Category
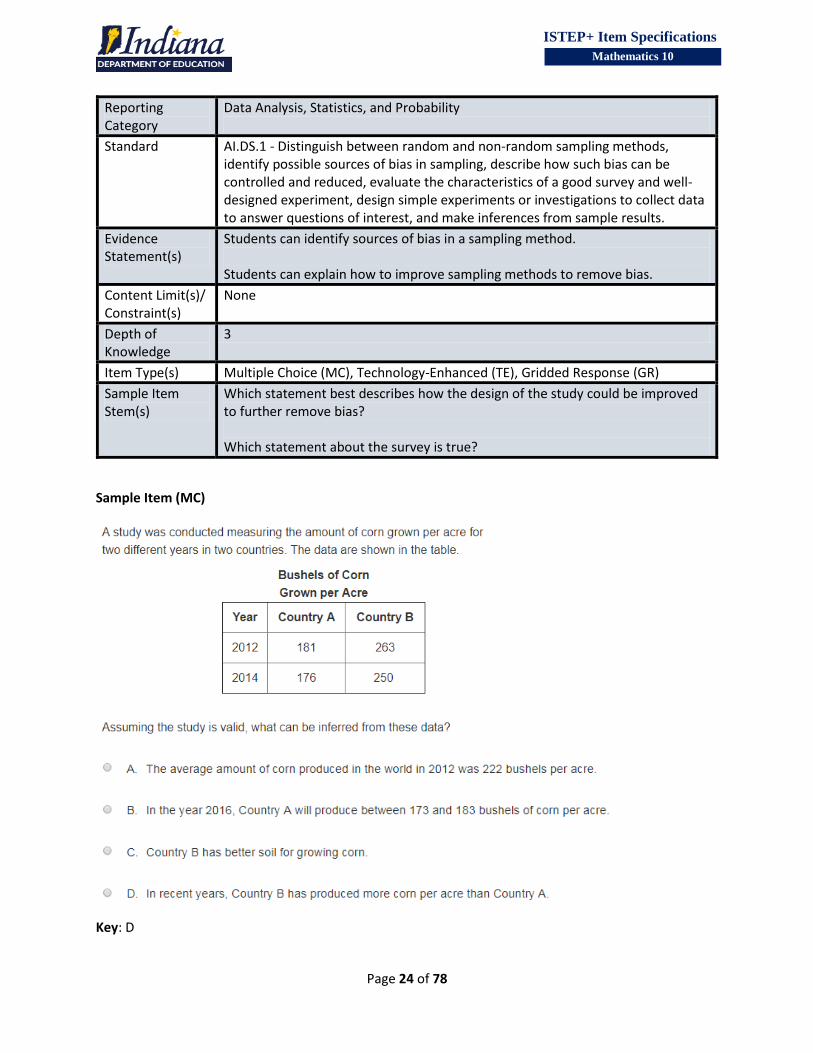
Data Analysis, Statistics, and Probability
Standard AI.DS.1 - Distinguish between random and non-random sampling methods, identify possible sources of bias in sampling, describe how such bias can be controlled and reduced, evaluate the characteristics of a good survey and well-designed experiment, design simple experiments or investigations to collect data to answer questions of interest, and make inferences from sample results.
Evidence Statement(s)
Students can identify sources of bias in a sampling method. Students can explain how to improve sampling methods to remove bias.
Content Limit(s)/ Constraint(s)
None
Depth of Knowledge
3
Item Type(s) Multiple Choice (MC), Technology-Enhanced (TE), Gridded Response (GR)
Sample Item Stem(s)
Which statement best describes how the design of the study could be improved to further remove bias? Which statement about the survey is true?
Sample Item (MC)
Key: D
Page 25 of 78
ISTEP+ Item Specifications
Mathematics 10
Reporting Category
Data Analysis, Statistics, and Probability
Standard AI.DS.2 - Graph bivariate data on a scatter plot and describe the relationship between the variables.
Evidence Statement(s)
N/A
Content Limit(s)/ Constraint(s)
Standard is assessed through 8.DSP.1
Depth of Knowledge
2
Item Type(s) Multiple Choice (MC), Technology-Enhanced (TE), Gridded Response (GR), Constructed Response (CR), Extended Response (ER)
Sample Item Stem(s)
N/A
Page 26 of 78
ISTEP+ Item Specifications
Mathematics 10
Reporting Category
Data Analysis, Statistics, and Probability
Standard AI.DS.3 - Use technology to find a linear function that models a relationship for a bivariate data set to make predictions; interpret the slope and y-intercept, and compute (using technology) and interpret the correlation coefficient.
Evidence Statement(s)
Students can identify the linear function that best approximates a given bivariate data set. Students can create a linear function to approximate a trend from a given bivariate data set. Students can identify the meaning of the slope or y-intercept for a given linear model for a real-world situation.
Content Limit(s)/ Constraint(s)
Items could also include constant functions.
Depth of Knowledge
2
Item Type(s) Multiple Choice (MC), Technology-Enhanced (TE), Gridded Response (GR)
Sample Item Stem(s)
Which linear function best models the data in the table? Use the data from the table to plot a line on the graph that can be used as a model to predict …. Click on the graph to plot any 2 of the 4 points to create a line.
Page 27 of 78
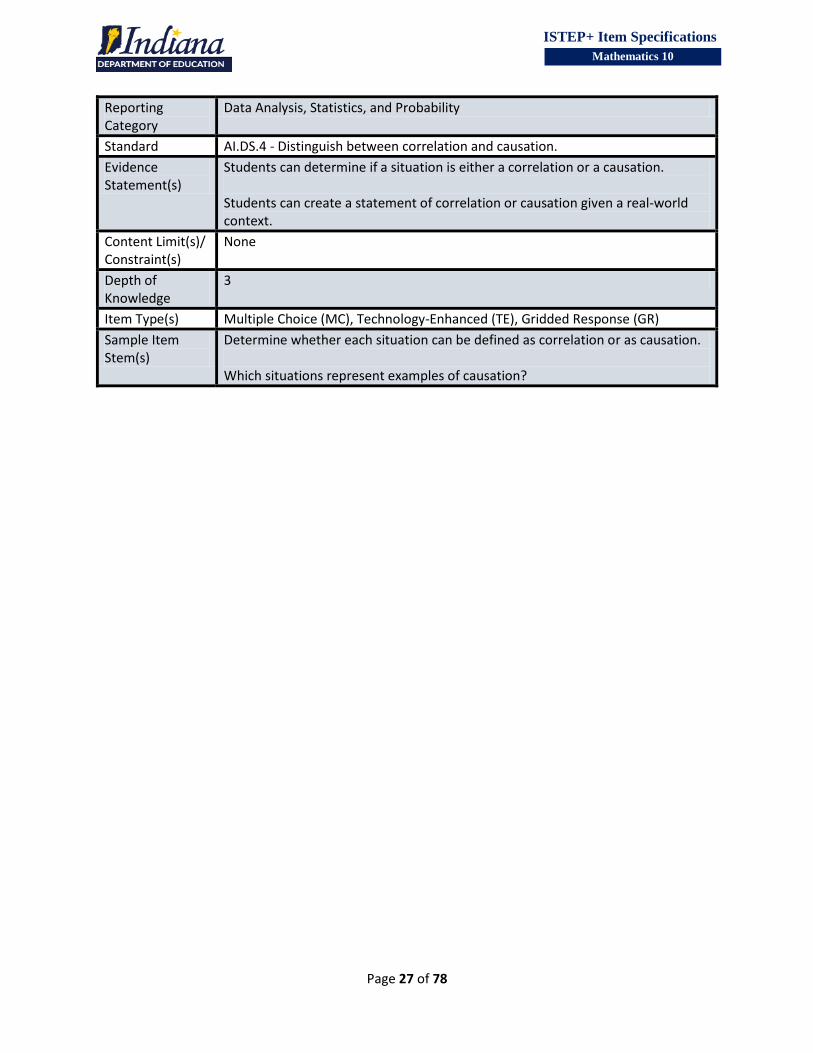
ISTEP+ Item Specifications
Mathematics 10
Reporting Category
Data Analysis, Statistics, and Probability
Standard AI.DS.4 - Distinguish between correlation and causation.
Evidence Statement(s)
Students can determine if a situation is either a correlation or a causation. Students can create a statement of correlation or causation given a real-world context.
Content Limit(s)/ Constraint(s)
None
Depth of Knowledge
3
Item Type(s) Multiple Choice (MC), Technology-Enhanced (TE), Gridded Response (GR)
Sample Item Stem(s)
Determine whether each situation can be defined as correlation or as causation. Which situations represent examples of causation?

Page 28 of 78
ISTEP+ Item Specifications
Mathematics 10
Reporting Category
Data Analysis, Statistics, and Probability
Standard AI.DS.5 - Understand that patterns of association can also be seen in bivariate categorical data by displaying frequencies and relative frequencies in a two-way table. Construct and interpret a two-way table summarizing data on two categorical variables collected from the same subjects. Use relative frequencies calculated for rows or columns (including joint, marginal, and conditional relative frequencies) to describe possible associations and trends in the data.
Evidence Statement(s)
N/A
Content Limit(s)/ Constraint(s)
Assessed in the classroom.
Depth of Knowledge
2
Item Type(s) Multiple Choice (MC), Technology-Enhanced (TE), Gridded Response (GR)
Sample Item Stem(s)
N/A

Page 29 of 78
ISTEP+ Item Specifications
Mathematics 10
Reporting Category
Data Analysis, Statistics, and Probability
Standard AI.DS.6 - Understand that statistics and data are non-neutral and designed to serve a particular interest. Analyze the possibilities for whose interest might be served and how the representations might be misleading.
Evidence Statement(s)
Students can identify causes of a given data presentation being misleading. Students can interpret a misleading data presentation to identify a valid conclusion. Students can explain the causes of a given data presentation being misleading.
Content Limit(s)/ Constraint(s)
None
Depth of Knowledge
3
Item Type(s) Multiple Choice (MC), Technology-Enhanced (TE), Gridded Response (GR)
Sample Item Stem(s)
What is misleading about the bar graph? Which statement BEST describes a situation that can cause a graph to be misleading?
Page 30 of 78
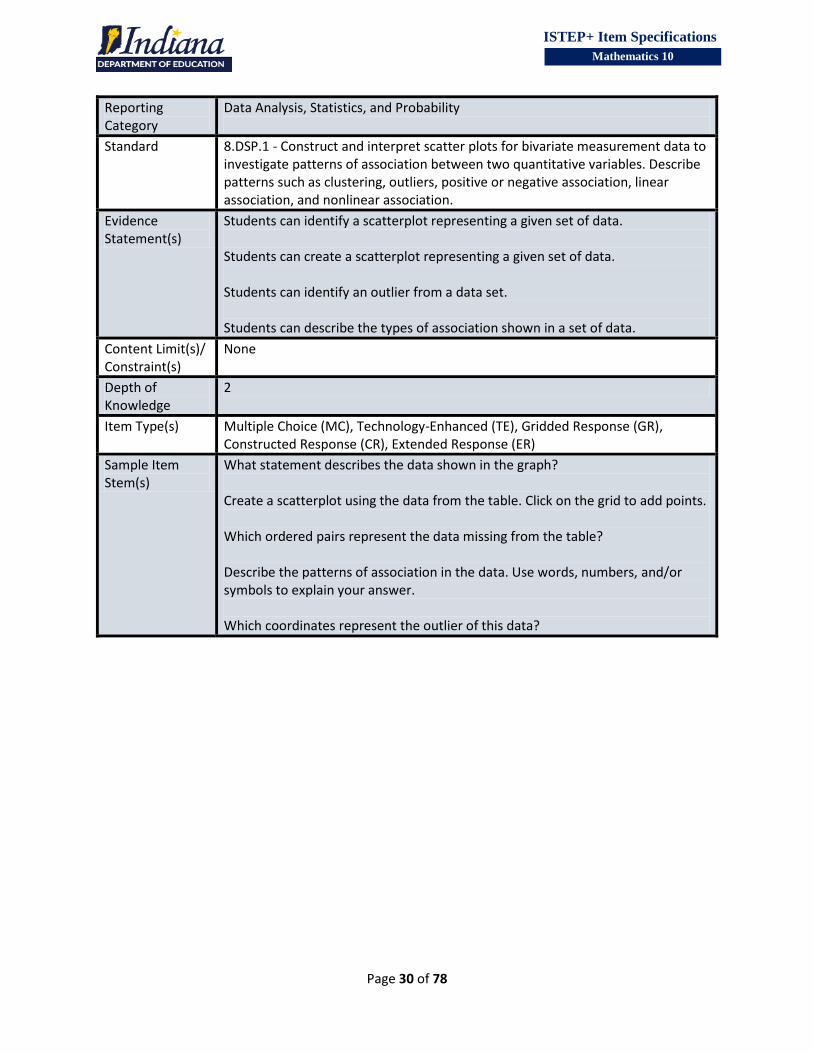
ISTEP+ Item Specifications
Mathematics 10
Reporting Category
Data Analysis, Statistics, and Probability
Standard 8.DSP.1 - Construct and interpret scatter plots for bivariate measurement data to investigate patterns of association between two quantitative variables. Describe patterns such as clustering, outliers, positive or negative association, linear association, and nonlinear association.
Evidence Statement(s)
Students can identify a scatterplot representing a given set of data. Students can create a scatterplot representing a given set of data. Students can identify an outlier from a data set. Students can describe the types of association shown in a set of data.
Content Limit(s)/ Constraint(s)
None
Depth of Knowledge
2
Item Type(s) Multiple Choice (MC), Technology-Enhanced (TE), Gridded Response (GR), Constructed Response (CR), Extended Response (ER)
Sample Item Stem(s)
What statement describes the data shown in the graph? Create a scatterplot using the data from the table. Click on the grid to add points. Which ordered pairs represent the data missing from the table? Describe the patterns of association in the data. Use words, numbers, and/or symbols to explain your answer. Which coordinates represent the outlier of this data?
Page 31 of 78
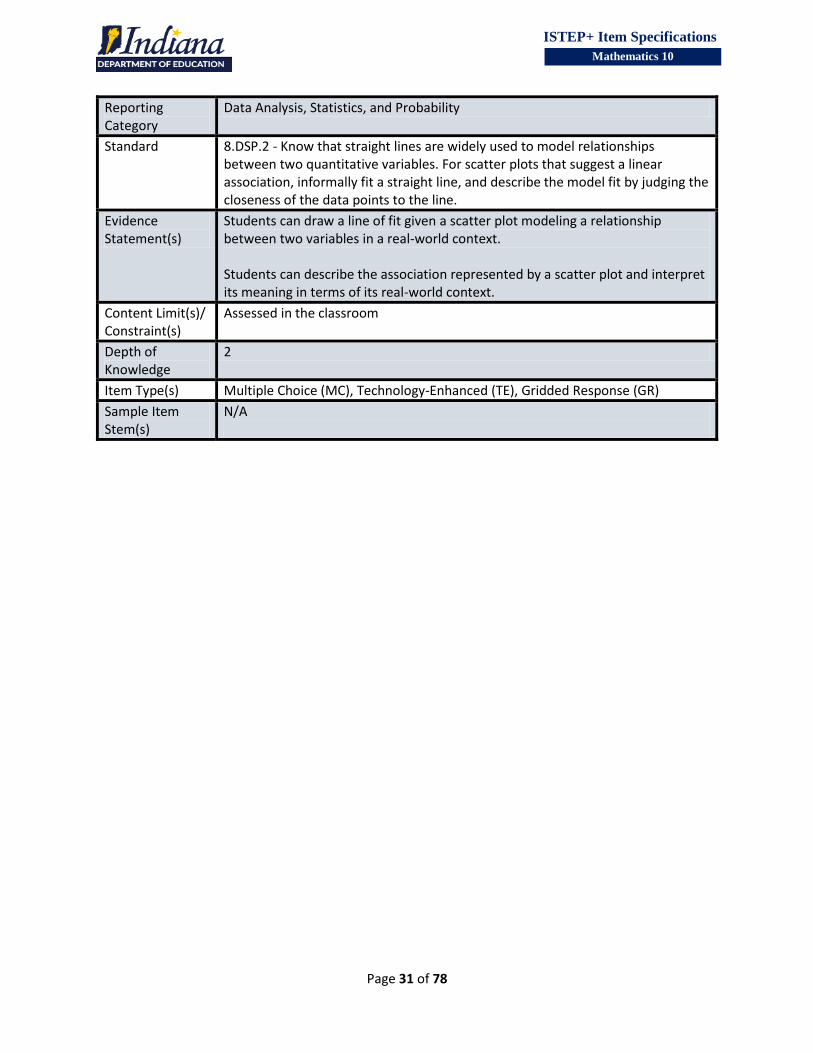
ISTEP+ Item Specifications
Mathematics 10
Reporting Category
Data Analysis, Statistics, and Probability
Standard 8.DSP.2 - Know that straight lines are widely used to model relationships between two quantitative variables. For scatter plots that suggest a linear association, informally fit a straight line, and describe the model fit by judging the closeness of the data points to the line.
Evidence Statement(s)
Students can draw a line of fit given a scatter plot modeling a relationship between two variables in a real-world context. Students can describe the association represented by a scatter plot and interpret its meaning in terms of its real-world context.
Content Limit(s)/ Constraint(s)
Assessed in the classroom
Depth of Knowledge
2
Item Type(s) Multiple Choice (MC), Technology-Enhanced (TE), Gridded Response (GR)
Sample Item Stem(s)
N/A
Page 32 of 78
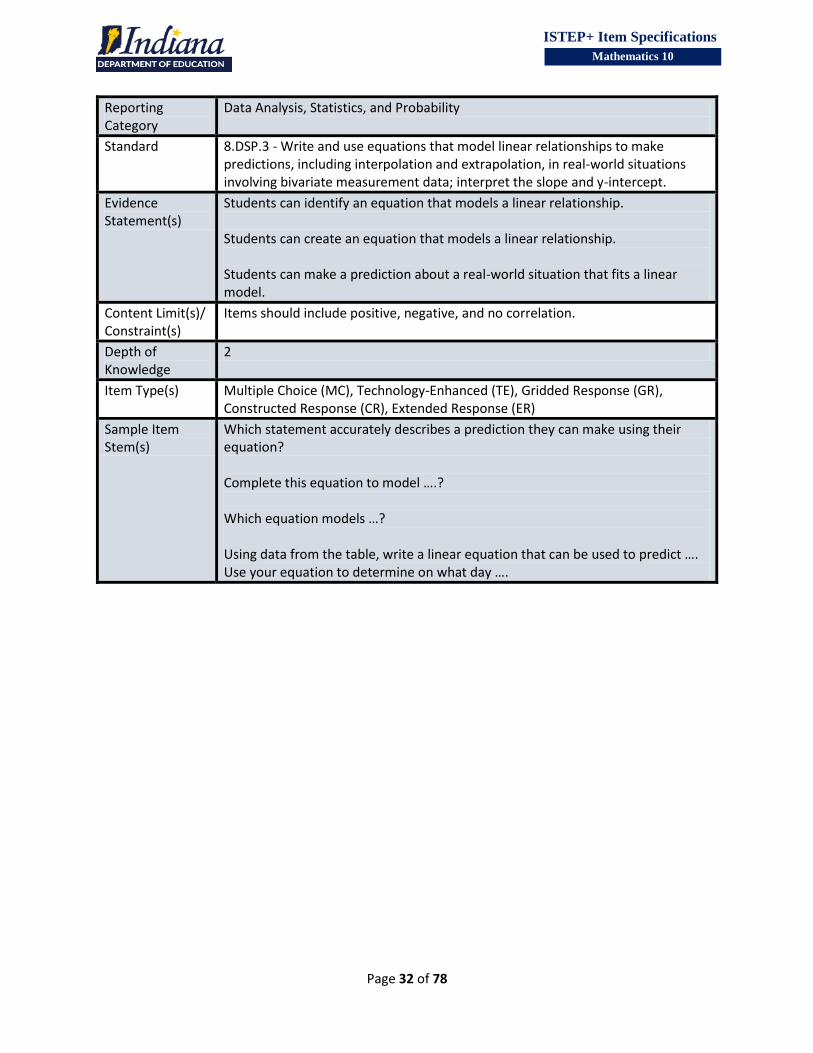
ISTEP+ Item Specifications
Mathematics 10
Reporting Category
Data Analysis, Statistics, and Probability
Standard 8.DSP.3 - Write and use equations that model linear relationships to make predictions, including interpolation and extrapolation, in real-world situations involving bivariate measurement data; interpret the slope and y-intercept.
Evidence Statement(s)
Students can identify an equation that models a linear relationship. Students can create an equation that models a linear relationship. Students can make a prediction about a real-world situation that fits a linear model.
Content Limit(s)/ Constraint(s)
Items should include positive, negative, and no correlation.
Depth of Knowledge
2
Item Type(s) Multiple Choice (MC), Technology-Enhanced (TE), Gridded Response (GR), Constructed Response (CR), Extended Response (ER)
Sample Item Stem(s)
Which statement accurately describes a prediction they can make using their equation? Complete this equation to model ….? Which equation models …? Using data from the table, write a linear equation that can be used to predict …. Use your equation to determine on what day ….
Page 33 of 78
ISTEP+ Item Specifications
Mathematics 10
Reporting Category
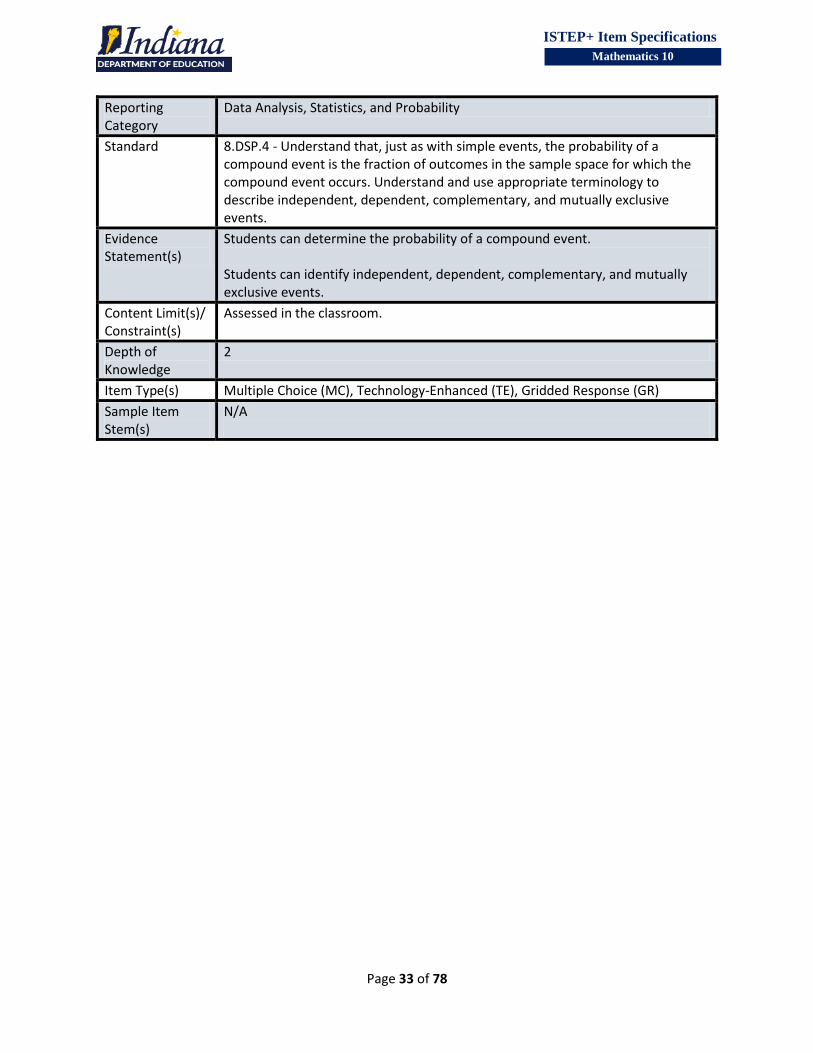
Data Analysis, Statistics, and Probability
Standard 8.DSP.4 - Understand that, just as with simple events, the probability of a compound event is the fraction of outcomes in the sample space for which the compound event occurs. Understand and use appropriate terminology to describe independent, dependent, complementary, and mutually exclusive events.
Evidence Statement(s)
Students can determine the probability of a compound event. Students can identify independent, dependent, complementary, and mutually exclusive events.
Content Limit(s)/ Constraint(s)
Assessed in the classroom.
Depth of Knowledge
2
Item Type(s) Multiple Choice (MC), Technology-Enhanced (TE), Gridded Response (GR)
Sample Item Stem(s)
N/A

Page 34 of 78
ISTEP+ Item Specifications
Mathematics 10
Reporting Category
Data Analysis, Statistics, and Probability
Standard 8.DSP.5 - Represent sample spaces and find probabilities of compound events (independent and dependent) using methods, such as organized lists, tables, and tree diagrams.
Evidence Statement(s)
Students can identify the probability of an outcome based on possible outcomes. Students can identify possible outcomes given a description of a compound event scenario.
Content Limit(s)/ Constraint(s)
None
Depth of Knowledge
2
Item Type(s) Multiple Choice (MC), Technology-Enhanced (TE), Gridded Response (GR)
Sample Item Stem(s)
Which pairs of numbers could be outcomes of picking a number from each list? Based on the tree diagram, what is the probability that …?
Sample Item (MC)
Key: A
Page 35 of 78
ISTEP+ Item Specifications
Mathematics 10
Reporting Category
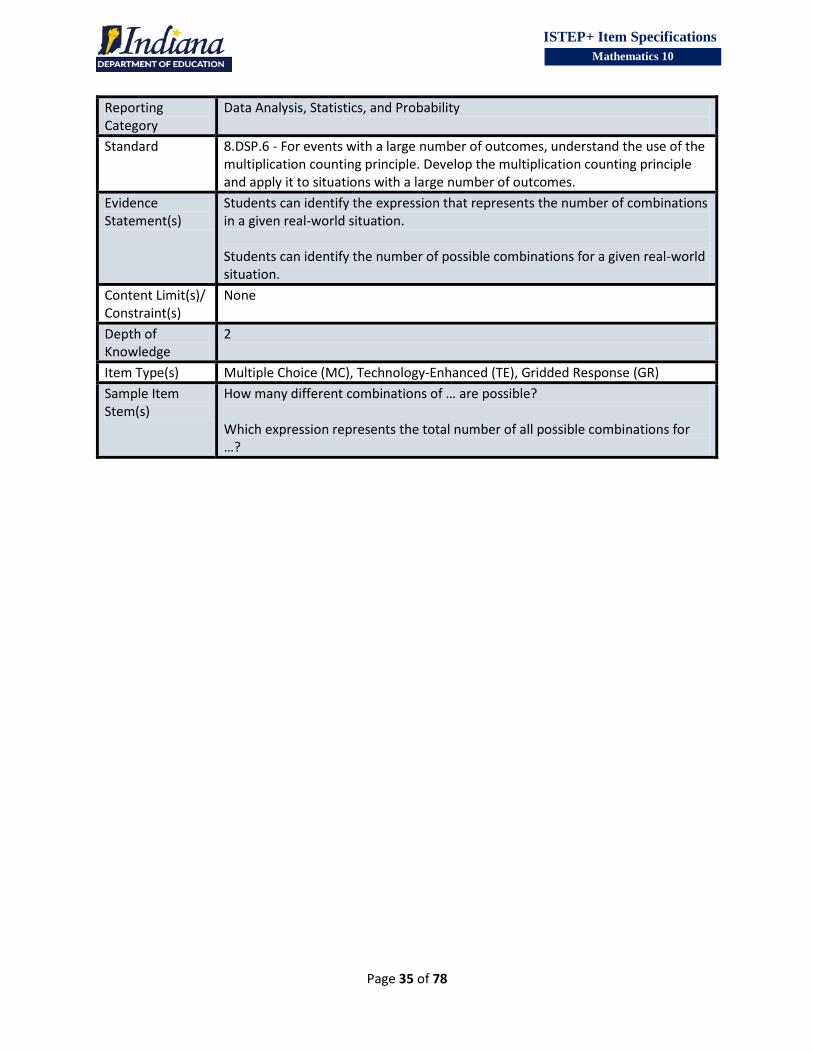
Data Analysis, Statistics, and Probability
Standard 8.DSP.6 - For events with a large number of outcomes, understand the use of the multiplication counting principle. Develop the multiplication counting principle and apply it to situations with a large number of outcomes.
Evidence Statement(s)
Students can identify the expression that represents the number of combinations in a given real-world situation. Students can identify the number of possible combinations for a given real-world situation.
Content Limit(s)/ Constraint(s)
None
Depth of Knowledge
2
Item Type(s) Multiple Choice (MC), Technology-Enhanced (TE), Gridded Response (GR)
Sample Item Stem(s)
How many different combinations of … are possible? Which expression represents the total number of all possible combinations for …?

Page 36 of 78
ISTEP+ Item Specifications
Mathematics 10
Reporting Category
Linear Equations, Inequalities, and Functions
Standard AI.L.1 - Understand that the steps taken when solving linear equations create new equations that have the same solution as the original. Solve fluently linear equations and inequalities in one variable with integers, fractions, and decimals as coefficients. Explain and justify each step in solving an equation, starting from the assumption that the original equation has a solution. Justify the choice of a solution method.
Evidence Statement(s)
Students can identify the value for an unknown variable in a given equation. Students can justify or explain a solution method for a given equation.
Content Limit(s)/ Constraint(s)
None
Depth of Knowledge
2
Item Type(s) Multiple Choice (MC), Technology-Enhanced (TE), Gridded Response (GR), Constructed Response (CR), Extended Response (ER)
Sample Item Stem(s)
What is the value of x in the equation …? The first step a student uses to solve the equation is shown. Could this step be used to correctly solve the equation? Explain your answer.
Page 37 of 78
ISTEP+ Item Specifications
Mathematics 10
Reporting Category
Linear Equations, Inequalities, and Functions
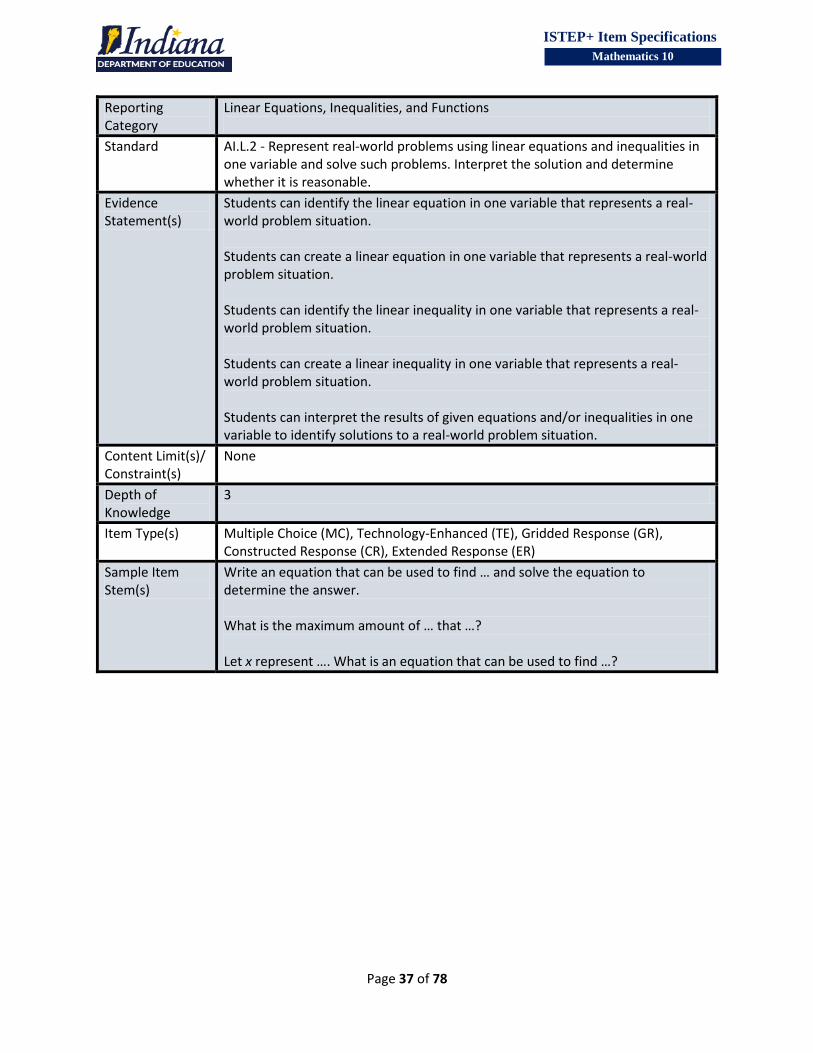
Standard AI.L.2 - Represent real-world problems using linear equations and inequalities in one variable and solve such problems. Interpret the solution and determine whether it is reasonable.
Evidence Statement(s)
Students can identify the linear equation in one variable that represents a real-world problem situation. Students can create a linear equation in one variable that represents a real-world problem situation. Students can identify the linear inequality in one variable that represents a real-world problem situation. Students can create a linear inequality in one variable that represents a real-world problem situation. Students can interpret the results of given equations and/or inequalities in one variable to identify solutions to a real-world problem situation.
Content Limit(s)/ Constraint(s)
None
Depth of Knowledge
3
Item Type(s) Multiple Choice (MC), Technology-Enhanced (TE), Gridded Response (GR), Constructed Response (CR), Extended Response (ER)
Sample Item Stem(s)
Write an equation that can be used to find … and solve the equation to determine the answer. What is the maximum amount of … that …? Let x represent …. What is an equation that can be used to find …?
Page 38 of 78
ISTEP+ Item Specifications
Mathematics 10
Reporting Category
Linear Equations, Inequalities, and Functions
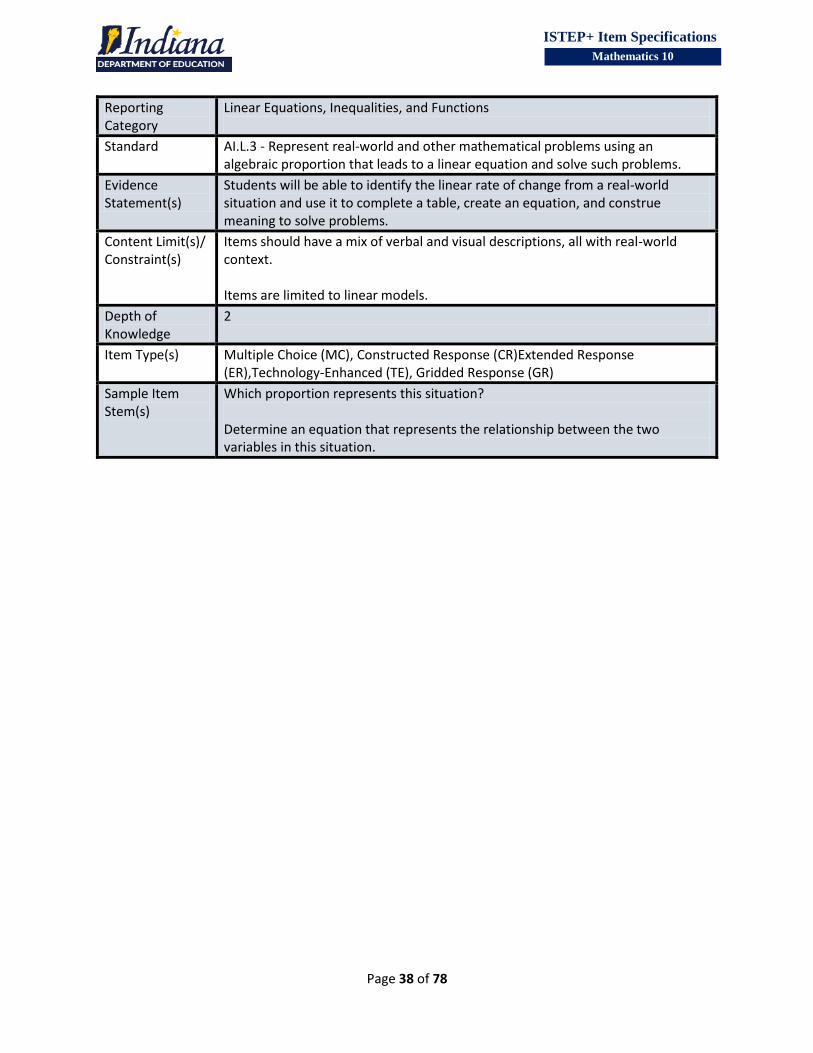
Standard AI.L.3 - Represent real-world and other mathematical problems using an algebraic proportion that leads to a linear equation and solve such problems.
Evidence Statement(s)
Students will be able to identify the linear rate of change from a real-world situation and use it to complete a table, create an equation, and construe meaning to solve problems.
Content Limit(s)/ Constraint(s)
Items should have a mix of verbal and visual descriptions, all with real-world context. Items are limited to linear models.
Depth of Knowledge
2
Item Type(s) Multiple Choice (MC), Constructed Response (CR)Extended Response (ER),Technology-Enhanced (TE), Gridded Response (GR)
Sample Item Stem(s)
Which proportion represents this situation? Determine an equation that represents the relationship between the two variables in this situation.
Page 39 of 78
ISTEP+ Item Specifications
Mathematics 10
Reporting Category
Linear Equations, Inequalities, and Functions
Standard AI.L.4 - Represent linear functions as graphs from equations (with and without technology), equations from graphs, and equations from tables and other given information (e.g., from a given point on a line and the slope of the line).
Evidence Statement(s)
Students can create a graph given a linear relationship. Students can write equations given a linear graph, table, or other information such as a point on the line and the slope of the line.
Content Limit(s)/ Constraint(s)
None
Depth of Knowledge
3
Item Type(s) Multiple Choice (MC), Technology-Enhanced (TE)
Sample Item Stem(s)
Create the graph of the given function on the coordinate grid shown. What is the equation for the linear relationship described in the table?
Page 40 of 78
ISTEP+ Item Specifications
Mathematics 10
Reporting Category
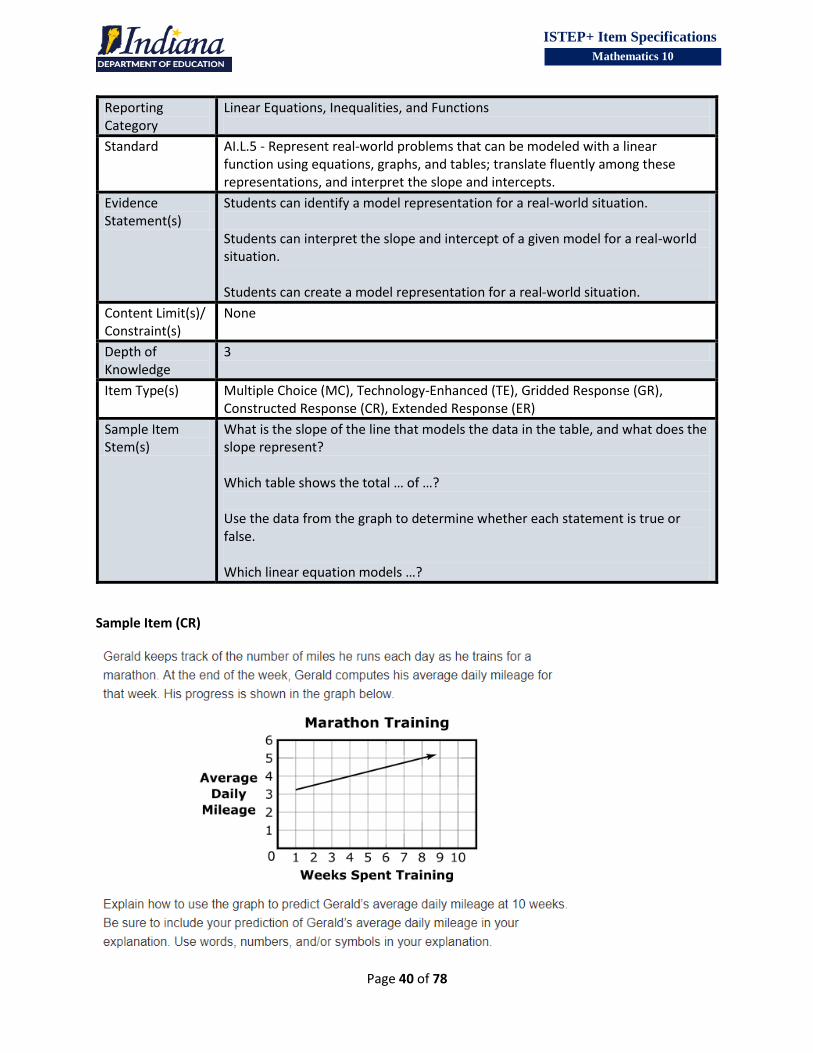
Linear Equations, Inequalities, and Functions
Standard AI.L.5 - Represent real-world problems that can be modeled with a linear function using equations, graphs, and tables; translate fluently among these representations, and interpret the slope and intercepts.
Evidence Statement(s)
Students can identify a model representation for a real-world situation. Students can interpret the slope and intercept of a given model for a real-world situation. Students can create a model representation for a real-world situation.
Content Limit(s)/ Constraint(s)
None
Depth of Knowledge
3
Item Type(s) Multiple Choice (MC), Technology-Enhanced (TE), Gridded Response (GR), Constructed Response (CR), Extended Response (ER)
Sample Item Stem(s)
What is the slope of the line that models the data in the table, and what does the slope represent? Which table shows the total … of …? Use the data from the graph to determine whether each statement is true or false. Which linear equation models …?
Sample Item (CR)
Page 41 of 78
ISTEP+ Item Specifications
Mathematics 10
Reporting Category
Linear Equations, Inequalities, and Functions
Standard AI.L.6 - Translate among equivalent forms of equations for linear functions, including slope-intercept, point-slope, and standard. Recognize that different forms reveal more or less information about a given situation.
Evidence Statement(s)
Students can create equivalent equations written in different forms using slope-intercept, point-slope, and standard forms. Students can identify what information can or cannot be identified from the different forms.
Content Limit(s)/ Constraint(s)
Items should cover both sentences in the standard.
Depth of Knowledge
2
Item Type(s) Multiple Choice (MC), Constructed Response (CR)Extended Response (ER),Technology-Enhanced (TE), Gridded Response (GR)
Sample Item Stem(s)
Write the given equation in slope-intercept form. What information can be identified when the equation is rewritten in this form?

Page 42 of 78
ISTEP+ Item Specifications
Mathematics 10
Reporting Category
Linear Equations, Inequalities, and Functions
Standard AI.L.7 - Represent real-world problems using linear inequalities in two variables and solve such problems; interpret the solution set and determine whether it is reasonable. Solve other linear inequalities in two variables by graphing.
Evidence Statement(s)
Students will be able to create a linear inequality in two variables given a real-world context and use the inequality to determine appropriate solutions. Students will graph a given linear inequality and its solution set. Students will determine if an ordered pair is a reasonable solution of a linear inequality within a real-world context.
Content Limit(s)/ Constraint(s)
None
Depth of Knowledge
2
Item Type(s) Multiple Choice (MC), Constructed Response (CR), Extended Response (ER),Technology-Enhanced (TE), Gridded Response (GR)
Sample Item Stem(s)
Which graph BEST represents the solution set for (inequality in two variables)? Determine which ordered pairs represent a reasonable solution of the inequality.
Sample Item (TE)
Select ALL the equations that represent a line that passes through the coordinates (0, 7) and (2, 10).
Select the equations you want to choose.
Key:

Page 43 of 78
ISTEP+ Item Specifications
Mathematics 10
Reporting Category
Linear Equations, Inequalities, and Functions
Standard AI.L.8 - Solve compound linear inequalities in one variable, and represent and interpret the solution on a number line. Write a compound linear inequality given its number line representation.
Evidence Statement(s)
Students can solve compound linear inequalities and graph the solution on a number line. Students can create a compound inequality given a solution set on a number line.
Content Limit(s)/ Constraint(s)
None
Depth of Knowledge
2
Item Type(s) Multiple Choice (MC), Technology-Enhanced (TE), Gridded Response (GR)
Sample Item Stem(s)
What is the solution set for this inequality? Which inequality has a solution set that can be represented by the number line?
Page 44 of 78
ISTEP+ Item Specifications
Mathematics 10
Reporting Category
Linear Equations, Inequalities, and Functions
Standard AI.L.9 - Solve absolute value linear equations in one variable.
Evidence Statement(s)
Students can determine the solution of absolute value linear equations in one variable. Students recognize that an absolute value linear equation may have one, more than one, or no solutions.
Content Limit(s)/ Constraint(s)
Assessed in the classroom.
Depth of Knowledge
2
Item Type(s) Multiple Choice (MC), Technology-Enhanced (TE), Gridded Response (GR)
Sample Item Stem(s)
N/A

Page 45 of 78
ISTEP+ Item Specifications
Mathematics 10
Reporting Category
Linear Equations, Inequalities, and Functions
Standard AI.L.10 - Graph absolute value linear equations in two variables.
Evidence Statement(s)
Students will graph an absolute value linear function given an equation. Students will create an absolute value linear equation given a graph. Students will write the equation of an absolute value linear equation given a transformation of y = |x| described verbally, graphically, or both.
Content Limit(s)/ Constraint(s)
Transformations of absolute value linear functions are included. Assessed in the classroom.
Depth of Knowledge
2
Item Type(s) Multiple Choice (MC), Technology-Enhanced (TE), Gridded Response (GR)
Sample Item Stem(s)
N/A
Page 46 of 78
ISTEP+ Item Specifications
Mathematics 10
Reporting Category
Linear Equations, Inequalities, and Functions
Standard AI.L.11 - Solve equations and formulas for a specified variable, including equations with coefficients represented by variables.
Evidence Statement(s)
Students can rearrange formulas and equations to highlight a specific variable.
Content Limit(s)/ Constraint(s)
None
Depth of Knowledge
2
Item Type(s) Multiple Choice (MC), Technology-Enhanced (TE), Gridded Response (GR)
Sample Item Stem(s)
Which formula is equivalent to ...? Solve the formula for h.
Page 47 of 78
ISTEP+ Item Specifications
Mathematics 10
Reporting Category
Linear Equations, Inequalities, and Functions
Standard AI.F.1 - Understand that a function from one set (called the domain) to another set (called the range) assigns to each element of the domain exactly one element of the range. Understand that if f is a function and x is an element of its domain, then f(x) denotes the output of f corresponding to the input x. Understand the graph of f is the graph of the equation y = f(x).
Evidence Statement(s)
Students understand that a function assigns exactly one output to each input. Students understand the meaning of the notation f(x).
Content Limit(s)/ Constraint(s)
Assessed in the classroom.
Depth of Knowledge
2
Item Type(s) Multiple Choice (MC), Technology-Enhanced (TE), Gridded Response (GR)
Sample Item Stem(s)
N/A
Page 48 of 78
ISTEP+ Item Specifications
Mathematics 10
Reporting Category
Linear Equations, Inequalities, and Functions
Standard AI.F.2 - Describe qualitatively the functional relationship between two quantities by analyzing a graph (e.g., where the function is increasing or decreasing, linear or nonlinear, has a maximum or minimum value). Sketch a graph that exhibits the qualitative features of a function that has been verbally described. Identify independent and dependent variables and make predictions about the relationship.
Evidence Statement(s)
Students can identify the independent and dependent variables in a given situation. Students can identify true statements about a given graph. Students can interpret the meaning of a graph of a functional relationship in context.
Content Limit(s)/ Constraint(s)
None
Depth of Knowledge
2
Item Type(s) Multiple Choice (MC), Technology-Enhanced (TE), Gridded Response (GR), Constructed Response (CR), Extended Response (ER)
Sample Item Stem(s)
Based on the graph, which statement about the function is true? In which of the following is the underlined variable the independent variable?

Page 49 of 78
ISTEP+ Item Specifications
Mathematics 10
Sample Item (ER)

Page 50 of 78
ISTEP+ Item Specifications
Mathematics 10
Reporting Category
Linear Equations, Inequalities, and Functions
Standard AI.F.3 - Identify the domain and range of relations represented in tables, graphs, verbal descriptions, and equations.
Evidence Statement(s)
Students will be able to identify the domain and range from multiple representations of functions.
Content Limit(s)/ Constraint(s)
Items should be a balance of tables, graphs, verbal descriptions, and equations.
Depth of Knowledge
2
Item Type(s) Multiple Choice (MC), Technology-Enhanced (TE), Gridded Response (GR)
Sample Item Stem(s)
What is the domain/range of this relation? The domain/range of the function is ...? Which graph represents a function that has a range of ...?
Page 51 of 78
ISTEP+ Item Specifications
Mathematics 10
Reporting Category
Linear Equations, Inequalities, and Functions
Standard AI.F.4 - Understand and interpret statements that use function notation in terms of a context; relate the domain of the function to its graph and to the quantitative relationship it describes.
Evidence Statement(s)
Students can identify a situation given a function that describes it and identify a function that describes a given situation. Students can identify the domain of a function from a graph or a contextual description of the relationship.
Content Limit(s)/ Constraint(s)
Items should use context whenever possible.
Depth of Knowledge
2
Item Type(s) Multiple Choice (MC), Constructed Response (CR), Extended Response (ER), Technology-Enhanced (TE), Gridded Response (GR)
Sample Item Stem(s)
Which of the following is BEST represented by the function f(x)= ...? Based on the context, what is the domain of the function?
Page 52 of 78
ISTEP+ Item Specifications
Mathematics 10
Reporting Category
Linear Equations, Inequalities, and Functions
Standard 8.AF.1 - Solve linear equations with rational number coefficients fluently, including equations whose solutions require expanding expressions using the distributive property and collecting like terms. Represent real-world problems using linear equations and inequalities in one variable and solve such problems.
Evidence Statement(s)
Use the distributive property and collect like terms in solving linear equations. Solve real-world problems represented by linear equations and inequalities in one variable.
Content Limit(s)/ Constraint(s)
This standard is covered in AI.L.1 and AI.L.2. Assessed in the classroom
Depth of Knowledge
3
Item Type(s) Multiple Choice (MC), Technology-Enhanced (TE), Gridded Response (GR)
Sample Item Stem(s)
N/A
Page 53 of 78
ISTEP+ Item Specifications
Mathematics 10
Reporting Category
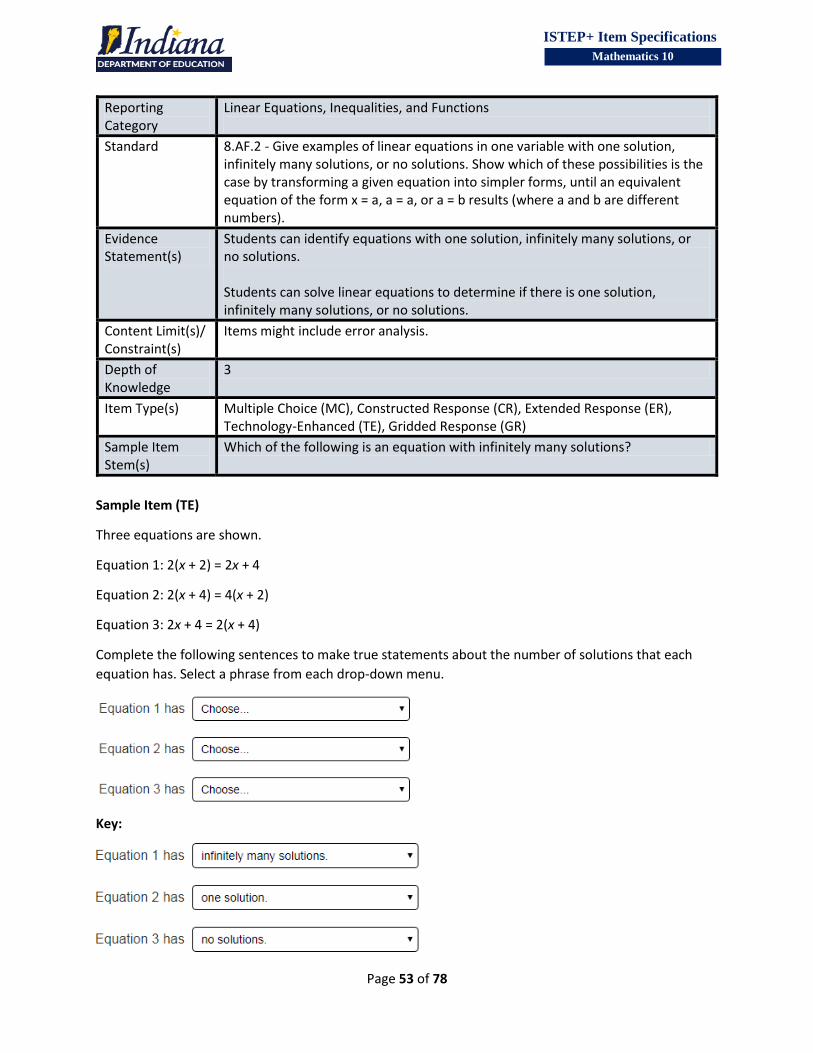
Linear Equations, Inequalities, and Functions
Standard 8.AF.2 - Give examples of linear equations in one variable with one solution, infinitely many solutions, or no solutions. Show which of these possibilities is the case by transforming a given equation into simpler forms, until an equivalent equation of the form x = a, a = a, or a = b results (where a and b are different numbers).
Evidence Statement(s)
Students can identify equations with one solution, infinitely many solutions, or no solutions. Students can solve linear equations to determine if there is one solution, infinitely many solutions, or no solutions.
Content Limit(s)/ Constraint(s)
Items might include error analysis.
Depth of Knowledge
3
Item Type(s) Multiple Choice (MC), Constructed Response (CR), Extended Response (ER), Technology-Enhanced (TE), Gridded Response (GR)
Sample Item Stem(s)
Which of the following is an equation with infinitely many solutions?
Sample Item (TE)
Three equations are shown.
Equation 1: 2(x + 2) = 2x + 4
Equation 2: 2(x + 4) = 4(x + 2)
Equation 3: 2x + 4 = 2(x + 4)
Complete the following sentences to make true statements about the number of solutions that each
equation has. Select a phrase from each drop-down menu.
Key:
Page 54 of 78
ISTEP+ Item Specifications
Mathematics 10
Reporting Category
Linear Equations, Inequalities, and Functions
Standard 8.AF.3 - Understand that a function assigns to each x-value (independent variable) exactly one y-value (dependent variable), and that the graph of a function is the set of ordered pairs (x,y).
Evidence Statement(s)
Students can identify the independent and dependent variables from a set of ordered pairs. Students will use function notation to evaluate a function given the independent variable. Students should understand why a given table, a set of ordered pairs, or a model is or is not a function.
Content Limit(s)/ Constraint(s)
Items might include completing an (x, y) chart or evaluating a function.
Depth of Knowledge
2
Item Type(s) Multiple Choice (MC), Technology-Enhanced (TE), Gridded Response (GR)
Sample Item Stem(s)
For a given nonlinear function f, which statement about f(x) must be true/false? For the function..., what is the value of f(...)? Which ordered pair(s) could also be part of the given function? Which numbers represent values of the independent/dependent variable of the function?
Page 55 of 78
ISTEP+ Item Specifications
Mathematics 10
Reporting Category
Linear Equations, Inequalities, and Functions
Standard 8.AF.4 - Describe qualitatively the functional relationship between two quantities by analyzing a graph (e.g., where the function is increasing or decreasing, linear or nonlinear, has a maximum or minimum value). Sketch a graph that exhibits the qualitative features of a function that has been verbally described.
Evidence Statement(s)
Students will analyze and provide a verbal description of the relationship between the independent and dependent variables when given a graph.
Content Limit(s)/ Constraint(s)
This standard is covered in AI.F.2. Assessed in the classroom.
Depth of Knowledge
2
Item Type(s) Multiple Choice (MC), Constructed Response (CR), Extended Response (ER), Technology-Enhanced (TE), Gridded Response (GR)
Sample Item Stem(s)
N/A
Page 56 of 78
ISTEP+ Item Specifications
Mathematics 10
Reporting Category
Linear Equations, Inequalities, and Functions
Standard 8.AF.5 - Interpret the equation y = mx + b as defining a linear function, whose graph is a straight line; give examples of functions that are not linear. Describe similarities and differences between linear and nonlinear functions from tables, graphs, verbal descriptions, and equations.
Evidence Statement(s)
Students can identify equations that can be written in the form y = mx + b as linear functions whose graph is a straight line. Given a table, graph, verbal description, or equation, students can identify the relationship as either linear or nonlinear.
Content Limit(s)/ Constraint(s)
Items might include distinguishing between linear and nonlinear functions.
Depth of Knowledge
3
Item Type(s) Multiple Choice (MC), Technology-Enhanced (TE), Gridded Response (GR)
Sample Item Stem(s)
Which statement correctly explains whether function f or function g could be linear? Which functions are linear, and which functions are nonlinear?
Page 57 of 78
ISTEP+ Item Specifications
Mathematics 10
Reporting Category
Linear Equations, Inequalities, and Functions
Standard 8.AF.6 - Construct a function to model a linear relationship between two quantities given a verbal description, table of values, or graph. Recognize in y = mx + b that m is the slope (rate of change) and b is the y-intercept of the graph, and describe the meaning of each in the context of a problem.
Evidence Statement(s)
Students can construct a linear equation, given a real-world context, and interpret the slope and y-intercept in relation to the context.
Content Limit(s)/ Constraint(s)
Items should have a mix of verbal and visual descriptions, all with real-world context.
Depth of Knowledge
2
Item Type(s) Multiple Choice (MC), Constructed Response (CR), Extended Response (ER),Technology-Enhanced (TE), Gridded Response (GR)
Sample Item Stem(s)
What is the value of a function when x = 0? What does this value represent in the context of the problem? Construct a function of the form y = mx + b to model the .... Define your variables.
Page 58 of 78
ISTEP+ Item Specifications
Mathematics 10
Reporting Category
Linear Equations, Inequalities, and Functions
Standard 8.AF.7 - Compare properties of two linear functions given in different forms, such as a table of values, equation, verbal description, and graph (e.g., compare a distance-time graph to a distance-time equation to determine which of two moving objects has greater speed).
Evidence Statement(s)
Students will be given two linear functions in different forms and will be able to compare, describe, and explain the slopes and y-intercepts with or without real-world context.
Content Limit(s)/ Constraint(s)
Items may compare situations in different forms and have students identify which representation is the best and why.
Depth of Knowledge
2
Item Type(s) Multiple Choice (MC), Constructed Response (CR), Extended Response (ER)Technology-Enhanced (TE), Gridded Response (GR)
Sample Item Stem(s)
Which statement models the relationships between distance and time shown in the graph? Which statement comparing functions f and g is true?

Page 59 of 78
ISTEP+ Item Specifications
Mathematics 10
Reporting Category
System of Equations and Inequalities
Standard 8.AF.8 - Understand that solutions to a system of two linear equations correspond to points of intersection of their graphs because points of intersection satisfy both equations simultaneously. Approximate the solution of a system of equations by graphing and interpreting the reasonableness of the approximation.
Evidence Statement(s)
Students understand that the intersection point of the graph of a system of two linear equations is a solution of that system. Students use graphs to approximate the solution of a system of equations.
Content Limit(s)/ Constraint(s)
Items could also include no solution and infinite solutions.
Depth of Knowledge
2
Item Type(s) Multiple Choice (MC), Constructed Response (CR), Extended Response (ER) Technology-Enhanced (TE), Gridded Response (GR)
Sample Item Stem(s)
Does this system have no solutions, one solution, or multiple solutions? Given this graph, what is the solution to this system of equations?
Page 60 of 78
ISTEP+ Item Specifications
Mathematics 10
Reporting Category
Systems of Equations and Inequalities
Standard AI.SEI.1 - Understand the relationship between a solution of a pair of linear equations in two variables and the graphs of the corresponding lines. Solve pairs of linear equations in two variables by graphing; approximate solutions when the coordinates of the solution are non-integer numbers.
Evidence Statement(s)
Students can identify a solution given a graph of two linear equations. Students can solve a given pair of linear equations by graphing on a coordinate plane.
Content Limit(s)/ Constraint(s)
Focus of standard is on non-integer numbers
Depth of Knowledge
2
Item Type(s) Multiple Choice (MC), Technology-Enhanced (TE), Gridded Response (GR)
Sample Item Stem(s)
What is the best estimate of how long it will take for … to contain the same amount of …? Which statement of the graph of this system of equations must be true? What is the best approximation of the y-value for the solution shown in the graph? Graph the two lines and plot the point representing the solution to the system.
Page 61 of 78
ISTEP+ Item Specifications
Mathematics 10
Reporting Category
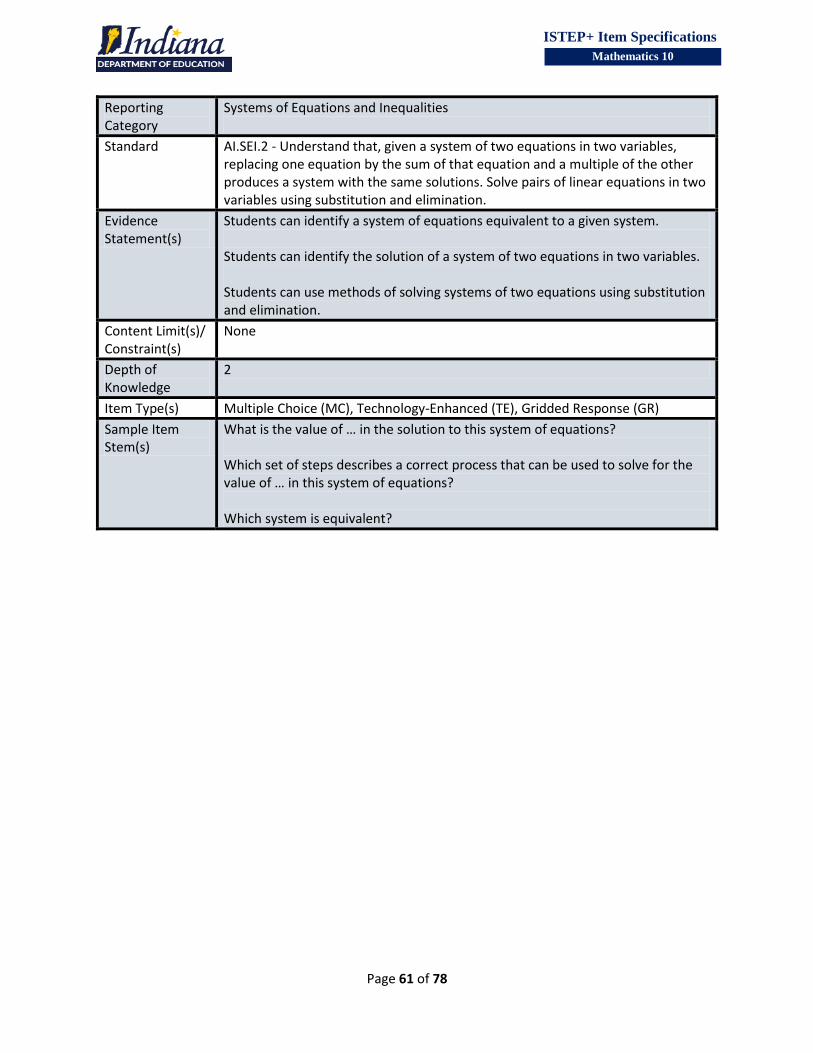
Systems of Equations and Inequalities
Standard AI.SEI.2 - Understand that, given a system of two equations in two variables, replacing one equation by the sum of that equation and a multiple of the other produces a system with the same solutions. Solve pairs of linear equations in two variables using substitution and elimination.
Evidence Statement(s)
Students can identify a system of equations equivalent to a given system. Students can identify the solution of a system of two equations in two variables. Students can use methods of solving systems of two equations using substitution and elimination.
Content Limit(s)/ Constraint(s)
None
Depth of Knowledge
2
Item Type(s) Multiple Choice (MC), Technology-Enhanced (TE), Gridded Response (GR)
Sample Item Stem(s)
What is the value of … in the solution to this system of equations? Which set of steps describes a correct process that can be used to solve for the value of … in this system of equations? Which system is equivalent?
Page 62 of 78
ISTEP+ Item Specifications
Mathematics 10
Reporting Category
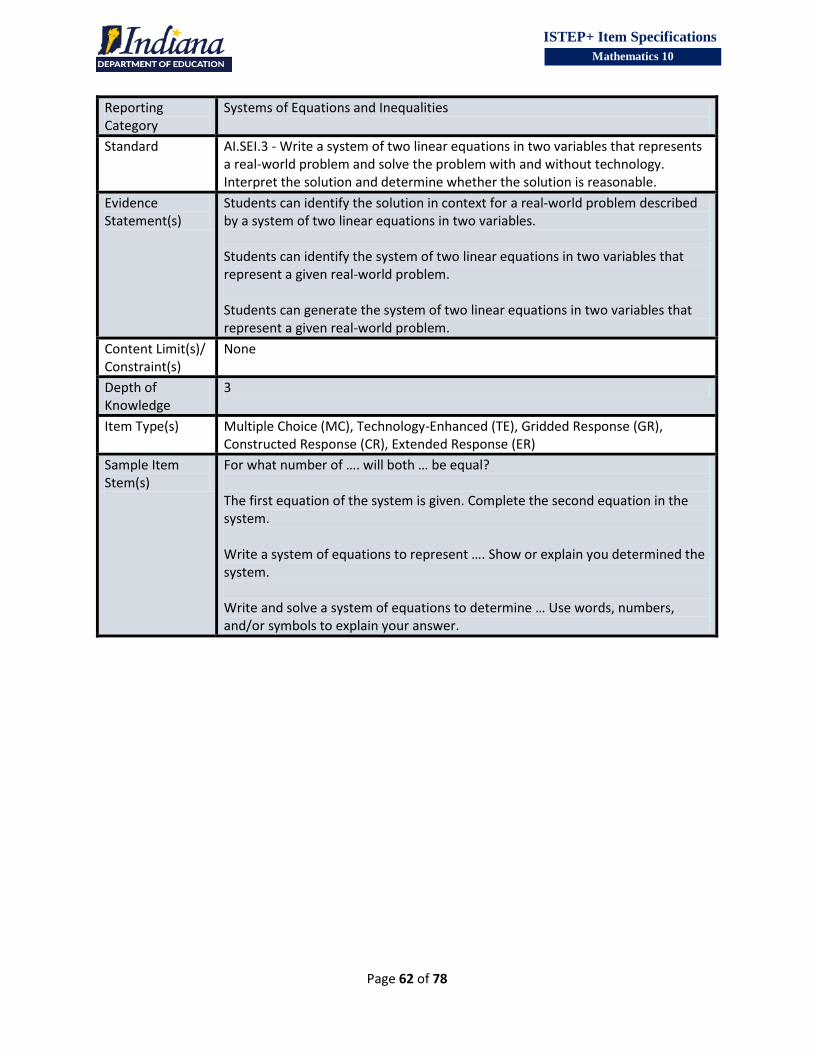
Systems of Equations and Inequalities
Standard AI.SEI.3 - Write a system of two linear equations in two variables that represents a real-world problem and solve the problem with and without technology. Interpret the solution and determine whether the solution is reasonable.
Evidence Statement(s)
Students can identify the solution in context for a real-world problem described by a system of two linear equations in two variables. Students can identify the system of two linear equations in two variables that represent a given real-world problem. Students can generate the system of two linear equations in two variables that represent a given real-world problem.
Content Limit(s)/ Constraint(s)
None
Depth of Knowledge
3
Item Type(s) Multiple Choice (MC), Technology-Enhanced (TE), Gridded Response (GR), Constructed Response (CR), Extended Response (ER)
Sample Item Stem(s)
For what number of …. will both … be equal? The first equation of the system is given. Complete the second equation in the system. Write a system of equations to represent …. Show or explain you determined the system. Write and solve a system of equations to determine … Use words, numbers, and/or symbols to explain your answer.
Page 63 of 78
ISTEP+ Item Specifications
Mathematics 10
Reporting Category
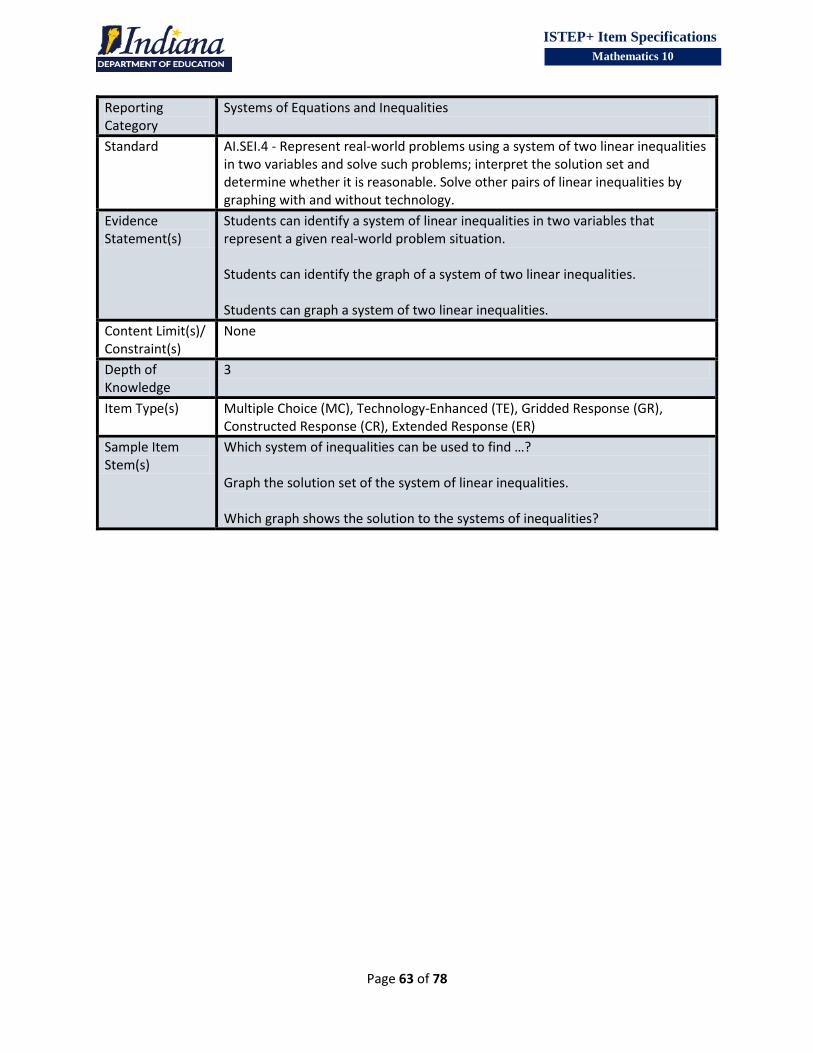
Systems of Equations and Inequalities
Standard AI.SEI.4 - Represent real-world problems using a system of two linear inequalities in two variables and solve such problems; interpret the solution set and determine whether it is reasonable. Solve other pairs of linear inequalities by graphing with and without technology.
Evidence Statement(s)
Students can identify a system of linear inequalities in two variables that represent a given real-world problem situation. Students can identify the graph of a system of two linear inequalities. Students can graph a system of two linear inequalities.
Content Limit(s)/ Constraint(s)
None
Depth of Knowledge
3
Item Type(s) Multiple Choice (MC), Technology-Enhanced (TE), Gridded Response (GR), Constructed Response (CR), Extended Response (ER)
Sample Item Stem(s)
Which system of inequalities can be used to find …? Graph the solution set of the system of linear inequalities. Which graph shows the solution to the systems of inequalities?
Page 64 of 78
ISTEP+ Item Specifications
Mathematics 10
Reporting Category
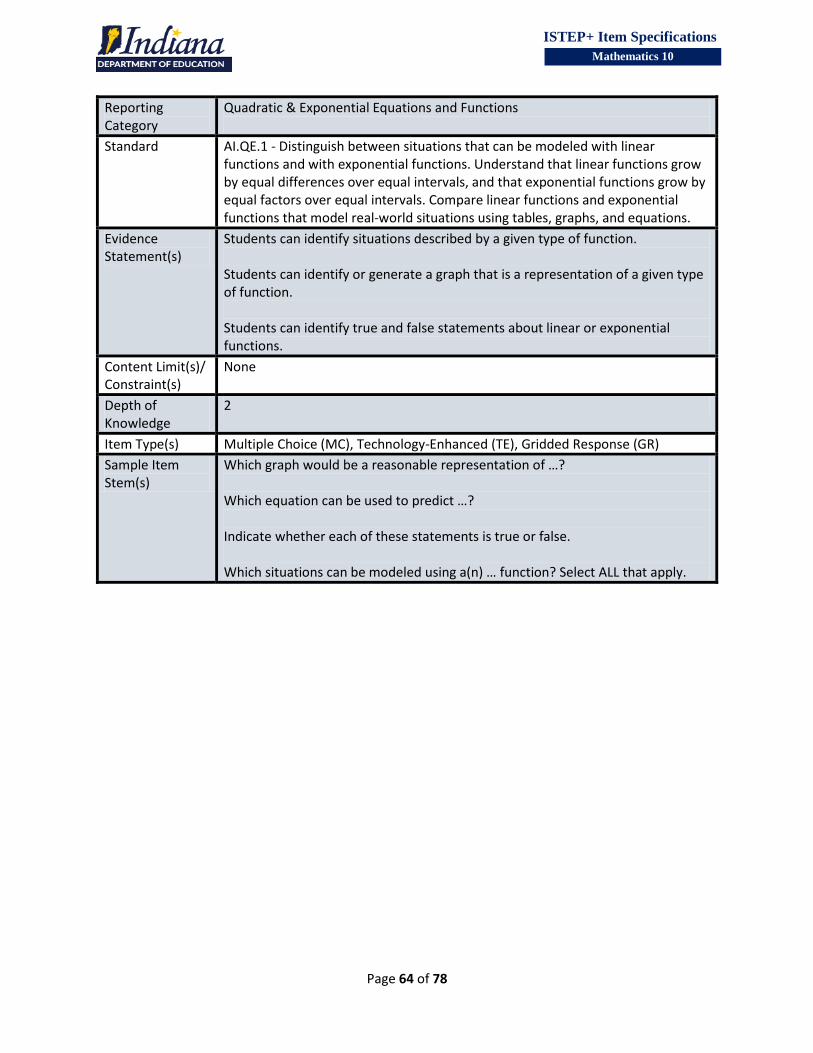
Quadratic & Exponential Equations and Functions
Standard AI.QE.1 - Distinguish between situations that can be modeled with linear functions and with exponential functions. Understand that linear functions grow by equal differences over equal intervals, and that exponential functions grow by equal factors over equal intervals. Compare linear functions and exponential functions that model real-world situations using tables, graphs, and equations.
Evidence Statement(s)
Students can identify situations described by a given type of function. Students can identify or generate a graph that is a representation of a given type of function. Students can identify true and false statements about linear or exponential functions.
Content Limit(s)/ Constraint(s)
None
Depth of Knowledge
2
Item Type(s) Multiple Choice (MC), Technology-Enhanced (TE), Gridded Response (GR)
Sample Item Stem(s)
Which graph would be a reasonable representation of …? Which equation can be used to predict …? Indicate whether each of these statements is true or false. Which situations can be modeled using a(n) … function? Select ALL that apply.
Page 65 of 78
ISTEP+ Item Specifications
Mathematics 10
Reporting Category
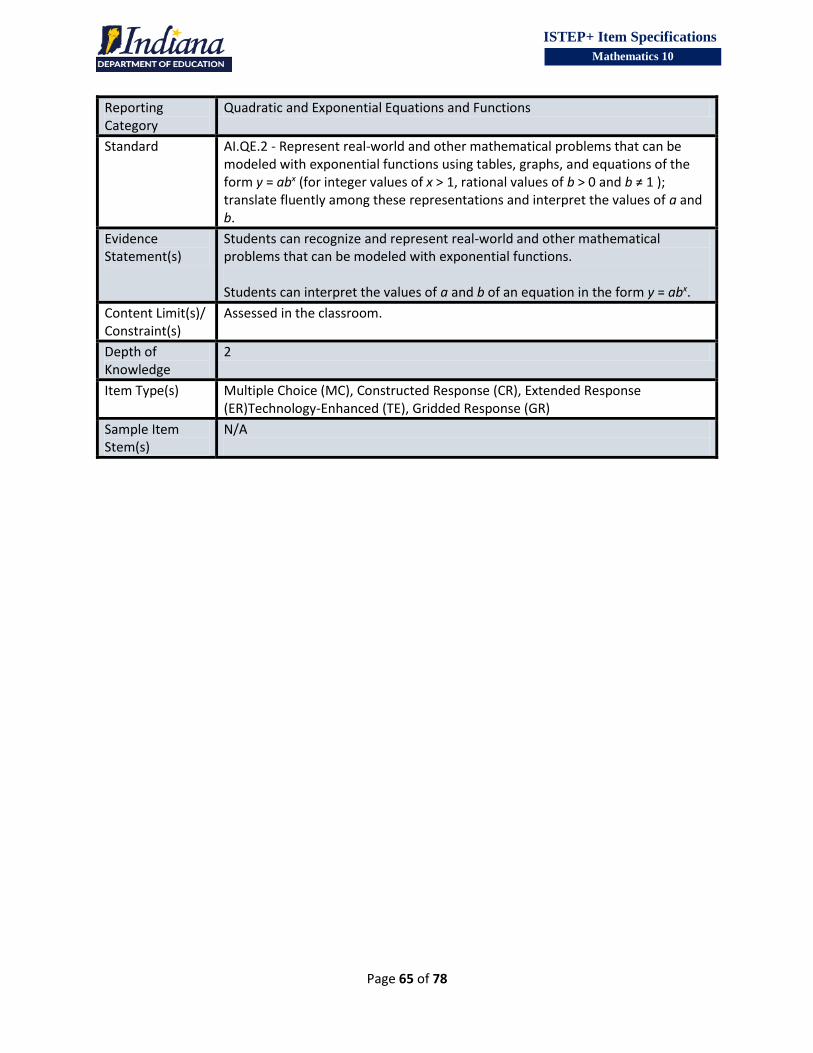
Quadratic and Exponential Equations and Functions
Standard AI.QE.2 - Represent real-world and other mathematical problems that can be modeled with exponential functions using tables, graphs, and equations of the form y = abx (for integer values of x > 1, rational values of b > 0 and b ≠ 1 ); translate fluently among these representations and interpret the values of a and b.
Evidence Statement(s)
Students can recognize and represent real-world and other mathematical problems that can be modeled with exponential functions. Students can interpret the values of a and b of an equation in the form y = abx.
Content Limit(s)/ Constraint(s)
Assessed in the classroom.
Depth of Knowledge
2
Item Type(s) Multiple Choice (MC), Constructed Response (CR), Extended Response (ER)Technology-Enhanced (TE), Gridded Response (GR)
Sample Item Stem(s)
N/A
Page 66 of 78
ISTEP+ Item Specifications
Mathematics 10
Reporting Category
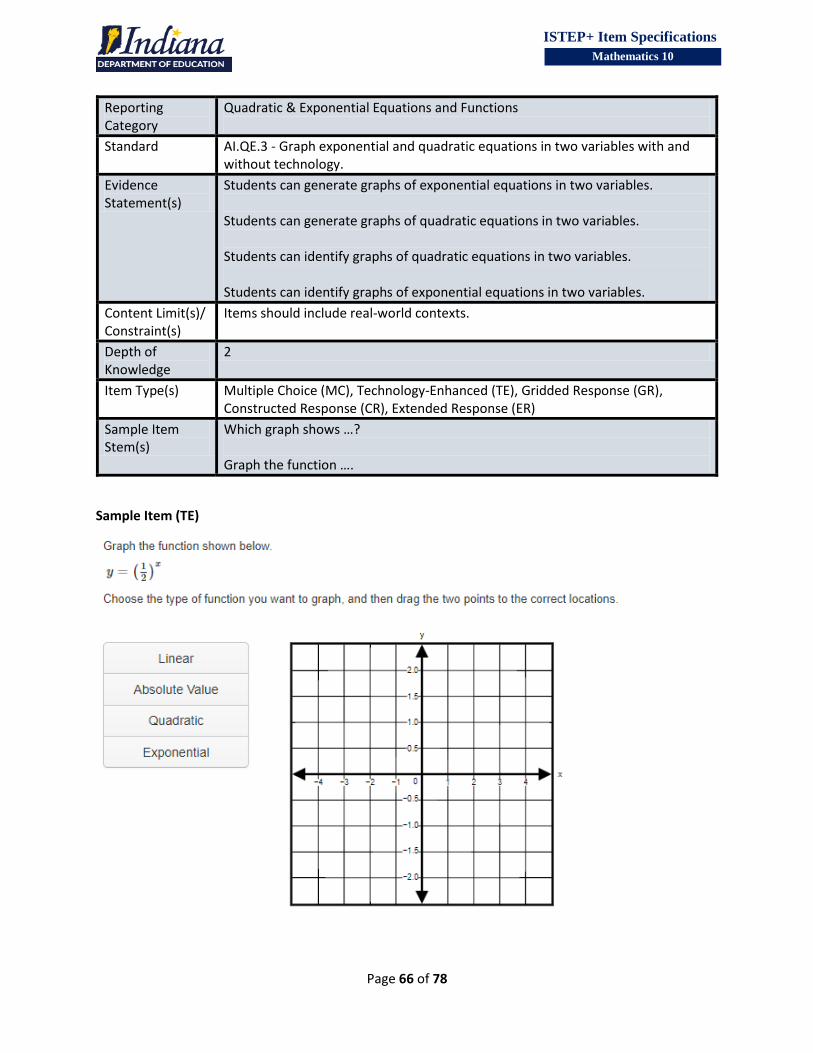
Quadratic & Exponential Equations and Functions
Standard AI.QE.3 - Graph exponential and quadratic equations in two variables with and without technology.
Evidence Statement(s)
Students can generate graphs of exponential equations in two variables. Students can generate graphs of quadratic equations in two variables. Students can identify graphs of quadratic equations in two variables. Students can identify graphs of exponential equations in two variables.
Content Limit(s)/ Constraint(s)
Items should include real-world contexts.
Depth of Knowledge
2
Item Type(s) Multiple Choice (MC), Technology-Enhanced (TE), Gridded Response (GR), Constructed Response (CR), Extended Response (ER)
Sample Item Stem(s)
Which graph shows …? Graph the function ….
Sample Item (TE)
Page 67 of 78
ISTEP+ Item Specifications
Mathematics 10
Reporting Category
Quadratic & Exponential Equations and Functions
Standard AI.QE.4 - Solve quadratic equations in one variable by inspection (e.g., for x2 = 49), finding square roots, using the quadratic formula, and factoring, as appropriate to the initial form of the equation.
Evidence Statement(s)
Students can identify solutions to a given quadratic equation. Students can identify or generate binomial factors of a given quadratic expression. Students can identify or generate equivalent equations as a method of solving a quadratic equation.
Content Limit(s)/ Constraint(s)
None
Depth of Knowledge
2
Item Type(s) Multiple Choice (MC), Technology-Enhanced (TE), Gridded Response (GR)
Sample Item Stem(s)
Which solution steps are equivalent to the given equation? Select ALL equivalent solution steps. What is the positive solution to …, to the nearest tenth? What are the solutions to …? Which expressions represent factors of …?
Sample Item (MC)
Key: D
Page 68 of 78
ISTEP+ Item Specifications
Mathematics 10
Reporting Category
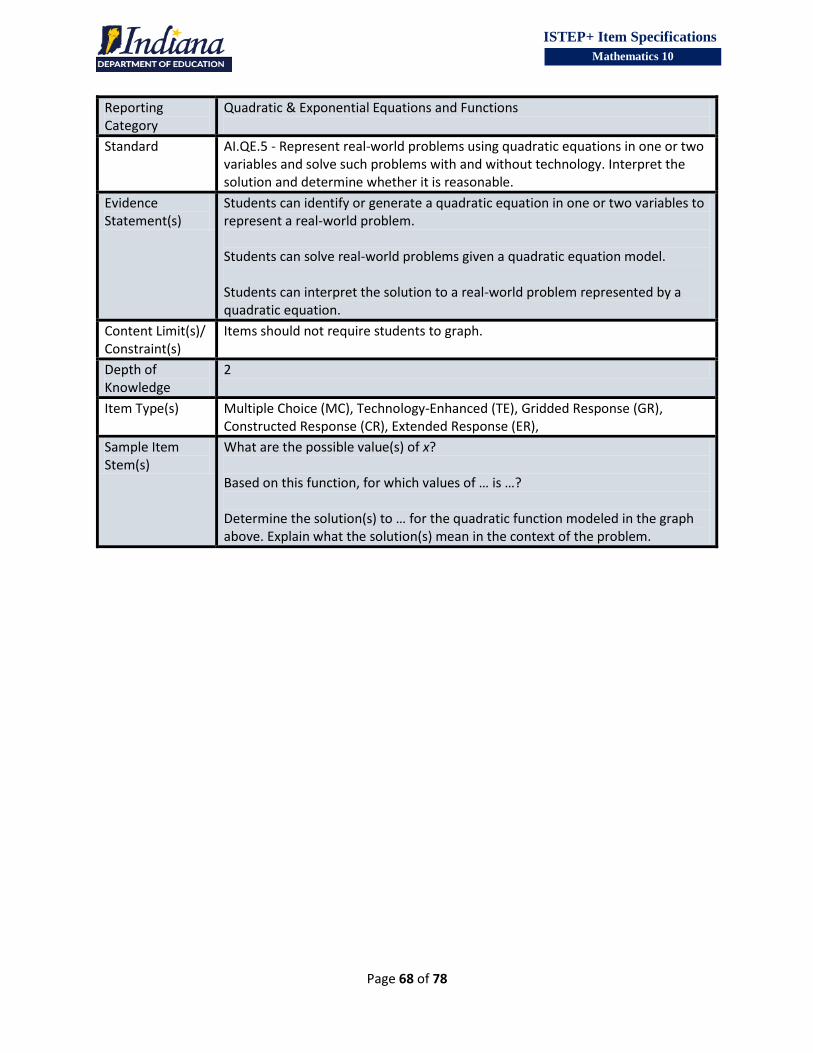
Quadratic & Exponential Equations and Functions
Standard AI.QE.5 - Represent real-world problems using quadratic equations in one or two variables and solve such problems with and without technology. Interpret the solution and determine whether it is reasonable.
Evidence Statement(s)
Students can identify or generate a quadratic equation in one or two variables to represent a real-world problem. Students can solve real-world problems given a quadratic equation model. Students can interpret the solution to a real-world problem represented by a quadratic equation.
Content Limit(s)/ Constraint(s)
Items should not require students to graph.
Depth of Knowledge
2
Item Type(s) Multiple Choice (MC), Technology-Enhanced (TE), Gridded Response (GR), Constructed Response (CR), Extended Response (ER),
Sample Item Stem(s)
What are the possible value(s) of x? Based on this function, for which values of … is …? Determine the solution(s) to … for the quadratic function modeled in the graph above. Explain what the solution(s) mean in the context of the problem.
Page 69 of 78
ISTEP+ Item Specifications
Mathematics 10
Reporting Category
Quadratic & Exponential Equations and Functions
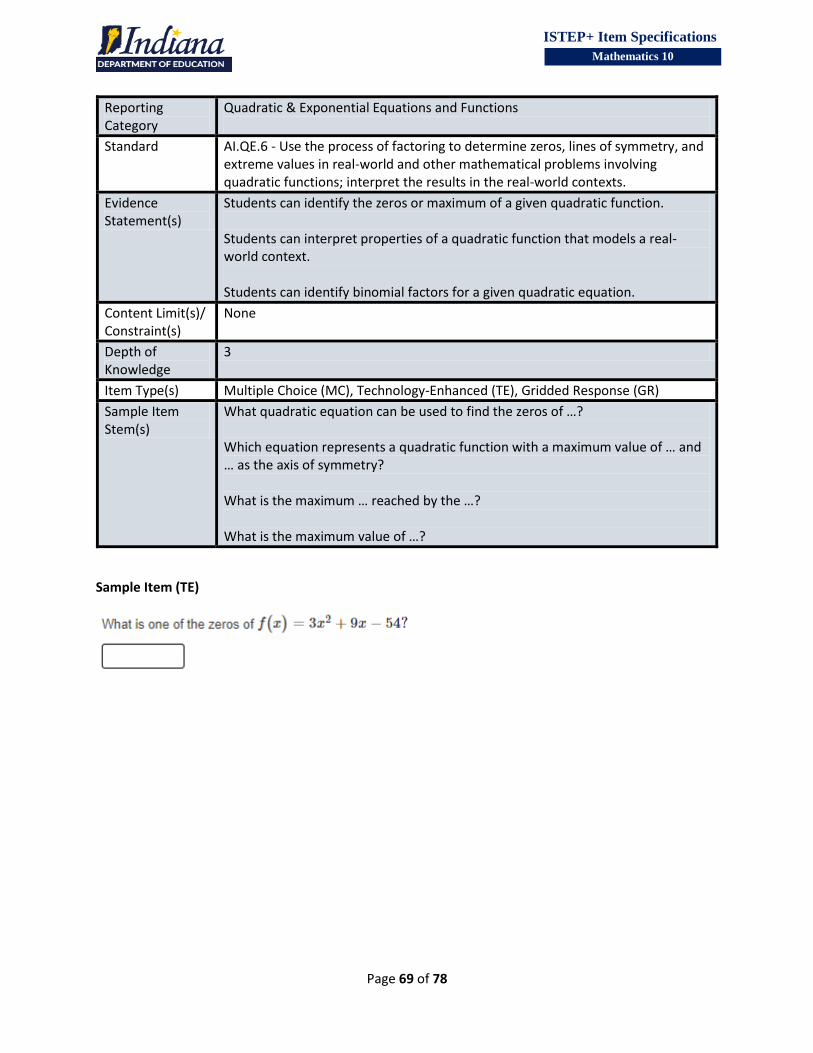
Standard AI.QE.6 - Use the process of factoring to determine zeros, lines of symmetry, and extreme values in real-world and other mathematical problems involving quadratic functions; interpret the results in the real-world contexts.
Evidence Statement(s)
Students can identify the zeros or maximum of a given quadratic function. Students can interpret properties of a quadratic function that models a real-world context. Students can identify binomial factors for a given quadratic equation.
Content Limit(s)/ Constraint(s)
None
Depth of Knowledge
3
Item Type(s) Multiple Choice (MC), Technology-Enhanced (TE), Gridded Response (GR)
Sample Item Stem(s)
What quadratic equation can be used to find the zeros of …? Which equation represents a quadratic function with a maximum value of … and … as the axis of symmetry? What is the maximum … reached by the …? What is the maximum value of …?
Sample Item (TE)
Page 70 of 78
ISTEP+ Item Specifications
Mathematics 10
Reporting Category
Quadratic & Exponential Equations and Functions
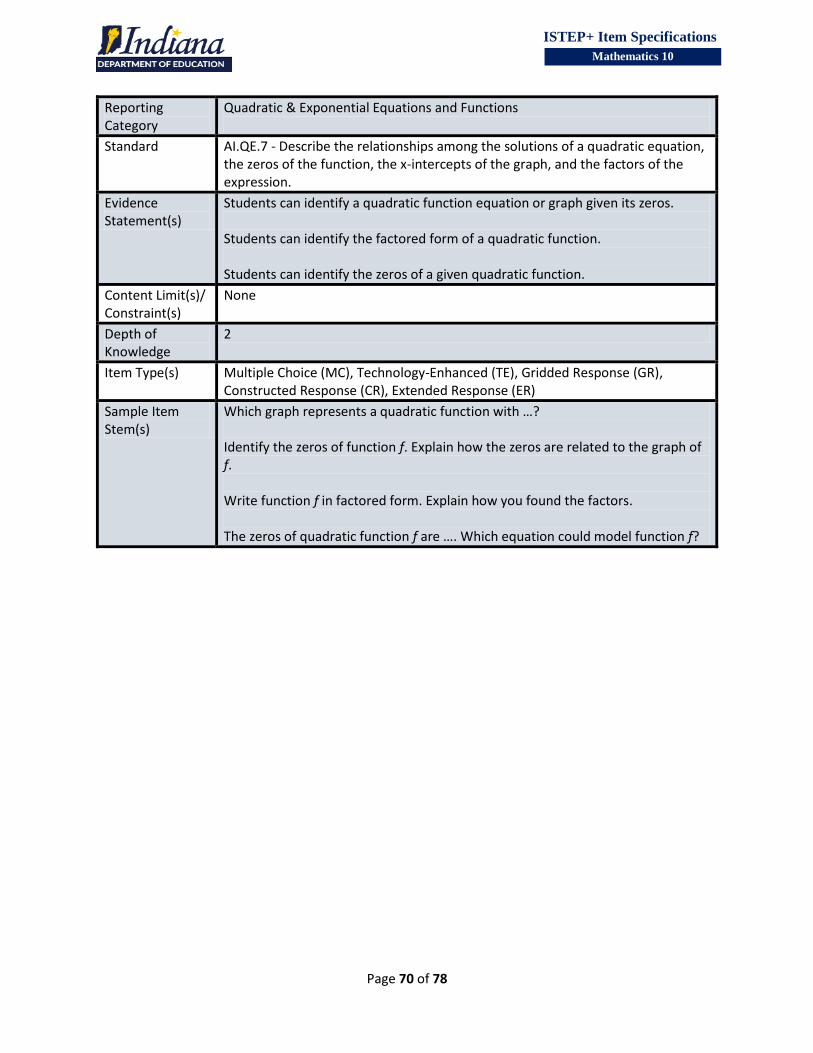
Standard AI.QE.7 - Describe the relationships among the solutions of a quadratic equation, the zeros of the function, the x-intercepts of the graph, and the factors of the expression.
Evidence Statement(s)
Students can identify a quadratic function equation or graph given its zeros. Students can identify the factored form of a quadratic function. Students can identify the zeros of a given quadratic function.
Content Limit(s)/ Constraint(s)
None
Depth of Knowledge
2
Item Type(s) Multiple Choice (MC), Technology-Enhanced (TE), Gridded Response (GR), Constructed Response (CR), Extended Response (ER)
Sample Item Stem(s)
Which graph represents a quadratic function with …? Identify the zeros of function f. Explain how the zeros are related to the graph of f. Write function f in factored form. Explain how you found the factors. The zeros of quadratic function f are …. Which equation could model function f?
Page 71 of 78
ISTEP+ Item Specifications
Mathematics 10
Reporting Category
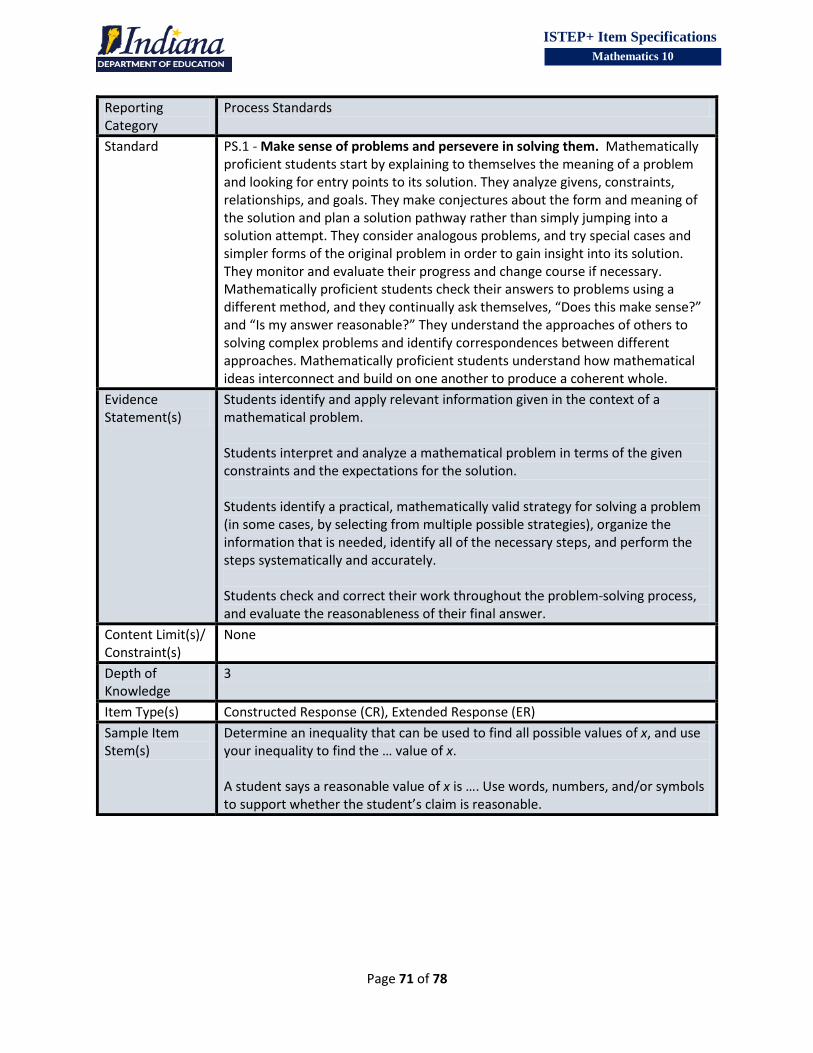
Process Standards
Standard PS.1 - Make sense of problems and persevere in solving them. Mathematically proficient students start by explaining to themselves the meaning of a problem and looking for entry points to its solution. They analyze givens, constraints, relationships, and goals. They make conjectures about the form and meaning of the solution and plan a solution pathway rather than simply jumping into a solution attempt. They consider analogous problems, and try special cases and simpler forms of the original problem in order to gain insight into its solution. They monitor and evaluate their progress and change course if necessary. Mathematically proficient students check their answers to problems using a different method, and they continually ask themselves, “Does this make sense?” and “Is my answer reasonable?” They understand the approaches of others to solving complex problems and identify correspondences between different approaches. Mathematically proficient students understand how mathematical ideas interconnect and build on one another to produce a coherent whole.
Evidence Statement(s)
Students identify and apply relevant information given in the context of a mathematical problem. Students interpret and analyze a mathematical problem in terms of the given constraints and the expectations for the solution. Students identify a practical, mathematically valid strategy for solving a problem (in some cases, by selecting from multiple possible strategies), organize the information that is needed, identify all of the necessary steps, and perform the steps systematically and accurately. Students check and correct their work throughout the problem-solving process, and evaluate the reasonableness of their final answer.
Content Limit(s)/ Constraint(s)
None
Depth of Knowledge
3
Item Type(s) Constructed Response (CR), Extended Response (ER)
Sample Item Stem(s)
Determine an inequality that can be used to find all possible values of x, and use your inequality to find the … value of x. A student says a reasonable value of x is …. Use words, numbers, and/or symbols to support whether the student’s claim is reasonable.
Page 72 of 78
ISTEP+ Item Specifications
Mathematics 10
Reporting Category
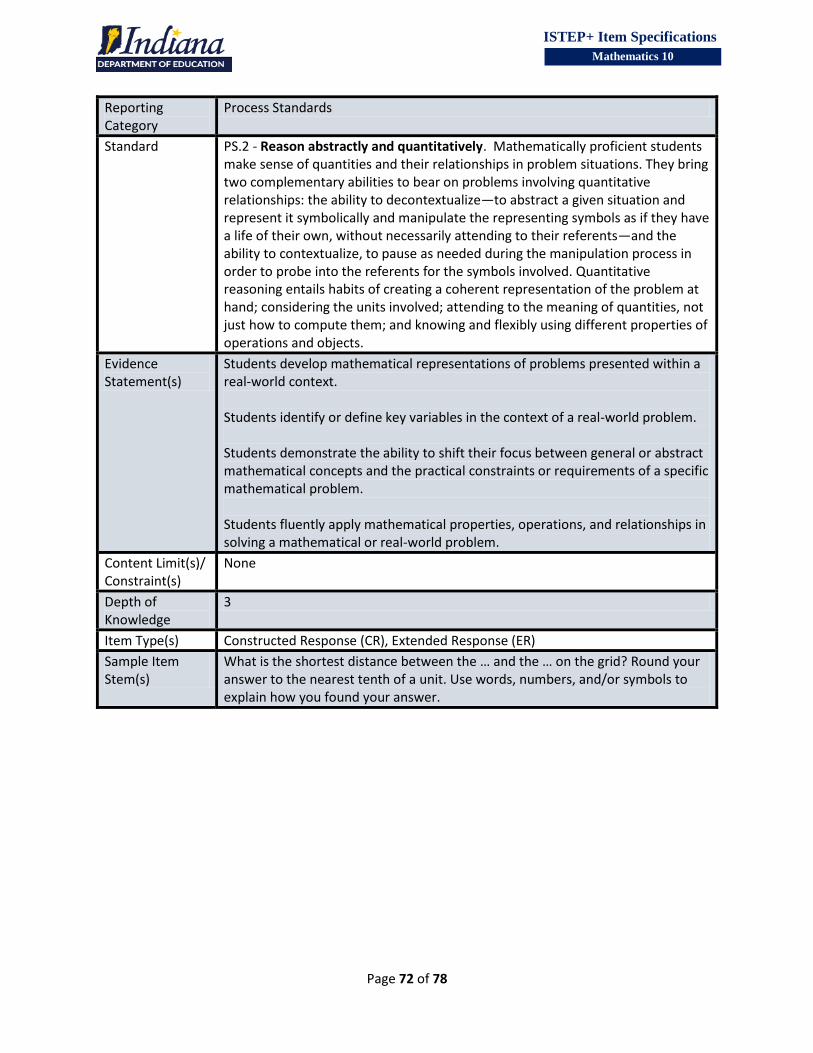
Process Standards
Standard PS.2 - Reason abstractly and quantitatively. Mathematically proficient students make sense of quantities and their relationships in problem situations. They bring two complementary abilities to bear on problems involving quantitative relationships: the ability to decontextualize—to abstract a given situation and represent it symbolically and manipulate the representing symbols as if they have a life of their own, without necessarily attending to their referents—and the ability to contextualize, to pause as needed during the manipulation process in order to probe into the referents for the symbols involved. Quantitative reasoning entails habits of creating a coherent representation of the problem at hand; considering the units involved; attending to the meaning of quantities, not just how to compute them; and knowing and flexibly using different properties of operations and objects.
Evidence Statement(s)
Students develop mathematical representations of problems presented within a real-world context. Students identify or define key variables in the context of a real-world problem. Students demonstrate the ability to shift their focus between general or abstract mathematical concepts and the practical constraints or requirements of a specific mathematical problem. Students fluently apply mathematical properties, operations, and relationships in solving a mathematical or real-world problem.
Content Limit(s)/ Constraint(s)
None
Depth of Knowledge
3
Item Type(s) Constructed Response (CR), Extended Response (ER)
Sample Item Stem(s)
What is the shortest distance between the … and the … on the grid? Round your answer to the nearest tenth of a unit. Use words, numbers, and/or symbols to explain how you found your answer.
Page 73 of 78
ISTEP+ Item Specifications
Mathematics 10
Reporting Category
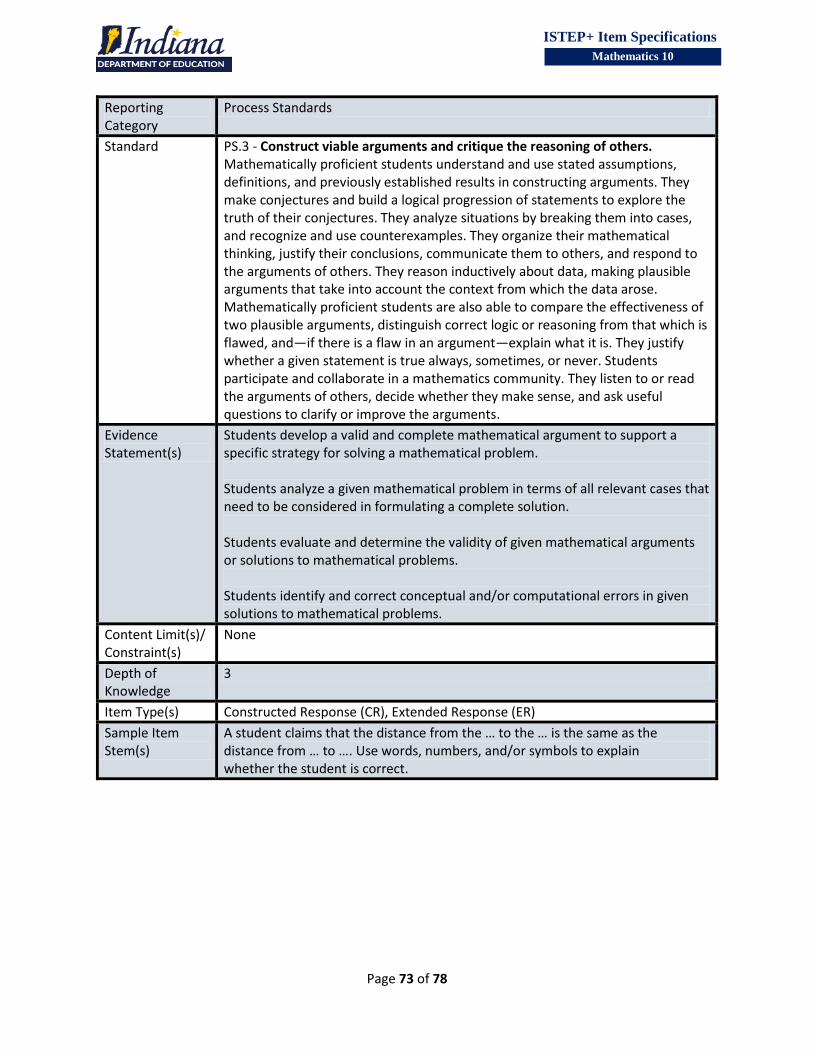
Process Standards
Standard PS.3 - Construct viable arguments and critique the reasoning of others. Mathematically proficient students understand and use stated assumptions, definitions, and previously established results in constructing arguments. They make conjectures and build a logical progression of statements to explore the truth of their conjectures. They analyze situations by breaking them into cases, and recognize and use counterexamples. They organize their mathematical thinking, justify their conclusions, communicate them to others, and respond to the arguments of others. They reason inductively about data, making plausible arguments that take into account the context from which the data arose. Mathematically proficient students are also able to compare the effectiveness of two plausible arguments, distinguish correct logic or reasoning from that which is flawed, and—if there is a flaw in an argument—explain what it is. They justify whether a given statement is true always, sometimes, or never. Students participate and collaborate in a mathematics community. They listen to or read the arguments of others, decide whether they make sense, and ask useful questions to clarify or improve the arguments.
Evidence Statement(s)
Students develop a valid and complete mathematical argument to support a specific strategy for solving a mathematical problem. Students analyze a given mathematical problem in terms of all relevant cases that need to be considered in formulating a complete solution. Students evaluate and determine the validity of given mathematical arguments or solutions to mathematical problems. Students identify and correct conceptual and/or computational errors in given solutions to mathematical problems.
Content Limit(s)/ Constraint(s)
None
Depth of Knowledge
3
Item Type(s) Constructed Response (CR), Extended Response (ER)
Sample Item Stem(s)
A student claims that the distance from the … to the … is the same as the distance from … to …. Use words, numbers, and/or symbols to explain whether the student is correct.
Page 74 of 78
ISTEP+ Item Specifications
Mathematics 10
Reporting Category
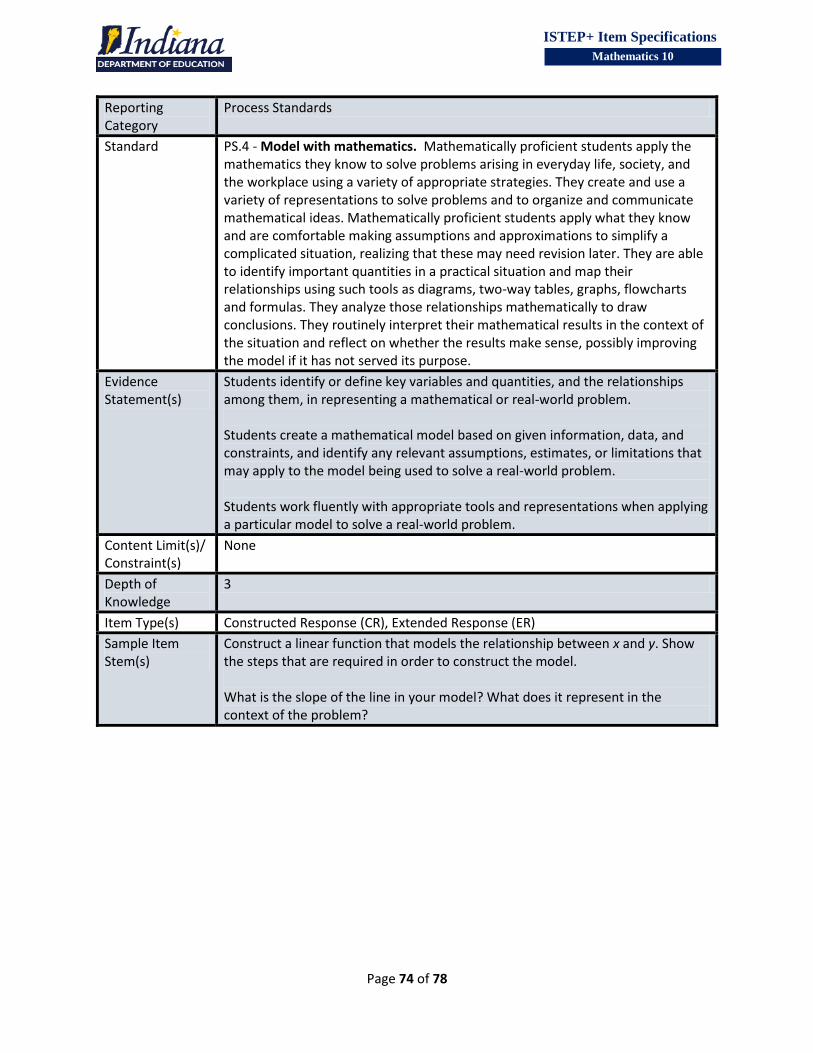
Process Standards
Standard PS.4 - Model with mathematics. Mathematically proficient students apply the mathematics they know to solve problems arising in everyday life, society, and the workplace using a variety of appropriate strategies. They create and use a variety of representations to solve problems and to organize and communicate mathematical ideas. Mathematically proficient students apply what they know and are comfortable making assumptions and approximations to simplify a complicated situation, realizing that these may need revision later. They are able to identify important quantities in a practical situation and map their relationships using such tools as diagrams, two-way tables, graphs, flowcharts and formulas. They analyze those relationships mathematically to draw conclusions. They routinely interpret their mathematical results in the context of the situation and reflect on whether the results make sense, possibly improving the model if it has not served its purpose.
Evidence Statement(s)
Students identify or define key variables and quantities, and the relationships among them, in representing a mathematical or real-world problem. Students create a mathematical model based on given information, data, and constraints, and identify any relevant assumptions, estimates, or limitations that may apply to the model being used to solve a real-world problem. Students work fluently with appropriate tools and representations when applying a particular model to solve a real-world problem.
Content Limit(s)/ Constraint(s)
None
Depth of Knowledge
3
Item Type(s) Constructed Response (CR), Extended Response (ER)
Sample Item Stem(s)
Construct a linear function that models the relationship between x and y. Show the steps that are required in order to construct the model. What is the slope of the line in your model? What does it represent in the context of the problem?
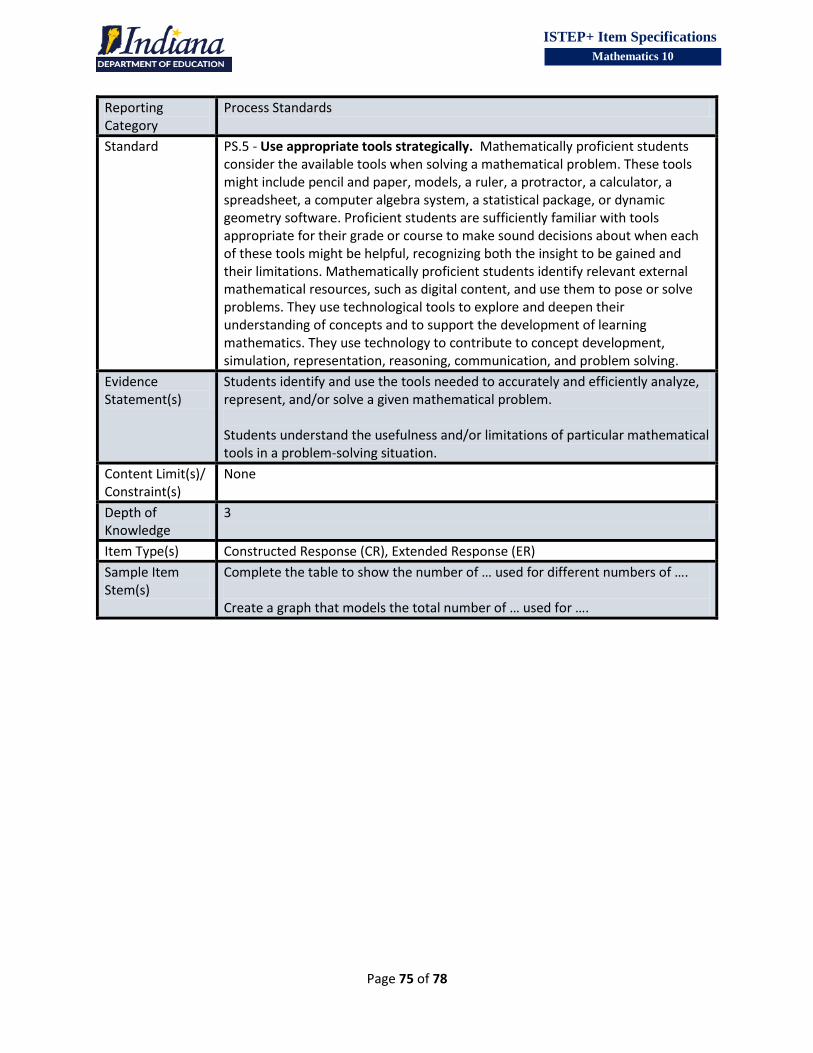
Page 75 of 78
ISTEP+ Item Specifications
Mathematics 10
Reporting Category
Process Standards
Standard PS.5 - Use appropriate tools strategically. Mathematically proficient students consider the available tools when solving a mathematical problem. These tools might include pencil and paper, models, a ruler, a protractor, a calculator, a spreadsheet, a computer algebra system, a statistical package, or dynamic geometry software. Proficient students are sufficiently familiar with tools appropriate for their grade or course to make sound decisions about when each of these tools might be helpful, recognizing both the insight to be gained and their limitations. Mathematically proficient students identify relevant external mathematical resources, such as digital content, and use them to pose or solve problems. They use technological tools to explore and deepen their understanding of concepts and to support the development of learning mathematics. They use technology to contribute to concept development, simulation, representation, reasoning, communication, and problem solving.
Evidence Statement(s)
Students identify and use the tools needed to accurately and efficiently analyze, represent, and/or solve a given mathematical problem. Students understand the usefulness and/or limitations of particular mathematical tools in a problem-solving situation.
Content Limit(s)/ Constraint(s)
None
Depth of Knowledge
3
Item Type(s) Constructed Response (CR), Extended Response (ER)
Sample Item Stem(s)
Complete the table to show the number of … used for different numbers of …. Create a graph that models the total number of … used for ….

Page 76 of 78
ISTEP+ Item Specifications
Mathematics 10
Reporting Category
Process Standards
Standard PS.6 - Attend to precision. Mathematically proficient students communicate precisely to others. They use clear definitions including correct mathematical language in discussion with others and in their own reasoning. They state the meaning of the symbols they choose, including using the equal sign consistently and appropriately. They express solutions clearly and logically by using the appropriate mathematical terms and notation. They specify units of measure and label axes to clarify the correspondence with quantities in a problem. They calculate accurately and efficiently and check the validity of their results in the context of the problem. They express numerical answers with a degree of precision appropriate for the problem context.
Evidence Statement(s)
Students maintain an appropriate level of precision throughout the problem-solving process and in the statement of the final answer. Students define relevant variables and symbols, and use these with consistency throughout the problem-solving process.
Content Limit(s)/ Constraint(s)
None
Depth of Knowledge
3
Item Type(s) Constructed Response (CR), Extended Response (ER)
Sample Item Stem(s)
If the function is linear, name the coordinates of the … of the function. Use words, numbers, and/or symbols to explain your answer. If the function is quadratic and has a … at …, what are the coordinates of …? Use words, numbers, and/or symbols to explain how you found your answer.
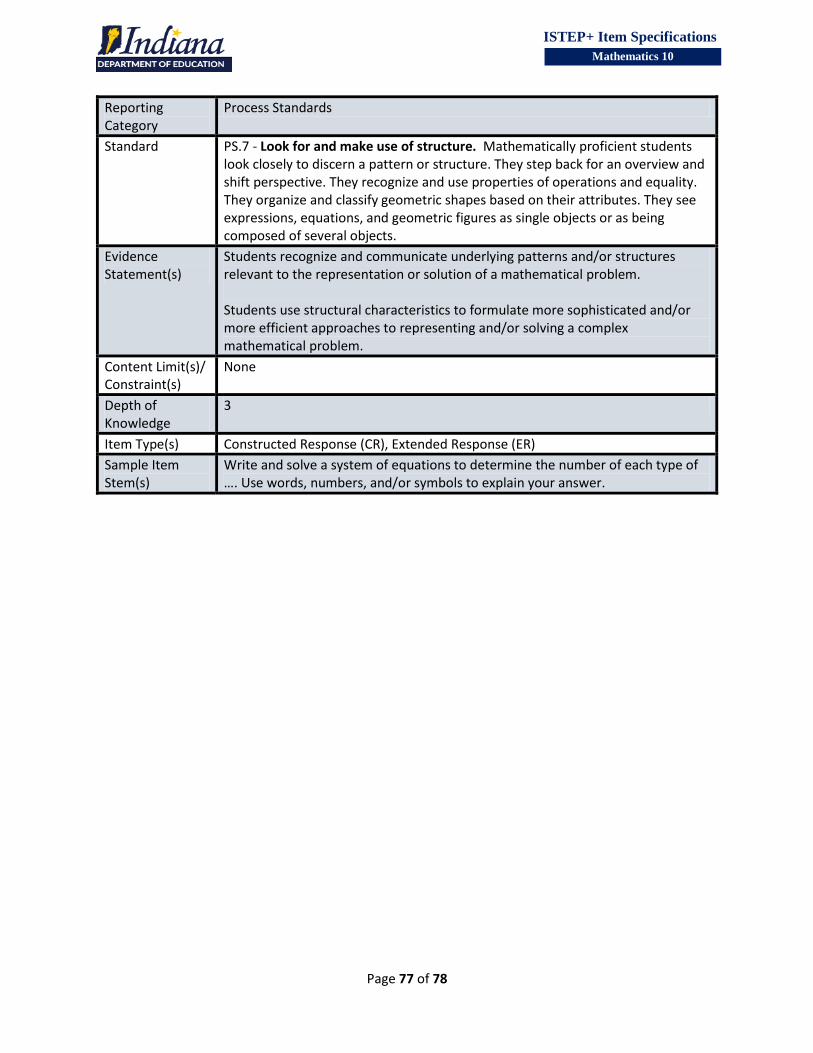
Page 77 of 78
ISTEP+ Item Specifications
Mathematics 10
Reporting Category
Process Standards
Standard PS.7 - Look for and make use of structure. Mathematically proficient students look closely to discern a pattern or structure. They step back for an overview and shift perspective. They recognize and use properties of operations and equality. They organize and classify geometric shapes based on their attributes. They see expressions, equations, and geometric figures as single objects or as being composed of several objects.
Evidence Statement(s)
Students recognize and communicate underlying patterns and/or structures relevant to the representation or solution of a mathematical problem. Students use structural characteristics to formulate more sophisticated and/or more efficient approaches to representing and/or solving a complex mathematical problem.
Content Limit(s)/ Constraint(s)
None
Depth of Knowledge
3
Item Type(s) Constructed Response (CR), Extended Response (ER)
Sample Item Stem(s)
Write and solve a system of equations to determine the number of each type of …. Use words, numbers, and/or symbols to explain your answer.

Page 78 of 78
ISTEP+ Item Specifications
Mathematics 10
Reporting Category
Process Standards
Standard PS.8 - Look for and express regularity in repeated reasoning. Mathematically proficient students notice if calculations are repeated, and look for general methods and shortcuts. They notice regularity in mathematical problems and their work to create a rule or formula. As they solve a problem, mathematically proficient students maintain oversight of the process, while attending to the details. They continually evaluate the reasonableness of their intermediate results.
Evidence Statement(s)
Students identify general strategies or techniques that can improve the efficiency of a solution to specific mathematical problems. Students maintain a balance between focusing on the specific mechanics of a mathematical solution and the overall goals of the problem. Students monitor and check the validity and accuracy of the mathematical calculations they perform in solving a mathematical problem.
Content Limit(s)/ Constraint(s)
None
Depth of Knowledge
3
Item Type(s) Constructed Response (CR), Extended Response (ER)
Sample Item Stem(s)
Use words, numbers, and/or symbols to show the complete factorization of …. Write a system of inequalities to represent this situation. Explain your answer.


![[03.03] Splitting Item Specifications](https://img.dokumen.tips/doc/110x75/623d85ebe8554f5e037a5045/0303-splitting-item-specifications.jpg)