Embed Size (px)
Citation preview

ITEM 3B
CURRENT STEEL MARKET
DEVELOPMENTS
Steel Committee, September 2017 Fabien Mercier, Hokuto Otsuka, Filipe Silva Emails: [email protected], [email protected]

1. Consumption
2. Production
3. Trade
4. Prices
5. Financial performance
6. Steel intensive sectors
7. Concluding remarks
2
Outline

3
Consumption
Consumption of hot-rolled steel products, major economies % change from one year earlier
-10%
-8%
-6%
-4%
-2%
0%
2%
4%
6%
8%
10%
12%
Note: Combined consumption of hot-rolled steel products of the following economies: Brazil, China, Germany, India, Japan, Korea, Russia and the United States. Consumption of hot-rolled products defined as the sum of production and net imports. Only first two months of 2017 where available.

4
Production
World crude steel production developments in 2016 and 2017
The increase of production was mostly felt in the Middle East, in Africa, in China and in Other Europe, whereas North America stagnated and the CIS production dropped.
% change, year-on-year
June 2017 2016 June 2017 2016 Jan-Jun 2017 / 2016
EU 14,237 162,145 2.8 -2.4 3.9
Other Europe 3,236 35,919 4.4 5.6 11.5
CIS 7,639 102,230 -8.0 0.8 -2.5
North America 9,662 110,624 0.2 -0.3 2.9
South America 3,412 40,220 3.4 -8.4 10.6
Africa 1,051 12,189 5.5 -4.7 11.0
Middle East 2,662 29,025 9.4 7.6 9.4
Asia, of which: 98,892 1,110,865 4.7 1.9 4.5
China 73,231 807,612 5.7 1.1 4.2
Oceania 504 5,837 -13.2 2.1 5.0
World 141,294 1,609,053 3.4 1.0 4.3
% change, year-on-yearLevel, thousand mmt

5
Trade
World exports of steel: monthly volume (mmt) and export ratio (% of production, 3-month moving averages)
A. Including intra-EU trade B. Excluding intra-EU trade
The export ratio, excluding intra-EU trade, continues to decline.

6
Prices
Margin between steel and raw materials prices
It seems that each time high margin occurs, both prices end up on a downward trend
0
200
400
600
800
1000
1200
0%
20%
40%
60%
80%
100%
120%
140%
160%
180%
Margin (LHS,%) Basket (RHS) Steel (RHS) USD/tonne

7
Financial performance
-8%
-6%
-4%
-2%
0%
2%
4%
6%
8%
10%
12%
Average Quartiles 1&3 Quartile 2
0%
10%
20%
30%
40%
50%
60%
Average Quartiles 1&3 Quartile 2
Evolution of net profits between 2000 and 2016
Evolution of indebtedness between 2000 and 2016
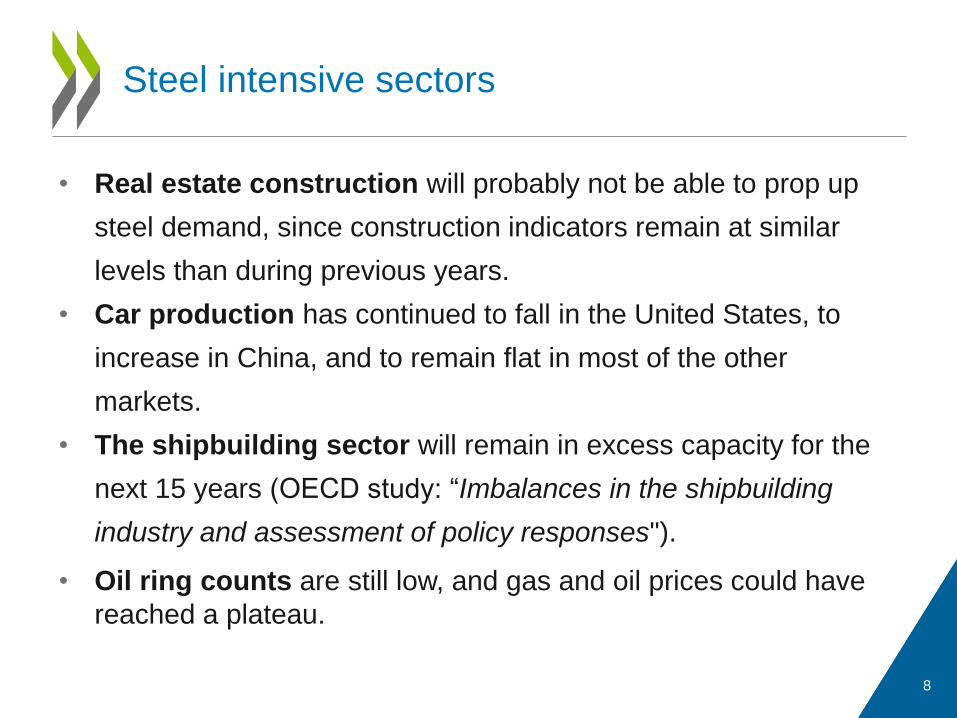
• Real estate construction will probably not be able to prop up
steel demand, since construction indicators remain at similar
levels than during previous years.
• Car production has continued to fall in the United States, to
increase in China, and to remain flat in most of the other
markets.
• The shipbuilding sector will remain in excess capacity for the
next 15 years (OECD study: “Imbalances in the shipbuilding
industry and assessment of policy responses").
• Oil ring counts are still low, and gas and oil prices could have
reached a plateau.
8
Steel intensive sectors

• The market situation of the steel industry has improved only
modestly compared to its 2015 lows and its recovery is expected
to remain sluggish
• Industry should take advantage of this breathing space to
deleverage and restructure, to focus on quality rather than
quantity, to adapt to the digitalisation of the economy and to
address pressing environmental challenges
• Policymakers should seek to remove barriers to exit, to abstain
from direct and indirect forms of support, and to ensure that
adequate bankruptcy regulations are in place while mitigating
specific closure costs
9
Concluding remarks

10
Thank you for your attention

11
ANNEXES: steel intensive sectors
ANNEXES: steel intensive sectors

12
Steel intensive sectors
Flows to Chinese and Indian real estate: A. China (y-o-y growth rate) B. India (in million rupees)
-10%
0%
10%
20%
30%
Total Investment Planned for Real Estate Development
Investment of Real Estate, Land Acquisition Costs
Investment of Real Estate, excluding land acquisitions
0
100000
200000
300000
400000
500000
600000
700000
-20%
-10%
0%
10%
20%
30%
40%
US new building permits Japan new house started Germany building permits by m2 area
New building permits or house started in the U.S., Japan and Germany:

13
Steel intensive sectors
Car production in selected economies Units, monthly production (United States on the right side scale)
0
1 000 000
2 000 000
3 000 000
4 000 000
5 000 000
6 000 000
0
200 000
400 000
600 000
800 000
1 000 000
1 200 000
1 400 000
China (LHS) Japan (LHS) Germany (LHS) Korea (LHS) United States (RHS)
14
Steel intensive sectors
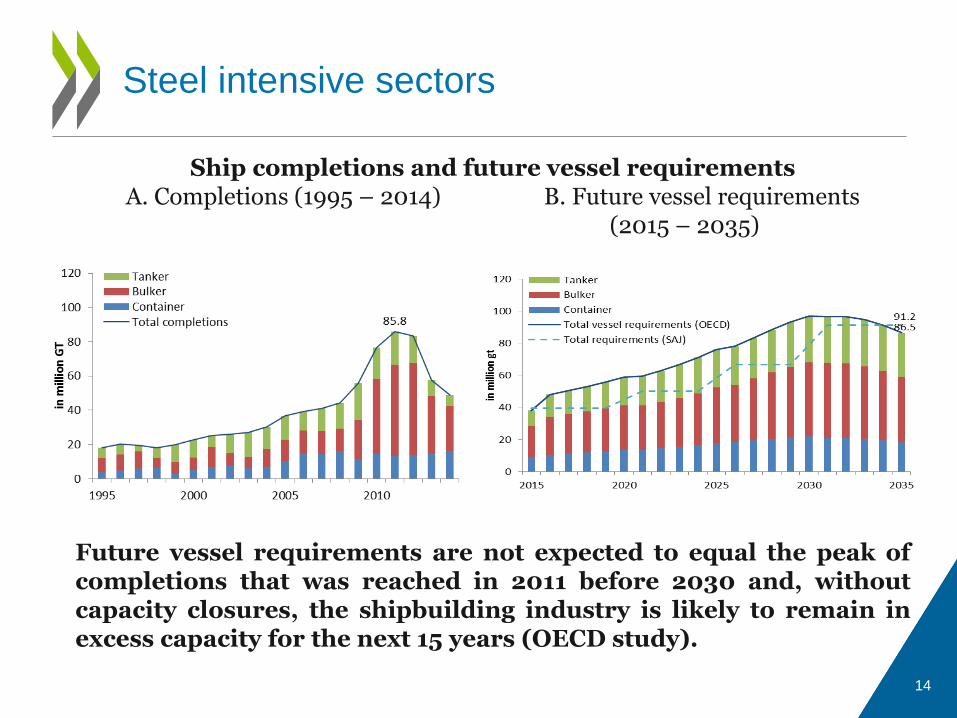
Ship completions and future vessel requirements A. Completions (1995 – 2014) B. Future vessel requirements
(2015 – 2035)
Future vessel requirements are not expected to equal the peak of completions that was reached in 2011 before 2030 and, without capacity closures, the shipbuilding industry is likely to remain in excess capacity for the next 15 years (OECD study).

15
Steel intensive sectors
Oil rig count, and oil and gas prices A. World rig count B. Oil and gas prices
0
1
2
3
4
5
6
0
20
40
60
80
100
120
Europe Brent Spot FOB, USD/Barrel (LHS)
Natural Gas, Henry Hub, USD/Million British Thermal Unit (RHS)
0
500
1000
1500
2000
2500
3000
3500
4000
US Middle East Canada Latin America
Asia Pacific Africa Europe World total