Embed Size (px)
Citation preview
1
ITC Working Papers Series
Paper 6 – October 2010
Effect of policy interventions on food security in Tigray, Northern Ethiopia
Tagel Gebrehiwot
and
Anne van der Veen
ISBN 978-90-6164-297-8 ITC University of Twente Faculty of Geo-Information Science and Earth Observation P.O. Box 6 7500 AA Enschede The Netherlands Phone:+31 (0)53 487 4444 Fax: +31 (0)53 487 4400 Parts of this paper may be copied under the conditions that copyright and source indications are also copied, no modifications are made and the document is copied entirely. Academic standards apply for citing and referencing source.
2
Effect of policy interventions on food security in Tigray, Northern Ethiopia
Tagel Gebrehiwot1
and
Anne van der Veen2
Abstract. Several interventions have been implemented to tackle the problems of food security and its driving forces in Tigray, Northern Ethiopia. This study attempts to investigate the effectiveness of government policy interventions addressed in improving food security and environmental degradation. Food security both at the regional and district level was determined by computing food balance Sheet for the period of 2000-2008. An empirical analysis based on a logit model is also used to analyze household level food security status; and effect of government interventions addressed to recover vegetation was investigated by employing multi-temporal NDVI images. The results of the logistics regression show that government policy interventions, such as water harvesting schemes, employment generation schemes and technology adoption significantly contribute to a higher likelihood of household food security status. The finding of the food balance sheet reveals that food self-sufficiency has improved both at the regional and district level and the multi-temporal analysis of vegetation change confirm that positive changes have been realized in rehabilitating the degraded environment over the past periods, indicating the importance of government strategy of area enclosures for the restoration of vegetation in the degraded land areas. The study suggests that the influence of governmental instruments on the interplay of social and natural phenomena is of importance for food security
Key words: food security, policy effectiveness, environment, rehabilitation
1 PhD student, Faculty of Geo-Information Science and Earth Observation (ITC), University of Twente, P. O Box 6, 7500 AA Enschede, The Netherlands 2 Professor of Governance and Spatial Integrated Assessment, Faculty of Geo-Information Science and Earth Observation (ITC), University of Twente, P. O Box 6, 7500 AA Enschede, The Netherlands
3
1. Introduction Over the last decades many developing countries have experienced notable progress in their economic growth and managed to improve the welfare status of their population considerably. Nevertheless, food security has not been attained in most developing countries and food insecurity continues to be a deep seated problem. As in other developing countries, Ethiopia is one of the most famine-prone countries with a long history of famines and food shortages. In Ethiopia, food insecurity among the population is wide spread, and most devastatingly, there have been some instances of famine that cost the lives of about a million people.
The dimensions, causes and consequences of food insecurity differ widely in the country. Tigray, our study region, is one of the regions most affected by recurrent drought and food security problems. Many people live in conditions of chronic hunger with a low average energy supply. A combination of factors has resulted in serious and growing problem of food insecurity. The combined problems of environmental degradation, irregular rainfall, high population pressure, recurrent cycle of drought, lack of diversification in economic activities and institutional factors threaten food security in the region. Low agricultural productivity, poverty and land degradation are critical and closely related problems in the highlands of Tigray.
In recognition of these problems, the Ethiopian government formulated a long-term strategy, Agriculture Development Led Industrialization (ADLI), to reverse the dire situation of small farmers and eventually alleviate its food deficiency. Cognizant with the peculiar problems of Tigray, the government of Tigray designed an agriculture development strategy of the region to be based on the rehabilitation, conservation and development of natural resources, and is known as conservation-based agricultural development policy, which forms food security strategy as its major component.
Following the conservation-based agricultural development strategy and food security strategy, the regional government has been implementing a number of pro-poor development activities to tackle the problems of food security and its causes. In the literature attention has been paid to analyzing the causes of food insecurity and dynamics of poverty, but studies on the impact of the government interventions on food security and its causes are limited. There is a small body of research that assesses the impact of food aid programs on household food security and welfare and to a more limited extent, nutrition (Barrett 2002). Important exceptions include Quisumbing (2003), Yamano et al. (2005), and Holden et al. (2006). In a recent paper, Gilligan and Hoddinott (2007) examined the importance of FFW on consumption, food security and assets in rural Ethiopia. Given the objectives of the government policy - ensuring food security and concomitantly addressing its causes in the log run- the evaluation of the effects of these integrated intervention upon food security and environmental rehabilitation is pertinent.
In this study we attempt to evaluate the effect of government policy interventions aimed at addressing the principal issue of environmental degradation and ensuring food security both at the regional and household level. The specific objectives of this paper are to: 1) investigate the changes in environmental rehabilitation particularly on vegetation cover 2) analyze and evaluate the regional food self sufficiency, 3) determine the determinants of food security with emphasis on indicators related to policy instruments. We used remote sensing imagery, regional and household data from Tigray region, northern Ethiopia, to demonstrate our study. We are not aware of any similar studies before with the aim to establish a linkage between scales of governance, food security and environmental degradation.
4
1.1. Defining Food Security Food security is a concept that has evolved over time. According to Hoddinott (1999), there are approximately 200 definitions and 450 indicators of food security. In the mid-1970s definitions of food security focused on aggregate food supplies at national and global levels, and analysts advocated production self-sufficiency as a strategy for nations to achieve food security, e.g. in the Food Availability Decline theory (FAD) (Sen 1981, Devereux 1993). According to the FAD theory, people starve because of a local, national or regional decline in food availability to a level below the minimum necessary for survival. This view focused merely on food production variables (supply side) and overlooked the multiple forces that in many ways affect food access (demand side variables). It said nothing about people’s income and purchasing power. Furthermore, it failed to address the vulnerability differences and access to food from outside the affected area (Sen 1981, Devereux 1993), which explain the significance of considering the issue of food security across different spatial scales.
In the 1980s, the focus of food security shifted from global and national levels to household and individual levels. Definitions further underwent another round of evolution after the 1996 World Food Summit. According to the refined definition, food security is seen as a situation that exists when all people, at all times, have physical, social and economic access to sufficient, safe and nutritious food that meets dietary needs and food preferences for an active and healthy life (FAO 2002). This definition is broader than the previous definitions for example that of the World Bank (1986), which was summed up by Maxwell and Frankenberg as “secure access at all times to sufficient food for a healthy life (Maxwell and Frankenberger 1992). As a result, a synthesis of these definitions, with the main emphasis on availability, access, and utilization, serves as working definition in projects of international organizations.
Apart from differentiating between spatial dimensions, the understanding of food security also includes a time dimension, describing the intensity and characteristics of household’s food insecurity. Consequently, food insecurity can be “chronic” or “transitory”. A constant failure to "access" food is distinguished as chronic, while a temporary decline is considered as transitory food insecurity (Maxwell and Smith 1992). Consistent handling of food security thus requires integrating time and spatial dimensions.
The concept of food security can be analysed for units at different conceptual levels and the exact dimensions that need to be measured vary depending on the level of analysis chosen. At a national or regional level, the status of food security can be analyzed in terms of supply indicators by looking at the ability of the country or region to obtain sufficient food to meet the needs of all citizens. At the household level, food security is monitored by using the aggregate of individual requirements. This looks at the ability of a household to meet its requirements either from its own production or through purchases. Consequently, food security is a concept that integrates a number of important issues, the magnitude of which ranges from micro to macro-economics.
1.2. Poverty and food insecurity in Ethiopia Over the last decades many developing countries have experienced notable progress in their economic growth and managed to improve the welfare status of their population considerably. Nevertheless, food security has not been attained in most developing countries and food insecurity continues to be a
5
deep seated problem. Still about 850 million people worldwide live with undernourishment, a number that has hardly changed from the 1990–1992 figures on which the World Food Summit and Millennium Development Goal commitments to halving hunger by 2015 were based (FAO 2006). Sub-Sahara Africa accounts for 13% of the population and 25% of the undernourished people in the developing countries (FAO 2005).
The number of undernourished in Africa has escalated from 169 million in 1990/92 to 212 million in 2003/05. Also, per capita food production has declined steadily over the past decades while it increased in the other parts of the world (FAO 2006). The state of food self-sufficiency deteriorates with each passing year thus increasing the number of food deprived households. The persistence of hunger in the developing world means that ensuring adequate and nutritious food for the population will remain the principal challenge facing policy makers in many developing countries in the new millennium (Stamoulis et al. 2004).
As in other Sub-Sahara Africa countries, Ethiopia is one of the most famine-prone countries with a long history of famines and food shortages that can be traced back to 250 BC (Webb and von Braun 1994). In Ethiopia, food insecurity among the population is wide spread, and most devastatingly, there have been some instances of famine that cost the lives of about a million people. Serious food shortages and high levels of malnutrition continue to affect a large number of people in several parts of Ethiopia. Many Ethiopians live in conditions of chronic hunger with both a low average daily energy supply (kcal/capita/day) of 1880 and a very high (44%) prevalence of undernourishment (Adnew 2004).
Most famines and food crisis in Ethiopia have been geographically concentrated in two broad zones of the country. The first consist of the central and northern highlands, stretching from northern Shewa through Wello and Tigray, and the second is made up of the crescent of low-lying agro-pastoral lands ranging from Wello in the north, through Hararghe and Bale to Sidamo and Gamo Gofa in the south (Ramakrishna and Assefa 2002). The number of people requiring food assistance is largest in Tigray, Amhara and Oromiya regions, accounting for about 71% of the total food aid recipients during the period 1994–2003.
Tigray, the study region, is one of the regions most affected by recurrent drought and food security problems in the country. Many people live in conditions of chronic hunger with a low average energy supply (Devereux and Sussex 2000). On average, about 1 million people required food assistance in the Tigray region over the period from 1994 to 2003. Even during good agricultural years such as 1995, 1996, 1998 and 2005, the number of people requiring food assistance in the region was more than 1 million, implying that food security is a priority issue in the region. Food crises together with chronic food shortages lead to compromised human well-being, hunger and malnutrition, posing serious challenges to governmental and non-governmental institutions, and policy and decision makers at all levels. Despite efforts being made and some signs of change, poverty and food insecurity in Ethiopia in general and in Tigray in particular is staggeringly high.
1.3. The underlying causes of food insecurity The debate in Ethiopia over the causes of inconsistent food security between regions and communities has fuelled highly contested viewpoints between the academic disciplines and in development thinking over the past few decades, giving rise to a proliferation of demographic, economic, and political emphases across the food security literature (Devereux 2001, Maxwell 2001). The recent 2002–2003 food crisis has been evaluated to be the result of a suite of political, social and economic factors rather

6
than only the result of environmental stressors leading to production shortfalls. Thus, despite that the root causes of food insecurity at the national, regional and household level are quite complex, the key factors in general can be grouped under three main types as natural causes, socio-economic factors, and policy failures.
Natural Factors
Drought and environmental degradation are important natural factors that make households vulnerable to food shortage. Stochastic rainfall causes severe droughts at irregular intervals and these droughts threaten the lives and livelihoods of millions of people. The agricultural sector is nearly totally dependent on rainfall and any weather fluctuation or rainfall failure means loss of major livelihood source that always accentuate food deficit. Approximately 8.5 million people, 10 percent of Ethiopia's population are facing annual food deficit due to weather fluctuations. Von Braun (1991) for example reported that a 10% decline in rainfall below its long average results in a 4.4% reduction in national food production. During an emergency situation their ability to survive depends on the "mining" of their already limited capital and assets including, physical assets (tools and oxen), natural assets (land and water) and human capital (education and labour). The mining of assets occurs when families take last resort actions such as selling productive assets and household goods in order to survive. But, these survival strategies result in long-term negative impacts. Consequently, the economic impacts of a crop failure are long-term and result in lifelong reductions in earnings. With each shock, families and communities become less able to cope and fall farther into food insecurity.
Frequent droughts are not the only factors contributing to Ethiopia's food security problems. Like many African countries the country confronts several environmental issues that are particularly problematic for the agricultural sector of the economy. Agricultural productivity is affected by environmental degradations including deforestation, over-grazing, soil erosion and loss of soil fertility. Sanchez and Swaminathan (2005) also argue that declining soil fertility is responsible for reduced food production. Environmental degradation can stunt food and agricultural development through a variety of adverse consequences such as soil degradation and deforestation, loss of bio-diversity and atmospheric changes. Environmental degradation is understood here as the depletion of natural resources such as vegetation, soil, biodiversity and water to the level that it may cause significant stress upon society through the physical and social constraints it exerts on productive options available (World Bank 1992).
In northern Ethiopia, land degradation has been ongoing for several centuries due to cultivation of steep slopes by the traditional ox-plough technology (Aune et al. 2001). Low agricultural productivity, poverty, food insecurity and land degradation are pervasive and interconnected problems in the Ethiopian highlands (Holden and Shiferaw 2004). These problems are particularly severe in the highlands of Tigray in northern Ethiopia (Pender and Gebremedhin 2008). Land degradation is the principal cause of the decline in agricultural productivity and total production (crop, livestock) in the region, rendering the region dependent on imported food (both in the form of purchased food and food aid). Due to degradation, increasing number of Tigreans has become vulnerable to the effects of drought. For rural people in Tigray, the environment is intimately linked to their lives and livelihoods. However, the pressure of intense human activity and improper farming and management practices pose serious threats to the sustainability of the natural resources. Accordingly, there is a widespread problem related to intensive cultivation, overgrazing and deforestation and soil erosion and soil fertility decline, water scarcity, livestock feed and fuel wood crisis. These factors often interact with
7
one another resulting in a reinforcing cycle of the “poverty, food insecurity and natural resources degradation trap”. This problem manifests itself in recurrent drought affecting millions of people.
Socio-economic factors
Social factors such as population pressure, traditional farming system and practices, and economic limitations like poor infrastructural services, shortage of farm land and other productive assets are also factors responsible for households’ food insecurity. Tigray’s population growth remains very high with an annual rate of approximately 2.5%, putting pressure on existing amenities. Population explosion along with limited possibilities to expand the area under rain-fed agriculture and lack of employment opportunities outside agriculture, has led to a sharp decline in reductions in farm size3. As farm size decreases the intensity of agriculture increases contributing to further land degradation and soil erosion. These perennial problems make Tigray one of the country’s poorest regions.
Government policy
In addition to natural and socio-economic factors, government policy failures or inappropriate development strategies and institutional weakness are claimed to be one of the main factors for the recurrence of food shortage, poverty and underdevelopment in many African countries (Bird et al. 2003). Paarlberg (2002) further notes that food insecurity persists largely because of governance and policy failure at the national level. Ethiopia suffered from misguided economic policies under the socialist Dergue regime, which ruled from 1974 until 1991. The policy framework of the past Governments and decade’s long civil war in the region has played a role in exacerbating food insecurity. With respect to the cause of the 1977-1988 Ethiopian famine, Downing (1996) note the correlation between famine areas and specific government policies.
To summarize, food security is a deep rooted problem in Ethiopia in general and in Tigray in particular. It is a multifaceted issue and its attainment demands integrated policies and technologies that can contribute to increased production, improved food security and concomitantly address the issue of environment. Given our objective as formulated in section we will need to address these interconnections.
1.4. Government Policy Instruments for food security In the discussion of development economics of the 1950s agriculture was not taken seriously as a potential for growth which could make a significant contribution to the overall economic development. It was only later that agriculture in developing countries started to be considered as a viable sector in which to commence development since it constitutes a dominant social and economic base (Mellor and Johnston 1984). With this in mind, the Ethiopian government formulated a long-term strategy to reverse the dire situation of small farmers and eventually alleviate its food deficiency, and concomitantly, promote the manufacturing sector to provide essential consumer goods. The adopted strategy is the agricultural development-led industrialization strategy (ADLI), which takes agriculture
3 The average area per household in 1999/2000 is estimated at 0.94 hectares. About 66 percent of households have less than one hectare. The size of cultivated land has decreased substantially with the rapid increase of population and the successive land distribution held in the country side. Between 1982 and 1999, average area owned by a household declined by 37.5 per cent from 1.52 hectare to 0.92 hectare. Obviously, the smallness of the available land per household makes it difficult for the farmers to feed themselves (Statistics Abstract 2000, March 2001).
8
as its point of departure and growth-engine (FDRE 1994). Cognizant with the peculiar problems of Tigray, the government designed the agriculture development strategy of the region to be based on the rehabilitation, conservation and development of natural resources, and is known as conservation-based agricultural development policy.
The long term development strategy of the government aims at promoting sustainable management of natural resources and increasing agricultural production, and ensuring food security and nutrition of the population. The strategy focuses on improving the production and productivity of smallholder agriculture through generation, adoption and diffusion of suitable farm technologies in the form of improved inputs and farming methods, provision of credit, and rural asset building. In order to mobilise small farmers and dissemination of better farming practices, the development strategy has been operationalized via the Participatory Demonstration and Extension Training System (PADETS). Broadly the aim is to attain food self-sufficiency and reverse ecological degradation.
Food security strategy is the major component of the ADLI strategy. The first version of the food security strategy was issued in 1996 and revised in 2002 highlighting the government’s plan to address causality and effects of food security in the country. The strategy envisages developing an agriculture-based economy by raising farm productivity and income. It however relies heavily on the distribution of farm inputs, such as chemical fertilizer and improved seeds to smallholder producers through its extension package. Conservation of natural resources has also gained emphasis in the food security strategy. We consider this as a main future of our research. Furthermore, the food security measures aim to promote and strengthen micro and small scale enterprise development, improving the food marketing system, promoting and strengthening supplementary employment, income generating schemes, and credit services to address the demand side problems.
In conclusion, which is important for the design of our study, food security instruments are seen by Ethiopian government as interplay between socio-economic and natural conservation issues.
As an example, in our study the government of Tigray is responding the food security challenges through an integrated approach. In the following sections, the interventions carried out to tackle the problems of food security are discussed.
1.4.1. Environmental rehabilitation
The International Food Policy Research Institute report (IFPRI 2005) indicated the need for alternative development strategies that address land degradation in order to ensure food security in less-favoured areas where drought risk is high. Even in its mild form land degradation reduces production in all the land resources and exacerbates rural poverty. This happens for the following reasons. Deforestation increases surface temperature, but reduces evapo-transpiration and thus also reduces rainfall and increases the length of the dry season (Parsons 1992). Reversing the degraded environment is therefore a key area of concern.
Poverty and food insecurity in the drylands of Ethiopia is caused by land degradation which amplifies the negative impacts of droughts, environmental rehabilitation through is required to reverse land degradation and reduce the severity and counter the impacts of droughts (Tewolde Berhan Gebre Egziabher 2006). Tewolde Berhan (2006), further stressed that any attempt at poverty alleviation and ensuring food security in Ethiopia has therefore, to start with environmental rehabilitation if it is to have any long lasting effect; and vegetation restoration is conceived a powerful tool for environmental rehabilitation (Aerts et al. 2004).

9
Consequently, halting environmental degradation through conservation programs, which focuses on conservation of natural resources gained top priority in Tigray as the main area of intervention to reverse agricultural productivity decline and ensure food security. Accordingly, several interventions have been implemented to tackle environmental degradation. One of which is the establishment of enclosure areas, whose aim is to protect degraded land resources for certain period of time from human and animal interferences.
This strategy is meant to benefit the environment and is a conservation effort that the community itself is operating. The main objective of area enclosures is recovery of the natural vegetation cover with concomitant benefits for reversing land degradation. This will in turn reduce the severity and counter the impacts of droughts in the long run. Furthermore, area enclosures will provide substantial benefits in conserving topsoil; greater recycling of organic material to the soil; watershed protection; and reducing erosion on barren hillsides. Consequently, both crop and animal production increase in good years; and impact of droughts also decreases making some production possible even in bad years (Tewolde Berhan Gebre Egziabher 2006). Usually area enclosures are established in steep, eroded and degraded areas used for grazing and crop production in the past.
The official data available on these areas indicate that up to 2000 a total of 262,704 hectares of degraded land in the region have been enclosed for rehabilitation purpose. The area enclosed in several districts of Tigray reached 890,000 hectares by 2008, covering about 16.8 percent of the land. This is in addition to the degraded lands with some remnants of forest species and state forest lands that have been enclosed by the government.
1.4.2. Intervention to enhancing food availability
Food availability is one of the three conditions of food security as defined in the World Food Summit. Increasing the production and productivity of agriculture in a sustainable manner could address the problem of food shortage by making more food available and by generating employment and income. With this in mind the regional government has given emphasis to bring substantial growth and expansion in the agricultural sector that would considerably reduce the spread of poverty and food insecurity in the region.
Accordingly different interventions were carried out to raise agricultural production by giving utmost attention to agricultural extension services. One of the major components of the extension package is the use of fertilizers and improved seeds. As indicated, the most plausible way to eradicate poverty is to increase food supply in the region and create the opportunity for people to attain food security. One of the means that has been followed to expedite the availability of enough food, which has been the obsession of the regional government, has been the increased use of fertilizers by smallholding farmers. Furthermore, several arrangements have also been worked out to facilitate farmers’ access to rural credit to enable them to purchase fertilizer and other agricultural inputs. The regional government, Dedebit Credit and Saving Institution (DECSI) and regional Cooperative Associations have made efforts to provide credit for such purpose. Accordingly, fertilizer consumption in the region has experienced a steady rise from about 58.6 tones in 2000 to about 166.2 tones in 2008.
The extension services also focused on introducing better and improved agricultural practices. These practices were also accompanied by the development of infrastructures that enable farmers to sell their products and buy farm inputs more easily. Development agents were assigned in each tabia (lowest administrative level) so that these agents train farmers by demonstrating practically the benefit of the program.
10
Furthermore, the government has also introduced a variety of water harvesting schemes, which is considered as the single most important means to increase agricultural productivity and address the problems of water shortage in the drought prone areas of Tigray. Accordingly, extensive pond construction and digging of water wells, traditional river diversion schemes and construction of small-scale irrigation schemes has been undertaken in different parts of the region since 2002. A total of 101,537 pond schemes were constructed during the period 2002-2005 of which 75.74% of the ponds constructed are being functional. Traditional river diversion schemes and small-scale irrigation schemes were constructed in different part of the regions. Consequently, the amount of land under irrigation has increased from 4773 hectare in 2000 to 29,734.6 hectare in 2008.
1.4.3. Interventions at Household level
In addition to programs oriented to agricultural production, two intervention programs - the integrated household level extension program known as the Food Security Package (FSP) program and Food for Work (FFW) program were implemented to fight food insecurity at household level. The FSP was launched in 2002 with the overall aim of generating and diversifying the rural employment and income that can reduce risks for the food insecure households. At the household level the FSP program intended to secure food by diversifying the income base of the poor through provision of resources (credit) for a range of activities in a package. A household can get financed for a range of activities (package) and loans are disbursed on an individual basis. Although the components of the package for which loans are granted differ from area to area to suit agro-ecological and other factors, the basic ones include livestock (oxen and cows), small animals (sheep and goats), poultry, beehives, seed and fertilizer. In 2003, the number chronically food insecure households covered by the food security package program were 49,427 (6.7%), and the number of beneficiaries increased to 629,328 (86%) rural households in 2008.
The Food-for Work program on the other hand served as a safety net for poor communities in food insecure areas. The Ethiopian Government has a policy of committing 80% of food aid resources to link with FFW programmes (Sanford and Habtu 2002). Poor households are made to work in public projects. It is a way of utilizing the food aid to development ends, while at the same time transferring food to the poor, i.e., a transition between emergency relief and the achievement of long term development objectives. The FFW programs are mainly meant to provide employment and generate public goods such as physical and social infrastructures. Ehui and Pender (2003) found that food-for-work and cash-for-work projects accounted for 40% of non-farm income in Tigray. The FFW projects are mainly linked to natural resource conservation programs and creation of community assets.
1.5. Why Policy evaluation? It is increasingly being recognised that improving food security is a foundation for reducing hunger and poverty, but also for economic development. “Reducing by half the proportion of people who suffer from hunger” by 2015 is used as one of the key indicators for poverty reduction in the framework of the Millennium Development Goals (FAO 2006). This reflects the insight that policies and programmes to improve food security outcomes have a role to play in poverty reduction and global development.
Accordingly many developing countries, like Ethiopia, have launched a series of development and poverty reduction programs and are making efforts to improve their food security. Consequently different development programs have been implemented over the past years. However, program

11
implementation by itself is not the final step. The question of how these policies affect those groups that are vulnerable to food insecurity, and thus its policy effectiveness, needs to be evaluated after a certain period of time.
Broadly speaking, evaluation refers to a process that seeks to determine as systematically and objectively as possible the effect of an intervention in terms of its objectives. The scope and methods of evaluation differ according to the questions to be addressed and the character of the policy measure. Thus, they can be retrospective (ex-post), current or prospective (ex-ante) evaluations, producing information that can be used in the assessment of past policies, the monitoring of ongoing initiatives or the forward planning of policies. In this research we used impact evaluation, which is applied to assess what changes can be attributed to the introduction of a particular intervention, program or policy (Dunn 2004, Kumar 2005). Evaluation research is undertaken for the purpose of determining the effectiveness policies and programs and is required to inform policymakers and the public on which public actions have been effective and which ones have not worked so well in solving social problems (Babbie 2003, Wond and Macaulay 2010).
Effect of government interventions on food security can be seen from different levels of analysis, and the exact dimensions that need to be measured vary depending on the level of analysis chosen. Thus, deciding on the level of analysis matters in evaluating government interventions. Furthermore, evaluation of the effectiveness of government instruments for food security is an evaluation of the outcome of different instruments in different areas of government policy that are deliberately designed to influence each other. In the next section we will present our design.
2. Data and methods
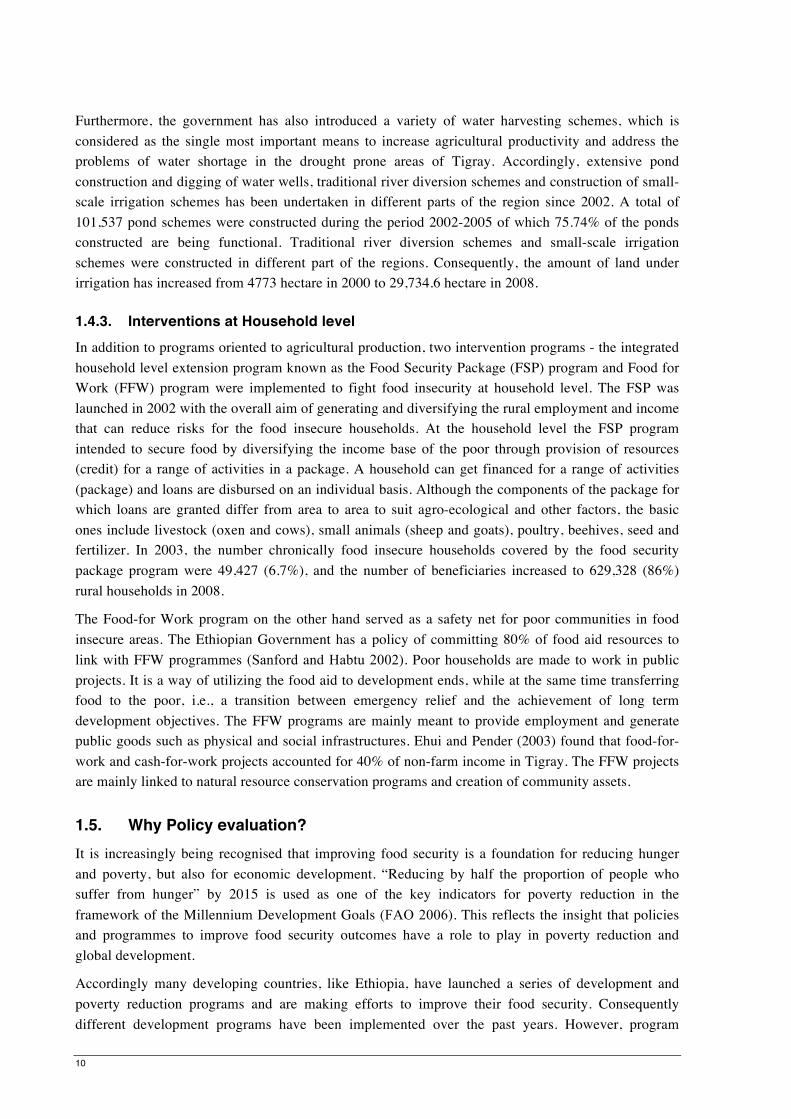
2.1. Description of the study area The study area, Tigray, lies in the northern Ethiopia and has a rugged terrain, ranging between 400 to almost 4000 m above sea level, covering a total area of 53,000 square kilometres. It lies between latitudes 12015N and 14057’N and longitudes 36027’E and 39059E’. The region is structured into 6 administrative zones and 34 districts, and its population is estimated to be about 4.5 million of which 80 percent lives in rural areas. The climate is predominantly semi-arid with irregular rainfall and frequent drought periods. Average yearly rainfall ranges between 500 and 900 mm yr-1, with a unimodal pattern, except in the southern part of the study area where a second (smaller) rainy season locally allows growing two successive crops within one year (Nyssen et al. 2005).
Land degradation has reached an alarming state in the highlands of Tigray due to the combined effects of deforestation, overgrazing, expansion of cropland and unsustainable use of natural resources (Herweg and Stillhardt 1999, Nyssen et al. 2004). The combined problems of land degradation, irregular rainfall, population growth, recurrent cycle of drought and lack of diversification in economic activities threaten food security in the region.
12
Figure 1: Administrative map of Tigray
2.2. Methodology
2.2.1. Design of the evaluation Area enclosures
Out of the 890,000 hectares of degraded landed enclosed for rehabilitation purposes in different parts of the region, our analysis of effects of government policy instruments on environmental rehabilitation was conducted over a total area of 49,255 hectares in Enderta district currently enclosed for the enhancement of natural vegetation. We assume that this will be an exemplary for the rest of area enclosures in the region.
Food production
We used a Food Balance Sheet method to evaluate the effects of government interventions to boost agricultural production. Here our main aim is to investigate the change in regional domestic production, which is critical in ensuring food security, over the period of 2000-2008 by using food availability ratio and self-sufficiency ration as basic indicators.
Food security at the household level
Logit analysis was conducted to determine the basic determinants that influence the likelihood of a household to be food secured using household data from six villages. Here emphasise was given to factors linked to governmental policy instruments by testing for their association to the likelihood of household’s food security status.
2.2.2. Vegetation change analysis The role of enclosure was examined by investigating the change in vegetation cover over the period of 2000-2008. We used the Normalized Difference Vegetation Index (NDVI) to detect the change in vegetation cover. NDVI is often used to monitor vegetation dynamics and it is a measure of vegetation cover and biomass (Myneni and Asrar 1994, Anyamba and Tucker 2005, Prasad et al. 2007). NDVI is the most commonly used vegetation index and NDVI values range from -1 to +1, where increasing
13
positive values indicate increasing green vegetation, and negative values indicate non vegetated surface features. NDVI assumes values between -0.2 and 0.05 for snow, inland water bodies, deserts and exposed soils, and increases from about 0.05 to 0.7 for progressively increasing amounts of green vegetation (Myneni et al. 1997). The distribution of NDVI represents green-leaf vegetation, and therefore, an NDVI profile throughout an annual cycle helps to determine whether the land cover at a particular location is broadleaf evergreen forest or broadleaf deciduous forest or grassland, or some other kind of biome.
The image processing was performed using ILWIS Geonetcast toolbox functionality; therefore all data had to be converted into raster formats compatible with the software. Each of the SPOT vegetation NDVI images were imported to the software package ILWIS 3.6 as a raster format and the original images were clipped to the study site.
After the image processing was done, a ten-day composite NDVI map for the third decade of February was produced for the period 2000-2008 to investigate the temporal change in vegetation cover. The change detection analysis was also investigated by employing the vegetation index differencing technique. Vegetation index differencing has the advantage of emphasising differences in the spectral response of different features by reducing impacts of topographic effects (Lu D. et al. 2004). In order to perform the differencing, we first produce the average NDVI image for the year 2000-2007; and the NDVI image of 2008 and the average NDVI image for the year 2000-2007 were interactively stretched to have the same NDVI values. Then the average NDVI image of the year 2000-2007 was subtracted from the SPOT 2008 NDVI image to obtain the difference image. Finally, the classification threshold values were determined by slicing techniques on the different images by carefully fixing the thresholds.
2.2.3. Determining Food Balance Sheet Food security at the regional level is determined by the availability of enough resources for the whole population. The most widely used indicator is the quantity of food available as compared with needs. Availability is a function of domestic production, imports, food aids and security stock. Of these, domestic production is critical in ensuring food availability at both regional and household levels.
The change in the regional level of food availability was analysed firstly by computing a so-called Food balance Sheet (FBS) for the period of 2000-2008. FBS is the principal tool used for calculating national food security, which is used to determine the expected food deficit or surplus, the necessary food import and/or food aid requirements (Frankenberger 1992). The Ethiopian government has designated 2,100 Kcal (or 225 kg. per annum) as a minimum acceptable weighted average nutritional requirement per person per day (FDRE 2001, MoFED 2002) and we used 2,100 calories of food per day (or 225 kilograms of cereals per person per annum) to determine the annual regional food requirements for the period. Based on the annual net cereal production, we determined self sufficiency ratio (SSR), which is measured as the ratio of the sum of net production of cereals to the requirement of food. Moreover, we derived regional food availability ratio (FAR) which is the ratio of the total food supply to the food requirement for the period of 2000-2008. Average of annual growth rate was computed to examine the temporal change in SSR and FAR over the period. In order to investigate the spatial effect of government interventions across the region, FBS was also computed for each district for the period 2000-2008 by employing similar methodology.
14
2.2.4. Household survey In a third experiment we used data from a household survey conducted in the districts of Kilte Awelaelo and Enderta. A two-stage random sampling procedure was used to select rural households. At the first stage, 6 villages (locally called Tabia) were selected randomly. In the second stage, random sampling techniques were employed to draw 90 sample households from the villages of Abrha Atsibha, Kihen, Tsegreda, Lemlem, Felege Selam and A’rato.
To measure household food security, first a minimum level of nutrition necessary to maintain healthy living for the population under study, below which households are classified as food-insecure, was defined. We used the 2100 kcal per adult equivalent per day (or 225kg per person/annum) demarcated by the government as a cut-off value between food-secure and food-insecure households. Then the daily per capita calorie consumption was estimated by dividing the estimated food supply, own produce, to the household. Thus, those households who have energy per adult equivalent below the minimum subsistence requirement are deemed to be food insecure, and those who managed to attain the 2100 kcal per adult equivalent per day are considered to be food secure households.
Once we categorized the sample households as food-secure and food-insecure, we selected a model to elicit the factors influencing the food security status of households at the study area. A variety of statistical models can be used to establish the relationship between household characteristics and food insecurity. Conventionally, linear regression analysis is widely used in most economic and social investigation because of availability of simple computer packages, as well as ease of interpreting the results. However, results derived from linear regression analysis may lead to fairly unreasonable estimates when the dependent variable is dichotomous. Therefore, the use of the logit or probit models is recommended as a panacea of the drawback of the linear regression model (Gujarati 2003). Though there is no binding reason to choose one over the other but for its comparative mathematical and interpretational simplicity many researchers tend to choose the logit model (Hosmer and Lemeshew 1989). Therefore, we employed the logit model for this study. Thus, the model uses food security status of households as the dichotomous dependent variable, which took a value one if a household was found to be food secure, zero otherwise.
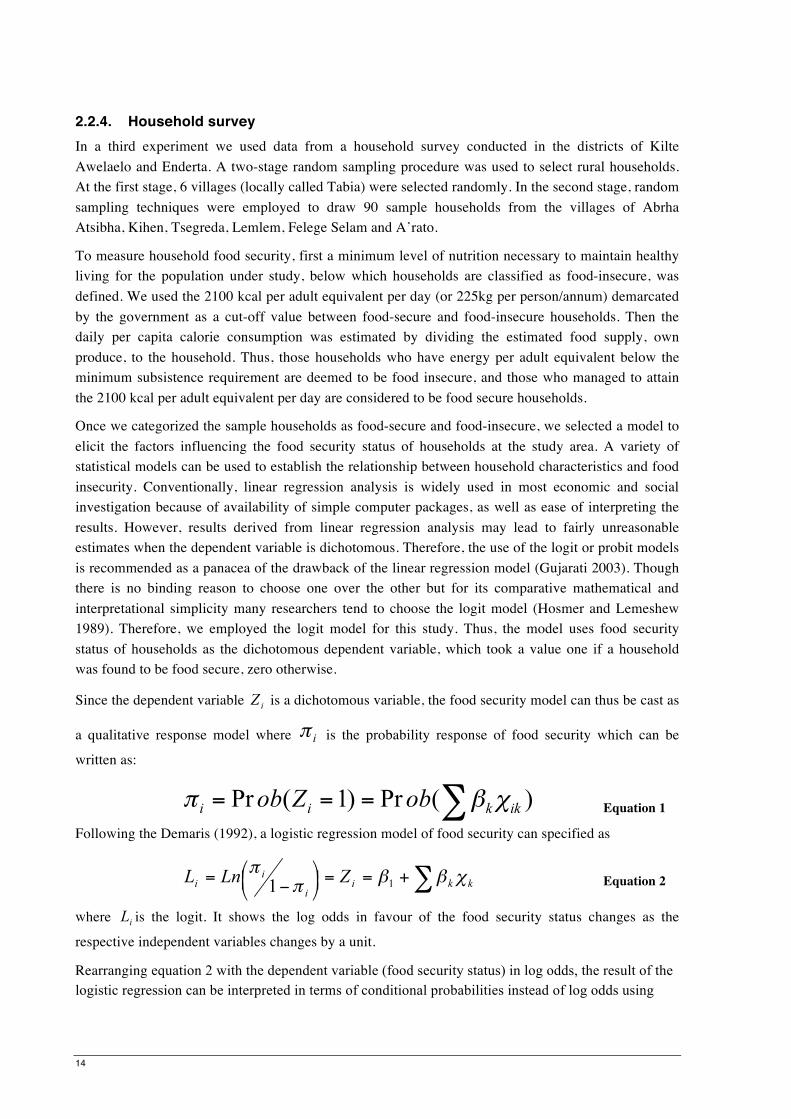
Since the dependent variable is a dichotomous variable, the food security model can thus be cast as
a qualitative response model where is the probability response of food security which can be
written as:
Equation 1
Following the Demaris (1992), a logistic regression model of food security can specified as
Equation 2
where is the logit. It shows the log odds in favour of the food security status changes as the
respective independent variables changes by a unit.
Rearranging equation 2 with the dependent variable (food security status) in log odds, the result of the logistic regression can be interpreted in terms of conditional probabilities instead of log odds using
15
Equation 3
Where is the conditional probability that household i is food secured, = constant term, =
coefficient for kith independent variable , with i= 1,…., n, for n=90.
Review of literature were used to identify the potential determinants of household food security with basic emphasis to factors linked to government policy instrument introduced to address the problem of food security in the study area. Therefore, food-for-work income, technology adoption, farmland size, access to irrigation, type of household head, age of household head, education level of household head, oxen ownership and off-farm activity were selected to analyze whether they explain a household’s food security or not. All the factors were a priori expected to have a positive impact on the food security status of households.
According to the literature subsistence farming, by its nature, is production for direct consumption. Any farm input that augments agricultural productivity is expected to boost the overall production. This contributes towards attaining household food security (Brown 2004). Thus, fertilizer and improved seed are expected to have positive effect. Fertilizer use was measured on the basis of amount of fertilizer used by a household. Improved seed was measured on the basis of whether or not a household applies improved (dummy variable).
Income determines the household's ability to secure food and it remains to be an important variable which explains the characteristics of food secure and food insecure households. Income earned in the form of one’s own production, or income earned from other activities that might be related to employment as daily wage labourers could enhance the capacity of household’s access to food. Therefore, a positive relationship is expected between household’s participation in Food-for-work (FFW) and food security status in this study. Since food-for-work income is linearly proportional to the number of working days, it can serve as a proxy for FFW income. Similarly, non-farm activity has been found to be positively correlated with income and wealth, and may offer a pathway out of poverty. Improved access to non-farm sources of income is likely to be good for household welfare, including food security (Holden et al. (2004). Therefore, a positive relationship is expected between household’s participation in off-farm activity and food security status in this study.
Education is an additional factor which is also thought to influence the food security status of households. Education equips individuals with the necessary knowledge of how to make a living. Literate individuals are keen to get information and use it. Hence, it is supposes that educational attainment by the household head could lead to awareness and benefit from the possible advantages of modernizing agriculture by means of technological inputs, which in turn would enhance households' food security. Educational status further reflects the household’s human capital and it is thus assumed to play a role in determining households’ food security. Households led by educated heads take a value of 1 while those who are led by uneducated heads take a value of 0.
Farmland size is a continuous variable. We expect farmland size to affect the food security status of households positively. According to Najafi (2003), food production can be increased extensively through expansion of areas under cultivation. Therefore, under subsistence agriculture, holding size is expected to play a significant role in influencing farm households' food security. The size of farmland owned by a household was determined by summing the fragmented plots, converting it into hectares.
16
For age the assumption is that the higher the age of the household head, the better the food security situation as there are more options of making food available from both agricultural and non-farm opportunities. Older persons are more risk averters, and mostly they tend to diversify their production activities. As a result, the chance for such a household to be food secure is more. Hofferth (2003), in his study, further argues that the higher the age of the household head, the more stable the economy of the farm household, because older people have also a relatively richer experience with their social and physical environments as well as greater experience in farming activities. Yet it could also be negatively correlated with food security indicating that as the head ages he/she might be less efficient to carry out demanding farm operations resulting in low farm production and productivity.
Households diversify their incomes by working on farms as daily labourers, petty trade activities and by working as daily labourers on construction. Employment in off-farm and non-farm activities has a paramount significance to diversify the sources of farm households’ livelihoods. It enables farmers to modernize their production by giving them opportunity to reduce the risks of food shortage during periods of unexpected crop failures. From this perspective, it is expected that employment in off-farm activity positively influences current household’s food security. In this study participation in off-farm and non-farm activities was measured by whether or not a household was engaged in those activities i.e. a dummy variable was used. We considered the off-farm job created through the government’s employment generation scheme.
Use of irrigation is a good strategy for promoting crop production in the region. Thus, it is hypothesised that household access to irrigation positively influences household’s food security status. A household who has access to irrigation activities took a value of one and households who did not engage in irrigation scheme took a value of zero.
Ox ownership is another determinant of food security status of households. Oxen serve as a source of traction in many developing countries, thereby significantly affecting households’ crop production. Animal traction power enables households to cultivate greater areas of land and to execute agricultural operations timely (Govereh and Jayne 1999). Therefore, a positive relationship between ox ownership and food security is expected in this study. The data on ox ownership is used by converting it into Tropical Livestock Unit (TLU) which comprises: 1 Ox = 1.1 TLU
Male-headed households are expected to have higher food security status than their female-headed counterparts since most female-headed households in the Ethiopian rural system are formed as a result of death of husband or divorce, a situation which leaves the female with insufficient resources such as livestock and other productive assets. It is assumed that male-headed households are in a better position to pull more labour force than the female-headed counterparts.
17
2.3. Data used Imagery data
Geo-referenced and de-clouded SPOT (Satellite Pour I’ Observation de la Terre) vegetation ten day composite Normalized Difference Vegetation (NDVI) images (S10 product) for the third decade of February were acquired from VGT4 Africa of the DevCoCast project website http://www.vgt4africa.org). Data are available as decadal NDVI products for the whole Africa since April 1998. Multi-temporal NDVI data was selected due to its provision of opportunities to recognize changes in vegetation in the study site. All images were taken in the dry season, third decade of February, according to the seasonal calendar of the study area thus preventing a dynamic change of vegetation cover that could occur due to seasonal variations.
Food availability
For deriving the food balance sheet at the regional and district level, data on annual agricultural production and population for the period of 2000-2008 were collected from Tigray Bureau of Finance and Economic Development (BOFED). Data on fertilizer supply, improved seed supply, irrigation coverage were also acquired from BOFED for the same period. Besides data on food aid was collected from Disaster Prevention and Preparedness Commission.
Household survey
Finally, primary data were collected from a household survey conducted in the districts of Kilte Awelaelo and Enderta. Data on the basic characteristics of households in terms of demography, resource endowment, economic activities, income, crop production, farm input use, as well as household coping strategies were collected. To generate the required data different methodological approaches such as in-depth interviews, focus group discussions, and field observations were employed. Data on income from food-for-work is computed from the number of labour-days supplied in the food-for-work reported for all participating households.
3. Results and discussions
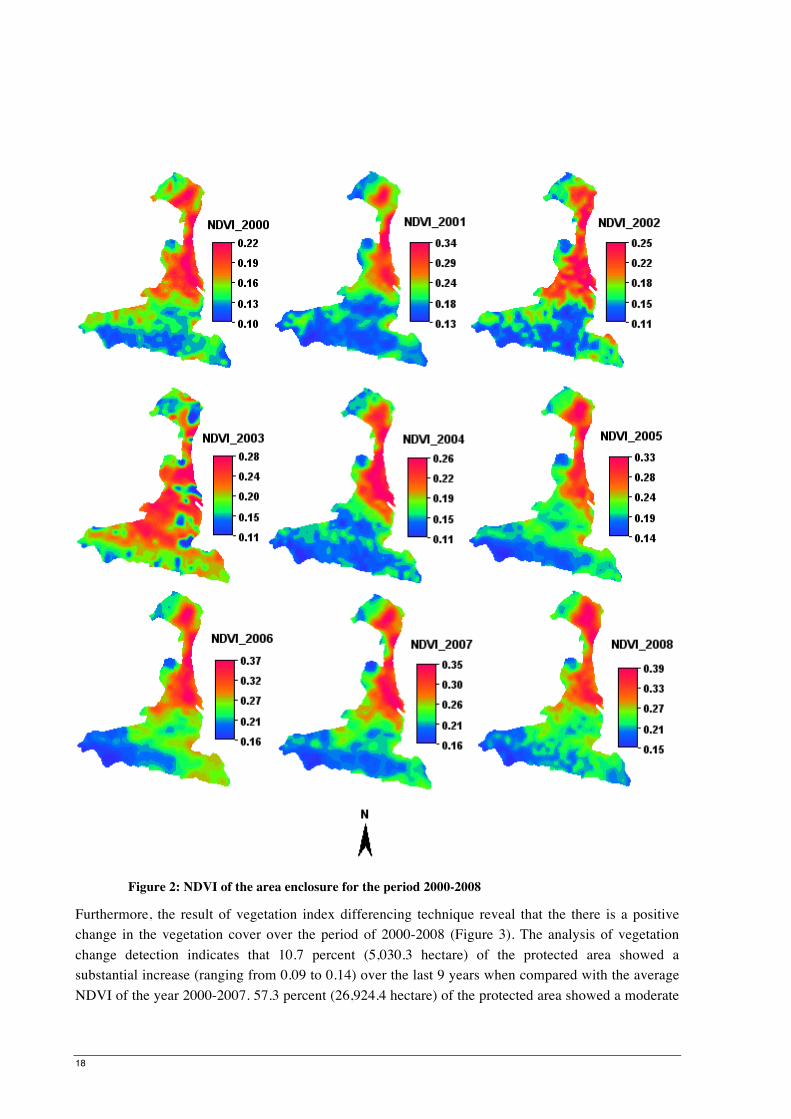
3.1. Environmental rehabilitation The effect of policy of area enclosure was assessed based on the objectives of environmental rehabilitation, in particular vegetation regeneration. Our result on the analysis of satellite imagery indicates that the temporal NDVI images of the area enclosure demonstrate a noticeable change in the NDVI values over the period of 2000-2008 (Figure 2). Our finding on the temporal vegetation change reveals an overall improvement in vegetation cover.
18
Figure 2: NDVI of the area enclosure for the period 2000-2008
Furthermore, the result of vegetation index differencing technique reveal that the there is a positive change in the vegetation cover over the period of 2000-2008 (Figure 3). The analysis of vegetation change detection indicates that 10.7 percent (5,030.3 hectare) of the protected area showed a substantial increase (ranging from 0.09 to 0.14) over the last 9 years when compared with the average NDVI of the year 2000-2007. 57.3 percent (26,924.4 hectare) of the protected area showed a moderate

19
change (ranging from 0.03 to 0.08 increases in NDVI values) and the analysis also further indicated that 32 percent of the area do not show change over the period.
Figure 3: Vegetation change in the Enderta area; 2000-2008
The vegetation change analysis thus reveals vegetation restoration of the degraded land was gradually achieved in these area enclosures implying that enclosure areas are useful in improving the ground vegetation cover. Generally, environmental recovery programmes could not heal all scars, but this study shows that overall there has been a remarkable recovery of vegetation in the study site over the period of 2000-2008. Similar encouraging results have been reported in studies for other area enclosures established within the last two decades in Tigray (Kindeya 1997, Mengistu et al. 2005, Muluberhan et al. 2006, Nyssen J. et al. 2007). Descheemaeker et al. (2006) in their study also found that vegetation regeneration in area enclosures has become an important measure to combat land degradation and to increase biomass production. Nyssen J. et al. (2007) study on the impacts of environmental rehabilitation also revealed that sheet and rill erosion rates have decreased, infiltration and spring discharge are enhanced, vegetation cover and crop production have improved in Tigray. In indicating the importance of enclosure for the restoration of vegetation in degraded land areas we demonstrate the effectiveness of the underlying government strategy.
One of the key factors in the environmental rehabilitation measures in the degraded areas is the devolution of natural resource governance to the lowest level; to those who are close to the problems of natural resource. Furthermore, the area enclosures in Tigray have been developed through a more participatory process. This appears to be one of the success factors of the programme in Tigray. The
20
community members are involved in site selection and decision-making for the enclosure areas. A village council decides upon the enclosures, is involved in organizing and encouraging participation in woodlot development and develops local rules and regulations. The village councils also finance the guards who protect area enclosures are nominated from the local people. The attitude of the community members towards these conservation areas and environmental rehabilitating measures is increasingly positive. The long-term positive aspect is the involvement of the community members in designing conservation strategies and shows a great success in achieving the goals set for the projects. Community based resource management practice is one of the success factors in the effectiveness of the implementation of government strategies in Tigray.
Efforts made by the regional government to rehabilitate the degraded lands by establishing area enclosures thus appears to be successful in halting and reversing land degradation in the study site. This will in turn reduce the severity and counter the impacts of droughts in the long run. Furthermore, area enclosures are providing substantial benefits in conserving topsoil; greater recycling of organic material to the soil; watershed protection; and reducing erosion on barren hillsides. These interventions are thus crucial in halting the ecological problems of the study region in the long run.
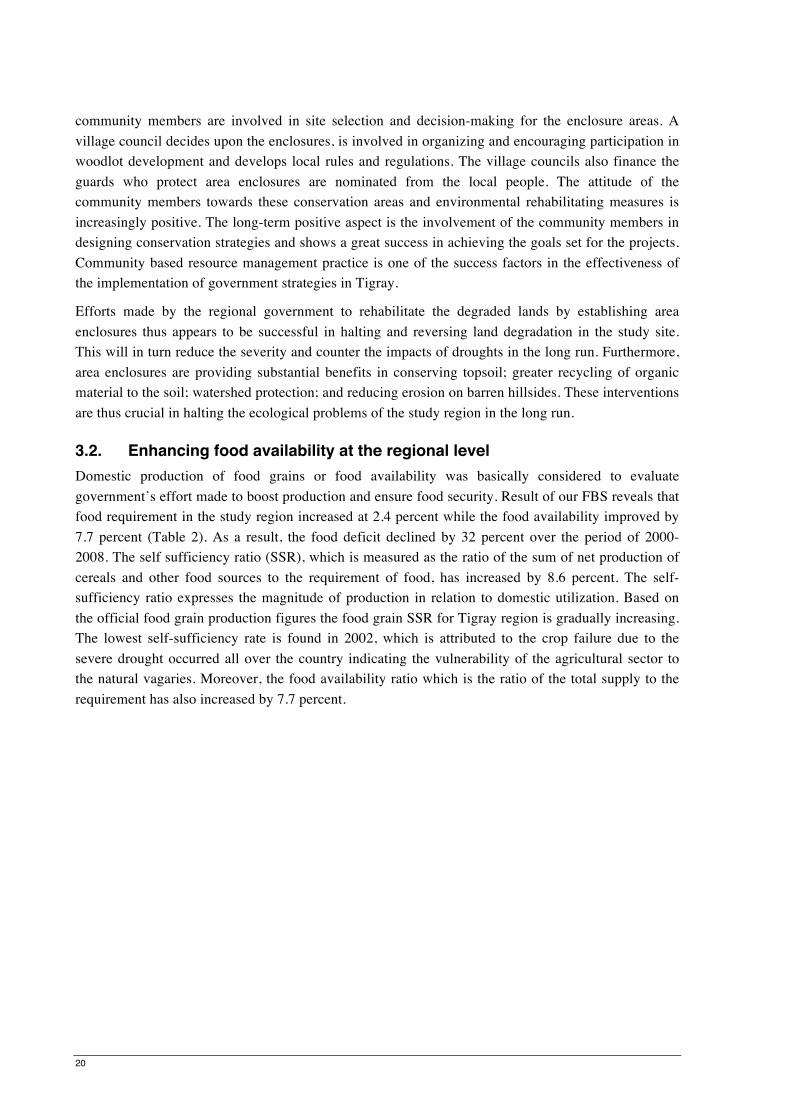
3.2. Enhancing food availability at the regional level Domestic production of food grains or food availability was basically considered to evaluate government’s effort made to boost production and ensure food security. Result of our FBS reveals that food requirement in the study region increased at 2.4 percent while the food availability improved by 7.7 percent (Table 2). As a result, the food deficit declined by 32 percent over the period of 2000-2008. The self sufficiency ratio (SSR), which is measured as the ratio of the sum of net production of cereals and other food sources to the requirement of food, has increased by 8.6 percent. The self-sufficiency ratio expresses the magnitude of production in relation to domestic utilization. Based on the official food grain production figures the food grain SSR for Tigray region is gradually increasing. The lowest self-sufficiency rate is found in 2002, which is attributed to the crop failure due to the severe drought occurred all over the country indicating the vulnerability of the agricultural sector to the natural vagaries. Moreover, the food availability ratio which is the ratio of the total supply to the requirement has also increased by 7.7 percent.
21
Table 1: Food Balance Sheet for Tigray Region, 2000 – 2008 No.
variable
2000
2001
2002
2003
2004
2005
2006
2007
2008
Growth rate (%)
1 Production of cereals in (“000“ MT)
748.4
843..3
414.0
608.1
657.9
715.0
1,115.9
1,275.9
1,335.2
11.2
2 Less 15% Post harvest loss
112.2
126.5
62.1
91.2
98.7
107.2
167.4
191.4
200..3
3 Less 6% seed
44.9
50.6
24.8
36.5
39.5
42.9
66.9
76.5
80.1
4 Net production (1-2-3)
591.2
666.2
327.1
480.4
519.7
564.9
881.6
1,007.9
1054.8
11.2
5 Food Aid
9.8
1.3
26.5
18.1
6.6
-
-
-
-
6 Total grain available (=total supply) (4+5)
601.0
667.6
353.6
498.6
526.4
564.9
881.6
1,007.9
1,054.8
10..33
7 Total population4 (“000”)
3,695
3,797
3,901
4,006
4,113
4,223
4,335
4,454
4,576
8 Food requirement at 2.25 Qt per person (“000” MT)
831.3
854.3
877.7
901.3
925.4
950.2
975..4
1,002.1
1,029.6
2.41
9 Food Balance (6-8)
-230.3
-186.7
-524.1
-402.8
-399.0
-385.3
-93.8
5.8
25.2
31.94
10 Self Sufficiency Ratio (4/8)
0.7112
0.7798
0.3726
0.5330
0.5616
0.5945
0.9038
1.01
1.024
8.55
11 Food Availability Ratio (6/8)
0.7230
0.7814
0.4028
0.5531
0.5688
0.5945
0.9038
1.01
1.024
7.72
Source: Computed by the authors, using data from Regional Bureau of Finance and Economic Development, and the Regional Disaster Preparedness and Prevention Commission, Tigray
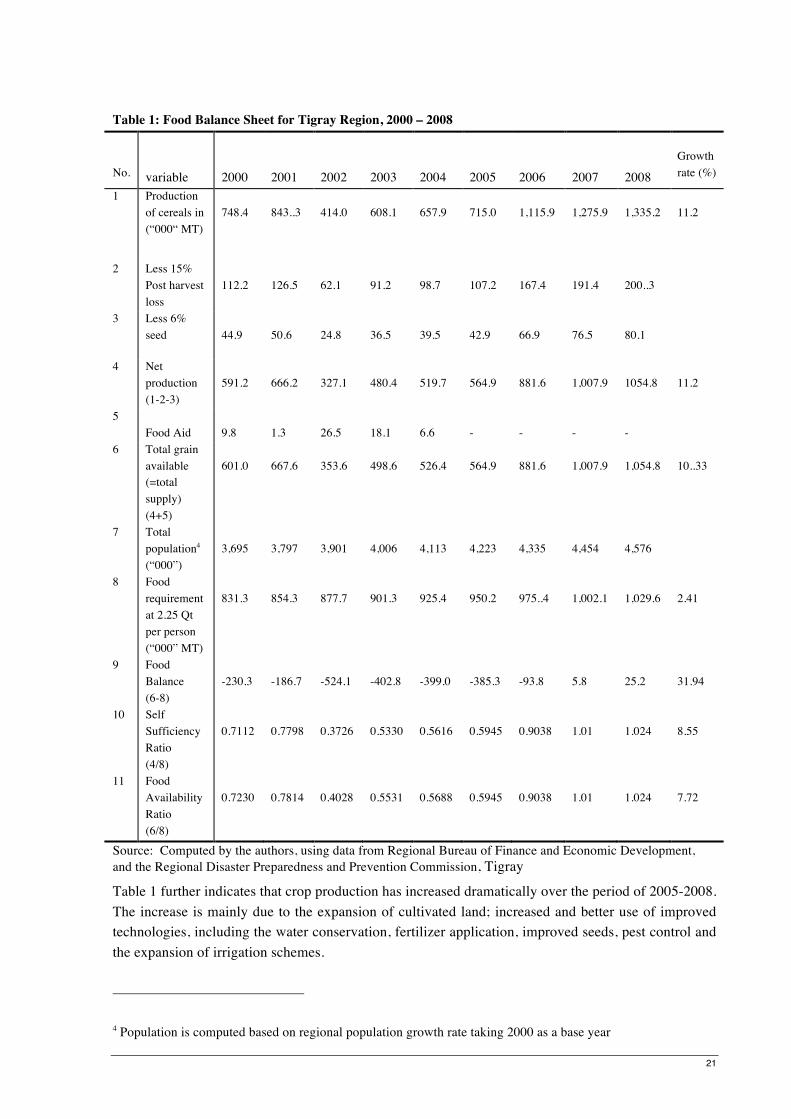
Table 1 further indicates that crop production has increased dramatically over the period of 2005-2008. The increase is mainly due to the expansion of cultivated land; increased and better use of improved technologies, including the water conservation, fertilizer application, improved seeds, pest control and the expansion of irrigation schemes.
4 Population is computed based on regional population growth rate taking 2000 as a base year
22
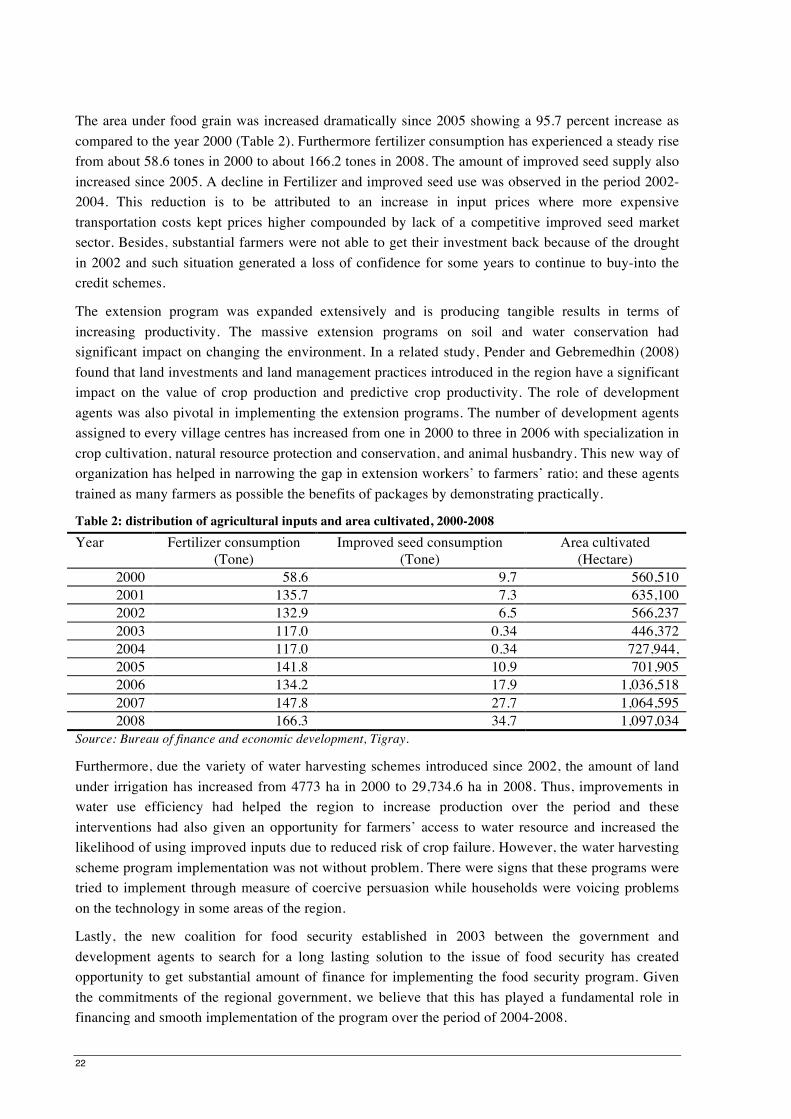
The area under food grain was increased dramatically since 2005 showing a 95.7 percent increase as compared to the year 2000 (Table 2). Furthermore fertilizer consumption has experienced a steady rise from about 58.6 tones in 2000 to about 166.2 tones in 2008. The amount of improved seed supply also increased since 2005. A decline in Fertilizer and improved seed use was observed in the period 2002-2004. This reduction is to be attributed to an increase in input prices where more expensive transportation costs kept prices higher compounded by lack of a competitive improved seed market sector. Besides, substantial farmers were not able to get their investment back because of the drought in 2002 and such situation generated a loss of confidence for some years to continue to buy-into the credit schemes.
The extension program was expanded extensively and is producing tangible results in terms of increasing productivity. The massive extension programs on soil and water conservation had significant impact on changing the environment. In a related study, Pender and Gebremedhin (2008) found that land investments and land management practices introduced in the region have a significant impact on the value of crop production and predictive crop productivity. The role of development agents was also pivotal in implementing the extension programs. The number of development agents assigned to every village centres has increased from one in 2000 to three in 2006 with specialization in crop cultivation, natural resource protection and conservation, and animal husbandry. This new way of organization has helped in narrowing the gap in extension workers’ to farmers’ ratio; and these agents trained as many farmers as possible the benefits of packages by demonstrating practically.
Table 2: distribution of agricultural inputs and area cultivated, 2000-2008 Year Fertilizer consumption
(Tone) Improved seed consumption
(Tone) Area cultivated
(Hectare) 2000 58.6 9.7 560,510 2001 135.7 7.3 635,100 2002 132.9 6.5 566,237 2003 117.0 0.34 446,372
2004 117.0 0.34 727,944, 2005 141.8 10.9 701,905 2006 134.2 17.9 1,036,518 2007 147.8 27.7 1,064,595 2008 166.3 34.7 1,097,034
Source: Bureau of finance and economic development, Tigray.
Furthermore, due the variety of water harvesting schemes introduced since 2002, the amount of land under irrigation has increased from 4773 ha in 2000 to 29,734.6 ha in 2008. Thus, improvements in water use efficiency had helped the region to increase production over the period and these interventions had also given an opportunity for farmers’ access to water resource and increased the likelihood of using improved inputs due to reduced risk of crop failure. However, the water harvesting scheme program implementation was not without problem. There were signs that these programs were tried to implement through measure of coercive persuasion while households were voicing problems on the technology in some areas of the region.
Lastly, the new coalition for food security established in 2003 between the government and development agents to search for a long lasting solution to the issue of food security has created opportunity to get substantial amount of finance for implementing the food security program. Given the commitments of the regional government, we believe that this has played a fundamental role in financing and smooth implementation of the program over the period of 2004-2008.
23
In general the result of the analysis on Food Balance Sheet reveal that food availability and regional food self sufficiency is increasing over the period 2000-2008, with dramatic increase over the period 2005-2008. The analysis reveal that the regional crop production in 2007 and 2008 has met the food requirement considering the necessary per capita dietary energy supply of 2,100 calories (or 225 kg. per annum). This indicates that an improvement in ensuring food self sufficiency at the regional level. However, food security at the regional level, i.e., self-reliance in food at the regional level does not necessarily mean food security at the district or household level. Food supply indicators at the regional level can provide some useful information regarding trends in food availability but they are often too aggregated to detect pockets of food deficit in a given district. Similarly, a Food Balance Sheet is not usually drawn upon at a disaggregated basis to detect differences across regions or districts (Davies et al. 1991) as cited in (Frankenberger 1992). Thus, looking at the spatial effect of government interventions across districts is vital in order to draw a concluding remark.
The findings of the FBS computed at a district level (See the Appendix) reveal that improvements in the self sufficiency ratio was observed in all districts except for Naeder Adet district, where the food self sufficiency ratio is decreased by 6.1 percent. In general, the region had an impressive performance on improving its food self sufficiency on a sustained basis since about 2005.
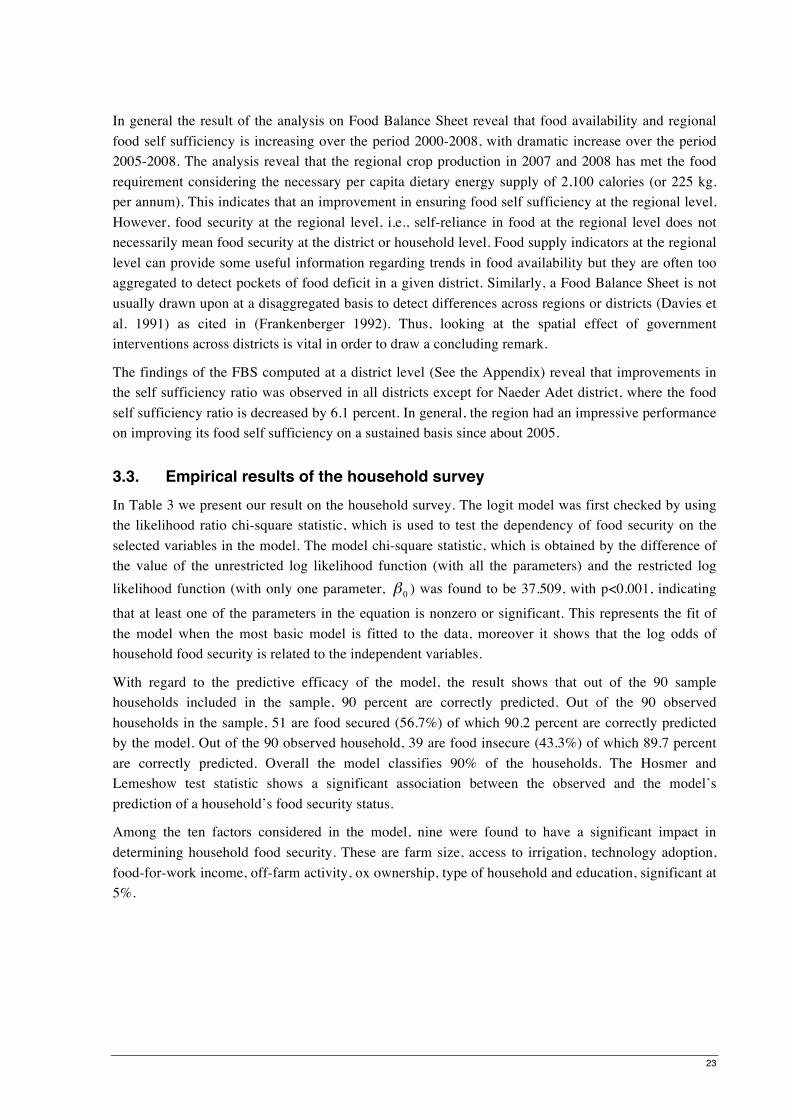
3.3. Empirical results of the household survey In Table 3 we present our result on the household survey. The logit model was first checked by using the likelihood ratio chi-square statistic, which is used to test the dependency of food security on the selected variables in the model. The model chi-square statistic, which is obtained by the difference of the value of the unrestricted log likelihood function (with all the parameters) and the restricted log likelihood function (with only one parameter, ) was found to be 37.509, with p<0.001, indicating
that at least one of the parameters in the equation is nonzero or significant. This represents the fit of the model when the most basic model is fitted to the data, moreover it shows that the log odds of household food security is related to the independent variables.
With regard to the predictive efficacy of the model, the result shows that out of the 90 sample households included in the sample, 90 percent are correctly predicted. Out of the 90 observed households in the sample, 51 are food secured (56.7%) of which 90.2 percent are correctly predicted by the model. Out of the 90 observed household, 39 are food insecure (43.3%) of which 89.7 percent are correctly predicted. Overall the model classifies 90% of the households. The Hosmer and Lemeshow test statistic shows a significant association between the observed and the model’s prediction of a household’s food security status.
Among the ten factors considered in the model, nine were found to have a significant impact in determining household food security. These are farm size, access to irrigation, technology adoption, food-for-work income, off-farm activity, ox ownership, type of household and education, significant at 5%.
24
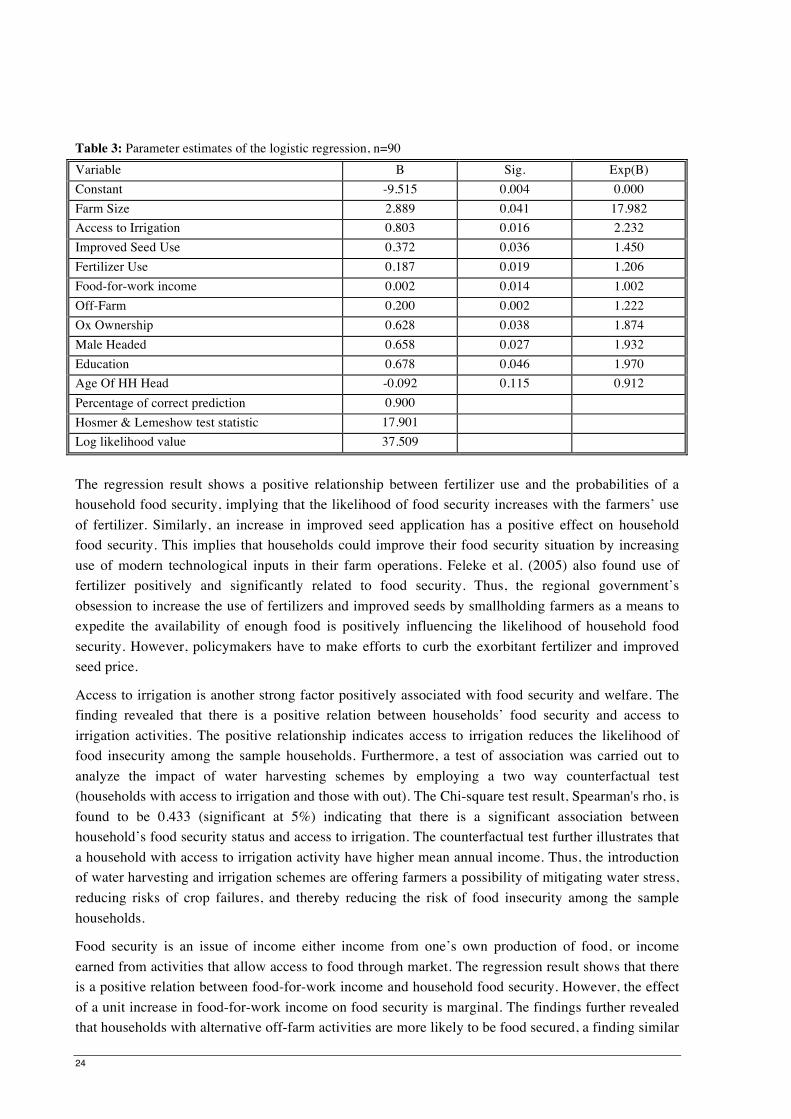
Table 3: Parameter estimates of the logistic regression, n=90 Variable B Sig. Exp(B) Constant -9.515 0.004 0.000 Farm Size 2.889 0.041 17.982 Access to Irrigation 0.803 0.016 2.232 Improved Seed Use 0.372 0.036 1.450 Fertilizer Use 0.187 0.019 1.206 Food-for-work income 0.002 0.014 1.002 Off-Farm 0.200 0.002 1.222 Ox Ownership 0.628 0.038 1.874 Male Headed 0.658 0.027 1.932 Education 0.678 0.046 1.970 Age Of HH Head -0.092 0.115 0.912 Percentage of correct prediction 0.900 Hosmer & Lemeshow test statistic 17.901 Log likelihood value 37.509
The regression result shows a positive relationship between fertilizer use and the probabilities of a household food security, implying that the likelihood of food security increases with the farmers’ use of fertilizer. Similarly, an increase in improved seed application has a positive effect on household food security. This implies that households could improve their food security situation by increasing use of modern technological inputs in their farm operations. Feleke et al. (2005) also found use of fertilizer positively and significantly related to food security. Thus, the regional government’s obsession to increase the use of fertilizers and improved seeds by smallholding farmers as a means to expedite the availability of enough food is positively influencing the likelihood of household food security. However, policymakers have to make efforts to curb the exorbitant fertilizer and improved seed price.
Access to irrigation is another strong factor positively associated with food security and welfare. The finding revealed that there is a positive relation between households’ food security and access to irrigation activities. The positive relationship indicates access to irrigation reduces the likelihood of food insecurity among the sample households. Furthermore, a test of association was carried out to analyze the impact of water harvesting schemes by employing a two way counterfactual test (households with access to irrigation and those with out). The Chi-square test result, Spearman's rho, is found to be 0.433 (significant at 5%) indicating that there is a significant association between household’s food security status and access to irrigation. The counterfactual test further illustrates that a household with access to irrigation activity have higher mean annual income. Thus, the introduction of water harvesting and irrigation schemes are offering farmers a possibility of mitigating water stress, reducing risks of crop failures, and thereby reducing the risk of food insecurity among the sample households.
Food security is an issue of income either income from one’s own production of food, or income earned from activities that allow access to food through market. The regression result shows that there is a positive relation between food-for-work income and household food security. However, the effect of a unit increase in food-for-work income on food security is marginal. The findings further revealed that households with alternative off-farm activities are more likely to be food secured, a finding similar
25
with Nyariki et al. (2002) who found involvement in off-farm activities positively and significantly affect food security in Kenya. Households which manage to secure supplementary income from off-farm activities have better access to the food they need than those households which do not. Thus, households with multiple income sources are also better off in terms of food security, and creating access to alternative employment opportunities is among the key measures necessary to ensure food security. This highlights the importance of food security package programs that create employment opportunities for farmers to diversify their income sources.
The results of the logit model indicated that sample households which had larger farm size had high probability of being food secure. This indicates that household farm land size influences food security positively. The possible justification is that farm households which had larger farm size had better chance to produce more and to diversify the crop they produce.
The results of the analysis also show that education is important in reducing food insecurity at household level. The impact of education in increasing food consumption and reducing food insecurity is significant in rural areas, i.e. households with higher levels of literacy are more likely to earn more income and enjoy increased food consumption than those households with lower levels of literacy. The Exp statistic for age of the household head suggests that the odds in favor of being food security decreased by a factor 0.912. This means that an increase in the age of the household head decreases the likelihood for the household to become food secure. This is possible because as the head ages he/she might be less efficient to carry out demanding farm operations resulting in low farm production and productivity.
The regression result also shows that ox ownership, in tropical livestock unit, of households has a significant and positive relationship with the likelihood of household food security. A unit increase in ox ownership increases the probability of household food security. This is an indication that ox ownership acts as a hedge against food insecurity in the study area.
The logit analysis reveal that government intervention, in creation of alternative employment opportunities, irrigation, household asset creation and increase agricultural input supply are among the key measures necessary to increase food security. However, the effect of food-for-work program on household food security is found to be marginal in this study.
4. Conclusion The primary objective of this study was to assess the effectiveness policy interventions addressed to tackle the problem of food security and its driving forces in the two districts of Tigray. To this end, effects of intervention on environmental rehabilitation were examined, a food balance sheet has been constructed and the food security causation studied using a logit model at the household level, which demonstrates a macro-micro level assessment of policy impact.
The conclusions based on our study can be summarised as follows:
1. The analysis based on remotely sensed imagery reveals that government interventions aimed at rehabilitating the degraded lands and developing the agro-economic infrastructure necessary to combat the challenges of drought and food insecurity are successful.
2. The data analysis based on food balance sheet reveals that food availability and regional food self sufficiency has improved over the period 2000-2008. As a result, the food deficit declined by 32 percent over the time period. The self sufficiency ratio (SSR), which is measured as the
26
ratio of the sum of net production of cereals to the requirement of food, has increased by 8.6 percent.
3. Food security studied through a logit analysis reveals that food security is an issue of income, access to irrigation, fertilizer and improved seed application, land holding and ox ownership.
4. Only research aimed at the interplay of environmental and socio-economic factors is able to unravel the changes in food security for a certain region.
Acknowledgements: The study was conducted under the support of the Ensure Project. The ENSURE project is financed by the European Commission under the 7th framework Program for research and Technology Development, Area “Environment”, Activity 6.1 “Climate Change, Pollution and Risks”. The paper reflects the author’s views that the European Commission is not liable for any use that may be made of the information contained therein. We are grateful to the two anonymous reviewers for their comments/suggestions which have helped to improve the original version of the paper.
27
References
Adnew, B. 2004. Food Insecurity in Ethiopia Journal of Agricultural and Development Economics 1:138-158.
Aerts, R., T. Wagendorp, E. November, B. Mintesinot, J. Deckers and B. Muys. 2004. Ecosystem thermal buffer capacity as an indicator of the restoration status of protected areas in the Northern Ethiopian Highlands. Restoration Ecology 12:586-596.
Anyamba, A. and C. J. Tucker. 2005. Analysis of Sahelian vegetation dynamics using NOAA-AVHRR NDVI data from 1981-2003. Journal of Arid Environments 63:596-614.
Aune, J. B., M. T. Bussa, F. G. Asfaw and A. A. Ayele. 2001. The ox ploughing system in Ethiopia: can it be sustained? . Outlook on Agriculture 30:275-280.
Babbie, E. 2003. The Practice of Social Research, Victoria etc., Wadsworth. Barrett, C. B. 2002. Food security and food assistance programs. Handbook of Agricultural
Economics. L. G. Bruce and C. R. Gordon, Elsevier. 2: 2103-2190. Bird, K., D. Booth and N. Pratt. 2003. Food Security Crisis in Southern Africa: The Political
Background to policy Failure. International Development Department, Birmingham University.
Brown, L. 2004. World Food Security Deteriorating: Food crunch in 2005 now likely. Earth Policy Institute, Washington DC, USA.
Demaris, A. 1992. Logit Modeling: Practical applications. London, SAGE Publications, Inc. Descheemaeker, K., J. Nyssen, Rossi J., J. Poesen, M. Haile, D. Raes, B. Muys, J. Moeyersons
and S. Deckers. 2006. Sediment deposition and pedogenesis in exclosures in the Tigray highlands, Ethiopia. Geoderma 132:291-314.
Devereux, S. 1993. Theories of Famine. New York and London, Harvester Wheat Sheaf. Devereux, S. 2001. Famine in the 20th Century. IDS Working Paper 105. Institute of Development
Studies, Sussex. Devereux, S. and I. Sussex. 2000. Food Insecurity in Ethiopia, A discussion paper for DFID. Addis
Ababa, Ethiopia. Downing, T. E. 1996. Climate Change and World Food Security: Proceedings of the NATO advanced
research workshop, held in Oxford U.K. July 11-15, 1993 Berline, Springer-Verlag. Dunn, W. N. 2004. Public Policy Analysis: An Introduction -3rd ed. New Jersey, Pearson Education
LTD. Ehui, S. and J. Pender. 2003. Resource degradation, low agricultural productivity and poverty in sub-
Saharan Africa: Pathways out of the Spiral. The Twenty Fifth International Conference of Agricultural Economics, Durban, South Africa.
FAO. 2002. The state of food insecurity in the world. Rome. FAO. 2005. The State of Food Insecurity in the World. Eradicating world hunger - key to achieving
the Millennium Development Goals, Rome. FAO. 2006. The State of Food Insecurity in the World. Eradicating world hunger-taking stock ten
years after the World Food Summit, Rome. FDRE. 1994. An Economic Development Strategy for Ethiopia, Addis Ababa. FDRE. 2001. Federal Democratic Republic of Ethiopia Food Security Strategy. Updated version.
Addis Ababa. Feleke, S. T., R. L. Kilmer and C. H. Gladwin. 2005. Determinants of food security in Southern
Ethiopia at the household level. Agricultural Economics 33:351-363. Frankenberger, T. R. 1992. Indicators and Data Collection Methods for Assessing Household Food
Security. Rome, Italy, IFAD, 107 Via del Serafico. Gilligan, D. O. and J. Hoddinott. 2007. Is there persistence in the impact of emergency food aid?
Evidence on consumption, food security, and assets in rural Ethiopia. American Journal of Agricultural Economics 89:225-242.
Govereh, J. and T. S. Jayne. 1999. Policy synthesis: Effects of cash crop production on food crop productivity in Zimbabwe: Synergies or trade-offs? USAID, Africa Bureau, Office of Sustainable Development No 40.
Gujarati, D. 2003. Basic Econometrics. Fourth Edition. New York, McGraw- Hill Companies.

28
Herweg, K. and B. Stillhardt. 1999. Implications of land use and land cover dynamics for mountain resource degradation in the Northwestern Ethiopian Highlands. The variability of soil erosion in the highlands of Ethiopia and Eritrea. Average and extreme erosion patterns. University of Berne, Switzerland: Soil Conservation Research Programme, Research Report 42.
Hoddinott, J. 1999. Operationalizing household security and development strategies, International Food Policy Research Institute, Technical Guideline, No. 1. Wasshington, DC.
Hofferth, S. 2003. Persistence and change in the food security of families with children, 1997-1999. Department of Family Studies, University of Maryland.
Holden, S., C. B. Barrett and F. Hagos. 2006. Food-for-work for poverty reduction and the promotion of sustainable land use: Can it work? Environment and Development Economics 11:15-38.
Holden, S. and B. Shiferaw. 2004. Land degradation, drought and food security in a less-favoured area in the Ethiopian highlands: a bio-economic model with market imperfections Agricultural Economics 30:31-49.
Holden, S., B. Shiferaw and J. Pender. (2004. Non-farm income, household welfare, and sustainable land management in a less-favoured area in the Ethiopian highlands Food Policy 29:369-392.
Hosmer, D. and S. Lemeshew. 1989. Applied Logistic Regression. New York, Wiley InterScience Publication.
IFPRI. 2005. Growth Options and Poverty Reduction in Ethiopia. A Spatial, Economy-wide Model Analysis for 2004-2015, Washington, DC.
Kindeya, G. 1997. Area Enclosures as an Approach in the Management of dryland Biodiversity: A Case Study in Tigray Region. Mekelle University, Mekelle.
Kumar, R. 2005. Research Methodology. A Step-by Step Guide for Beginners. Thousand Oaks, California 91320, SAGE Publications Inc.
Lu D., Mausel P., Brondízio E. and M. E. 2004. Change detection techniques International Journal of Remote Sensing 25:2365-2401.
Maxwell, S. 2001. The evolution of thinking about food security. In: Devereux, S., Maxwell, S. (Eds.), Food Security in Sub-Saharan Africa. ITDG Publishing, London.
Maxwell, S. and T. R. Frankenberger. 1992. Household Food Security: Concepts, Indictors, Measurements. New York, UNICEF/IFAD.
Maxwell, S. and M. Smith. 1992. Household food security: a conceptual review. In Household food security: concepts, indicators, and measurements: a technical review, edited by S. Maxwell & T. Frankenberger. New York and Rome, UNICEF and IFAD.
Mellor, J. W. and B. F. Johnston. 1984. The World Food Equation: Interrelations among Development, Employment, and Food Consumption. Journal of Economic Literature 22:531-574.
Mengistu, T., D. Teketayb, H. Hultenc and Y. Yemshawd. 2005. The role of enclosures in the recovery of woody vegetation in degraded dryland hillsides of central and northern Ethiopia. Journal of Arid Environments 60:259-281.
MoFED. 2002. Ministry of Finance and Economic Development, Ethiopia: Sustainable Development and Poverty Reduction Program. Addis Ababa.
Muluberhan, H., G. Oba, A. Ayana and R. B. Weladji. 2006. The role of area enclosures and fallow age in the restoration of plant diversity in northern Ethiopia. African Journal of Ecology 44:507-514.
Myneni, R. and G. Asrar. 1994. Atmospheric effects and spectral vegetation indices. Remote Sensing of Environment 47:390-402.
Myneni, R. B., C. D. Keeling, J. C. Tucker, G. Asrar and R. R. Nemani. 1997. Increased plant growth in the northern high latitudes from 1981 to 1991. Nature, 368:698-702.
Najafi, B. 2003. An overview of current land utilization systems and their contribution to agricultural productivity. Report of the APO Seminar on impact of land utilization systems on agricultural productivity, Productivity Organization, Islamic Republic of Iran Asian.
Nyariki, D. M., S. L. Wiggins and J. K. Imungi. 2002. Levels and causes of household food and nutrition insecurity in dryland Kenya. Ecology of Food and Nutrition 41:155-176.
29
Nyssen, J., J. Poesen, J. Moeyersons, J. Deckers, Mitiku Haile and A. Lang. 2004. Human impact on the environment in the Ethiopian and Eritrean highlands—a state of the art. Earth-Science Reviews 64:273-320.
Nyssen, J., H. Vandenreyken, J. Poesen, J. Moeyersons, J. Deckers, Mitiku Haile, C. Salles and G. Govers. 2005. Rainfall erosivity and variability in the Northern Ethiopian Highlands Journal of Hydrology 311:172-187.
Nyssen J., Munro N., Haile M., Poesen J, Descheemaeker K., Haregeweyn H., Moeyersons J, Govers G. and D. J. 2007. Understanding the environmental changes in Tigray: a photographic record over 30 years. VLIR-Mekele University Zala-Daget Project.
Paarlberg, R. L. 2002. Governance and Food Security in an Age of Globalization. Food, Agriculture, and the Environment; Discussion Paper 36. IFPRI. Washington D.C.
Parsons, P. 1992. Biodiversity and climatic change. In: Sandlund, OT, Hindar K. and Brown AHD (Eds), Conservation of Biodiversity for Sustainable Development. Oslo, Scandinavian University Press, pp. 155-167.
Pender, J. and B. Gebremedhin. 2008. Determinants of Agricultural and Land Management Practices and Impacts on Crop Production and Household Income in the Highlands of Tigray, Ethiopia. Journal of African Economies 17:395-450
Prasad, A. K., S. Sarkar, R. Singh, P., and M. Kafatos. 2007. Inter-annual variability of vegetation cover and rainfall over India. Advances in Space Research 39:79-87.
Quisumbing, A. R. 2003. Food aid and child nutrition in rural Ethiopia. World Development 31:1309-1324.
Ramakrishna, G. and D. Assefa. 2002. An Empirical Analysis of Food Insecurity in Ethiopia: The Case of North Wello African Development 27:127-143.
Sanchez, P. and M. Swaminathan. 2005. Hunger in Africa: The Link Between Unhealthy People and Unhealthy Soils. Lancet 265:442-444.
Sanford, S. and Y. Habtu. 2002. Emergency Response Interventions in Pastoral Areas of Ethiopia. Addis Ababa: DFID.
Sen, A. 1981. Poverty and Famine: An Essay on Entitlement and Deprivation, Oxford, Clarendon Press.
Stamoulis, K., P. Pingali and P. Shetty. 2004. Emerging challenges for food and nutrition policy in developing countries: Special issues on “Globalization of food systems: Impact on food security and nutrition” Journal of Agricultural and Development Economics 1:154-167.
Tewolde Berhan Gebre Egziabher. 2006. The role of forest rehabilitation for poverty alleviation in drylands. Journal of the Drylands 1:3-7.
von Braun. 1991. A policy Agenda for Famine Prevention in Africa. IFPRI - Food Policy Statement No. 13.
Webb, P. and J. von Braun. 1994. Famine and Food Security in Ethiopia: Lessons for Africa. Chichester: John Wiley & Sons.
Wond, T. and M. Macaulay. 2010. Evaluating local implementation: An evidence-based approach. Policy and Society 29:161-169.
World Bank. 1992. World Development Report 1992: A Good Overview of the Current Environmental Conditions and the Potential Sustainable Development. Oxford University Press, Oxford, UK.
Yamano, T., H. Alderman and L. Christiaensen. 2005. Child growth, shocks and food aid in rural Ethiopia. American Journal of Agricultural Economics 87:273-288.

30
Appendix: Food Balance Sheet computed for the 34 Districts of Tigray, 2000-2008 Growth rate
S/N
District
Self Sufficiency Ratio (SSR)
Food Availability Ratio (FAR)
1 Adwa 154.6 25 2 Ahferom 77.8 3.2 3 Alaje 112.9 39 4 Alamata 13.4 1.9 5 Asegede Tsimbla 14.2 15.2 6 Atsbi Womberta 46.7 6.1 7 Degua Temben 13.5 2.5 8 Endamehoni 29.8 8.7 9 Enderta 46.3 21.1 10 Erob 29.2 16.3 11 Ganta Afeshum 45.6 3.5 12 Gulomekeda 68.3 17.9 13 Hawezen 54 18.9 14 Hintalo Wajerat 41.3 24.2 15 Kafta Humera * - - 16 Kilte Awelaelo 66.7 11.2 17 Kola Temben 16.6 3.2 18 Laelay Adiyabo 27.4 28 19 Laelay Maichew 0 -4.8 20 Medebay Zana 11.6 8.8 21 Merebleke 202.7 33.2 22 Naeder Adet -6.1 -1.8 23 Ofla 12.5 8.7 24 Raya Azebo 143.2 160 25 Saesie Tsaeda Emba 61.6 17.5 26 Saharti Samere 9.6 1.3 27 Tahetay Adiyabo 169.1 117.8 28 Tahetay Koraro 11.5 16.1 29 Tahetay Maichew 19.7 7 30 Tanqua Abergele 70.6 20.8 31 Tsegede 36.2 36.2 32 Tselemti 31.1 12.8 33 Welkait 24.8 13.4 34 Werieleke 18.5 0.1 * The district was not included in the analysis as commercial farm owned by investors is highly practiced in the district