Embed Size (px)
Citation preview
ITB Policy
2020 Annual Report
Economic and Innovation
Impact Analysis

Context
• The Industrial and Technological Benefits (ITB) Policy* leverages major defence and Coast Guard procurements to create jobs, drive innovation and foster economic growth in Canada
• ISED publishes two reports each year in an effort to be transparent about the results and status of the ITB Policy
*ITB’s predecessor, the Industrial and Regional Benefits (IRB) Policy, is included in the analysis on the ITB Policy.
1) ITB Annual ReportHighlights the economic and
innovation impact of the ITB Policy
2) Report on Contractor ProgressDemonstrates contractors’ progress in
meeting their I TB obligations
2

Presentation Overview
*Small and Medium-Sized Businesses (SMBs) are defined as firms w ith 249 or less employees.
Economic Impact
Value Propositions
Scaling Up SMBs*
Key Findings
Obligation Progress
Report
Academic R&D and
Skills
Commitments by
Industry
Annex – Economic
Impact Methodology
Principles
3

The ITB Policy is estimated to contribute close to 46,000 jobs and more than $5.0B to Canada’s GDP annually
GDP Economic ImpactAnnual Av erage*
2014-2018
ITB Recipients
$2.5B
Canadian
Suppliers toITB Recipients
$1.4B
Consumer
Spending by Associated
Employees $1.1B
Jobs Economic ImpactAnnual Av erage*
2014-2018
ITB Recipients
20,900 Jobs
Canadian
Suppliers toITB Recipients
13,800 Jobs
Consumer
Spending by Associated
Employees 11,000 Jobs
Source: ISED economic modelling based on the ITB administrative database (IRB Policy (2014), I TB Policy (2014-2018)), 2020; Stat istics Canada’s Input-Output multiplier (2016), 2020; ITB investments are based on Canadian content value credited according to the ITB Policy before credit
mult ipliers are applied.*5-year annual average economic impact analysis based on latest ITB ident ified credits during the period of 2014-2018.
Value Chain Impact
$3.9B
Value Chain Impact
34,700 Jobs
4

Future
Opportunities$5.3B
There are 101 active ITB projects resulting in ITB economic obligations of $36B
• More than 600 Canadian organizations are benefitting from active ITB projects
• There is over $5.3B of future opportunities for Canadian companies to develop informed partnering strategies
Source: I TB administ rat ive database (IRB Policy (2014), I TB Policy (2014-2018)), 2020; ITB investments are based on Canadian content value credited according to the ITB Policy before credit mult ipliers are applied.
*Further details are available in the Report on Contractor Progress w hich can be found on ISED’s ITB w ebsite.
5
Current Economic Obligations*
In Progress
$6.6B
Completed
$24.3B

10 new projects were awarded in 2019, adding over $2.3B in ITB economic obligations
Source: I TB administ rat ive database (IRB Policy (2014), I TB Policy (2014-2030)), 2020; ITB investments are based on Canadian content value credited according to the ITB Policy before credit multipliers are applied.
*Small and Medium-Sized Businesses (SMBs) are defined as firms w ith 249 or less employees.**Amounts can be used on mult iple Value Propositions. The numbers presented in the above graph are not distinct to one Value Pro position.
***Breakdow n reflects 2019 contracts w here Value Propositions w ere applied.
Value Proposition Commitments Breakdown**
2019 Awarded Contracts***
6
42%
27%
15%
Defence Sector Supplier
Development
R&D
Resulted in signif icant commitments in:
• Defence Sector
• Supplier Development
• R&D
Included:
• Export plans to attract global
mandates
• Export opportunities for SMBs*
Introduced:
• Key Industrial Capabilities (KICs)
• Skills Development and Training
• Gender and Diversity Plans
Awarded Contracts in 2019

31%
59%
5%
3%
53%
19%
23%
51%
10%
31%
69%
5%
23%
45%
35%
16%
Source: ITB administ rat ive database (IRB Policy (2014), I TB Policy (2014-2030)), 2020; ITB investments are based on Canadian content value credited according to the ITB Policy before credit multipliers are applied.
*Breakdow n based on 2014-2018 ITB credits and 2019-2030 ITB commitments. Amounts w ith unident ified sectors w ere excluded from the breakdown.
Breakdown of ITB Commitments*by Industry
Activ e ITB Projects
WESTERN CANADA
Bre
ak
do
wn
of
We
ste
rn C
ana
da
Co
mm
itm
en
ts*
ONTARIO
Bre
akd
ow
n o
f
On
tario
Co
mm
itm
ents
*
QUEBEC
ATLANTIC CANADA
Bre
ak
do
wn
of
Atla
ntic
Ca
na
da
Co
mm
itme
nts*
Bre
ak
do
wn
of
Que
be
c
Co
mm
itme
nts*
Marine
Aerospace
Information
Technology
/ Land
Space
100%
100%
100%
100%
ITB commitments align closely with regional industrial strengths
1%
4%
2%
2%1%
2%
5%
3%
2%
Other
Industries
7
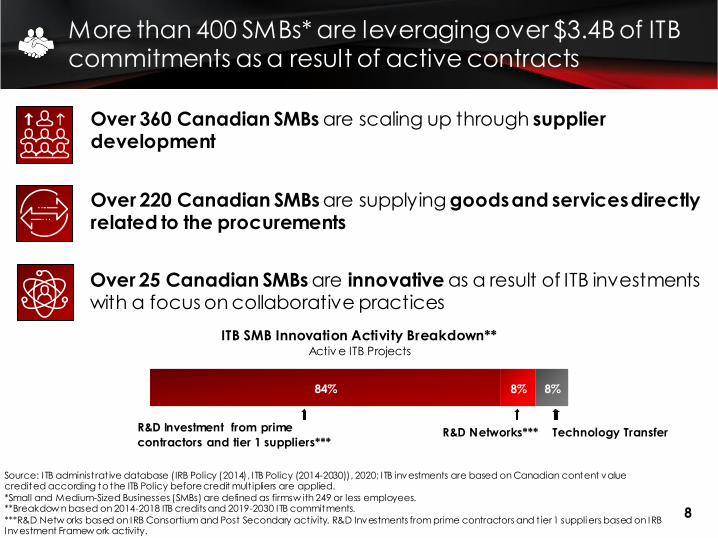
84% 8% 8%
More than 400 SMBs* are leveraging over $3.4B of ITB commitments as a result of active contracts
Over 360 Canadian SMBs are scaling up through supplier development
Over 220 Canadian SMBs are supplying goods and services directly related to the procurements
Source: ITB administ rat ive database (IRB Policy (2014), I TB Policy (2014-2030)), 2020; ITB investments are based on Canadian content value credited according to the ITB Policy before credit mult ipliers are applied.
*Small and Medium-Sized Businesses (SMBs) are defined as firms w ith 249 or less employees.**Breakdow n based on 2014-2018 ITB credits and 2019-2030 ITB commitments.
***R&D Netw orks based on IRB Consortium and Post Secondary act ivity. R&D Investments from prime contractors and t ier 1 suppliers based on IRB Investment Framew ork activity.
8
Over 25 Canadian SMBs are innovative as a result of ITB investments with a focus on collaborative practices
R&D Investment from prime
contractors and tier 1 suppliers***Technology TransferR&D Networks***
ITB SMB Innovation Activity Breakdown**Activ e ITB Projects

Over 40 academic and research organizations are benefitting from innovation and skills commitments*
R&D
Skills Development
Both R&D and Skills Development
Source: ITB administ rat ive database (IRB Policy (2014), I TB Policy (2014-2030)), 2020; ITB investments are based on Canadian content value credited according to the ITB Policy before credit multipliers are applied.
*Academic and research organizations benefiting from 2014-2018 ITB credits and 2019-2030 ITB commitments.**CCRM: Centre for Commercialization of Regenerative Medicine; CIMHVR: Canadian Institute for Military and Veteran Health Research; CRC:
Communicat ions Research Center; CWA: Canadian W elding Association Foundation; DRDC: Defence Research and Development Canada; IMTARC: Industrial Marine Training and Applied Research Centre; NRC: National Research Council; NSCC: Nova Scotia Community College; UOIT: University of
Ontario Institute of Technology
9
Active ITB Projects
University of Northern British Columbia
British Columbia Institute of
Technology
Simon Fraser University
University of British Columbia
University of Victoria
Camosun College University of
Calgary
University of Saskatchewan
Saskatchewan Indian Institute of
Technology
University of Manitoba
University of Regina
University of
Alberta
Confederation College
Canadore College
École De Technologie Supérieure
Polytechnique Montréal
McGill University
Université de Sherbooke
University of New
Brunswick
Cape Breton
University
Memorial University
Centennial College
UOIT**
University of Waterloo
Conestoga College
McMaster University
CWA**
University of Western Ontario
CCRM**York University
University of Toronto
Queen’s University
NRC**
Carleton University
University of Ottawa
IWK Health Centre
Foundation
NSCC**
Dalhousie University
CRC**
CIMVHR**
DRDC**
IMTARC**

In conclusion, the ITB Policy is creating jobs, driving innovation and fostering economic growth in Canada
10*5-year annual average jobs economic impact analysis based on latest ITB ident ified credits during the period of 2014-2018.**Small and Medium-Sized Businesses (SMBs) are defined as firms w ith 249 or less employees .
***Academic and research organizations benefiting from 2014-2018 ITB credits and 2019-2030 ITB commitments.
Jobs: 46,000 jobs*
Future Opportunities: $5.3B
Supplier Development: +400 SMBs**
Innovation and Skills : + 40 research organizations***
• Key Industrial Capabilities (KICs)
• Skills Development and Training
• Gender and Diversity Plans
Exports: attracting global mandates + opportunities for SMBs
New Features:

Annex: Economic Impact Methodology Principles
• Methodology concepts are informed by subject matter experts from the Organization for Economic Co-Operation
and Dev elopment and Statistics Canada.
• Foundation data is based on ITB credits and commitments ov er the period of 2014-2030 as specified on each slide.
• Annual av erage economic impact analysis is based on the ITB credits ov er the period of 2014-2018, with
adjustments reflecting the intangible inv estments and ITB Policy credit multipliers to ev aluate the job and GDP impacts.
• Economic model is based on Statistics Canada Input-Output (I/O) multipliers.
• Each ITB activ ity has been linked to the latest (2016) and most relev ant economic impact multiplier.
• All v alues hav e been adjusted for inflation based on the Consumer Price Index (CPI) as well as the
Bank of Canada’s target CPI of 2% and are expressed in 2016 dollars.
• I/O multipliers hav e been adjusted to reflect the ITB 100% Canadian content requirement wherev er applicable.
• Job and GDP impact is reported on an annual av erage basis.
• Job impacts are measured in terms of full-time equiv alent (FTE) employment.
• Jobs cannot be additiv e as they are maintained for an extended period after creation.
• Total economic impact includes the activ ity that occurs within ITB recipients, Canadian v alue chain, as well
as consumer spending by associated employees across the Canadian economy.
• All project analysis are based on credits and commitments to date.
• Economic impact estimates are reported at the national lev el and cannot be broken down at the regional
lev el.
• All totals are in Canadian dollars. Foreign currency amounts were conv erted to Canadian dollars using the
Bank of Canada’s annual av erage exchange rate for 2019.11