Embed Size (px)
Citation preview

EU
Pric
es
Pro
du
cti
on
EU
Trad
eEU
Sto
cks
Con
su
mp
tion
EU
Bala
nce
Sh
eet
EU monthly production (MS’s communications)
DG AGRI DASHBOARD: OLIVE OIL Last update:
100
150
200
250
300
350
400
450
500
10
/20
19
11
/20
19
12
/20
19
01
/20
20
02
/20
20
03
/20
20
04
/20
20
05
/20
20
06
/20
20
07
/20
20
08
/20
20
09
/20
20
10
/20
20
11
/20
20
12
/20
20
01
/20
21
02
/20
21
03
/20
21
04
/20
21
05
/20
21
06
/20
21
07
/20
21
08
/20
21
09
/20
21
Monthly prices of extra virgin olive oil (national averages)€/100kg
Italy
Spain
Greece
100
150
200
250
300
10/2
019
11/2
019
12/2
019
01/2
020
02/2
020
03/2
020
04/2
020
05/2
020
06/2
020
07/2
020
08/2
020
09/2
020
10/2
020
11/2
020
12/2
020
01/2
021
02/2
021
03/2
021
04/2
021
05/2
021
06/2
021
07/2
021
08/2
021
09/2
021
Monthly prices of virgin olive oil (national averages)
€/100kg
Italy
Spain
Greece
100
150
200
250
300
10
/20
19
11
/20
19
12
/20
19
01
/20
20
02
/20
20
03
/20
20
04
/20
20
05
/20
20
06
/20
20
07
/20
20
08
/20
20
09
/20
20
10
/20
20
11
/20
20
12
/20
20
01
/20
21
02
/20
21
03
/20
21
04
/20
21
05
/20
21
06
/20
21
07
/20
21
08
/20
21
09
/20
21
Monthly prices of lampanteolive oil (national averages) €/100kg
Italy
Spain
Greece
1 752 2 188 2 264 1 920 2 053 2 097
810
1 191 1 0411 337 979 1 064
2 562
3 379 3 3043 256 3 031 3 160
0
500
1 000
1 500
2 000
2 500
3 000
3 500
4 000
2016/17 2017/18 2018/19 2019/20 (fin.) 2020/21 (prov.) 2021/22 (for.)
OLIVE OIL PRODUCTION (1000t)non-EU
EU
WORLD
Average world 2016/17-2020/21
excl. pomace oil1 291 1 262 1 790 1 125 1 387 1 400
182429
174
366274 300195
346185
275275 230
69
135100
141100 150
1 752
2 188 2 264
1 9202 053 2 097
0
500
1 000
1 500
2 000
2 500
2016/17 2017/18 2018/19 2019/20 (fin.) 2020/21 (prov.) 2021/22 (for.)
EU OLIVE OIL PRODUCTION (1000t)
variation 2021/22 vs 2020/21
Other EU (0%)Portugal (+50%)Greece (-16%)Italy (+10%)Spain (+1%)EU (+2%)
excl. pomace oil
100325
140
440
140 220178
263
193.5
230
210215110
140
200
145
160155
110
100
154
118
115120312
363
353
404
354354
810
11911041
1337
9791064
0
200
400
600
800
1 000
1 200
1 400
2016/17 2017/18 2018/19 2019/20 (fin.) 2020/21 (prov.) 2021/22 (for.)
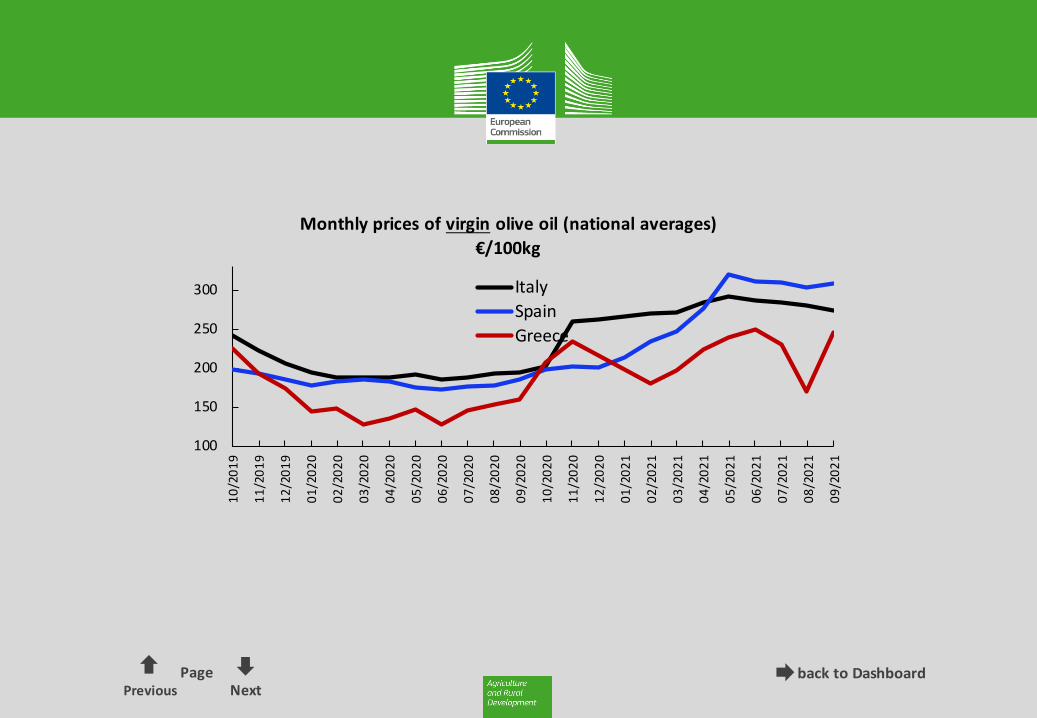
non-EU OLIVE OIL PRODUCTION (1000t)
variation 2021/22 vs 2020/21
Others non-EU (0%)Syrian Arab Republic (+4%)Morocco (-3%)Turkey (+2%)Tunisia (+57%)Total non-EU (9%)Average 2016/17-2020/21
2 475 2 6102 290 2 398 2 297 2 321
-800
-400
0
400
800
1 200
1 600
2 000
2 400
2 800
3 200
2015/16 2016/17 2017/18 2018/19 2019/20 Oct.20 - Aug.21
EU Structure of olive oil trade 2014-2020 with EXTRA-EU27
(EUR million)marketing years october-september
Export virgin lampante Export pomaceExport "olive oil" Export extra virgin+virgin other than lampanteImport virgin lampante Import "olive oil"Import extra virgin+virgin other than lampante Import pomaceTRADE BALANCE
455631
177
359 322
531
783
631
474390
0
200
400
600
800
1 000 EU Olive oil ending stocks(1000t)
enging stocks
Average last 5 years
Ending stocks on 30.9.; excl. olive pomace oil.
2 570 2 958
3 0273 262
3 190
3 150
1 246
1 533 1 413
1 495 1 550 1 510 1 324
1 4251 614
1 7671 640 1 640
1 000
1 400
1 800
2 200
2 600
3 000
3 400
2016/17 2017/18 (fin.) 2018/19 (prov.) 2019/20 (est.) 2020/21 (for.) 2021/22 (for.)
OLIVE OIL CONSUMPTION (1000t)
WORLD EU non-EU Average world 2016/17-2020/21excl. pomace oil
28.10.2021
Sources: International Olive Council (IOC), MS declarations, Eurostat/Comext©, DG Agri estimations
0
50 000
100 000
150 000
200 000
250 000
0
5 000
10 000
15 000
20 000
25 000
30 000
35 000
40 000
oct. 2015 oct. 2016 oct. 2017 oct. 2018 oct. 2019 oct. 2020
Extra EU olive oil IMPORTS per CATEGORY (t)
Cumulative quantities (permarketing year) Pomance oil (CN 1510)
"Olive oil" (CN 15099000) Virgin lampante olive oil (15091010)
Virgin other than lampante (CN 15091080) Extra virgin (CN15091020)
Extra virgin + virgin other that lampante (CN 15091090) Average previous 3 marketing years
0
100 000
200 000
300 000
400 000
500 000
600 000
700 000
800 000
0
10 000
20 000
30 000
40 000
50 000
60 000
70 000
80 000
90 000
oct. 2015 oct. 2016 oct. 2017 oct. 2018 oct. 2019 oct. 2020
Extra EU olive oil EXPORTS per CATEGORY (t)
Cumulative quantities (permarketing year) Pomace oil (CN 1510)
"Olive oil" (CN 15099000) Virgin lampante olive oil (15091010)
Virgin other than lampante (CN 15091080) Extra virgin (CN 15091020)
Extra virgin + virgin other than lampante (CN 15091090) Average previous 3 marketing years
2016/17 2017/182018/19
(fin.)
2019/20
(prov.)
2020/21
(est.)
Starting stocks 359 322 531 783 631
Production 1 752 2 188 2 264 1 920 2 053
Imports extra-EU 92 182 147 252 160
Exports extra-EU 616 624 709 821 820
Consumption 1 246 1 533 1 413 1 495 1 550
Ending stocks 322 531 783 631 474
Note: excl. pomace olive oil.
EU olive oil balance sheet (1000t)
327.3
420.6
320.0
EXTRA VIRGIN max. 0.8°
SPAIN €/100 kg
ITALY
GREECE
Evolution since last month
1%
-1%
Evolution since last year
55%
13%
3% 48%€/100 kg
€/100 kg
Sep-2021
293.4
244.0
216.0
€/100 kg
€/100 kg
€/100 kg
Evolution since last month
3%
1%
Evolution since last year
68%
60%
8% 80%
LAMPANTE > 2°
SPAIN
ITALY
GREECE
Sep-2021Evolution since
309.4
274.2
246.0
€/100 kg
€/100 kg
€/100 kg
Evolution since last month
2%
-2%
Evolution since last year
67%
41%
45% 54%
VIRGIN max. 2°
SPAIN
ITALY
GREECE
Sep-2021

back to DashboardPrevious
PageNext
327.3
420.6
320.0
EXTRA VIRGIN max. 0.8°
SPAIN €/100 kg
ITALY
GREECE
Evolution since last month
1%
-1%
Evolution since last year
55%
13%
3% 48%€/100 kg
€/100 kg
Sep-2021

back to DashboardPrevious
PageNext
Evolution since
309.4
274.2
246.0
€/100 kg
€/100 kg
€/100 kg
Evolution since last month
2%
-2%
Evolution since last year
67%
41%
45% 54%
VIRGIN max. 2°
SPAIN
ITALY
GREECE
Sep-2021

back to DashboardPrevious
PageNext
293.4
244.0
216.0
€/100 kg
€/100 kg
€/100 kg
Evolution since last month
3%
1%
Evolution since last year
68%
60%
8% 80%
LAMPANTE > 2°
SPAIN
ITALY
GREECE
Sep-2021

back to DashboardPrevious
PageNext
100
150
200
250
300
350
400
450
500
10
/20
19
11
/20
19
12
/20
19
01
/20
20
02
/20
20
03
/20
20
04
/20
20
05
/20
20
06
/20
20
07
/20
20
08
/20
20
09
/20
20
10
/20
20
11
/20
20
12
/20
20
01
/20
21
02
/20
21
03
/20
21
04
/20
21
05
/20
21
06
/20
21
07
/20
21
08
/20
21
09
/20
21
Monthly prices of extra virgin olive oil (national averages)€/100kg
Italy
Spain
Greece
back to DashboardPrevious
PageNext
100
150
200
250
300
10
/20
19
11
/20
19
12
/20
19
01
/20
20
02
/20
20
03
/20
20
04
/20
20
05
/20
20
06
/20
20
07
/20
20
08
/20
20
09
/20
20
10
/20
20
11
/20
20
12
/20
20
01
/20
21
02
/20
21
03
/20
21
04
/20
21
05
/20
21
06
/20
21
07
/20
21
08
/20
21
09
/20
21
Monthly prices of virgin olive oil (national averages)
€/100kg
Italy
Spain
Greece

back to DashboardPrevious
PageNext
100
150
200
250
300
10
/20
19
11
/20
19
12
/20
19
01
/20
20
02
/20
20
03
/20
20
04
/20
20
05
/20
20
06
/20
20
07
/20
20
08
/20
20
09
/20
20
10
/20
20
11
/20
20
12
/20
20
01
/20
21
02
/20
21
03
/20
21
04
/20
21
05
/20
21
06
/20
21
07
/20
21
08
/20
21
09
/20
21
Monthly prices of lampanteolive oil (national averages) €/100kg
Italy
Spain
Greece

back to DashboardPrevious
PageNext
1 752 2 188 2 264 1 920 2 053 2 097
810
1 191 1 0411 337 979 1 064
2 562
3 379 3 3043 256 3 031 3 160
0
500
1 000
1 500
2 000
2 500
3 000
3 500
4 000
2016/17 2017/18 2018/19 2019/20 (fin.) 2020/21 (prov.) 2021/22 (for.)
OLIVE OIL PRODUCTION (1000t)non-EU
EU
WORLD
Average world 2016/17-2020/21
excl. pomace oil

back to DashboardPrevious
PageNext
EU monthly production (MS' communications R826/2008)
1 291 1 262 1 790 1 125 1 387 1 400
182429
174
366274 300195
346185
275275 230
69
135100
141100 150
1 752
2 188 2 264
1 9202 053 2 097
0
500
1 000
1 500
2 000
2 500
2016/17 2017/18 2018/19 2019/20 (fin.) 2020/21 (prov.) 2021/22 (for.)
EU OLIVE OIL PRODUCTION (1000t)
variation 2021/22 vs 2020/21
Other EU (0%)Portugal (+50%)Greece (-16%)Italy (+10%)Spain (+1%)EU (+2%)
excl. pomace oil
back to DashboardPrevious
PageNext
100325
140
440
140 220178
263
193.5
230
210215110
140
200
145
160155
110
100
154
118
115120312
363
353
404
354354
810
11911041
1337
9791064
0
200
400
600
800
1 000
1 200
1 400
2016/17 2017/18 2018/19 2019/20 (fin.) 2020/21 (prov.) 2021/22 (for.)
non-EU OLIVE OIL PRODUCTION (1000t)
variation 2021/22 vs 2020/21
Others non-EU (0%)Syrian Arab Republic (+4%)Morocco (-3%)Turkey (+2%)Tunisia (+57%)Total non-EU (9%)Average 2016/17-2020/21

back to DashboardPrevious
PageNext
0
50 000
100 000
150 000
200 000
250 000
0
5 000
10 000
15 000
20 000
25 000
30 000
35 000
40 000
oct. 2015 oct. 2016 oct. 2017 oct. 2018 oct. 2019 oct. 2020
Extra EU olive oil IMPORTS per CATEGORY (t)
Cumulative quantities (permarketing year) Pomance oil (CN 1510)
"Olive oil" (CN 15099000) Virgin lampante olive oil (15091010)
Virgin other than lampante (CN 15091080) Extra virgin (CN15091020)
Extra virgin + virgin other that lampante (CN 15091090) Average previous 3 marketing years

back to DashboardPrevious
PageNext
0
100 000
200 000
300 000
400 000
500 000
600 000
700 000
800 000
0
10 000
20 000
30 000
40 000
50 000
60 000
70 000
80 000
90 000
oct. 2015 oct. 2016 oct. 2017 oct. 2018 oct. 2019 oct. 2020
Extra EU olive oil EXPORTS per CATEGORY (t)
Cumulative quantities (permarketing year) Pomace oil (CN 1510)
"Olive oil" (CN 15099000) Virgin lampante olive oil (15091010)
Virgin other than lampante (CN 15091080) Extra virgin (CN 15091020)
Extra virgin + virgin other than lampante (CN 15091090) Average previous 3 marketing years

back to DashboardPrevious
PageNext
2 475 2 6102 290 2 398 2 297 2 321
-800
-400
0
400
800
1 200
1 600
2 000
2 400
2 800
3 200
2015/16 2016/17 2017/18 2018/19 2019/20 Oct.20 - Aug.21
EU Structure of olive oil trade 2014-2020 with EXTRA-EU27
(EUR million)marketing years october-september
Export virgin lampante Export pomaceExport "olive oil" Export extra virgin+virgin other than lampanteImport virgin lampante Import "olive oil"Import extra virgin+virgin other than lampante Import pomaceTRADE BALANCE

back to DashboardPrevious
PageNext
455631
177
359 322
531
783
631
474390
0
200
400
600
800
1 000 EU Olive oil ending stocks(1000t)
enging stocks
Average last 5 years
Ending stocks on 30.9.; excl. olive pomace oil.

back to DashboardPrevious
PageNext
2 570 2 958
3 0273 262
3 190
3 150
1 246
1 533 1 413
1 495 1 550 1 510 1 324
1 4251 614
1 7671 640 1 640
1 000
1 400
1 800
2 200
2 600
3 000
3 400
2016/17 2017/18 (fin.) 2018/19 (prov.) 2019/20 (est.) 2020/21 (for.) 2021/22 (for.)
OLIVE OIL CONSUMPTION (1000t)
WORLD EU non-EU Average world 2016/17-2020/21excl. pomace oil

back to DashboardPrevious
PageNext
2016/17 2017/182018/19
(fin.)
2019/20
(prov.)
2020/21
(est.)
2021/22
(for.)
Starting stocks 359 322 531 783 631 474
Production 1 752 2 188 2 264 1 920 2 053 2 097
Imports extra-EU 92 182 147 252 160 200
Exports extra-EU 616 624 709 821 820 870
Consumption 1 246 1 533 1 413 1 495 1 550 1 510
Ending stocks 322 531 783 631 474 390
Note: excl. pomace olive oil.
EU olive oil balance sheet (1000t)


![100% RENEWABLE ENERGY: An Energy [R]evolution for ITALY 2020 · 2020. 6. 17. · 100% Renewable Energy: An Energy [R]evolution for Italy : 2 : ABOUT THE AUTHORS. The Institute for](https://img.dokumen.tips/doc/110x75/60cf8d382645f431124d516d/100-renewable-energy-an-energy-revolution-for-italy-2020-2020-6-17-100.jpg)