Embed Size (px)
Citation preview
ITALIAN INSURANCEIN FIGURES
Year 2016
ITALIAN INSURANCE IN FIGURESYear 2016
Via di San Nicola da Tolentino 7200187 RomaT +39 06 326 881
Attuariato, Statistiche e Analisi Banche [email protected] www.ania.it

The Italian insurance industry gives a significantcontribution to the economy and to the society, offeringa wide range of services aiming at risk protection:from motor liability to property protection insurance fordamage to property (house, industrial activities) ordamage caused to third parties (general liability), fromwelfare products to life insurance covers.By doing this, the insurance industry helps individuals,families and companies to manage risks and to recoupfinancial losses in the event of damage. Overall theindustry employs about 300 thousand people.

INDEX
THE INSURANCE INDUSTRY WORLDWIDE 3
NON-LIFE INSURANCE 5
LIFE INSURANCE 10
BALANCE SHEET 14
THE RESULT OF THE INSURANCE FINANCIAL YEAR 16
THE ITALIAN INSURANCE COMPANIES AND THE HUMAN RESOURCES 17
HOW CUSTOMERS PURCHASE AN INSURANCE COVER 19
2
The figures published have been collected using balance sheets of national companiesand branches of foreign companies with registered offices in the European EconomicArea; for the year 2015 data are estimates and thus shall be considered provisional.Figures indicating I.d.b. refer to the Italian direct business.
3
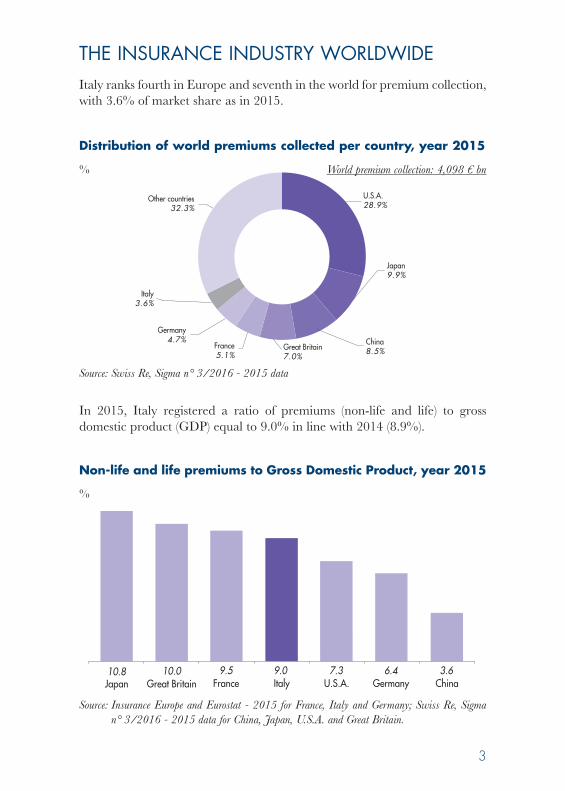
Italy ranks fourth in Europe and seventh in the world for premium collection,with 3.6% of market share as in 2015.
Distribution of world premiums collected per country, year 2015
In 2015, Italy registered a ratio of premiums (non-life and life) to grossdomestic product (GDP) equal to 9.0% in line with 2014 (8.9%).
Non-life and life premiums to Gross Domestic Product, year 2015
THE INSURANCE INDUSTRY WORLDWIDE
Other countries32.3%
U.S.A.28.9%
Italy3.6%
China8.5%
Germany4.7%
France5.1%
Great Britain7.0%
Japan9.9%
Source: Swiss Re, Sigma n° 3/2016 - 2015 data
%
Great Britain10.8
Italy9.0
Germany6.4
China3.6
France9.5
Japan10.0 7.3
U.S.A.
%
Source: Insurance Europe and Eurostat - 2015 for France, Italy and Germany; Swiss Re, Sigma n° 3/2016 - 2015 data for China, Japan, U.S.A. and Great Britain.
World premium collection: 4,098 € bn

4
The average premium per inhabitant (non-life and life) in Italy was equal to2,434 euros, lower than the one registered in the other main industrializedcountries but slightley higher than in Germany.
The ratio of technical reserves to GDP placed Italy fourth among the mainEuropean countries.
3,686U.S.A.
3,134France
4,420Great Britain
3,199Japan
2,434 2,353Germany
253ChinaItaly
93.7 71.1 45.1 35.1 30.7 15.5Great Britain France The Netherlands GermanyItaly Spain
Life reserves to Gross Domestic Product, European comparison,year 2015
%
Source: Swiss Re, Sigma n° 3/2016 - 2015 data
Source: Insurance Europe - 2015 data; 2014 data for the Netherlands and Germany, 2013 data forGreat Britain.
Premiums (non-life and life) per inhabitant, year 2015
€
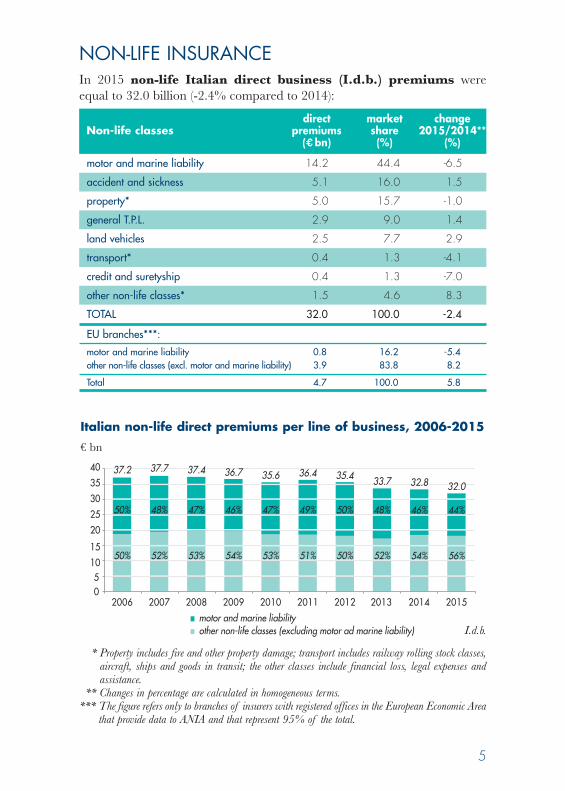
In 2015 non-life Italian direct business (I.d.b.) premiums wereequal to 32.0 billion (-2.4% compared to 2014):
5
direct market changeNon-life classes premiums share 2015/2014**
(€bn) (%) (%)
2010 2011 2012 20132006 2007 2008 20090 5
10 15
20 25 30 35 40
2014 2015
37.2
50%
37.7 37.4 36.7 35.6 36.4 35.4 33.7 32.8 32.0
50%
48%
52%
47%
53%
46%
54%
47%
53%
49%
51%
50%
50%
48%
52%
46%
54%
44%
56%
motor and marine liabilityother non-life classes (excluding motor ad marine liability)
Italian non-life direct premiums per line of business, 2006-2015€ bn
I.d.b.
motor and marine liability 14.2 44.4 -6.5
accident and sickness 5.1 16.0 1.5
property* 5.0 15.7 -1.0
general T.P.L. 2.9 9.0 1.4
land vehicles 2.5 7.7 2.9
transport* 0.4 1.3 -4.1
credit and suretyship 0.4 1.3 -7.0
other non-life classes* 1.5 4.6 8.3
TOTAL 32.0 100.0 -2.4
EU branches***:
motor and marine liability 0.8 16.2 -5.4other non-life classes (excl. motor and marine liability) 3.9 83.8 8.2
Total 4.7 100.0 5.8
* Property includes fire and other property damage; transport includes railway rolling stock classes,aircraft, ships and goods in transit; the other classes include financial loss, legal expenses andassistance.
** Changes in percentage are calculated in homogeneous terms.*** The figure refers only to branches of insurers with registered offices in the European Economic Area
that provide data to ANIA and that represent 95% of the total.
NON-LIFE INSURANCE

6
The ceded ratio in the non-life classes, defined as the incidence ofpremiums ceded and retroceded in reinsurance on the total premiumscollected (direct and indirect), was equal to 8.3% in 2015, distributed asfollows:
In 2015, incurred claims cost, representing costs for settlements, wereequal to 20.0 billion, decreasing by 5.6% compared to 2014.
8.32.1
13.3
other non-life classes(excluding motor and marine liability)
motor and marineliability
totalnon-life classes
0
5
10
15
20
25
30
2010 2011 20122006 2007 2008 2009 2013 2014 2015
25.9
56%
44%
26.1 27.5 29.026.6 26.5 25.8
22.4 21.2 20.0
56%
44%
53%
47%
52%
48%
55%
45%
56%
44%
51%
49%
52%
48%
51%
49%
52%
48%
motor and marine liabilityother non-life classes (excluding motor ad marine liability)
Non-life incurred claims cost, 2006-2015
€ bn
I.d.b.
I.d.b.
Non-life ceded ratio (ceded and retroceded premiums/writtenpremiums), year 2015
%

7
Technical reserves (for claims and premiums), decreasing compared to2014, were equal to 58.7 billion in 2015. About 27 billion were relative to themotor and marine liability.
The combined ratio, an indicator that compares claims cost and operatingexpenses to premiums, was equal to 89.4% in 2015 (90.1% in 2014); theimpact of the incurred claims cost on premiums (from 63.9% to 62.2%)contributed to this result, whose advantages were partly nulled by theincrease of the impact of expenses on premiums (from 26.2% to 27.2%).
5
15
25
35
45
55
65
75
2010 2011 2012 2006 2007 2008 2009 2013 2014 2015
63.6
53%
47%
65.0 65.1 65.2 62.6 63.3 63.6 61.4 60.1 58.7
52%
48%
49%
51%
48%
52%
48%
52%
48%
52%
47%
53%
47%
53%
47%
53%
46%
54%
motor and marine liabilityother non-life classes (excluding motor ad marine liability)
Non-life technical reserves*, 2006-2015
€ bn
94.0 94.7 98.7103.7 100.2 97.9
loss ratio expense ratio
2010 2011 20122006 2007 2008 2009
23.3 24.4 24.5 24.7 24.4 24.1
73.8
95.9
24.0
71.9
2013 2014
90.1
25.0
65.075.874.2 79.170.370.7
90.1
26.2
63.9
2015
89.4
27.2
62.2
Non-life combined ratio (loss ratio + expense ratio), 2006-2015
%
I.d.b.
* Technical reserves include both unearned premiums reserve and claims reserves.
I.d.b.
8
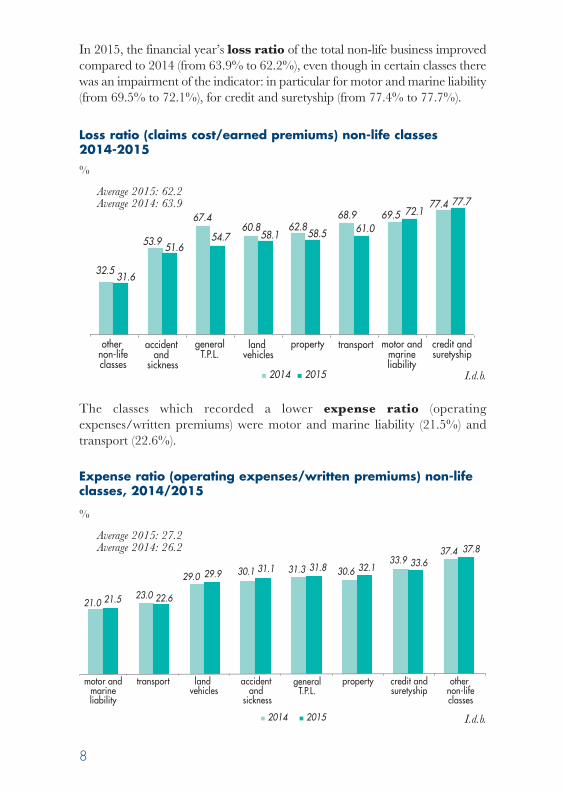
In 2015, the financial year’s loss ratio of the total non-life business improvedcompared to 2014 (from 63.9% to 62.2%), even though in certain classes therewas an impairment of the indicator: in particular for motor and marine liability(from 69.5% to 72.1%), for credit and suretyship (from 77.4% to 77.7%).
The classes which recorded a lower expense ratio (operatingexpenses/written premiums) were motor and marine liability (21.5%) andtransport (22.6%).
32.5
67.460.8
53.9
69.577.4 77.7
62.8
31.6
54.7 58.1 58.551.6
61.0
72.1
property
2014 2015
68.9
other non-lifeclasses
accident and
sickness
credit andsuretyship
transportland vehicles
generalT.P.L.
motor andmarineliability
2014 2015
21.0
30.1 31.3 30.633.9
37.4 37.8
23.0
29.0
21.5 22.6
29.9 31.1 31.8 32.1 33.6
property other non-lifeclasses
accident and
sickness
credit andsuretyship
transport land vehicles
generalT.P.L.
motor andmarineliability
I.d.b.
I.d.b.
Loss ratio (claims cost/earned premiums) non-life classes 2014-2015%
Average 2015: 62.2Average 2014: 63.9
Expense ratio (operating expenses/written premiums) non-lifeclasses, 2014/2015
%
Average 2015: 27.2Average 2014: 26.2

9
The overall non-life technical result was positive for 3.6 billion; inparticular owing to the motor liability and marine liability class (1.4) and tothe accident and sickness class (0.8). The credit and suretyship results wereslightly negative (about -30 million).
Considering both the technical and the non-technical results and also the taxes,in 2015 the non-life industry registered a 1.9 billion profit (2.4 in 2014) whichdetermined a positive Return on Equity (ROE), equal to 7.9% (10.2 in 2014).
0.00.40.81.21.62.02.42.83.23.64.04.44.8
1.4
0.8
0.60.4
0.3 0.2
-0.00.0
3.6
property*other non-lifeclasses*
accident and
sickness
credit andsuretyship
transport*land vehicles
generalT.P.L.
motor andmarineliability
technicalresult
Non-life insurance technical result breakdown, year 2015€ bn
2.4 2.8
-0.2
0.3
-1.0 -1.0
0.62.1 2.4
11.614.6
-0.9
0.1
-4.6 -4.7
3.1
9.7 10.2
2010 2011 2012 2013 20142006 2007 2008 2009
non-life ROE (%)profit/loss ( bn)
1.9
7.9
2015
Non-life net results and ROE, 2006-2015€ bn, %
I.d.b.
* Property includes fire and other property damage; transport includes railway rolling stock, aircraft,marine and goods in transit; other classes include financial loss, legal expenses and assistance.

10
In 2015, Italian life direct business (I.d.b.) premiums were equal to114.9 billion (+4.0% compared to 2014):
The decrease in written premiums relative to Class I traditional policies (77.9billion) was equal to -5.7% while Class III policies (linked) had a 45.8%increase (for a business volume of 31.8 billion). Class V policies (capitalization)collected 3.5 billion of premiums, decreasing by 24.1%.
LIFE INSURANCE
direct market changeLife classes premiums share 2015/2014**
(€bn) (%) (%)
class I - traditional 77.9 67.7 -5.7
class III - linked 31.8 27.7 45.8
class V - capitalization 3.5 3.1 -24.1
other life classes* 1.7 1.5 16.6
TOTAL 114.9 100.0 4.0
EU branches***:class III - linked 3.3 88.0 25.8other life classes 0.5 12.0 4.7
Total 3.8 100.0 22.8
* Other classes include class IV – LTC and permanent health insurance and class VI – pension funds.** Changes in percentage are calculated in homogeneous terms.
*** The figure refers only to branches of insurers with registered offices in the European Economic Areathat provide data to ANIA and that represent 65% of the total.
traditional and capitalization linked other life classes*
2010 20112006 2007 2008 20090
20
40
60
80
100
20152012 2013 2014
120
69.3
40%
60%
61.554.5
81.190.1
73.8 69.7
85.1
110.5 114.9
52% 63% 86% 81% 81% 77% 80% 79% 71%
47% 34%
12%17%
17% 20%
18%
20% 28%
I.d.b.
Domestic direct life business premiums, 2006-2015€ bn

11
In 2015, incurred claims cost, including the amounts paid and thechanges in the provisions for amounts to be paid, were equal to 71.2 billion,increasing by about 10% compared to 2014.
In 2015, the technical provisions were equal to 568 billion, increasing by10.3% compared to 2014. In 2015, the cover ratio was equal to 4.9 (4.7 in2014).
0
10
20
30
40
50
60
70
80
2010 20112006 2007 2008 2009linked
2012 2013 2014 2015
44%
56%
57.8
74.365.5
57.2
66.874.0 75.0
66.8 64.671.2
39%35%
39%37%
32% 31%31% 28%
24%
61% 64% 60% 62% 68% 68% 68% 71% 74%
traditional and capitalization other life classes*
Life incurred claims cost, 2006-2015
€ bn
2011 2012 2013 20142006 2007 2008 2009 2010technical provisions cover ratio
cove
r rat
io
0
100
200
300
400
500
600
0
1
2
3
4
5
6
7
tech
nica
l pro
visio
ns (
bn
)
2015
371 360 338379
411 414 423453
515
568
I.d.b.
I.d.b.
Life technical provisions and cover ratio, 2006-2015

12
The net cash flow, defined as the difference between premiums andincurred claims (amounts paid and changes in the provisions for amounts tobe paid) was particularly positive in 2015 and equal to 43.8 billion (it waspositive and equal to 45.9 billion in 2014).
The life expense ratio (the ratio between operating expenses and writtenpremiums) was equal to 3.5% in 2015, in slight increase compared to 3.4%in 2014.
2010 20112006 2007 2008 2009 2012 2013 2014
4.23.4
5.0
7.47.66.6
4.85.2 4.8
2015
3.5
Life expense ratio (operating expenses/written premiums),2006-2015
%
11.6
-12.9
-0.1
-5.3
23.9 23.3
-11.0
18.3
2010 2011 2012 2013
45.9
20142006 2007 2008 2009
43.8
2015
Life net cash flow, 2006-2015
€ bn
I.d.b.
I.d.b.
13
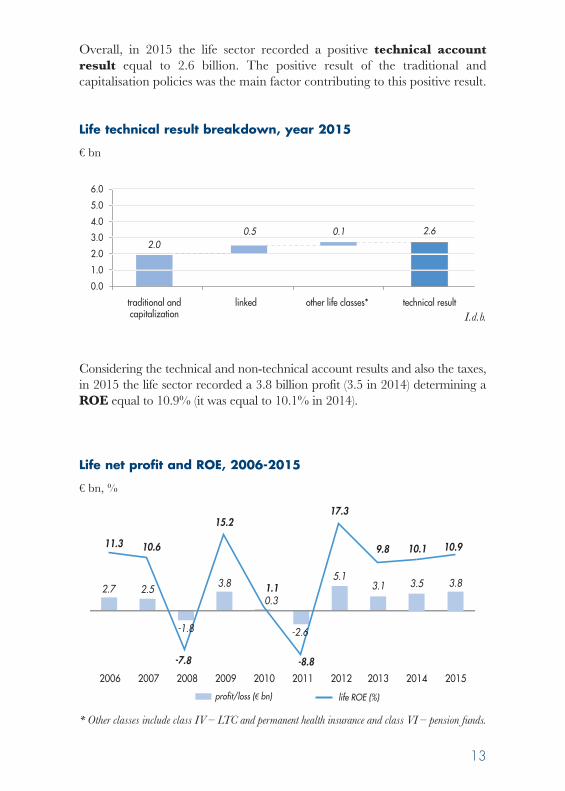
Overall, in 2015 the life sector recorded a positive technical accountresult equal to 2.6 billion. The positive result of the traditional andcapitalisation policies was the main factor contributing to this positive result.
Considering the technical and non-technical account results and also the taxes,in 2015 the life sector recorded a 3.8 billion profit (3.5 in 2014) determining aROE equal to 10.9% (it was equal to 10.1% in 2014).
traditional andcapitalization
linked other life classes* technical result
2.00.5 0.1 2.6
0.0
1.0
2.0
3.0
4.0
5.0
6.0
5.11.1
11.3 10.6
15.2
-7.8
2010 2011 2012 2013 20142006 2007 2008 2009
life ROE (%)profit/loss (€ bn)
-8.8
17.3
3.1
9.8
3.5
10.1
2.7 2.5 3.8
0.3
-1.8 -2.6
2015
3.8
10.9
Life net profit and ROE, 2006-2015
€ bn, %
I.d.b.
* Other classes include class IV – LTC and permanent health insurance and class VI – pension funds.
Life technical result breakdown, year 2015
€ bn

14
In 2015, the shareholders’ funds were equal to 66.1 billion and increasedby 2.7%. They amounted to 9% of the total liabilities.
The overall technical provisions (direct and indirect, domestic andforeign business) were equal to 647 billion, increasing by 9.4% compared to2014; life provisions, accounting for 76.8% of total liabilities, increased by10.9%, while non-life provisions (claims reserves and unearned premiumsreserves), accounting for 8.1%, decreased by about 3%.
The investments in the insurance sector were equal to 693 billion andaccount for 90% of total assets.
The main investment of the insurance sector is made up of governmentbonds (over 300 billion, about 45%); over 90% of these (about 280 billion)are Italian government bonds.
BALANCE SHEET
shares8.2
investmentsof linked andpension funds
18.5
land and buildings
1.0
loans and deposits
9.1
other bonds19.2
government bonds44.0
% investment breakdown, year 2015
% total investments (non-life and life): 693 € bn

15
The investments in the life sector, in the last three years, were seven times asmany as the investments in the non-life sector.
At the end of 2015, the insurance companies had a solvency margin(Solvency I) of 47.5 billion; the margin owned compared to the minimum tobe owned (the so-called coverage ratio) was equal to 1.5 in the life sector and2.8 in the non-life sector (2.7 in non-life and 1.6 in life in 2014). Overall, thecoverage ratio of the Italian insurance sector was equal to 1.8. Vice versa, ifwe consider the new Solvency II regulatory regime, this ratio would turn outto be slightly higher and equal to 2.3: 1.6 for non-life companies, 2.6 for lifecompanies and 2.3 for composite companies.
2010 2011 20122006 2007 2008 2009non-life life
74.4 74.078.8 77.9 76.5 78.7
398.7 388.5358.2
410.8442.6 437.3
75.6
451.3
2013 2014
79.0
483.9
79.7
549.9
2015
84.3
608.4
2.9
1.9
2.7
1.72.0
1.7
2.8
3.3
2.7 2.62.9
1.5
2.0 1.91.7
2.0
2010 2011 20152006 2007 2008 2009non-life life
2.82.6
2012 2013 2014
2.7
1.6
Non-life and life investments, 2006-2015
€ bn
Solvency – coverage ratio, 2006-2015
%
16
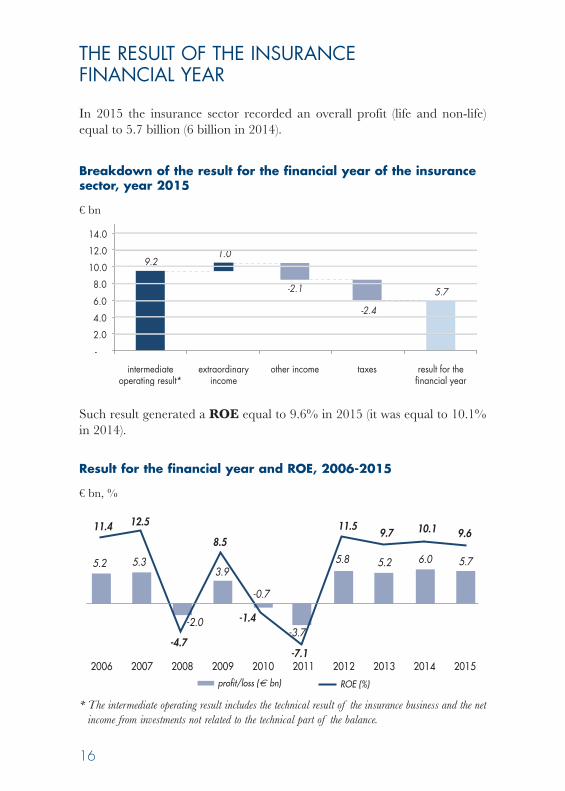
In 2015 the insurance sector recorded an overall profit (life and non-life)equal to 5.7 billion (6 billion in 2014).
Such result generated a ROE equal to 9.6% in 2015 (it was equal to 10.1%in 2014).
THE RESULT OF THE INSURANCE FINANCIAL YEAR
-0.7
2011 2012 2013 20142006 2007 2008 2009 2010
ROE (%)profit/loss ( bn)
-7.1
5.2 5.33.9
-2.0
11.4 12.5
8.511.5
-1.4
-4.7-3.7
5.8
9.7
5.2
10.1
6.0
2015
9.6
5.7
Result for the financial year and ROE, 2006-2015
€ bn, %
intermediateoperating result*
extraordinaryincome
9.21.0
-2.1
-2.4
5.7
-
2.0
4.0
6.0
8.0
10.0
12.0
14.0
other income taxes result for thefinancial year
* The intermediate operating result includes the technical result of the insurance business and the netincome from investments not related to the technical part of the balance.
Breakdown of the result for the financial year of the insurancesector, year 2015
€ bn

17
At the end of 2015, 220 insurance companies were operating in Italy, ofwhich 114 had registered offices in Italy and 106 were legal representationsof foreign companies (103 from EU member States). 67 companies operatedin the life sector (23 of which were representations) and 121 companiesoperated in the non-life sector (63 of which were representations); 25companies operated in both life and non-life sectors and 7 operated only inreinsurance. At the end of 2015, 160 companies were ANIA members.
There were about 1,000 companies operating in Italy in freedom ofservices, with registered offices in a EU member State.
As at 31 December 2015, there were 46,754 employees in theinsurance sector. This figure is the sum of:
- 41,536 units of administrative staff (including about 4,000employees of bodies controlled by insurance companies which apply thenational insurance collective agreement, 2,323 units of call center staffand 1,243 executives);
- 5,218 canvassers.
THE ITALIAN INSURANCE COMPANIESAND THE HUMAN RESOURCES
2013 2014
233
102
131
222
100
122
2015
220
106
114
national companies branches of foreign companies
Number of insurance companies operating in Italy, 2013-2015

However, overall, the insurance sector employs approximately 300,000people, including the sales network and product distribution staff.
In particular, according to the data coming from the Single Register ofIntermediaries, as at 31 December 2015, 252,602 units were enrolled inthe following sections:
At the end of 2015 the number of Italian intermediaries enrolled was 244,688(244,235 at the end of 2014). The Single Register of Intermediaries alsoincludes a list concerning information on intermediaries – natural or legalpersons – having residence or registered office in other EU member States orbelonging to the European Economic Area allowed to take up insurance andreinsurance mediation activity in Italy in freedom of services or freedom ofestablishment. At the end of 2015, 7,914 EU intermediaries were enrolled inthis section of the Register (7,833 in 2014).
18
section legal nature 2013 2014 2015
Single Register of Intermediaries, 2013-2015
A (agents) Natural person 26,331 25,533 25,011Legal Person 9,611 9,515 9,405
B (broker) Natural person 3,822 4,015 4,136Legal Person 1,463 1,558 1,616
C (direct canvassers) Natural person 8,563 7,252 6,121
D (banks, financial intermediaries, stock brokerage companies and Poste Italiane Legal Person 653 642 611spa – Divisione servizi di bancoposta)
E (staff involved in mediation outside thepremises of the intermediary registered in section A, B or D, for which they
Natural person 180,706 183,488 185,582
conduct business, including their Legal Person 12,350 12,232 12,206
employees and/or collaborators
Attached list: (intermediaries havingresidence of registered office in another Subject 8,022 7,833 7,914EEA member state)
TOTALE 251,521 252,068 252,602
Source: Ivass
19
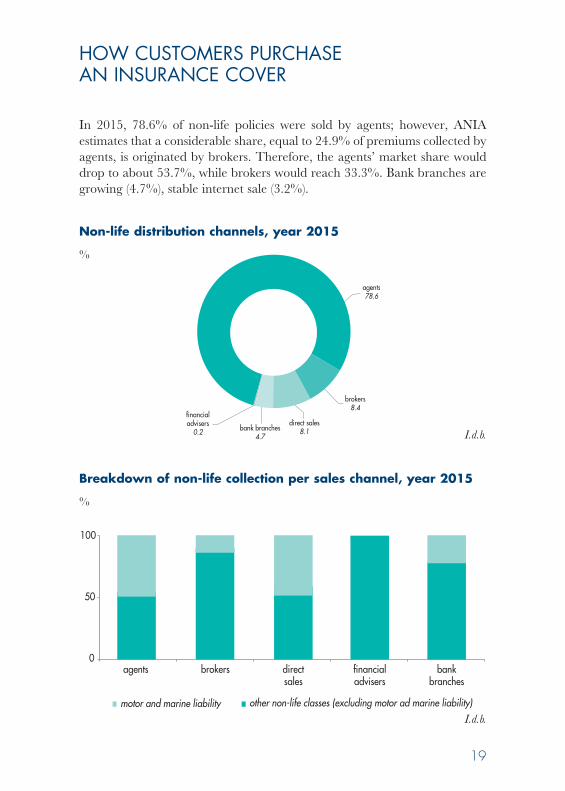
In 2015, 78.6% of non-life policies were sold by agents; however, ANIAestimates that a considerable share, equal to 24.9% of premiums collected byagents, is originated by brokers. Therefore, the agents’ market share woulddrop to about 53.7%, while brokers would reach 33.3%. Bank branches aregrowing (4.7%), stable internet sale (3.2%).
HOW CUSTOMERS PURCHASE AN INSURANCE COVER
agents78.6
direct sales8.1
brokers8.4
bank branches4.7
financialadvisers
0.2
Non-life distribution channels, year 2015
%
0
50
100
directsales
financialadvisers
bankbranches
agents brokers
motor and marine liability other non-life classes (excluding motor ad marine liability)
Breakdown of non-life collection per sales channel, year 2015
%
I.d.b.
I.d.b.
20
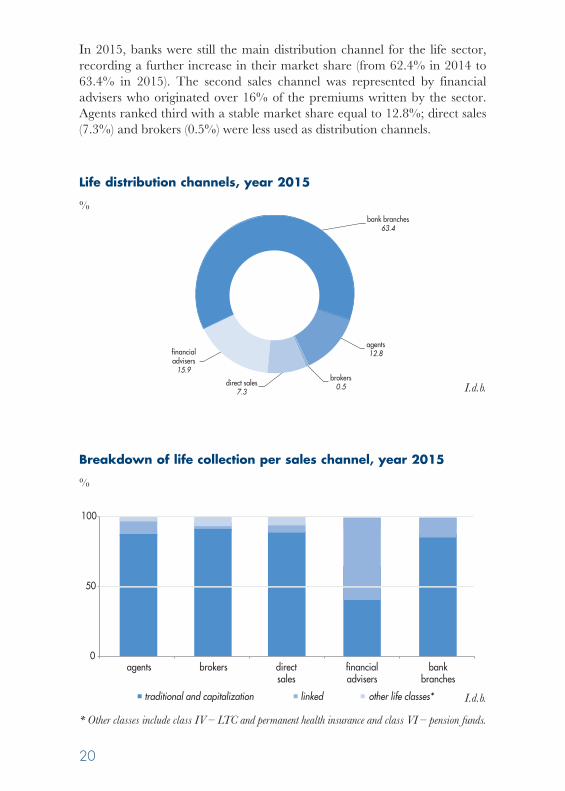
In 2015, banks were still the main distribution channel for the life sector,recording a further increase in their market share (from 62.4% in 2014 to63.4% in 2015). The second sales channel was represented by financialadvisers who originated over 16% of the premiums written by the sector.Agents ranked third with a stable market share equal to 12.8%; direct sales(7.3%) and brokers (0.5%) were less used as distribution channels.
agents12.8
direct sales7.3
brokers0.5
bank branches63.4
financialadvisers
15.9
Life distribution channels, year 2015
%
0
50
100
agents brokers directsales
financialadvisers
bankbranches
traditional and capitalization linked other life classes*
Breakdown of life collection per sales channel, year 2015
%
I.d.b.
I.d.b.
* Other classes include class IV – LTC and permanent health insurance and class VI – pension funds.
ITALIAN INSURANCEIN FIGURES
Year 2016
ITALIAN INSURANCE IN FIGURESYear 2016
Via di San Nicola da Tolentino 7200187 RomaT +39 06 326 881
Attuariato, Statistiche e Analisi Banche [email protected] www.ania.it