Embed Size (px)
Citation preview

ITALIAN CHILDREN AT WORK, 1881–1961
Gianni Toniolo Duke University and CEPR
Giovanni Vecchi (*)
University of Rome “Tor Vergata”
Oct 31, 2007
Abstract This paper quantifies the extent and the main characteristics of child work in Italy during the years 1881-1961. From population censuses, we created a new database of the economically active population aged 10-14 by gender, region, and economic sector. We find that child work incidence declined sharply over time, from 64.3 percent in 1881 to 3.6 percent in 1961. This pattern holds true both nationally and within regions. The new body of evidence we provide casts serious doubts on international comparisons which portray post-war Italy as a country with peculiarly high employment rates for children. Our findings also challenge the view that the initial phases of industrialization had a negative impact on the living standards of Italian children. We show that, in the case of Italy, industrialization coincided with a decline in the employment of children. Our analysis of the determinants of child work suggests that (i) changes in the allocation of total active population among productive sectors explain only a small amount of changes in the employment of children; (ii) changes in labor and compulsory-schooling legislation indicates that the impact of institutions on child labor was modest until the late 1930s. Overall, the increasing GDP per head was probably the main, but not the only, driving force behind declining child work incidence.
JEL Codes: N3, I3. Key Words: child labor; child work; living standards; industrialization; modern economic
growth; Italy.
(*) Corresponding author ([email protected]). We are grateful to Nicola Amendola, Furio Rosati, Maria Cristina Rossi, Silvia Francisci, Justin Valasek (also a superb copy editor) and an anonymous referee for comments and suggestions, and to Fernando Salsano for excellent research assistance. This paper is part of a research project on “Education and child labour in Italy, 1861-2001” (Italian Ministry of Research PRIN).

2
1 INTRODUCTION
Child involvement in economic activity is pervasive in less developed countries. An extensive literature exists on the number and the forms of employment of working children in different parts of the world for the past few decades, but only for a few countries have economic historians successfully dealt with the contribution children made to the long-run growth process. While the largest part of this literature focuses on the British Industrial Revolution (see Tuttle, 1998), the evidence available suggests that child work was widespread in most European countries during the 18th and 19th centuries (see Cunningham and Viazzo, 1996).
Despite its relevance, child work is under-researched in Italy. In particular, relatively little is known about child work over the time span of Italy’s “modern economic growth.” This is not surprising. No official estimates of the incidence of child work exist, nor are there any sources providing readily-available quantitative information on the topic. This paper aims at filling that gap. We try to understand the impact of Italy’s modern economic growth on children, one of the most vulnerable groups of the population.1
The relevance of our findings is threefold. First, we provide new evidence, based on the diminishing incidence of child work, in support of the hypothesis that Italy’s early industrialization drive (1881-1911) had a positive impact on living standards, broadly defined. This result calls into question the conclusion reached in 1953 by the Parliamentary Commission of Inquiry on Unemployment that: “... in the course of Italy’s economic development, the employment of children in workplaces has steadily increased during its early phases. Instead, during the most recent decades such employment has reduced, even though it remained high in the backward areas of the country.” (see Spesso, 1953: 171).
Second, our calculations show that the incidence of child work in Italy is similar to estimates available for countries with comparable GDP per capita. This result calls into question international comparisons which portray Italy as an economy with an abnormally high long-term incidence of child work (see ILO, 1996 and Basu 1999).
Third, the policy implications of our analysis of the determinants of child work are consistent with the evidence reviewed in Edmonds and Pavcnik (2005), and contribute to the present-day debate on the policy options aimed at reducing child work. The Italian historical experience suggests that legal provisions for compulsory elementary education, if not backed by adequate funding, are of doubtful effect and is also consistent with the claim that raising GDP is the best way of reducing child work.
A note on the terminology used in this paper is useful to avoid ambiguity. While there is no internationally agreed upon definition of “child labor” and “child work,” a distinction based on a gradually emerging consensus exists. Accordingly, we use child work to refer to the economic activity of children, a broader concept
1 This paper is part of a larger project aimed at assessing the equity dimension of Italy’s long-term growth (see Rossi Toniolo and Vecchi, 2001, and Vecchi and Coppola, 2006).

3
than child labor, which the ILO defines as activities that are damaging to the child.2
The paper is organized as follows. In section 2 we illustrate a new dataset of the number of economically active children. Section 3 identifies the main trends in the incidence of child work. Section 4 explores the likely role of certain factors in explaining the observed trends in child work. Discussion and conclusions follow.
2 THE DATA
Current research in the field of child work usually employs suitable statistical data from ad-hoc modules in large-scale household surveys, labor force surveys, or children-specific surveys.3 Such surveys, however, are rare and are not comparable across time, especially for epochs before sampling theory was developed.4 In the case of Italy, population censuses are the only sources that allow for the construction of a nationally representative database covering the post-unification period (1861-present day). Even if census schedules were lost, so that neither individual- nor household-level data can be used, published censuses data contain the information required to estimate the number of working children by gender, region, and sector of economic activity.
Vitali (1968, 1970) gives a comprehensive account of the problems with comparing between censuses. The upshot is that Vitali’s work also shows how comparability can be restored provided proper corrections are made on the raw data. Thus, by adapting Vitali’s methods we were able to turn census data into a database which allows consistent comparisons of the incidence of child work both over time and across regions, at the sectoral level. The main issues involved in the data correction process are summarized in the following four paragraphs.
First, the age cohorts into which economically active population data were organized change across censuses. For four out of eight censuses we had to estimate the numbers of active population aged 10 to 14 by gender, region and economic sector.5 Those in the age group 10-14 are defined as “children” in this paper, a choice entirely driven by data availability. The extent to which this constitutes a shortcoming is likely to depend on the aims of the analysis and on the year considered. Regardless, the bias is likely to be relatively small: at the turn of the 20th century the contribution of working children aged 9 or less was probably in the order of one or two percent of the stock of working children under the age 14.6
2 ILO Conventions Nos. 138 and 182. See also Cigno and Rosati (2005). 3 See for instance the National Child Labor Survey developed by the ILO. See http://www.ucw-project.org/resources/Information_on_child_labour_surveys.html. Indicators on children’s work for over 70 countries are available at www.ucw-project.org. 4 See Moehling (1999). 5 Minor inconsistencies in the definition of age classes across censuses (years 1881, 1901, 1921 and 1936) required that the numbers of economically active individuals are estimated rather than just worked out from the raw data. For instance, the 1881 census groups data using the age class 9-14 years. To obtain the 10-14 class, we subtracted an estimate of the population aged 9-10 from the original data. Details on the methods used are provided in Francisci and Vecchi (2007). 6 In the absence of data for Italy, the estimate in the text is based on percentages found in countries with comparable GDP per capita.
4
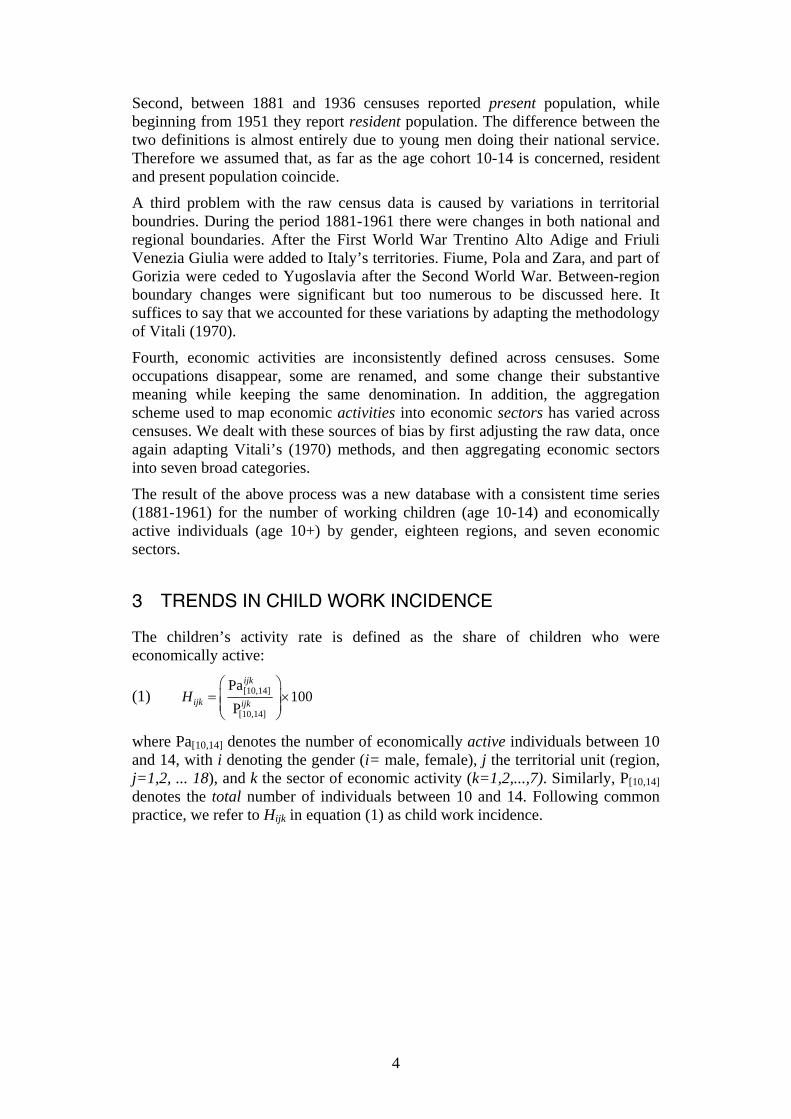
Second, between 1881 and 1936 censuses reported present population, while beginning from 1951 they report resident population. The difference between the two definitions is almost entirely due to young men doing their national service. Therefore we assumed that, as far as the age cohort 10-14 is concerned, resident and present population coincide.
A third problem with the raw census data is caused by variations in territorial boundries. During the period 1881-1961 there were changes in both national and regional boundaries. After the First World War Trentino Alto Adige and Friuli Venezia Giulia were added to Italy’s territories. Fiume, Pola and Zara, and part of Gorizia were ceded to Yugoslavia after the Second World War. Between-region boundary changes were significant but too numerous to be discussed here. It suffices to say that we accounted for these variations by adapting the methodology of Vitali (1970).
Fourth, economic activities are inconsistently defined across censuses. Some occupations disappear, some are renamed, and some change their substantive meaning while keeping the same denomination. In addition, the aggregation scheme used to map economic activities into economic sectors has varied across censuses. We dealt with these sources of bias by first adjusting the raw data, once again adapting Vitali’s (1970) methods, and then aggregating economic sectors into seven broad categories.
The result of the above process was a new database with a consistent time series (1881-1961) for the number of working children (age 10-14) and economically active individuals (age 10+) by gender, eighteen regions, and seven economic sectors.
3 TRENDS IN CHILD WORK INCIDENCE
The children’s activity rate is defined as the share of children who were economically active:
(1) [10,14]
[10,14]
Pa100
P
ijk
ijk ijkH⎛ ⎞
= ×⎜ ⎟⎜ ⎟⎝ ⎠
where Pa[10,14] denotes the number of economically active individuals between 10 and 14, with i denoting the gender (i= male, female), j the territorial unit (region, j=1,2, ... 18), and k the sector of economic activity (k=1,2,...,7). Similarly, P[10,14] denotes the total number of individuals between 10 and 14. Following common practice, we refer to Hijk in equation (1) as child work incidence.

5
Figure 1 – The incidence of child work in Italy, 1881-1961
0.0
20.0
40.0
60.0
80.0
Wor
king
chi
ldre
n (%
)
1881 1901 1911 1921 1931 1936 1951 1961Year
ALLBoysGirls
Source: Authors’ estimates from population census data.
Figure 1 plots the time series of child work incidence as defined in equation (1), showing the extent to which the Italian economy has relied on the work of children at various points in time. A few main facts stand out: (i) The long-run trend is unambiguously downward-sloped. (ii) The process unfolds with varying velocity; it is fastest during the last decade (minus 10 percent per year between 1951 and 1961), very rapid during the early phases of industrialization (minus 2.4 percent per year during 1881-1911), stagnant in the interwar period (plus 0.1 percent per year between 1921-1936). (iii) An increase in child work incidence takes place during the recovery from the Great Depression (1931-36). (iv) Female child work incidence is initially much lower than male’s but the two rates converge reaching roughly the same levels by the early 1930s.
For most of the years considered in Figure 1 there are no competing estimates of the economically active population aged 10-14. ILO (1996) provides estimates of child work incidence in Italy for 1950 and 1960, showing – as we do – a decline in children’s participation rate. ILO (1996), however, appears to overstate the levels of activity rates of Italian children the years 1950 and 1960. According to ILO, in 1950 the incidence of child work in Italy (29.1 percent) was higher than (or similar to) the levels found in countries with per capita GDP 3 to 6 times lower than Italy’s. The ILO’s figure for Italy in 1960 is 10.9 percent as against 3.6 percent implied by our database. In order to understand the reason for the discrepancy between our estimates and ILO’s one should compare data sources and calculation methods. As for the former, we believe that population censuses are the most reliable, and possibly the only, historical source available for time-consistent estimates of the economically active population: the ILO’s data sources are not discussed in detail.7 Comparing methods is also difficult as ILO’s 7 Source are said to be drawn from the United Nations Population Division but are not discussed in any publication we are aware of.

6
methodology to estimate and project economically active population has not been published.8
Before suggesting explanations for the aggregate trends as depicted in Figure 1, we take a look at the geographical and sectoral features of child work incidence over the long run. It appears that the national pattern (Figure 1) hides significant variations across regions in the incidence of child work. Figure 2 summarizes this evidence (for details see Table 3 in the Appendix).
Figure 2 – The incidence of child work by macro-area, 1881-1961
0
20
40
60
80
Wor
king
chi
ldre
n (%
)
1881 1901 1911 1921 1931 1936 1951 1961census year
NORTH-EAST
0
20
40
60
80
Wor
king
chi
ldre
n (%
)
1881 1901 1911 1921 1931 1936 1951 1961census year
NORTH-WEST
0
20
40
60
80
100
Wor
king
chi
ldre
n (%
)
1881 1901 1911 1921 1931 1936 1951 1961census year
CENTER
0
20
40
60
80
100
Wor
king
chi
ldre
n (%
)
1881 1901 1911 1921 1931 1936 1951 1961census year
SOUTH
While, as expected, all regions show a downward-sloping trend in child work incidence, considerable differences are found both in the initial levels and in the rates of change. With the exception of Sardinia, above-average initial levels are the rule in the poorer South. Sardinia was poor, but unlike the rest of the South, it was part of Piedmont under the Savoy kings rather than of the Bourbon’s Kingdom. This suggests that institutions might matter (see the relatively low 1881 incidence in Piedmont and Liguria). The final (1961) levels show that variations around the national mean remained high, indicating lack of regional convergence in child work incidence. It is worth noting that the 1931-36 upward blip featured in the aggregate picture (Figure 1) is particularly pronounced in the north west and north east (while several southern and central regions show no increase, or even a decrease in child work incidence during the same period of time).
Figure 3 shows the distribution of working children across economic sectors. The stability of the shares over most of the period is striking. At the national level,
8 A Methodological Supplement was planned for publication in the year 1998 (see ILO, 1996, p. 7) but has not yet appeared.

7
between 1881 and 1951, almost three quarters of working children were employed in agriculture, a result which held true for both boys and girls. Manufacturing, construction, and mining absorbed between 20-25 percent of working children, with most of these working in manufacturing. The share in services fluctuated around 5-7 percent. Between 1951 and 1961 there was a precipitous drop of children working in agriculture, from 79 percent to 58 percent, mirrored by a corresponding rise in the industry share.
Figure 3 – The distribution of working children by economic sector
0
20
40
60
80
100
Sha
re (%
)
1881 1901 1911 1921 1931 1936 1951 1961
primary secondary tertiary
To get a perception of how large the “large” child work incidence that seems to characterize in the literature the Italian case was, we have performed two kinds of comparative exercises. In both cases, we compare Italy’s child work incidence with that of other countries at similar levels of per caput GDP.
Figure 4 plots child work incidence in the UK (1851-1911) over Italy’s (1881-1961), with GDP per caput (from Maddison 2001) on the horizontal axis. We compare with the United Kingdom not only because of the availability of historical estimates (lacking for most of today’s OECD countries) but also because of the vast debate in the literature over the extent of children’s contribution to the British industrial revolution and the causes behind the persistence of the phenomenon.
Italy’s GDP per head in 1911 was about the same as the United Kingdom’s in 1851, yet Italy had a much higher child work incidence for boys than the UK had sixty years earlier (51.1% against 36.6%). Later, at the trough of the post-war depression, Italy’s GDP per caput had not changed much, but child work incidence had dramatically fallen, below the 1851 UK level. Over the following forty years, child work incidence in Italy remained consistently lower than British level had been at comparable income levels, and it also fell faster. This is not surprising. Children participation in the labor force varies not only with income, but also with such factors as technology and institutions that reflect changes in the society at large or, crudely speaking, that may be seen as a function of time. Therefore, holding GDP per caput constant, one expects a lower incidence of

8
child work in later periods of time. Data plotted in Figure 4 are consistent with this assumption. In 1911 Italy’s income per head was only marginally (3 per cent) lower than Britain’s in 1851, yet it had a considerably higher child work incidence than Britain had sixty years earlier. The intuition here is that the introduction of less labor- (and child-) intensive technologies as well as social pressure for child work bans were accelerated by the war. For example, Italy’s technology in 1931 is likely to have been less child-intensive that Britain’s in 1861. Moreover, immediately after the First World War, public opinion in the more advanced countries put pressure on governments worldwide to ban the most exploitative forms of children employment. For instance, in the early 1920s, ad hoc legislation was passed in Italy to comply with international conventions on child work regulation.
Figure 4 – UK-Italy comparison (%, boys)
1851 1861
1871
1881
1891
19011911
1881
1901
1911
1921
1931
1936
1951
19610
20
40
60
80
Inci
denc
e of
chi
ld w
ork
(%)
1000 2000 3000 4000 5000 6000GDP per caput (1990 Geary-Khamis dollars)
ITALYUNITED KINGDOM
Figure 5 plots post-Second World War census data on child work incidence against GDP per head, both for Italy’s historical (1881-1961) record and a large number of other countries. We find that, until 1936, Italy had more children at work than the average post-1945 country at comparable levels of income per caput. In 1951 and 1961, however, Italy’s record looks close to the international average. This is again consistent with the notion that, besides poverty, time-related technological and institutional factors explain child work incidence.

9
Figure 5 – Italy 1881-1961 vs. present-day countries
1881
1901
1911
19211931
1936
1951
19610
20
40
60
80
Inci
denc
e of
chi
ld w
ork
(%)
0 2500 5000 7500 10000 12000GDP/head (PPP adjusted)
ItalyNonparametricregression function
Source: Authors’ estimates from ILO population census data.
4 QUESTIONS ABOUT ITALY’S CHILD WORK TRENDS
The previous section’s description of the main trends raises more questions than can be answered with our present knowledge. It may, however, be appropriate to spell them out in some detail in order to advance hypotheses for future research.
In order to stage a play with the title “Children at work” one needs actors to perform three main roles: the family, the firm, and the state. Each of these characters is central to the drama which follows, with idiosyncratic features and subtleties, a well-rehearsed script, familiar to economists. The first character embodies supply, the second demand and the third the regulator of both supply and demand. These three main actors will interact on the stage in various ways according to the situations exogenously created by the play writer. We now examine separately each of these characters in the script prepared by our dataset.
The literature unanimously states that family income is the main determinant of the supply of children to the labor market. Changes in family size, resulting from demographic transition, also play a role, as do the parents’ education attainments. The choice between work and school is framed in terms of present versus future income flows, taking into account conditions created by the two other players, the firm’s demand for both child and adult work, at relative wages reflecting the prevailing technology mix, and the state as provider of school facilities as well as an effective regulator of the job market for children.

10
4.1 INCOME
It is impossible to look at our data without intuitively gauging the overall link between child work incidence and income per caput over the long run. A closer examination of the picture, however, raises at least three questions: (i) Why did the decline in child work incidence decelerate between 1901 and 1911, at a time of relatively fast economic growth? (ii) Why do we observe an increase in the percentage of children at work between 1931 and 1936, during the recovery from the great depression, with GDP per head growing by 1.7 per cent per year? (iii) Why does the most rapid fall in child work incidence take place between 1936 and 1951 (from 32 to 10 percent) when income per caput grew, with major swings, at a fairly slow average pace (1.1 per cent per year)?
The slowdown in 1901–1911 is even more puzzling as it also coincides with both the first serious attempts to better regulate school attendance and the child work market, and with a (moderate) shrinking in the average family size due to the impact of the demographic transition which had started a couple of decades earlier. A plausible hypothesis to be tested by further research is that immigration subtracted adult workforce from agriculture providing an incentive for children to work in the fields. This hypothesis is consistent with the fact that children participation in agricultural labor force did not change during 1901-11 while it fell in every other productive sector. Regional data, on the other hand, do not fully support this hypothesis, since in southern regions, where emigration was prevalent, child work incidence fell as much or more than in most other areas.
The upward blip in child work incidence during 1931-36 took place in a context of government spending on armaments and a draft for the war in Abyssinia. A plausible hypothesis is that both required a reallocation of the workforce to either the heavy industry or the army. Wage incentives were therefore created for the employment of children in lighter (and less martial) jobs. These incentives probably offset the impact of the important institutional changes in school and job market regulation that took place in the 1930s (see below).
Finally, law enforcement probably looms large as a cause of the collapse in child work incidence between 1936 and 1951. One can assume that there existed a time lag between the legislation of the early 1930s and its implementation and that, immediately after the war, democratically-elected governments together with the larger trade union influence produced a cultural and political climate favorable to more effective law enforcement. Both the Christian Democrats in power and the left-wing parties in opposition represented cultures and ideologies that opposed the “exploitation” of children.
4.2 INSTITUTIONS
Two sets of institutions (legislation and enforcement mechanisms) have a direct impact on child work incidence: labor market regulations concerning the employment of minors, and provisions for tax-financed education. A myriad of other laws and rules have an indirect impact on the diffusion of child work (e.g. legislation on minimum wage, equal opportunity, subsidies for poor or large-size families, etc.) which shall not be examined here.

11
Child work bans and compulsory free elementary education are analyzed by economists from two main view points: welfare and political economy. The welfare impact of child work regulation is believed to be ambiguous, leading to multiple equilbria, as it crucially depends on the on-going wage rate (therefore on the prevailing technology) and on credit market imperfections (Baland and Robinson, 2000; Ranjan, 2001). Regulations also impact income distribution (Krueger, Tjornhom, and Donohue, 2005). The political economy literature deals with the conditions that favor the emergence of child work legislation, stressing technology and demography. According to Doepke and Zilibotti (2005), workers who compete with children in the labor market will support a child work ban, unless their own working children provide a large fraction of family income. This indicates that fertility decisions lock agents into specific political preferences, and thus introduction of child work legislation can be triggered by skill-biased technological change, which induces parents to choose smaller families. [I found this section unclear, but I don’t know if my revisions maintain the meaning of the passage] The authors claim that the theory accounts for the timing of the first introduction of regulations in Britain, which coincided with rapid fertility decline. In what follows we shall briefly outline the main institutional changes in Italy that were likely to impact child work incidence to try and see if they add any reasonable hypothesis about the dynamics of the phenomenon.
In November 1859, even before the political unification of the Peninsula was formally proclaimed, the Turin Parliament approved the Casati Act (named after its proponent, Gabrio Casati) which made free and compulsory elementary education mandatory for all the children in the Kingdom of Sardinia (as the Piedmontese state was then called). The law was extended to the whole of the new Kingdom of Italy after unification, in March 1861. Unified Italy was therefore born endowed with legislation that, if adequately financed and enforced, would have drastically impacted the number of child workers under age 12 or 13. The Casati Act, however, was unlikely to rapidly achieve its aim of promoting universal elementary education for three main reasons: (i) The financial burden of providing for elementary schools was put entirely on City Halls (Communes) which more often than not were financially unable to comply. (ii) Only Communes with over 4,000 inhabitants were required to provide for the entire cycle of elementary education; the rest, i.e. the vast majority, were only mandated to provide for the first two years of schooling. (iii) Responsibility for compliance was left to parents and no administrative or penal sanctions were enforced. As a result, the well-intentioned Casati Act did not provide adequate incentives to send children to school rather than to work in the predominantly agrarian, low-skill, low-wage economy.
Indirect evidence of the low compliance of schooling obligations is provided by a ministerial enquiry of 1864 which regarded school attendance of 30% for boys and 18% for girls as “satisfactory” (Talamo 1960). More realistic, the Coppino Act of 1877 set compulsory education to three years only (from age 6 to age 9) and instituted fines for non compliant parents. Whatever impact this legislation had on school attendance, it was largely limited to children in the first two or three years of school, i.e. to an age cohort not covered by our survey.
Regulations on the employment of minors, the other pillar of the legislation directly impacting child work incidence, were initially equally toothless. In 1869 the press drew attention to the dire conditions of Italian children in Paris, often the

12
object of quasi-slave trade. Thus, a law of 1873 forbade the employment of people under the age of 18 as beggars, street players and sellers, public performers, and similar occupations.
Needless to say, hot debates arose in Parliament, the popular press and scholarly journals about the desirability of both compulsory education and child work regulations. Arguments pro and against state intervention overlapped on both issues. Thus, if the liberal right, in government until 1876, supported tax-financed compulsory education on grounds that it provided positive externalities much as railways or canals did, more conservative opinion groups held that the subtraction of child manpower from the productive sector would lower the living standard of the poorest families. State legislation on child work was opposed partly on the same ground (it would negatively impact on Italy’s industrialization while hurting the weakest segments of the society) and partly for outright ideological reasons as an intrusion of the state in the private life of individuals, leading to outright subordination of all aspects of private life “to collective decision making” (e.g. Friedlander 1886). Ironically, the same ideological arguments were advanced by the Jesuits – strong adversaries of the new liberal state – in opposing the state-run school system which, they argued, infringed parental freedom of choice for their children’s education. Others, such as textile industrialist Alessandro Rossi opposed child work ban by simply denying the relevance of the problem: Italy was not England, he said, and it was an exaggeration to “see a Manchester in every [Italian] village with a hundred installed looms” (Rossi 1880). In the 1870s the legitimacy and desirability of state regulation of child work was strongly argued by Il giornale degli economisti, with articles, among others, by Luigi Luzzatti and Giuseppe Toniolo. Among prominent politicians, Sydney Sonnino was one of the early advocates of child work legislation (Sonnino 1877).
Starting in 1886 the law forbade the factory employment of children under the age of 9 (15 for dangerous jobs). Employment in agriculture remained unregulated. The most important effect of this law was to establish the right of the state to legislate on labor market matters. The law itself was poorly enforced and had little practical impact. Arguably “the 1886 law remained one of the least stringent in Europe. Italy ranked (close to) dead last in …regulating child labor” (Ashley 2003: 100). Socialist MP Andrea Costa argued that financial support to poor families was the only way to enforce child work bans. The similar idea that subsidies were the main road to promote the compliance of compulsory school laws was behind the 1888 provisions to encourage local authorities and charities to provide subsidies to schoolchildren from poor families. Ten years later, however, only 100,000 children were recipients of some form of aid (Natale, Colucci, Natoli 1975)
It was only in 1902 that new legislation set the minimum working age at 12. In 1907 the hiring of children was made subject to proof of compliance with compulsory education laws and to certification of physical fitness, and the minimum age was increased to 13 in the mining sector. Around the same time (1904) compulsory education was extended to 12 years of age.
In 1908 the so-called Corradini enquiry found that local authorities were unable to adequately provide for elementary education and that a million children did not attend school. at all. It also found a big gap in school attendance between North and South (Ministero della Pubblica Istruzione 1908). This prompted a revision of

13
the basis on which the Casati legislation had rested for fifty odd years: the devolution of elementary education to Communes. A law passed in 1911 advocated to the state the task of providing for elementary education (previously mandated to City Halls) and substantially increased government budget appropriation for elementary education.
The timing of the first major institutional breakthroughs in both compulsory education and child work legislation is consistent with our theory priors. As the pace of economic growth accelerated at the turn of the century, productivity gains and mass emigration substantially raised adult wages, thereby increasing the opportunity cost of child work while at the same time making school attendance more sustainable for low-income families, even in the absence of efficient financial markets. Theory also predicts that demographic transition will influence household strategies about child work. In fact, a demographic transition, largely endogenous to economic growth, had started in the last quarter of the 19th century, and resulted in a dramatic increase in life expectancy (from 34.3 to 44.4 in 1881-1909) and in a moderate decline in fertility (Del Panta 1996: 173). Growth also supported the emergence of trade union power and of the Socialist Party (created in 1892), both of which favored child work regulation.
In 1923 compulsory education time was raised from 4 to 5 years and the following three years of secondary (middle) education were reorganized. In 1925 education was made compulsory up to age 14. A law passed in 1934 made it illegal to hire children under 14 in any manufacturing and trade sectors; the ban did not apply to agriculture and to domestic service to relatives. Also, for legal purposes anyone under the age of 15 was defined as a “child”.
In 1961 the minimum age requirement for lawful employment was set at 15, again exempting agriculture. A few years later (1967), however, legislation was finally passed, on the joint initiative of the ministers for labor and education, for comprehensive regulation of child work based upon the compliance with compulsory education requirements, which in 1962 had been raised to a total of 8 years (5 elementary and 3 middle school). Legislators were then so confident they had abolished the phenomenon of child work that, beginning in 1971, official population censuses altogether stopped inquiring about the phenomenon.
4.3 TECHNOLOGY
There is a long history of debates on the impact of production technology on the demand of child work. Karl Marx, one of the early writers, reached the conclusion that technology (“machinery” in his words) was evil as far as children are concerned: “In so far as machinery dispenses with muscular power, it becomes a means of employing labourers of slight muscular strength, and those whose bodily development is incomplete, but whose limbs are all the more supple. The labour of women and children was, therefore, the first thing sought for by capitalists who used machinery” [Marx (1867), vol. 1, ch. 15, section 3]. In a subsequent passage Marx also noted that by depressing adult wage rates, child work pushed “other members of the workman’s family, without distinction of age or sex” to enter the labor market to earn the additional money required to compensate for the reduction in breadwinners’ wages.

14
Since Marx’s time, an extensive literature developed concerning the relationship between technological change and child work. An increasingly popular argument suggests that as technology becomes more sophisticated it contributes to the decline in child work. Empirically the evidence is scarce and, for the most part, inconclusive – see Grootaert and Kanbur (1996). In this section we explore the role played by technological change by carrying out a decomposition exercise based on the data presented in section 2.
We definine the intensity (or “depth”) of child work as the ratio between the number of working children, Pa[10,14], and the total number of economically active individuals, Pa[10+]:
(2) [10,14]
[10+]
Pa100
Pa
ijk
ijk ijkI⎛ ⎞
= ×⎜ ⎟⎜ ⎟⎝ ⎠
Note that the term ‘intensity’ is sometimes defined as the number of hours worked per day (or week, or any other time period), which is not how we use the term here. The information conveyed by Iijk is complementary to Hijk in equation (1). While the latter measures how widespread child work is, the former suggests the extent to which technology in a given sector makes intensive use of children. Of course, a number of confounding factors may be at work to weaken this link, but the assumption that Iijk contains (at least some) useful information on technology seems reasonable for our purposes.
Figure 6 shows the trend of the intensity of labor (2) at the national level. The proportion of children out of the total labor force declines consistenly thorughout the period, with two exceptions: (i) from 1881-1901 the percentage of girls in total female labor force increases, (ii) a general upward trend in 1931-1936. Figure 6 also shows that the intensity ratio is higher among girls than boys, and exhibits no tendency to converge until 1936. The pattern in Figure 6 is similar within each economic sector, with no exceptions.

15
Figure 6 – The intensity of child work, Italy 1881-1961
0.0
5.0
10.0
15.0
Wor
king
chi
ldre
n / W
orki
ng p
opul
atio
n (%
)
1881 1901 1911 1921 1931 1936 1951 1961Year
ALLBoysGirls
As a first step in the investigation about the link between technological change and child work incidence, we write the intensity index I as follows:
(3) [10 ] [10,14]
[10+]1 1[10 ]
Pa PaPa Pa
k kK K
k kkk k
I Iα+
= =+
⎛ ⎞⎛ ⎞= =⎜ ⎟⎜ ⎟⎜ ⎟⎜ ⎟
⎝ ⎠⎝ ⎠∑ ∑
where kα denotes the share of the labor force of the k-th sector ( 1kkα =∑ ),
[10 14] [10 14]Pa Pak ijki j− −=∑ ∑ , [10 ] [10 ]Pa Pak ijk
i j+ +=∑ ∑ and kI is the intensity ratio
calculated within the k-th sector. Following Muller (2006), we write the change of the intensity indicator between two dates t1 and t2 as follows:
( ) ( ) ( ) ( ) ( ) ( )2 2
1 12 1
1 1
K Kt t k kk kt t
k k
t I tdII I t I t dt I t t dtdt t t
αα
= =
⎡ ⎤∂ ∂Δ = − = = +⎢ ⎥
∂ ∂⎢ ⎥⎣ ⎦∑ ∑∫ ∫
which simplifies to:
(4) ( ) ( ) ( ) ( )2 2
1 11 1
t tK Kk k
k kk kt t
t I tI I t dt t dt
t tα
α= =
∂ ∂Δ = +
∂ ∂∑ ∑∫ ∫
The problem with our data is that the partial derivatives in equation (4) are not known for all points between t1 and t2. The values of functions at the boundary values t1 and t2 are known, however, and can be used to approximate the integrals in equation (4), and make it well defined. From among the options available for implementing such approximations, we opt for evaluating the integrands at t1.9 We obtain:
9 See Datt and Ravallion (1992), in the context of poverty decomposition analysis. While there are no substantive/technical disadvantages associated with this choice, most readers familiar with this strand of the literature will hopefully appreciate it.
16
( ) ( ) ( ) ( )2 2
1 1
1 1 1 11 1 1 1
t tK K K Kk k
k k k k k kk k k kt t
II I t dt t dt R I t t I Rt tα
α α α= = = =
Δ ΔΔ = + + = Δ + Δ +
Δ Δ∑ ∑ ∑ ∑∫ ∫
where R is the residual term that originates from the approximation. The identification of the residual R is then a straightforward algebraic matter (details omitted):
(5) ( ) ( ) ( ) ( )2 1 1 1
interaction term orlabor-force sectoral child-labor intensity residualshift effect effect(LF effect) (Technology effect)
k k k k k kk kI I t I t I t I t Iα α αΔ = − = Δ + Δ + Δ Δ∑ ∑
In equation (5) the total change in the intensity of child work (left-hand side term) is decomposed into three terms: (i) the “LF effect” (labor force effect) measures the contribution of changes in the distribution of the workforce by sector; (ii) the “Technology effect” represents the change in the intensity with which children are used as an input within each sector; and (iii) the residual term, a consequence of approximating (5) with (4).10
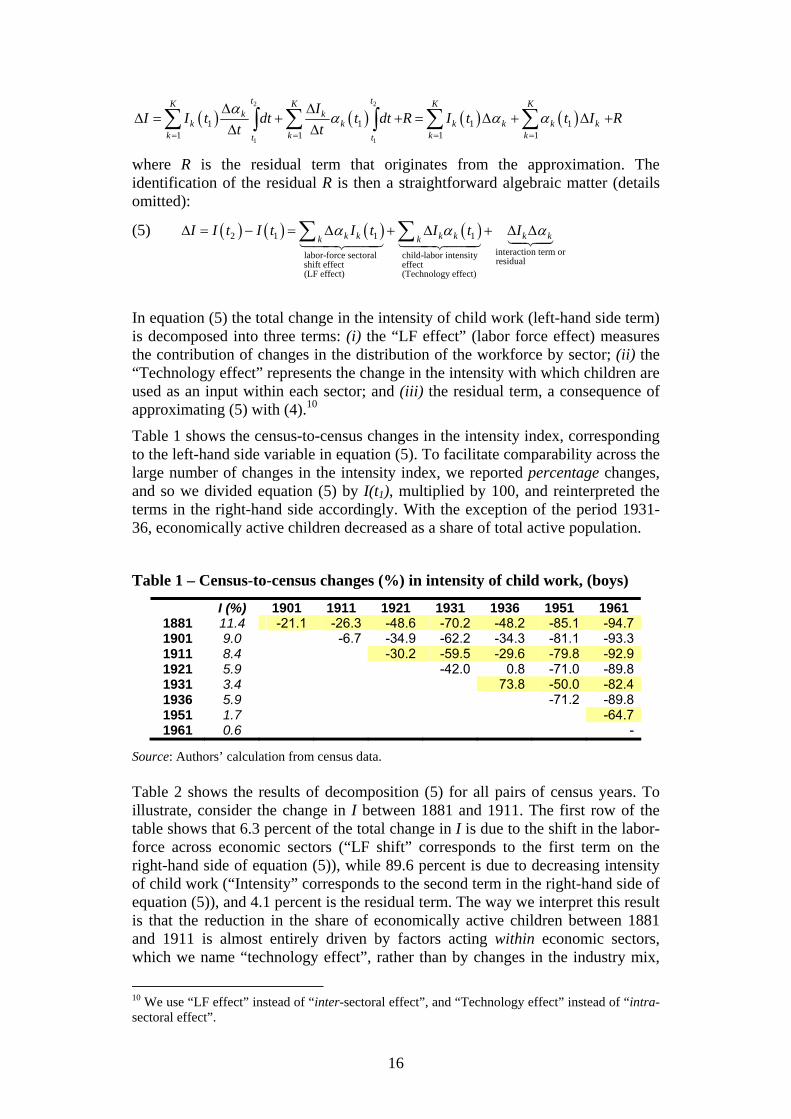
Table 1 shows the census-to-census changes in the intensity index, corresponding to the left-hand side variable in equation (5). To facilitate comparability across the large number of changes in the intensity index, we reported percentage changes, and so we divided equation (5) by I(t1), multiplied by 100, and reinterpreted the terms in the right-hand side accordingly. With the exception of the period 1931-36, economically active children decreased as a share of total active population.
Table 1 – Census-to-census changes (%) in intensity of child work, (boys)
I (%) 1901 1911 1921 1931 1936 1951 1961 1881 11.4 -21.1 -26.3 -48.6 -70.2 -48.2 -85.1 -94.7 1901 9.0 -6.7 -34.9 -62.2 -34.3 -81.1 -93.3 1911 8.4 -30.2 -59.5 -29.6 -79.8 -92.9 1921 5.9 -42.0 0.8 -71.0 -89.8 1931 3.4 73.8 -50.0 -82.4 1936 5.9 -71.2 -89.8 1951 1.7 -64.7 1961 0.6 -
Source: Authors’ calculation from census data. Table 2 shows the results of decomposition (5) for all pairs of census years. To illustrate, consider the change in I between 1881 and 1911. The first row of the table shows that 6.3 percent of the total change in I is due to the shift in the labor-force across economic sectors (“LF shift” corresponds to the first term on the right-hand side of equation (5)), while 89.6 percent is due to decreasing intensity of child work (“Intensity” corresponds to the second term in the right-hand side of equation (5)), and 4.1 percent is the residual term. The way we interpret this result is that the reduction in the share of economically active children between 1881 and 1911 is almost entirely driven by factors acting within economic sectors, which we name “technology effect”, rather than by changes in the industry mix,
10 We use “LF effect” instead of “inter-sectoral effect”, and “Technology effect” instead of “intra-sectoral effect”.

17
as measured by the distribution of the labor force across sectors. This supports the argument that technological changes tends to displace children, thereby reducing the demand for child work.
Table 2 – Decomposition of the change in intensity of child work
1901 1911 1921 1931 1936 1951 1961 1881 LF shift 2.1 6.3 4.8 6.7 7.9 6.7 11.0 Intensity 95.0 89.6 95.0 95.0 88.9 95.3 97.2 R 2.9 4.1 0.1 -1.7 3.2 -2.0 -8.2 1901 LF shift 27.8 7.4 9.0 13.9 9.0 14.8 Intensity 67.8 94.7 94.6 83.8 95.1 97.5 R 4.4 -2.1 -3.7 2.3 -4.0 -12.3 1911 LF shift 2.2 7.3 11.5 8.7 16.4 Intensity 98.6 95.5 88.4 96.0 97.6 R -0.8 -2.8 0.0 -4.7 -14.0 1921 LF shift 8.8 - 9.4 16.3 Intensity 91.7 - 93.4 96.4 R -0.5 - -2.8 -12.7 1931 LF shift 1.4 5.1 13.9 Intensity 95.9 95.8 97.4 R 2.7 -0.9 -11.4 1936 LF shift 7.5 19.8 Intensity 96.6 97.4 R -4.1 -17.2 1951 LF shift 29.3 Intensity 92.2 R -21.5
Note: the change between 1921-1936 is not significantly different from zero.
The estimates in Table 2 indicate that for most census-to-census changes, the “Intensity” component accounts for 90 percent (or more) of the observed reduction in the intensity of child work. The only notable exception to this pattern takes place during 1901-1911, a period when the reallocation of the labor across sectors is responsible for more than one fourth of the total change.
5 SUMMARY AND CONCLUSIONS
We have built a database which makes it possible to map, for the first time, in a consistent way, the phenomenon of child work in Italy over the long run (1881-1961). We now know the number of working children by age, gender and sector of employment at census dates.
The main “facts” identified by our analysis can be described as follows: (i) Initial (1881) levels of child work incidence are extraordinarily high, both by historical and present-day standards. (ii) Child work incidence sharply declines over time reaching, after the Second World War, the international average for countries at comparable levels of GDP per head. (iii) Female participation in the child labor market is initially lower than male participation but they converge over time. (iv) A fairly high regional variation in child work incidence exits which cannot, prima facie, be entirely attributed to income differences alone. (v) There appears to be

18
little or no geographical convergence in child work incidence. (vi) In absolute terms, the lion’s share of children at work were in agriculture, it is also the sector with the largest percent of children on the workforce. (vii) Changes in the allocation of total active population among productive sectors “explains” only a relatively small amount of changes in child work incidence.
The purpose of our initial investigation into the long-term trends in child work is explicitly descriptive in character. The knowledge we have acquired so far, however, allows us to make some comments on the impact of Italy’s “modern economic growth” on working children.
First, even in the absence of data for years before 1881, the high incidence of child work at that time and its overwhelming agricultural nature indicate that the phenomenon antedated the beginning of modern industrialization. In other words, an extremely high incidence of child work characterized the relatively backward Italian economy before the spread of the factory system.
Second, in the case of Italy, industrialization coincided with the reduction in the employment of children. It remains to be seen whether this is yet another indication of the relatively “benevolent” (poor-friendly) nature of Italy’s early industrialization – see Toniolo (2003, 2007). Further investigation is needed to account for qualitative changes in the working conditions (average hours worked per day, number of work days, dangerous tasks, etc. – see Saraceno, 1997).
Third, prima facie the role played by institutions looks ambiguous. The high and persistent cross-regional variance in child work incidence (particularly as far as girls are concerned) is consistent with the notion that “informal institutions” embodied in cultural differences do matter in explaining the phenomenon. On the other hand, the relatively limited impact that changes in legislation (in particular those of the early 1930s) seem to have on child work incidence give credit to the assumption that “formal institutions” only work in the presence of enforcement and are made possible by the acceptance of their aim by society at large. This seems to happen only after the Second World War (is women’s suffrage entirely unrelated?).
Fourth, after the Second World War (1951 and 1961), the incidence of child work in Italy is comparable to that observed in the same turn of time in countries with comparable levels of income per head.
.

STATISTICAL APPENDIX
Table 3 - The incidence of child work by region (%), 1881-1961 1881 1901 1911 1921 1931 1936 1951 1961
ALL Piemonte 46.3 46.1 46.5 34.5 30.3 49.3 8.4 3.1 Lombardia 55.5 50.3 43.4 28.7 25.7 36.1 3.9 2.1 Trentino Alto Adige ─ 52.8 48.0 32.2 11.0 34.9 3.5 1.3 Veneto 52.8 51.2 49.2 29.0 27.3 28.6 12.3 4.2 Friuli Venezia Giulia ─ 49.0 41.3 24.3 13.3 32.9 6.8 2.0 Liguria 52.7 38.5 31.6 21.6 18.4 31.7 2.8 1.1 Emilia Romagna 55.2 56.1 49.5 35.0 32.7 35.6 12.7 4.4 Toscana 66.3 55.8 52.2 35.6 32.6 37.4 13.3 4.4 Umbria 67.4 63.5 54.8 46.2 49.9 41.4 22.0 6.1 Marche 78.6 65.4 58.4 44.6 45.1 41.9 23.3 8.5 Lazio 60.8 47.1 40.4 27.9 23.8 29.0 6.1 2.4 Abruzzo e Molise 83.8 61.8 52.3 40.4 32.1 38.4 12.7 4.1 Campania 70.2 48.2 42.4 30.7 24.5 24.7 8.9 3.5 Puglia 76.9 47.9 43.7 31.0 24.0 23.5 13.5 5.6 Basilicata 86.1 56.9 51.8 41.0 37.4 37.0 18.9 5.1 Calabria 92.7 57.5 52.6 39.6 28.0 30.0 11.5 4.0 Sicilia 74.4 39.0 31.9 24.5 21.5 20.6 9.7 3.4 Sardegna 57.5 35.2 31.5 22.8 21.7 24.3 8.2 2.9 Italy 64.3 49.9 44.8 31.5 27.4 32.1 10.0 3.6 BOYS Piemonte 54.0 47.1 47.2 34.1 27.3 48.5 9.2 3.5 Lombardia 67.2 51.2 44.4 29.5 25.4 36.1 4.2 2.2 Trentino Alto Adige 52.7 49.8 34.1 10.7 38.4 3.9 1.5 Veneto 75.5 55.4 54.1 30.6 25.5 30.1 11.6 4.0 Friuli Venezia Giulia 52.7 46.0 24.5 11.3 34.8 5.9 1.8 Liguria 70.7 41.9 35.0 23.5 18.6 36.4 3.5 1.3 Emilia Romagna 77.5 56.3 50.1 33.9 29.3 37.6 13.3 4.5 Toscana 88.8 56.5 50.9 34.1 26.1 37.8 12.0 4.2 Umbria 90.0 63.2 54.1 40.1 33.9 40.0 19.0 5.4 Marche 94.6 67.7 61.9 43.6 37.8 38.0 22.2 8.1 Lazio 82.7 52.5 47.4 31.1 22.9 29.7 6.9 2.7 Abruzzo e Molise 97.0 68.9 59.9 46.9 32.7 36.8 15.9 4.8 Campania 83.9 56.5 48.4 35.7 26.6 26.0 10.7 4.0 Puglia 94.9 66.1 61.5 42.8 33.2 32.7 18.2 6.5 Basilicata 99.6 67.0 61.3 48.9 43.1 36.6 24.6 6.0 Calabria 97.3 61.0 61.7 47.3 34.0 30.3 14.5 4.7 Sicilia 96.8 62.5 51.6 40.1 35.5 33.3 16.9 5.5 Sardegna 94.0 59.4 52.8 37.6 34.6 38.1 13.3 4.4 Italy 81.3 56.6 51.1 35.4 28.5 34.6 11.8 4.1 GIRLS Piemonte 38.6 45.1 45.8 34.9 33.5 50.1 7.5 2.8 Lombardia 43.6 49.4 42.4 28.0 26.0 36.1 3.5 1.9 Trentino Alto Adige 52.8 46.0 30.4 11.2 31.4 3.1 1.1 Veneto 29.1 46.9 44.0 27.4 29.3 27.1 13.0 4.4 Friuli Venezia Giulia 45.3 36.9 24.1 15.1 31.0 7.7 2.3 Liguria 34.6 35.0 28.1 19.6 18.2 26.8 2.1 1.0 Emilia Romagna 32.0 55.8 48.8 36.0 36.3 33.6 12.1 4.3 Toscana 42.6 55.0 53.5 37.1 39.3 36.9 14.7 4.6 Umbria 42.8 63.8 55.5 52.7 66.8 42.7 25.1 6.8 Marche 61.7 63.0 54.9 45.6 52.5 46.0 24.4 9.0 Lazio 37.0 41.4 33.3 24.5 24.9 28.3 5.2 1.9 Abruzzo e Molise 70.3 54.5 44.4 33.7 31.4 40.0 9.4 3.4 Campania 55.9 39.7 36.0 25.4 22.3 23.5 7.1 2.9 Puglia 57.7 29.1 25.4 18.7 14.6 14.0 8.8 4.7 Basilicata 72.2 46.7 42.0 32.8 31.5 37.5 13.0 4.2 Calabria 87.7 53.8 43.1 31.5 21.8 29.7 8.4 3.2 Sicilia 51.0 13.9 10.5 7.6 6.5 7.3 2.1 1.1 Sardegna 17.9 9.7 9.0 7.3 8.2 9.9 2.9 1.3 Italy 46.6 43.1 38.3 27.5 26.4 29.5 8.2 3.1
Note: Data refer to both boys and girls. Piemonte includes Valle d’Aosta. Source: Authors’ estimation on population census data.
20
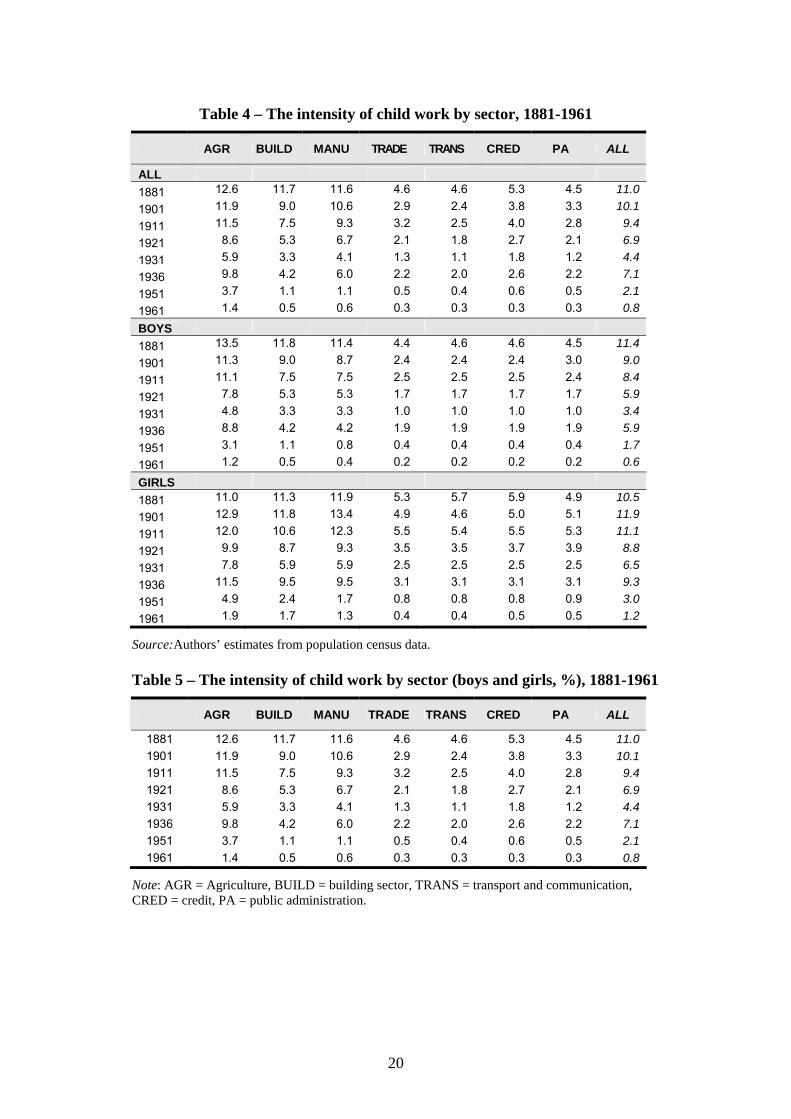
Table 4 – The intensity of child work by sector, 1881-1961
AGR BUILD MANU TRADE TRANS CRED PA ALL
ALL 1881 12.6 11.7 11.6 4.6 4.6 5.3 4.5 11.0
1901 11.9 9.0 10.6 2.9 2.4 3.8 3.3 10.1
1911 11.5 7.5 9.3 3.2 2.5 4.0 2.8 9.4
1921 8.6 5.3 6.7 2.1 1.8 2.7 2.1 6.9
1931 5.9 3.3 4.1 1.3 1.1 1.8 1.2 4.4
1936 9.8 4.2 6.0 2.2 2.0 2.6 2.2 7.1
1951 3.7 1.1 1.1 0.5 0.4 0.6 0.5 2.1
1961 1.4 0.5 0.6 0.3 0.3 0.3 0.3 0.8
BOYS
1881 13.5 11.8 11.4 4.4 4.6 4.6 4.5 11.4
1901 11.3 9.0 8.7 2.4 2.4 2.4 3.0 9.0
1911 11.1 7.5 7.5 2.5 2.5 2.5 2.4 8.4
1921 7.8 5.3 5.3 1.7 1.7 1.7 1.7 5.9
1931 4.8 3.3 3.3 1.0 1.0 1.0 1.0 3.4
1936 8.8 4.2 4.2 1.9 1.9 1.9 1.9 5.9
1951 3.1 1.1 0.8 0.4 0.4 0.4 0.4 1.7
1961 1.2 0.5 0.4 0.2 0.2 0.2 0.2 0.6
GIRLS
1881 11.0 11.3 11.9 5.3 5.7 5.9 4.9 10.5
1901 12.9 11.8 13.4 4.9 4.6 5.0 5.1 11.9
1911 12.0 10.6 12.3 5.5 5.4 5.5 5.3 11.1
1921 9.9 8.7 9.3 3.5 3.5 3.7 3.9 8.8
1931 7.8 5.9 5.9 2.5 2.5 2.5 2.5 6.5
1936 11.5 9.5 9.5 3.1 3.1 3.1 3.1 9.3
1951 4.9 2.4 1.7 0.8 0.8 0.8 0.9 3.0
1961 1.9 1.7 1.3 0.4 0.4 0.5 0.5 1.2
Source:Authors’ estimates from population census data. Table 5 – The intensity of child work by sector (boys and girls, %), 1881-1961
AGR BUILD MANU TRADE TRANS CRED PA ALL
1881 12.6 11.7 11.6 4.6 4.6 5.3 4.5 11.0 1901 11.9 9.0 10.6 2.9 2.4 3.8 3.3 10.1 1911 11.5 7.5 9.3 3.2 2.5 4.0 2.8 9.4 1921 8.6 5.3 6.7 2.1 1.8 2.7 2.1 6.9 1931 5.9 3.3 4.1 1.3 1.1 1.8 1.2 4.4 1936 9.8 4.2 6.0 2.2 2.0 2.6 2.2 7.1 1951 3.7 1.1 1.1 0.5 0.4 0.6 0.5 2.1 1961 1.4 0.5 0.6 0.3 0.3 0.3 0.3 0.8
Note: AGR = Agriculture, BUILD = building sector, TRANS = transport and communication, CRED = credit, PA = public administration.

REFERENCES
Ashley S.A. (2003), Making Liberalism Work. The Italian Experience 1860-1914, Wesport and London: Praeger.
Baland, J.M. and J. A. Robinson (2000), “Is Child Labor Inefficient?”, Journal of Political Economy, vol. 108(4), pp. 663-679.
Basu, K. (1999) “Child Labor: Cause, Consequence, and Cure, with Remarks on International Labor Standards”, Journal of Economic Literature, 37: 1083-1119.
Cigno, A. and F.C. Rosati (2005), The Economics of Child Labour. Oxford: Oxford University Press.
Cunningham, H. and P.P. Viazzo (1996), Child labor in historical perspective, 1800-1985: case studies from Europe, Japan and Colombia. Firenze: Unicef.
Del Panta, L. (1996) “Dalla metà del Settecento ai nostri giorni”, in Del Panta L., M. Livi Bacci, Pinto G., Sonnino E., La popolazione italiana del medioevo a oggi, Laterza, Roma – Bari.
Doepke, M. and F. Zilibotti, (2005) "The Macroeconomics of Child Labor Regulation," American Economic Review, vol. 95(5), pp. 1492-1524.
Edmonds E.V. and N. Pavcnik (2005), “Child Labor in the Global Economy”, Journal of Economic Perspectives, 19, 1: 199-220.
Francisci, S. and G. Vecchi (2007), A Statistical Reconstruction of the Numbers of Working Children in Italy, 1881-1961. Universita’ di Roma “Tor Vergata”, mimeo.
Friedlander, E. (1886), Il lavoro delle donne e dei fanciulli, Roma.
International Labour Organization (1996), Economically Active Population 1950-2010. Geneva: Bureau of Statistics International Labour Office.
Krueger, D. and J. Tjornhom Donohue (2005) "On The Distributional Consequences Of Child Labor Legislation," International Economic Review, vol. 46(3), pp. 785-815.
Marx, K. (1967), Capital. Progress Publishers: Moscow.
Ministero della Pubblica Istruzione (1908), L’istruzione primaria e popolare in Italia. Relazione presentata a S.E. il ministro della P.I. dal comm. Dott. Camillo Corradini, direttore generale per l’istruzione primaria e popolare, Roma.
Moheling, C. (1999), “State child labor laws and the decline of child labor”, Explorations in Economic History, 36: 72-106.
Muller, A. (2006), “Clarifying Poverty Decomposition”, Working Paper No. 217, Department of Economics, University of Göteborg. Available at: http://www.handels.gu.se/epc/archive/00004988/
Natale, G., F.P. Colucci, A. Natoli, (1975) La scuola in Italia. Dal 1859 ai decreti delegati, Milano.
Priya, R. (2001) "Credit constraints and the phenomenon of child labor," Journal of Development Economics, vol. 64(1), pp. 81-102.
Rossi, A. (1880), Perché una legge? Osservazioni e proposte sul disegno di legge per regolare il lavoro delle donne e dei fanciulli, Firenze.

22
Rossi, N., G. Toniolo and G. Vecchi (2001), "Is the Kuznets Curve Still Alive? Evidence from Italy's Household Budgets, 1881-1961", Journal of Economic History, vol. 61, 4: 904-25.
Saraceno, C. (1997) “Growth, Regional Imbalance, and Child Well-Being: Italy over the Last Four Decades”, in G. A. Cornia and S. Dazinger (eds.), Child Poverty and Deprivation in the Industrialized Countries, 1945-1995. Clarendon Press.
Sonnino, S. (1877), I contadini in Sicilia, Firenze.
Spesso, L. (1953), “L'utilizzazione delle forze di lavoro minorile in Italia”, in Commissione parlamentare di inchiesta sulla disoccupazione, La disoccupazione in Italia, Studi speciali, Atti della Commissione, vol. IV - Tomo 5. Roma: Camera dei Deputati.
Talamo, G. (1960), La scuola. Dalla legge Casati al 1864, Giuffrè, Milano.
Toniolo, G. (2003), “La storia economica dell’Italia liberale: una rivoluzione in atto”, Rivista di Storia Economica, n.s., XIX, 3: 247-262.
Toniolo G (2007), “Industrializzazione e globalizzazione: il Nord (del mondo) nella storia d’Italia (1861-1913)” in E. Francia (ed.) Luciano Cafagna. Tra ricerca storica e impegno civile, Marsilio, Venezia, pp. 175 – 192.
Tuttle, C. (1998), “A Revival of the Pessimist View: Child Labor and the Industrial Revolution”, Research in Economic History, 18: 53-82.
Vecchi, G. and M. Coppola (2006), “Nutrition and Growth in Italy, 1861-1911. What Macroeconomic Data Hide”, Explorations in Economic History, vol. 43: 438-464.
Vitali, O. (1968), La popolazione attiva in agricoltura attraverso I censimenti italiani. Roma: Istituto di Demografia dell’Universita’ di Roma.
Vitali, O. (1970), Aspetti dello sviluppo economico italiano alla luce della ricostruzione della popolazione attiva. Roma: Istituto di Demografia dell’Universita’ di Roma.


![THE NEGOTIABLE INSTRUMENTS ACT, 1881 NEGOTIABLE INSTRUMENTS ACT... · 2019-12-10 · THE NEGOTIABLE INSTRUMENTS ACT, 1881 (ACT NO. XXVI OF 1881). [9th December, 1881] Exchange and](https://img.dokumen.tips/doc/110x75/5f22e610cd225029067a775f/the-negotiable-instruments-act-negotiable-instruments-act-2019-12-10-the.jpg)