Embed Size (px)
Citation preview

1st Workshop on
IT Innovations Enabling Seamless and Secure Supply ChainsWITNESS 2011
In conjunction with the EGOV 201110th International Electronic Government Conference
Delft, The Netherlands, August 2011Proceedings
Sietse OverbeekYao Hua TanGerwin Zomer (Eds.)
Copyright © for the individual papers by the papers' authors. Copying permitted only for private and academic purposes. This volume is published and copyrighted by its editors.
Volume Editors:
Sietse Overbeek Delft University of Technology P.O. Box 5015, 2600 GA Delft, The Netherlands E-mail: [email protected]
Yao-Hua Tan Delft University of Technology P.O. Box 5015, 2600 GA Delft, The Netherlands E-mail: [email protected]
Gerwin Zomer TNO Mobility & Logistics P.O. Box 49, 2600 AA, The Netherlands E-mail: [email protected]
The keynote abstracts and papers in this book comprise the proceedings of the 1st Workshop on IT Innovations Enabling Seamless and Secure Supply Chains (WITNESS 2011), held on August 29th 2011 at the Delft University of Technology.
These proceedings also appear online at http://ceur-ws.org/

Proceedings of the
1st Workshop on
IT Innovations Enabling Seamless and Secure Supply ChainsWITNESS 2011
In conjunction with the EGOV 201110th International Electronic Government Conference
Delft, The Netherlands,
29th August 2011
Sietse OverbeekYao Hua Tan
Gerwin Zomer (Eds.)

i
Preface
The first edition of the Workshop on IT Innovations Enabling Seamless and Secure Supply Chains (WITNESS) is held on 29 August 2011 in Delft this year under the auspices of the tenth edition of the International Electronic Government Conference 2011 (EGOV 2011). The purpose of the workshop is to bring together researchers interested in the advances in IT enabling seamless and secure supply chains. Against that backdrop, we are happy to have received contributions from prominent research groups active in this field. Most of these research groups are actively participating in EU-funded research projects related to the topic of the workshop such as CASSANDRA, INTEGRITY, ITAIDE, Smart-CM, and national research projects such as the Dinalog funded project Extended Single Window.
Overall, the program consists of 6 paper presentations. Each of these was duly reviewed by at least three members of the program committee. On top of these presentations, we are very happy with the incorporation of four keynote presentations in the program. The keynotes provide insights in IT innovation for enabling seamless and secure supply chains from a government perspective, an industry perspective, a trade associations perspective and a research perspective. The opening keynote is to be given by Frank Heijmann who is the Head of Trade Relations of the Dutch Customs Administration together with David Hesketh who is a Senior Business Manager working on research and development programs within HM Revenue and Customs, International Relations. The second keynote is given by Arno Hoitink who heads the Cargonaut group of companies with a special focus on international development. The third keynote is given by William Engelen from Momentive who is an EU Customs and International Trade Compliance Manager and he is also the Business Process Owner for EU Trade Compliance. The fourth and final keynote is to be given by Yao-Hua Tan from Delft University of Technology who is a Professor on Information and Communication Technology together with Gerwin Zomer from TNO who is a Senior Logistics and Transport Consultant.
At this occasion, we wish to express first and foremost our gratitude to those who have fulfilled roles in the program committee for this workshop. Their valuable feedback has helped the presenters to further improve their work. We also wish to thank all involved local staff at Delft University of Technology for their support in organizing this event.
It is our hope that the workshop will stimulate discussions on IT innovations enabling seamless and secure supply chains, foster existing collaborations and lead to new ones. But most important of all, we hope that you will enjoy the workshop day.
August 2011 Chairs: Sietse Overbeek Yao-Hua Tan Gerwin Zomer

ii

iii
Conference Organization
Organization Chair:
Yao-Hua Tan
PC Co-chairs:
Sietse Overbeek
Gerwin Zomer
Programme Committee:
Frank Arendt, Inst. for Shipping Economics and Logistics (ISL), Germany Virginia Dignum, TU Delft, the Netherlands Paul Grefen, TU Eindhoven, the Netherlands Frank Heijmann, Dutch Customs, the Netherlands David Hesketh, HM Revenue & Customs, United Kingdom Jos van Hillegersberg, TU Twente, the Netherlands Juha Hintsa, Cross-Border Research Association (CBRA), Switzerland Wout Hofman, TNO, the Netherlands Marijn Janssen, TU Delft, the Netherlands Bram Klievink, TU Delft, the Netherlands Fernando Liesa, Zaragoza Logisitics Center (ZLC), Spain Mario Monsreal, Zaragoza Logisitics Center (ZLC), Spain Stefano Persi, Atos, Spain Godfried Smit, Dutch Shippers Association (EVO), the Netherlands Paul Swaak, Portbase, the Netherlands Albert Veenstra, TNO, the Netherlands Hans Weigand, Tilburg University, the Netherlands

iv
v
Program
9.00-9.15: Welcome by Yao-Hua Tan
9.15-10.00: Keynote: Frank Heijmann and David Hesketh The Pipeline Interface, Follow Up; Improving Compliance in International Trade, Research in the CASSANDRA Project: Risk Assessment by Trade, Serving Government Authorities’ Needs
10.00-10.30: Smart Trade Logistics – Compliance as an Opportunity Gerwin Zomer
10.30-11.00: Coffee break
11.00-11.45: Keynote: Arno Hoitink Cargonaut, the Air Cargo Perspective
12.00-12.30: Supply Chain Visibility with Linked Open Data for Supply Chain RiskAnalysisWout Hofman
12.30-13.30: Lunch
13.30-14.00: A Web-Based Data Pipeline for Compliance in International Trade Sietse Overbeek, Bram Klievink, David Hesketh, Frank Heijmann and Yao-Hua Tan
14.00-14.30: e-Customs study: Private Sector Views on Potential Benefits of Further Electronic Customs Developments in Switzerland Mikael Granqvist, Juha Hintsa and Toni Männistö
14.30-15.15: Keynote: William Engelen Real Customs Modernization: A Challenge for the Future
15.30-16.00: Coffee break
16.00-16.30: Reverse Logistics of Recovery and Recycling of Non-Returnable Beverage Containers in the Brewery Industry: A “Profitable Visit” Algorithm Mario Monsreal Barrera
16.30-17.00: e-Government Controls in Service-Oriented Auditing Perspective: Beyond Single Window Faiza Allah Bukhsh and Hans Weigand
17.00-17.45: Keynote: Yao-Hua Tan and Gerwin Zomer Improving Security of Supply Chains Through Visibility
17.45-18.00: Closing
18.30: Workshop dinner

vi

vii
Table of Contents
Keynote Frank Heijmann and David Hesketh 1
Keynote Arno Hoitink 4
Keynote William Engelen 6
Keynote Yao-Hua Tan and Gerwin Zomer 7
Smart Trade Logistics - Compliance as an Opportunity 9Gerwin Zomer
Supply Chain Visibility with Linked Open Data for Supply Chain Risk Analysis 20Wout Hofman
A Web-Based Data Pipeline for Compliance in International Trade 32Sietse Overbeek, Bram Klievink, David Hesketh, Frank Heijmann, and Yao-Hua Tan
e-Customs Study: Private Sector Views on Potential Benefits of Further Electronic 49Customs Developments in Switzerland Mikael Granqvist, Juha Hintsa, and Toni Männistö
Reverse Logistics of Recovery and Recycling of Non-Returnable Beverage 60Containers in the Brewery Industry: A "Profitable Visit" Algorithm Mario Monsreal Barrera
e-Government Controls in Service-Oriented Auditing Perspective: 76Beyond Single Window Faiza Allah Bukhsh and Hans Weigand

viii

1
Keynote: Frank Heijmann and David Hesketh
“The Pipeline Interface, Follow Up; Improving Compliancein International Trade, Research in the CASSANDRAProject: Risk Assessment by Trade, Serving GovernmentAuthorities’ Needs”
The trade supply chain has grown in complexity to a point where clear visibility is masked from those who need to know what is going on. International conventions cover the transport of goods between seller and buyer but concentrate more on limiting liabilities than they do in ensuring the accurate description of the goods. The person who knows what is being sent into the supply chain is the person who packed the box or consigned the goods. If the packing list is wrong, not used or hidden from view then the transport documents such as waybills and the manifest are likely to be inaccurate.
This poses safety, security, legal compliance and commercial risks. Information required by border enforcement agencies is being asked for further upstream in the supply chain, prior to the goods being loaded. But the consignor, who holds the key to the majority of that information, is outside the jurisdiction of the importing country’s authorities so they turn to the carrier and the importer instead. Unfortunately information held by the carrier is not always accurate and Customs hold the importer accountable for goods they have probably never seen. In these days of information management rather than the physical control of the goods the role of export data is increasingly important. The consignor and the true packing list play a key role. A web-based, seamless, electronic data ‘pipeline’ needs to link the seller/consignor and the buyer/consignee and the interested economic operators in-between. Real-time, accurate data must be assured from the beginning, updated as the goods move and shared in a risk based, layered approach.
The pipeline covers the principle that all the data relating to the goods, the buyer and the seller that Customs and other regulatory agencies require for a declaration, could be provided electronically at the Consignment Completion Point to Customs in the exporting country. It could also be provided simultaneously to Customs in any transiting or importing countries and the country of final destination through the concept of a seamless, integrated web-based data pipeline, designed to capture data upstream in the supply chain and as the goods move towards their final destination and consignee.
2
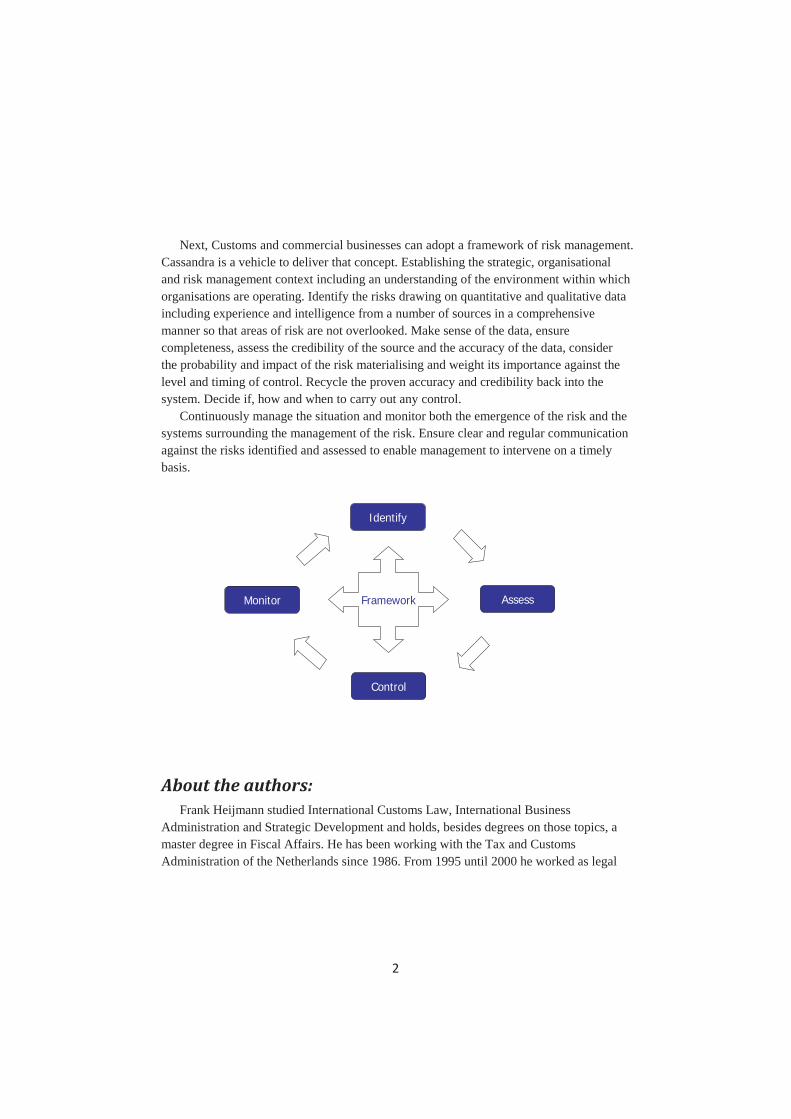
Next, Customs and commercial businesses can adopt a framework of risk management. Cassandra is a vehicle to deliver that concept. Establishing the strategic, organisational and risk management context including an understanding of the environment within which organisations are operating. Identify the risks drawing on quantitative and qualitative data including experience and intelligence from a number of sources in a comprehensive manner so that areas of risk are not overlooked. Make sense of the data, ensure completeness, assess the credibility of the source and the accuracy of the data, consider the probability and impact of the risk materialising and weight its importance against the level and timing of control. Recycle the proven accuracy and credibility back into the system. Decide if, how and when to carry out any control.
Continuously manage the situation and monitor both the emergence of the risk and the systems surrounding the management of the risk. Ensure clear and regular communication against the risks identified and assessed to enable management to intervene on a timely basis.
About the authors:Frank Heijmann studied International Customs Law, International Business
Administration and Strategic Development and holds, besides degrees on those topics, a master degree in Fiscal Affairs. He has been working with the Tax and Customs Administration of the Netherlands since 1986. From 1995 until 2000 he worked as legal
Framework Assess
Identify
Control
Monitor

3
advisor / customs coordinator for the Candidate Member States for Eurocustoms on behalf of the Dutch Customs Administration. From 2000 until 2007, he was strategic policy advisor at the Customs Administration of the Netherlands and chaired the national Codex Expert Group, responsible for explanation and implementation of EU-Customs Legislation in the Netherlands. Also he chaired in 2005 and 2006 the EU-working group on improving Inquiries in Transit. Since the end of 2007, Frank was working as Counselor Customs & International Affairs at the Dutch Ministry of Finance. His fields of attention were Customs Cooperation in Law Enforcement, Tax and Customs Relations with the Netherlands Antilles, the modernization of the EU Customs Code and the evolution of supervision and monitoring supply chains / logistics. Since October 2010 Frank is Head of National and International Trade Relations for the Customs Administration of the Netherlands.
David Hesketh has been in UK Customs since 1975 and is now a Senior Business Manager working on research and development programmes within HM Revenue and Customs, International Relations. David has extensive knowledge and experience of organisation reform in Customs having worked for the WCO as an attaché based in London, as a Project Manager for the Department for International Development in the Caribbean and on missions for the International Monetary Fund, the United Nations and the Commonwealth Secretariat. From 2006 to 2008 David was the Revenue Business Development Director with Crown Agents before returning to UK Customs. Since 2008, together with Dutch Customs, David has been involved in supply chain visibility research including the EU, FP7 projects of Integrity and Cassandra. David has a Masters degree in International Customs Law and Administration from the University of Canberra, Australia.
4
Keynote: Arno Hoitink
“Cargonaut, the Air Cargo Perspective”
The need for a Cargo Community System
To create a competitive advantage at international airports, the various stakeholders in the Cargo Community System, such as forwarders, ground handlers, airlines and customs, all need to cooperate. A lack of relevant and accurate information can result in inefficient processes and other 'hidden costs' such as excessive inventories. By sharing more information in the supply chain, it is possible to optimize these processes and reduce costs. Fast and reliable air cargo information systems become increasingly indispensable for international airports.
The Cargonaut Solution
Cargonaut has vast experience in providing electronic message exchange solutions for the airfreight industry, as well as supplying value-added products and services. These IT solutions support the further integration of business processes throughout the logistics chain and facilitate the relationship between logistics and government processes.
About the author:Arno Hoitink has been Managing Director of Cargonaut from 1992 until 2010 and was
in charge of the daily operation of the cargo community system at Schiphol Airport. He has a large experience in the business of building, implementing and operating Air Cargo related IT-systems. Since 1985 he is working for Cargonaut in several management positions in which he obtained knowledge of logistics in the transportation business in general and more specific in air cargo logistics. On a national and international level (IATA) he has been actively involved in process innovation in the air cargo industry and in the promotion and introduction of electronic information exchange between logistics companies.
5
Since the beginning of 2010 Cargonaut has international ambitions in the area of e-freight, Customs and community systems. Since 2010 Arno heads the Cargonaut group of companies with a special focus on international development.
He is also a member of the Board of Directors of Smartloxs B.V. and CIN-France. Smartloxs B.V. is a company that provides smartcard solutions for access and security in the transportation and is owned for 55% by Cargonaut. CIN-France is the Cargo Community System in France and is owned for 25% by Cargonaut . The daily operation of CIN-France is performed by Cargonaut.
6
Keynote: William Engelen
“Real Customs Modernization: A Challenge for the Future”Mr. William Engelen, EU Customs & International Trade Compliance Manager,
Momentive Specialty Chemicals B.V. will – as a member of the International Trade Council of Dutch Shippers’ Council EVO – reflect on the present state of reform of the European Customs legislation. He will speak more in detail of two trade facilitation issues included in the present legal proposal (Centralized Clearance and Single Window).
Looking at the time line and how the present legislative process is now unfolding and with the relative disappointing level of modernization included in the present proposals, Mr. Engelen will conclude with a firm plea for a business driven initiative (OptiChain) aiming at 25% reduction of transaction costs in international trade in 2020.
About the author:William Engelen (MCTA) brings a wide spread experience from the shippers and
forwarding industries. Starting on a brokerage department of a forwarding company, moving to border customs clearance the interest in logistics drove the carrier to export management in broader aspects. After being a Transport Planner Manager this lead to the position of ‘super-user’ for implementations of Enterprise Replenishment Systems, specialized in Sales and Distribution. This included all transportation documentation and automation of Customs related processes and procedures.
The last challenge has been the implementation of a Duty Management System which included a wide variety of economic customs procedures like Preferential Origin, Inward Processing Relief, Processing under Customs Control, Excises and all communication to the authorities and customers.
Currently William Engelen is working for Momentive Specialty Chemicals B.V. in the position of EU Customs and Int. Trade Compliance Manager also being the Business Process Owner for EU Trade Compliance.

7
Keynote: Yao Hua Tan and Gerwin Zomer
“Improving Security of Supply Chains Through Visibility”We will discuss (research) challenges to make global supply chains safer and more
secure by developing new ICT innovations. In particular, we propose a radical shift from the traditional “information push” model where business have the burden to provide customs clearance data to the Customs administration to an innovative “information pull” model. In the new approach, trusted traders (like Authorized Economic Operators), which can ensure that they are in control of their supply chain operations do not need to submit any information to the authorities any more for import or export of their goods. Instead interested governments get 24/7 secured access directly to the enterprise information systems of the supply chain partners and via a Single Window “pull” information when needed. This approach is called the Piggy-Back Principle. This approach to develop electronic customs builds on innovative technologies like Web Services, Service-Oriented Architecture, RFID, smart container seals and open data and message standards (WCO, UNCEFACT, GS1 etc.). The piggy-back principle cannot only be applied to provide government control agencies such as the Customs or Food Inspection agencies access to business data of companies they have to control, but it can also be applied at a more sophisticated level. Currently, many businesses apply themselves sophisticated risk analysis software tools, based on business intelligence and data mining, to optimize their own business processes. We discuss how government agencies can piggy back on these risk analyses and reuse the results of these analyses to do their own risk analysis on companies for, for example fiscal fraud or food safety. In this way piggy-back can provide many benefits for government inspection agencies. In return business can benefit by getting in return a “green lane” treatment by governments, which means that governments do much less inspections on businesses that make their enterprise information systems accessible for government agencies. We also discuss how the development of these ICT innovations can be realised by public-private partnerships between governments and businesses. This research is conducted in various national research projects, such as Extended Single Window, and international EU-funded projects such as CASSANSDRA, INTEGRITY, ITAIDE and SMART-CM.

8
About the authors:Prof. Yao-Hua Tan ([email protected]) is professor of Information and Communication
Technology at the ICT Group of the Department of Technology, Policy and Management of the Technical University Delft and part-time professor of Electronic Business at the Department of Economics and Business Administration of the Vrije University Amsterdam. He was also Reynolds visiting professor at the Wharton Business School of the university of Pennsylvania. His research interests are service engineering and governance; ICT-enabled electronic negotiation and contracting; multi-agent modelling to develop automation of business procedures in international trade.
Gerwin Zomer holds a MSc in Industrial Engineering and Management at the University Twente (the Netherlands). In 2007 he joined TNO Mobility & Logistics as a senior logistics and transport consultant. Before he worked several years as consultant in redesign of business processes and ERP implementation processes in several trade and production companies. As from 2000 he is involved in European research project in transport logistics and ICT and has built experience in managing large European projects. Gerwin also advised the Commission on a number of relevant Evaluations and Impact Assessments of EC policy initiatives, like the Marco Polo Programme evaluation, Logistics Action Plan, the European RFID policy, a new ITS Deployment Programme and on Interoperability of Electronic Fee Collection.

Smart Trade Logistics - Compliance as an Opportunity
Gerwin R. Zomer1,
1TNO Mobility & Transport, 6, van Mourik Broekmanweg, 2600 AA Delft, the Netherlands,
tel.:+31-888-66-85-47 [email protected]
Abstract. Facilitation of trade logistics aims at simplification and harmonization of border procedures and related documentation. This is an accelerator for global trade and economic growth and therefore a priority in global trade policy. Trends in logistics and supply chain security and innovations in European customs policy offer great opportunities to increase the efficiency of trade logistics. IT innovations play a crucial role in the realization of these merits. This paper presents a vision on how IT could reap these benefits, with an emphasis on two research projects that specifically address this challenge: CASSANDRA and Extended Single Window.
Keywords: Supply Chain Security, Trade Facilitation, Risk Management, Supply Chain Visibility, System-Based Control, Compliance, Single Window, Green Lanes, Trade Logistics
1 Introduction: Trade Facilitation and Trade Logistics
International trade is the cornerstone of our globalised economy. Global trade volume has increased considerably after the Second World War and equals almost $ 32 trillion in 2008 [1]. Chinese international trade has shown remarkable growth in the last decade. Between 2001 and 2010, the volume almost six folded from $ 510 billion in 2001 to $ 2973 billion in 2010 [2].
Trade facilitation aims at simplification and harmonization of international trade procedures. Trade facilitation looks at operational improvements at the interface between business and government and associated transaction costs. Efficient trade facilitation (e.g. increasing the efficiency of border procedures) can help lower trade transaction costs hence reduce the margin between domestic and international prices to benefit consumers and producers alike [3,4,5].
According to the OECD, trade transaction costs comprise both direct and indirect elements. Direct costs include mostly compliance costs related to supplying information and documents required for the movement of goods or related means of payment, and charges for trade-related services (e.g. trade insurance, port management). Indirect costs include procedural delays (time for customs clearance and cargo handling) related to the
9
market life of products, e.g. spoilage of agricultural products, product cycles for technology-intensive products. They also include the lack of predictability in the nature, application or interpretation of regulations, formalities and contracts, and costs of lost business opportunities, such as due to delays in a given country affecting the whole global production chain [6].
Trade facilitation has its intellectual roots in the fields of logistics and supply chain management. Whereas a narrow definition of trade transaction costs focuses on the ease and speed of customs procedures, a broader view also includes transportation, distribution and communication issues.
The last couple of years, this broader view is often referred to as trade and transport facilitation, where the focus is not only on customs procedures, but also covering the logistics procedures and documentation [7]. We call this the facilitation of trade logistics, meaning the management of international flows of goods, and related documentation and payments, with a focus on reducing direct and indirect logistical costs through the simplification/harmonization of procedures and documentation.
2 EU Custom Innovations
The international Customs World has changed its scope drastically in the last years, with increased attention to safety and security of both people and goods, following the 09/11 terrorist attacks. This trend is established by the USA by introducing measures like CSI, C-TPAT, the 24-hour-rule and possibly 100% scanning [4]. The taken measures should not lead to hermetically closed borders, with corresponding obstacles for Trade and Logistics. Instead, parties who have proved to be reliable and transparent can make use of simplified Customs procedures (e.g. Green Lanes), with more or less free passage of goods. The World Customs Organization (WCO) has also adapted these developments.
In 2005 the WCO has accepted the ‘Framework of Standards to secure and facilitate global trade’. The implementation of the Framework will not only lead to a safer world trade regime, but will also launch a new vision on working and cooperating for both Customs Authorities and trading partners [8].
As early as in 2003 the EU has published two Announcements on this matter, one about simplified and paperless Customs procedures, the other dealing with Customs role in the integrated management of the external borders. The starting points of these Announcements are elaborated in the eCustoms Program of the EU [9,10].
EU Customs services handle nearly 20% of world imports, some 1,545 million tonnes of sea cargo and 3 million tonnes of air cargo each year. In 2007, EU Customs offices processed 183 million declarations. In addition to collecting over €12 billion annually, EU member states administrations (MSAs) have to guard against smuggling, fraud, environmental contamination and counterfeiting. They protect endangered species, the area’s cultural heritage, and intellectual capital rights. And they collect trade statistics to
10

help policymakers detect economic trends. Most of these operations have been document- and paper-intensive – that is, until the coming of the EU’s eCustoms initiative [11].
The realization of the eCustoms Program goes hand in hand with the modernization of the Customs Code. Both are combined into the Multi Annual Strategic Plan (MASP). This plan contains a list of projects to be realized by the Member States and the European Commission. The MASP should be completed in 2014. These projects will result in a number of custom innovations, including Risk Based Approach, Authorised Economic Operator, System Based Auditing, Single Window and Centralised Clearance.
2.1 Integrated Risk Assessment Approach
The EC wants to develop an integrated risk assessment approach for supply chain security and trade between Europe and the rest of the world. A risk-based approach in designing and managing efficient and secure supply chains on the basis of high quality, integral monitoring data on cargo flows and container integrity is more effective and efficient as scanning 100% of all incoming containers.
The National Customs Authority of the first port of call in Europe performs the security analysis based on the pre-arrival information submitted 24 hours before departure from the port of origin. The results of this risk assessment are being forwarded to the other customs authorities in Europe. Because of this procedure, the EC and its Member States want the risk assessment to be performed according to a common methodology and approach. Also, this approach should if possible build upon the approach proposed in the Import Control System of the EU, which is based on using the information from an Entry Summary Declaration (ENS) and has to be submitted at least 24 hours before departure from a foreign port to a European Customs authority.
The research project CASSANDRA has to answer the question how such an integrated approach for risk assessment would look like and function and whether the ICS system and ENS procedure provide a good basis for such an integrated risk assessment. An elaboration of this project is presented later in this paper.
2.2 Authorized Economic Operator (AEO)
AEOs will be able to benefit from facilitations for customs controls or simplifications for customs rules or both, depending on the type of AEO certificate. Recognition would enable businesses to have their consignments fast-tracked through customs controls (green lanes), though this claim has to be confirmed in reality by being subject to less government controls. If a consignment is selected for examination they will receive priority over non-AEOs. AEOs or authorized carriers, freight forwarders or customs agents acting on their behalf may opt to use a reduced data set when lodging entry or exit summary declarations. The Modernised Customs Code also allows the application of
11

simplified procedures if Authorized Economic Operators perform self-assessments and take measures to reduce their risks.
2.3 System Based Auditing (SBA)
System Based Auditing is an audit methodology designed to check upon the adequacy and effectiveness of internal controls in both financial and non-financial systems. It covers process and EDP (Electronic Data Processing) auditing, or IT auditing. This way of auditing can be integrated with AEO and other certification schemes. In such an approach, customs audits the implementation of built-in controls by an AEO. Many of these built-in controls are already certified by other certification schemes (e.g. ISO) within organisations. The way customs could apply SBA in practice is one of the research subjects addressed by the Dutch project Extended Single Window.
2.4 Single Window
The objective of a Single Window as described in the eCustoms policy is to enable economic operators to lodge electronically and once only all the information required by customs and non-customs legislation for EU cross-border movements of goods.
The eCustoms Single Window concept aims at co-ordination, by customs, of all cross-border operations and the sharing of related electronic documentation with all border agencies involved in the movement of goods across community borders. The envisaged national single windows will be connected to one another and will be supported by the Single Electronic Access Point (SEAP). The SEAP will allow traders to lodge their electronic pre-arrival/pre-departure, summary and full customs declarations via one single interface of their choice which connects their system with all Member States' customs systems.
The data is automatically made available to any customs office responsible for the place at which goods have been, or are to be, presented, irrespective of the Member State concerned. SEAP can also be used as the entry point managed by one agency which informs the appropriate agencies, resulting in combined controls. The Single Window concept obviously offers more opportunity then just electronic documentation with border agencies, but also offers benefits in the exchange of information between commercial supply chain partners in order to optimize planning processes.
2.5 Single European Authorization/Central Clearance
A Single Authorisation for a simplified procedure provides the possibility of using the local clearance procedure or the simplified declaration procedure to perform the customs formalities in the Member State where the economic operator is established, for his
12

imports/exports wherever they occur in the Community. A transfer of the goods to the authorised location is possible; subsequently a periodic supplementary declaration is lodged.
A number of customs authorities have, on the basis of agreement with each other, authorised centralised clearance involving simplified entry of goods, which are located in another Member State, for the customs procedure concerned, notably for inward processing, customs warehousing and, less frequently, for release for free circulation. However, these arrangements between Member States are difficult and take a long time to be implemented, as they require long negotiations and considerable compromise between Member States, in order to find the best way of overcoming practical and legal difficulties.
In 2005, the Customs 2007 Project Group on Single European Authorisation (SEA) was given a mandate to examine a common approach in order to encourage the use of Single Authorisations, not only for customs procedures with economic impact and end-use, but also for simplified procedures at import and at export, including cases in which a customs procedure with economic impact is followed by release for free circulation. This is a major facilitation measure as the economic operator can:
concentrate in-house customs expertise at a single location, deal with only one customs administration and conduct the formalities etc. in only one language.
As it looks now, realization of Centralised Clearance is far ahead. Some of the issues to be solved before implementing the concept in practice are related to difficulties to centralize parallel processes regarding declaration of VAT and duties at import, and statistical reporting, which are not yet harmonized and show many differences between EU Member States. As long as these issues are not solved, Centralised Clearance offers not much added value compared to the bilateral approach of Single Authorisation for Simplified Procedures. Also other issues regarding distribution of the cost of generating and distributing the taxes and duties among the Member States, trade restrictions based on national regulation and cultural differences between Member States seem to slow down fast implementation of the ambitions formulated in the Modernised Customs Code [12].
3 IT Solutions to Reap the Benefits of Customs Innovation
Several existing solution providers offer fragmented, non-interoperable closed system solutions to comply with requirements for realizing Single Window, System Based Auditing, and Coordinated Border Management. These include a wide range of supply chain visibility solutions, customs solutions, port community systems, etc. However, there is a lack of an integrated interoperable solution framework built on common semantics and standards, resulting in high costs for businesses to comply with current and future
13

requirements. Compliance to border crossing procedures and regulation requires investment in IT solutions for data exchange and data sharing. Such investment is seen by most trading partners as a cost factor, but there is another side of the coin.
Advanced IT solutions based on semantic models and open standards, like the WCO data model, agreements on IDs (UCR, MRN, container ID, etc.), new technologies like Platform As A Service (cloud computing) and choreography in chains (based on open source) enable management, storage and processing of large data quantities, whereas crawling & indexing of data (search technology approach according to Service Oriented Architecture) support effective integrated risk management approaches.
Such advanced IT solutions not only considerably reduce the cost of compliance, but can also offer new business opportunities like centralized clearance. Moreover, the enhanced supply chain visibility required by customs for their risk based approach can also offer benefits for supply chain partners. As such, it not only enables them to apply the concept to compliance aspects of Corporate Social Responsibility (e.g. fair trade partnership, product safety, logistics carbon footprint analysis, but also bringing synchromodal hinterland transport services to realization. Thus, it offers ‘three for the prize of one’!
4 Research Projects CASSANDRA and Extended Single Window
Two research projects dealing with IT and customs innovations require special attention: CASSANDRA and Extended Single Window. These projects develop the proof of concept for applying semantic web technology for interoperability in freight logistics, both from technical interoperability as from business interoperability perspective.
4.1 CASSANDRA
CASSANDRA is a large collaborative European research project, co-funded by the European Commission, running from 2011 until 2014. The project is led by TNO and includes 28 partners from knowledge institutes, port authorities and port community systems (from Rotterdam, Bremen, Barcelona and Setubal), terminal operators (e.g. European Container Terminals), freight forwarders (DHL, Kuehne+Nagel), logistic service providers, IT and trade solution providers (SAP, IBM, Descartes, Intrasoft, Atos), standardization bodies (GS1) and consultants.
CASSANDRAs main objective is to enable and facilitate the combination of existing and new information sources in supply chains for containers into new and better visibility that allows the assessment of risks by business and government [13].
The proposed solution is to combine new tools, hardware, visibility platforms and other technical solutions in such a way that business and government are enabled to fully adopt a risk based approach to their operational activities, and in particular to combine
14

two strategic customs approached: the Risk-based approach with the System-based audit approach. As such, it is a much more balanced approach then the US driven approach towards 100% scanning of incoming containers. In its approach, CASSANDRA builds upon the research findings from previous projects like INTEGRITY and ITAIDE.
Currently there is a wide range of information systems along the supply chain collecting and exchanging data and information between different stakeholders (business and authorities), including tracking and tracing systems, supply chain visibility systems, customs declaration systems, maritime/port safety systems, Port Community Systems, supply chain planning/ERP systems, etc. European development of risk assessment instruments in business is in its infancy and governments have little insight/knowledge on risk based approaches in business and reliability of these approaches.
In practical terms CASSANDRA will build the seamless, electronic data ‘pipeline’ linking the seller/consignor and the buyer/consignee, thus unlocking data from the source for risk assessment purposes. The first idea from such a data pipeline were developed within INTEGRITY and is being further developed in CASSANDRA. Today, customs builds its risk assessment mainly on information from Entry Summary Declarations (ENS), which uses Ship Manifests and Bill of Lading data as the source. In these documents, the data quality of what cargo is being moved is often poor, freight forwarders are not interested in what exactly is being shipped in containers and related documents describe corresponding data fields with ‘said to contain’ a number of boxes, or STC. This Bill of Lading term is often being used so that the carrier acknowledges the receipt of stated number of packages but is unaware of the exact nature, quantity, and/or value of their contents. This is an important issue because, in case of an insurance claim, the carrier's liability may be limited only to the number of packages (for which a standard compensation is paid) and not to the total value of the claim. Therefore, both freight forwarder and ocean carrier have no interest in enhancing the visibility of what is inside the containers for commercial purposes. However, US Customs insists that reporting carriers cannot use these words in the description of goods appearing on manifests submitted under AMS Reporting. CASSANDRA is exploring ways to capture this data in other ways for customs based risk assessment.
CASSANDRA will facilitate the adoption of a risk based approach in designing and managing efficient and secure supply chains by business. In addition, CASSANDRA will facilitate a dialogue between business and government to gain acceptance of the risk based approach and risk self-assessment by business for supervision by government agencies. This principle of governments’ piggy backing on businesses’ own risk assessment, an idea that was developed in ITAIDE will be further developed in CASSANDRA and is becoming a central theme in a number of long term strategies among supervision agencies, such as customs and police [14].
The project will demonstrate and implement this approach to risk assessment in three so-called living labs. These are set up around major European tradelanes: Asia – North West Europe, North Europe – US and North Africa – Southern Europe. In CASSANDRA, the focus is on the role of freight forwarders in capturing the data for risk assessment.
15

4.2 Extended Single Window (ESW)
Extended Single Window is a Dutch research project co-funded by the Dutch Institute for Advanced Logistics (DINALOG), led by TNO and runs from 2010 till 2014. The project involves top researchers from several Dutch universities, Dutch customs, the two Dutch mainports (Rotterdam and Schiphol Airport) and their community systems Portbase and Cargonaut, associations for Shippers (EVO), air freight forwarders (ACN) and fruit and vegetables traders (Frugiventa), and several individual shippers (Flora Holland, Océ, Arrow, Herbalife, Mattel, Doehler).
The vision in ESW is to develop an integrated coordinated border management solution for ports and airports integrating with previous and subsequent procedures for reliable, secure, and cost effective logistic chains as a prerequisite for the Netherlands to serve as an excellent gateway to Europe. This coordinated border management, ‘Extended Single Window’, requires efficient and reliable information for effective joint supply chain planning by shippers, goods owners, transportation companies, forwarders, terminals and other logistic service providers and to use this information to meet government laws and regulations in a cost effective way, e.g. customs and agricultural procedures and VAT. Re-usability of business data by all government authorities for all types of goods movements is key in this approach [15].
The objective of the project is to create reliable, secure, and cost effective logistic chains throughout the Netherlands supporting all applicable regulations and procedures, by embedding events for government controls in supply chains based on safeguards in processes of certified supply chain partners, re-use of business transaction data by government agencies, and enabling Port or Business Community Systems to behave as one Information Service Bus with innovative IT. Also in this project, secure logistics chains requires the availability of reliable information on the contents of containers for risk assessment performed by Customs, thus finding alternative solutions for the ‘said to contain’ issue described earlier.
The aim is to identify which safeguards for government controls need to be defined and how they can be supported by advanced IT with contribution of business and government authorities and in close cooperation with various demonstration projects (single window, Authorized Economic Operator (AEO)/system-based controls, centralized clearance/Single Authorization for Simplified Procedures). The approach is expected to lead to a drastic reduction of physical inspections of goods in the mainports by coordinated planning of government authorities, reliable transport to and from hinterland hubs, and administrative cost reduction.
Basic research in advanced information technologies is in Event Driven Architecture with a Logistic Interoperability Ontology to realize piggy-backing and data pull. The research objectives are:
Design of a smart auditing framework based on Event Driven Architecture and Service Oriented Architecture for logistics and its governance. This includes constructing a model for implementing events as safeguards in business processes to
16
meet government regulations and procedures in line with the MCC and other applicable (EU) regulations. Development of a flexible and scalable Event-Driven Governance and Information Orchestration (EDGIO) model to ensure that information is available where and when needed. Such a model captures organizational and technical issues. The EDGIO model can be used in import/export situations as part of the event driven Information Service Bus (ISB). Construction of a Logistics Interoperability Ontology Framework as the basis for the Virtual Logistic Data Space. The ontology is used for describing semantics (1) shared amongst all actors in logistics chains and (2) supporting individual actors in their business processes and mapping their internal data to the shared concepts. Such an ontology framework may consists of components defining the semantics of individual (physical) objects and will build on international developments like the WCO data model and the UN/CEFACT Core Components. Further research is required into the fact that it is required to define different ontologies based on common components of the framework, whereas each ontology defines a specific view on the framework, e.g. an interoperability ontology, an ontology for an enterprise import/exporting for instance electronic equipment and for an enterprise importing/exporting toys. Part of the research will also be on the potential impact on ease of development and application of ontology constructed of components with distributed maintenance. Proof of Concept of the Information Service Bus built on the Event Driven Architecture and the Logistic Interoperability Ontology that will have a distributed nature in its realization. From a logistic perspective, the Information Service Bus will act as a virtual logistic data space in which actors share relevant information triggered by events of their business processes. In this way, the ISB will actively support data and process integration. Evaluation of the feasibility of the aforementioned concepts by (1) constructing different business models and (2) improving the figures mentioned in section 1.4.3 of this proposal for the added value to supply chain coordination in the Netherlands. The business models will illustrate different implementations of the concepts with their advantages and thresholds for different logistic actors. Exploration of the innovation potential of the Information Service Bus and the Virtual Logistic Data Space in terms of audit process redesign and an evaluation framework based on explicit control effectiveness and costs criteria.
In contrast to CASSANDRA, the focus in Extended Single Window is on the role of shippers and consignees in capturing the data for risk assessment.
17
5 Conclusion
IT and customs innovations offer not just an opportunity to considerably reduce the cost of compliance to border procedures, but also enable new custom facilities and related business opportunities like centralized clearance. Moreover, these solutions can also provide the enhanced supply chain visibility required by customs for their risk based approach, which can also be used by other supply chain partners. As such, compliance is no longer seen as a cost, but as an opportunity.
In order to reap these benefits, research projects like CASSANDRA and Extended Single Window are necessary to develop the prototype solutions and proof of concept, demonstrate them in practice along different trade lanes, work out the business case and business model considerations and prepare for wide scale deployment. In addition, these projects will address several other related research questions, for instance regarding the benefit logic and business case of these concepts.
References
1. WTO (2009), PRESS/554: WORLD TRADE 2008, PROSPECTS FOR 2009 - WTO sees 9% global trade decline in 2009 as recession strikes, March 2009.
2. PRC National Bureau of Statistics (2011), China’s Trade with the World, 2011. 3. APEC (2004a), ‘Trade Facilitation and Trade Liberalisation: From Shanghai to Bogor’, APEC
Economic Committee, APEC: Singapore. 4. Hummels, D. (2001), ‘Time as a Trade Barrier’, Source: (accessed 24 February 2006)
http://www.mgmt.purdue.edu/faculty/hummelsd/research/time3b.pdf. 5. OECD (2005), ‘Looking Beyond Tariffs: The Role of Non-Tariff Barriers in World Trade’,
OECD Trade Directorate, Paris. 6. OECD (2006), ‘The Economic Impact of Trade Facilitation’, OECD Trade Directorate, Paris:
(TD/TC/WP/(2006)21/FINAL). 7. WorldBank (2010), Connecting to Compete 2010 - Trade Logistics in the Global Economy,
2010. 8. Verheijen, H. (2009), Trends in Customs, paper. 9. European Commission (2007), ‘Customs Blueprints: Pathways to modern Customs’,
Luxembourg: Office of the Publications of the European Communities, 2007. 10. European Commission (2007), ‘Electronic Customs Multi-Annual Strategic Plan: 2007 Yearly
Revision, TAXUD/477/2004 – Rev. 8 EN, Number 3, “Vision and Objectives of Electronic Customs’, Brussels: European Commission, 2007.
11. IBM, Implementing e-Customs in Europe: An IBM point of view, IBM Corporation, 2008. 12. Dijk, van S., “Single European Authorisation en Centralised Clearance: succes of
mislukking?”, Master scriptie Europese Fiscale Studies, 2007. 13. Zomer, G., et al. (2009), CASSANDRA Common Assesment and analysis of risk in global
supply chains, Description of Work, Delft. 14. Tan, Y. et al. (2010), Accelerating global supply chains with IT-innovations, ITAIDE tools and
methods, 2010.
18

15. Zomer, G., et al. (2010), Extended Single Window - Information gateway to Europe: New information and governance models in international trade & logistics, Final Proposal, Delft.
19
Supply Chain Visibility with Linked Open Data for Supply Chain Risk Analysis
Wout Hofman1
1 TNO, Brassersplein 2, Delft, The Netherlands
Abstract. Current customs applications are declaration based to support the various customs procedures based on (inter)national laws and regulations. To be able to perform a proper supply chain risk analysis, customs requires to have all data in supply chains. The current declaration procedures are not sufficient since they do not supported retrieval of containers stuffing information resulting in the fact that authorities do not have a complete data set. It has been shown that enterprises already have a lot of data available to meet their customer requirements that can be made directly accessible to authorities, instead of ‘pushing’ data to the authorities based on procedures. By not only making this data available to customs but also to other authorities, they also comply with Single Window implementations. There are various solutions to data retrieval, e.g. a Service Oriented Architecture (SOA) offers a potential solution. The proposed approach in this paper is based on Linked Open Data (LOD) and implies innovative IT to be implemented by both authorities and enterprises in supply chains. The paper discusses LOD and its application to supply chain risk analysis. The proposed solution allows authorities to govern global supply chains in supply networks.
Keywords: Supply Chain Risk Analysis, Linked Open Data, Semantic Web, Ontology
1 Introduction
In a networked economy characterized by dynamic business relationships and of a global nature [1], trade volumes are rapidly growing. Globalisation and increased international trade are the two most important drivers for economic growth, which expose the population to new risks related to fraud, security, and safety [2]. In this context, the concept ‘trusted trader’ from a fiscal perspective was not only transformed to meet security requirements, but also supply chain security from a ‘green lane’ perspective is introduced. Whereas ‘trusted trader’ not only defines that a trader is known by authorities, but also has implemented particular compliance controls in its internal processes that can be audited by authorities. This concept is further extended by the EU FP6 funded ITAIDE project in I3 framework to construct a trusted trader network for the earlier mentioned ‘green lanes’ that are operated by trusted traders [3]. Information transparency or enterprise interoperability is one of
20

the important aspects of I3, not only between businesses (Business to Business: B2B), but also between business and government (B2G: Business to Government) [4]. Information transparency must offer authorities full supply chain visibility based on all available data relevant from the perspective of the physical process. Authorities like customs have defined various procedures in laws and regulations, but they still lack all data to get a complete view of supply chains. To meet these supply chain visibility requirements, authorities and traders can implement different technological solutions, e.g. in a declaration based approach, business documents are exchanged either on paper or using electronic formats like Electronic Data Interchange (EDI) and XML Schema (XML: eXtensible Markup Language). ITAIDE introduces a Service Oriented Architecture (SOA) [5] for supply chain visibility by authorities and other types of architectural approaches are also feasible, e.g. Event-Driven Architecture (EDA, [6]) or a combination of both (Event-Driven Service Oriented Architecture, EDSOA, [7]). All of these architectures are technological solutions for data capture by authorities. Data semantics is implicitly specified in this technology; extensions have been made to these syntaxes for explicit representation of semantics, e.g. Semantic Annotations for Web Services (SAWSDL [8]). Furthermore, each of these solutions requires additional specifications to be implemented by traders and authorities, potentially leading to an increase of the administrative burden. Instead of decoupling systems that leads to a decrease of administrative burden, introduction of the aforementioned technological solutions for full supply chain visibility leads to a tighter coupling of traders and authorities.
Linked Open Data (LOD) for data and content capture from its original resources is an innovative approach [9] that requires a minimal set of agreements to be implemented by traders and authorities, thus potentially decreasing the administrative burden and making optimal use of available supply chain data. LOD is an application of the so-called Semantic Web that foresees three types of applications [10], namely the crawling pattern, the on the fly deference pattern dynamically removing links for answering queries, and query federation by following links. The application of LOD and these patterns to supply chain visibility for risk analysis will be described in more detail in this paper and we will argue that the crawling pattern optimally supports supply chain visibility for risk analysis.
First of all, the objective of supply chain visibility for supply chain risk analysis and missing data is briefly presented and secondly the principles of Linked Open Data are presented. These principles are applied to supply chain visibility and finally conclusions and next steps are given.
2 Supply Chain Visibility for Supply Chain Risk Analysis
This section briefly presents the need of supply chain visibility for supply chain risk analysis. Furthermore, it defines the challenges for authorities for completing supply chain data with current missing data. Different solutions are presented in this section, whereas the next sections present a solution based on LOD in more detail.
21

2.1 The Need for Supply Chain Visibility
Various authorities like customs monitor value exchange crossing national or EU borders from a fiscal, security and safety perspective [2]. These authorities have agreed to monitor events based on (inter)national laws and regulations, which can lead to actual physical inspection. Examples of such events are selling products that may lead to export, buying leading to import, and containers with these packaged products leaving (exit) or entering a country (entry). There are particular regulations for intermediate storage, re-exportation, storage in bonded warehouses, etc. [11]. Basically, authorities currently have a requirement of receiving all information for those discrete events implemented by procedures; they themselves have to interrelate the events, i.e. to be sure that all exported goods also leave the country and all goods that leave the country have a relevant previous procedure (e.g. export, re-export), and they are able to perform risk analysis based on the captured data.
By monitoring discrete events, not all required data may be present, e.g. the export, exit, entry and import declarations do not contain packaging details of containers implying that the complete content of the container is not always to customs. To complete the information, the seamless integrated data pipeline is introduced consisting of all traders with their data and business documents participating in a supply chain (Fig. 1, [12]). As these traders share a lot of information for performing their business processes, it is the objective to re-use this information. It implies that visibility for authorities in supply chains needs to be increased.
port 1 port 2
Freightforwarder
or 3PL
Freightforwarder
or 3PL
consignoror exporter
consigneeor importer
invoice,order, etc.
entry in records entry in records
carriermanifestcarrier
manifest
GPS andsatelite
positioning
GPS andsatelite
positioning
GPS andsatelite
positioning
authority authority
post exportassuranceby customs
post clearanceassuranceby customs
country A country B
Seamless integrateddata pipeline
handling fees
packing list
Letter of Credit
carrier’s receipt
vessel booking
insurance fees
contracts of carriage
shipping note
House Way Bill
freight account
handling fees
packing list
Letter of Credit
carrier’s receipt
vessel booking
insurance fees
contracts of carriage
shipping note
House Way Bill
freight account (Frank Heijman, David Hesketh, 2011)
Fig. 1. Seamless integrated data pipeline
The conceptual pipeline can be viewed from two perspectives, namely a process and a data perspective. The process perspective specifies relations between traders in supply chains, e.g. a stevedore with contractual obligations to a shipping line and a
22

forwarder that arranges pre- or on-carriage to a port. These processes of cooperating traders can be described by transaction trees reflecting the business transactions between traders. The data perspective not only reflects the business transactions, but also the physical objects and their status. Fig. 2 shows the data perspective representing the physical objects. Each of the relations between two high level data concepts can be created physically by another supply chain actor, e.g. stuffing containers can be done by a groupage centre and a stevedore performs loading and discharging. The physical objects can be more detailed and more physical objects can be added. ‘Customs goods’ is a particular view on physical objects. They represent physical objects in terms of a customs classification used for instance for VAT purposes, the so-called harmonised goods code. The status of physical objects is represented by their availability in a place, e.g. at a stevedores location. This availability can be provided by RF tags and business transactions amongst traders. These business transactions refer to a business activity that specifies conditions under which transactions can be performed.
customs goods product cargo container transport meansimport/export
entry/exit/transit/etc.
entry/exit/transit/etc.
businessactivity
businesstransaction
place availability
Physical objects
packaging stuffing,stripping
load,discharge
load,discharge
Fig. 2. Data perspective of the pipeline
In international container transport, authorities are not always aware of the ‘packaging’ and ‘stuffing/stripping’ relations. These are added by traders that are not obliged to perform a declaration. To retrieve this information, customs has several options that will be presented hereafter.
2.2 Options for Completing the Data Perspective
To complete the data perspective, customs basically has two options, namely monitoring more discrete events with accompanying declarations or a continuous monitoring of involved traders based on capturing their supply chain data (piggy backing, see [2]). Monitoring more discrete events can be supported by various technical solutions, e.g. messaging or an Event Driven Architecture combined with web services [7]. However, introduction of additional discrete events with customs
23

procedures increases the administrative burden for traders, meaning that they have to provide more data with new procedures. A continuous monitoring based on semantic web technology might offer an alternative that could even decrease the administrative burden whilst optimal making use of available data. This paper discuss that option.
3 Linked Open Data
This section explains Linked Open Data (LOD) in the context of the semantic web. An architecture for the semantic web defines data resources and data capture mechanisms according to a known semantics. These two aspects of the semantic web are described in this section.
3.1 Data Resources with Semantics and Metadata
Data semantics is the basis of the semantic web. Open standards for the semantic web are currently applied in many open data projects [10]. The approach enables the integration of many heterogeneous data in different sources by constructing links between that data. RDF is applied for documenting these links between ‘subject’ and ‘object’. Subjects and objects are linked by their URIs (Uniform Resource Identifier). A typical example is that ‘a person’ (subject) ‘has’ (predicate) ‘a name’ (object). The combination of subject, predicate, object is called an RDF triple. RDF has limited functionality to specify semantics; this can be done with other open standards. OWL and other open standards like SKOS (Simple Knowledge Organization System) can be used for representation of semantics. Thus, a subject or an object in RDF can have complex semantics specified by an OWL or other document.
It is possible to distinguish various data resources. Sensors, enterprises, IT systems, social media are some examples of data resources. Data resources provide data of different natures, e.g. a sensor like an RF tag is a data resource with possibly streaming data and data fusion of this sensor data results in a new data resource. In all occasions, metadata has to be related to the data, specifying quality aspects of that data. Open Archives Initiative – Protocol for Metadata Harvesting (OAI-PMH, [15]) and Dublin Core (DC, [16]) are two examples of metadata. Sensor Web Enablement [17] also specifies metadata for real life sensor information. Fig. 3 shows the relations between the aforementioned technologies. It distinguishes between open data with its metadata and links that are accessible via a URI, and the specification of semantics by ontology and metadata. The specification of semantics is also a data resource with a URI and thus is also considered to be open data. In ideal application, the data and content is directly accessible from a data store. A SPARQL (SPARQL is a specific query language for RDF) endpoint to that store could serve for direct querying the data. Most of the current applications based on open data require interpretation by end-users [10]. Semantics is required for scalability.
24

resourceresource
Web of Data
resource
data,content
semantics(OWL)
metadata(OAI-PMH, DC)
resourceidentifier
(URI)
open data andmetadata
(e.g. CSV, XML)
links(RDF)
resource
resource
resource
Fig. 3. Specification of a data resource
3.2 Data Capture from Data Resources
There are basically three ways to capture data from different resources [10], namely crawling, on the fly dereferencing for capturing data from resource chains and query federation. These will be discussed in more detail. Crawling data resources is based on retrieving all open data, metadata and links of those resources. Data capture and data analysis are separate functions in this pattern, decoupled by a data store (Fig. 4). Crawling constitutes a new resource with its own particular semantics and metadata that can be queried. A pipeline can be constructed for crawling each data resource. These pipelines can differ per resources, e.g. structured and unstructured data (content) can be crawled separately.
data crawling(pipelines with different crawling functions
and settings per (group of) resources)
data
data analysis, data querying
published data of resource based on
open link data
resource resource …..
resource
Fig. 4. Data crawling, indexing and data analysis/querying/fusion
25

Although crawling is able to capture data with different semantics, agreement on these semantics is required for analysis. Ontology can specify the structure of the data store. Possibly, data pipelines require transformation functionality for storing data in the data store according this ontology. For analysis purposes, additional metadata is required, e.g. the data resource, the way the data is captured by that resource, the time of data capture, and a reference to algorithms like SPSS (Statistical Package for the Social Sciences) used for data analysis and fusion performed by the resource. The metadata of the crawled resources also needs to be stored with the data. Data fusion can for instance be performed on (real time streaming) data of one or more sensors. The fused data has its particular metadata that has to be linked to the original resource data. Data fusion is not only applicable for real time data streams, but can be applied to all types of data. In such a way, aggregated and processed data is created. Crawling can thus be applied for analysis of large amounts of data and requires replication of that data.
The second way of data capture is the so-called on the fly dereferencing pattern implying that all data is captured by following links between resources. This pattern captures data from a resource chain based on links between those resources. Only that data is captured that is relevant for the resource chain. The data resources from which data is captured are not known in advance, but become apparent by following links. Supply chains can be seen as an example of resource chains.
The third pattern is called the query federation pattern. This latter pattern is based on sending complex queries directly to a predefined set of data sources. This pattern can be used for one time queries for which the data resources to be queried are known.
4 Supply chain visibility with Linked Open Data
As we have indicated, Linked Open Data is the most commonly known application of the semantic web. This section constructs views a trader as a data resource and proposes a means for data capture to create supply chain visibility to customs. Firstly, a proposal for data capture is presented; secondly this section gives the conditions for implementing this proposal, and finally, advantages of the proposed solution are discussed.
4.1 Data Capture by Piggy Backing on Supply Chain Data
The options crawling and on the fly dereferencing seem to be the most applicable implementation options for supply chain visibility. Whereas on the fly dereferencing dynamically constructs individual supply chains in a logistics value web, crawling captures data from all actors in a value web. On the fly dereferencing is based on links between traders. Business transactions (see before) can serve as links, but only business transaction related to particular physical objects like containers need to be evaluated to construct a supply chain. Constructing supply chains in this way may be time consuming and only that part of the supply chain is constructed for which the
26

links can be followed at a given time. As many traders will act in more than one supply chain, on the fly dereferencing may not be the best option.
Thus, crawling seems to be a better option for data capture by customs. Crawling decouples data fusion and analysis functionality from data capture, allowing performing data analysis independent of data resource availability. It means that supply chain data of traders and links between those traders based on business transactions are captured independent of supply chain risk analysis. Each trader acts as a data resource in a value web by publishing available supply chain data (piggy backing). A link must have meta-data like a validity period to be able to distinguish between operational and historic transactions. The business transaction links can be used to reconstruct supply chains in the value web. Authorities can decide themselves how frequent they capture data this way; it can be every 5 minutes but also on a daily basis. Data capture also depends on the availability of data resources. Agreements have to be made in this respect between authorities and companies. Supply chain data can be enhanced for analysis purposes by retrieving additional data from external source, e.g. not only databases with know traders of authorities that can be trusted, but also data from social media defining relations between persons and thus companies. Social media data is not always trustworthy and needs to be handled as such.
data capture(pipelines with different crawling functions
and settings per (group of) traders)
actor baseddata store
data fusion(supply chain view)
supplychain data
external resource crawling
((un)structured data,pipelines)
data store
logistic value web
other resources
risk analysis(reasoning engine, different per authority based on supply chain visibility)
published data of enterprises, chain
link data
supply chain visibility
social networks and media, other
structured data
Fig. 5. Supply chain risk analysis based on capturing data in value webs
Supply chain and business transaction data (Fig. 2) published by traders need to be refreshed based on agreed events, meaning that authorities still need to monitor progress of supply chains in accordance with laws and regulations. These events can be the ones that are already defined by current customs procedures, e.g. exit, entry, import, and (re-)export (see before). A trader acting as a data resource has to build in these controls for refreshing the data, but basically they will be available since traders do business with each other.
27

An authority has two options for risk analysis after data capture. The first option is to store all data as received and analyse this data. It means that data is duplicated based on crawling frequencies. It may lead to potential large data stores, depending on the number of logistics movements that has to be captured. The second option is to fuse the received data to actually reflect the structure of a supply chain, i.e. container data is only stored once for one supply chain thus creating supply chain visibility (Fig. 5). The latter situation can be constructed by following links between actors based on transactions. The proposed solution shown in Fig. 5 can be optimized, e.g. to capture only data that is refreshed by a trader or to capture only transaction data of traders, construct supply chains in a network, and analyze vulnerability of these chains based on additional data of traders. In case one of these sources is considered to be a threat, additional data can be captured for further analysis. The latter approach closely relates to what is called System Based Auditing [14].
trader
data,content
semantics
transactionlinks supply chain data
resourceidentifier(URI/URL)
maintenance
data capture
data
data analysis, data querying
customs
trader
customs
data pipeline
Fig. 6. Global supply risk analysis
The supply chain data store offering supply chain visibility is a new data resource that can be accessed by other resources. Supply chain data is the basis for various other applications, e.g. economic figures, statistics, different risk analysis functions for each authority, etc. By further enhancing supply chain data with results of risk analysis, supply chain data of one (customs) authority can be used by another authority thus constituting a global network of interconnected authorities. Chain data crawling thus does not only mean capturing data of supply chain traders, but also data of authorities in other countries, possibly with the inclusion of the risk analysis results of that other authority. The latter requires a level of trust amongst authorities in different countries. Fig. 6 shows that a supply chain pipeline (Fig. 1) can thus be monitored by several authorities, each from its own perspective and with its particular responsibility. Global supply networks can thus be monitored by more that one authority.
28
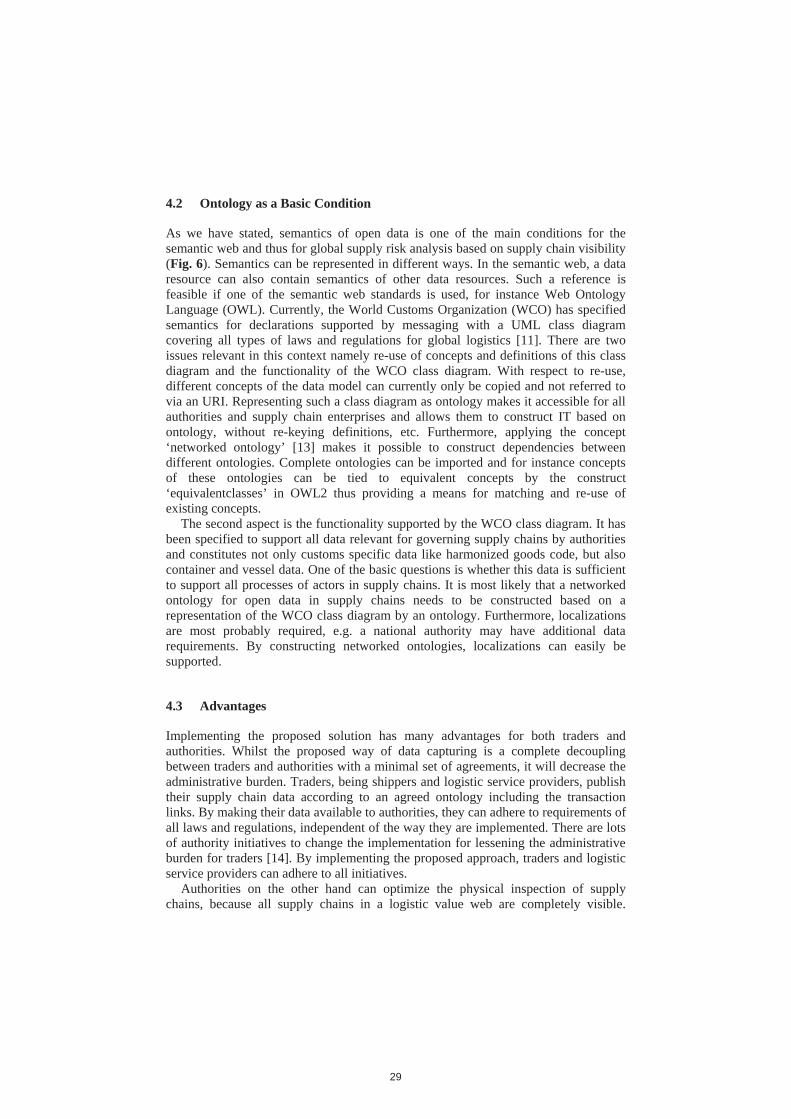
4.2 Ontology as a Basic Condition
As we have stated, semantics of open data is one of the main conditions for the semantic web and thus for global supply risk analysis based on supply chain visibility (Fig. 6). Semantics can be represented in different ways. In the semantic web, a data resource can also contain semantics of other data resources. Such a reference is feasible if one of the semantic web standards is used, for instance Web Ontology Language (OWL). Currently, the World Customs Organization (WCO) has specified semantics for declarations supported by messaging with a UML class diagram covering all types of laws and regulations for global logistics [11]. There are two issues relevant in this context namely re-use of concepts and definitions of this class diagram and the functionality of the WCO class diagram. With respect to re-use, different concepts of the data model can currently only be copied and not referred to via an URI. Representing such a class diagram as ontology makes it accessible for all authorities and supply chain enterprises and allows them to construct IT based on ontology, without re-keying definitions, etc. Furthermore, applying the concept ‘networked ontology’ [13] makes it possible to construct dependencies between different ontologies. Complete ontologies can be imported and for instance concepts of these ontologies can be tied to equivalent concepts by the construct ‘equivalentclasses’ in OWL2 thus providing a means for matching and re-use of existing concepts.
The second aspect is the functionality supported by the WCO class diagram. It has been specified to support all data relevant for governing supply chains by authorities and constitutes not only customs specific data like harmonized goods code, but also container and vessel data. One of the basic questions is whether this data is sufficient to support all processes of actors in supply chains. It is most likely that a networked ontology for open data in supply chains needs to be constructed based on a representation of the WCO class diagram by an ontology. Furthermore, localizations are most probably required, e.g. a national authority may have additional data requirements. By constructing networked ontologies, localizations can easily be supported.
4.3 Advantages
Implementing the proposed solution has many advantages for both traders and authorities. Whilst the proposed way of data capturing is a complete decoupling between traders and authorities with a minimal set of agreements, it will decrease the administrative burden. Traders, being shippers and logistic service providers, publish their supply chain data according to an agreed ontology including the transaction links. By making their data available to authorities, they can adhere to requirements of all laws and regulations, independent of the way they are implemented. There are lots of authority initiatives to change the implementation for lessening the administrative burden for traders [14]. By implementing the proposed approach, traders and logistic service providers can adhere to all initiatives.
Authorities on the other hand can optimize the physical inspection of supply chains, because all supply chains in a logistic value web are completely visible.
29

Authorities do not have to introduce additional events that have to be monitored by new procedures supported with messaging, but have full visibility if all traders make their data available to those authorities. Each chain but also each individual trader can be analysed on its behaviour. In case traders have data available, packaging and stuffing data will also be available to authorities (Fig. 2). Supply chain visibility thus improves the detection of anomalies by also including external data resources in the analysis. Furthermore, each authority can have its specific risk analysis method; for the purpose of a seamless goods flow they need to align their inspection planning. The latter prevents that the same goods are inspected more than once by different authorities. The proposed supply chain risk analysis pattern requires a new approach to IT of those authorities. They need to capture data from all types of resources and use this data for analysis instead of keeping validating the completeness of a data administration. Information management will change.
5 Conclusions and Next Steps
This paper takes a semantic web view for supply chain visibility and proposes a solution for data capture in logistic value webs. Supply chain visibility will improve supply chain risk analysis and the proposed data capturing mechanism will decrease the administrative burden since it is based on already available supply chain data (piggy backing), whereas other solutions require the implementation of new procedures by traders and authorities that will increase the administrative burden. Semantics of supply chain data can be specified by an ontology that can be based on the WCO class diagram.
It is not required for authorities and traders to implement the proposed solution instead of current, existing declaration based solutions. These can still be used and are also a data resource for data capture to construct supply chain visibility. However, as indicated in section 2, the current declaration based systems do not offer complete supply chain visibility. Thus, additional software is provided offering visibility of those events that are currently not declared. Commercial supply chain visibility tools based on sensor (RF) data like EPCIS (Electronic Product Code Information Services) or SICIS (Shared Intermodal Container Information System, www.integrity-supplychain.eu) could be used for these purposes. Not only adoption, technical and organizational aspects are of further study, but the solution also has to fit in current laws and regulations. Furthermore, the business case for both traders and authorities has to be made as part of the adoption. Security and privacy also have to be solved based on policies of traders and authorities.
Acknowledgement
This paper is the result of the Dutch Extended Single Window project funded by Dinalog and the cooperation between TNO and Capgemini for developing innovative approaches for supply chain visibility. These concepts are further developed and tested in EU FP7 Cassandra (www.cassandra-project.eu).
30
References
1. Heineke J., & Davis M. (2007), The emergence of service operations management as an academic discipline, Journal of Operations Management 25 (2007) 364–374.
2. Rukanova B., Bjørn-Andersen N., Ipenburg F. van, Klein S., Smit G., & Tan Y.-H. (2011), Introduction, in Accelerating Global Supply Chains with IT-innovations, Tan Y.H. et al. (eds.), Springer.
3. Henningsson S., Budel R., Gal U., & Tan Y.-H. (2011), ITAIDE Information Infrastructure (I3) Framework, in Accelerating Global Supply Chains with IT-innovations, Tan Y.H. et al. (eds.), Springer.
4. European Interoperability Framework for Public Services (EIF, (2009), European Commission – IADBC.
5. Erl T. (2005), Service-Oriented Architecture – concepts, technology, and design, Prentice Hall.
6. Hophe G, & Woolf B. (2004), Enterprise Integration Patterns- designing, building, and deploying messaging solutions, Addison-Wesley.
7. Overbeek S., Klievink B., & Janssen M. (2009), A flexible, event-driven, Service-Oriented Architecture for orchestrating service delivery, IEEE Intelligent Systems.
8. Semantic Annotations for WSDL and XML Schema (2008), W3C Recommendation. 9. Berners-Lee T., Hendler J, & Lassila O. (2001), The Semantic Web, a new form of web
content that is meaningful to computers will unleash a revolution of new possibilities, Scientific American.
10. Heath T., & Bizer C. (2011), Linked Data – evolving the Web into a Global Data Space,Synthesis Lectures on the Semantic web: Theory and Technology, Morgan & Claypool Publishers.
11. World Customs Organization (2009), WCO Datamodel – cross border transactions on the fast track.
12. Heshket D. (2010), Weakness in the supply chain: who packed the box?, World Customs Journal, volume 4, number 2.
13. Haase P (2009), D1.1.5 – Updated version of the networked ontology model, EU F6 NeOn: Lifecycle support for networked ontologies.
14. Stijn E. van, Phuaphanthong T., Keretho S., Pikart M., Hofman W., Tan Y-H. (2011), Implementation Framework for e-solutions for Trade Facilitation, Tan Y-H., Bjørn-Andersen N., Klein S., Rukanova B. (editors), Accelerating Global Supply Chains with IT-innovations, Springer.
15. Open Archives Initiative – Protocol for Metadata Harvesting, Protocol Version 2.0 of 2002-06-14, Document Version 2008-12-07T20:42:00Z, http://www.openarchives.org/ OAI/ 2.0/ openarchivesprotocol.htm.
16. Dublin Core Metadata Initiative, DCMI Metadata terms, http://dublincore.org/ specifications.
17. Botts M., Percivall G., Reed C. and Davidson J. (2007), OGC Sensor Web Enablement: overview and high level architecture, OGC White Paper.
18. EPC Information Services (EPCIS) Version 1.0.1 Specification (2007), GS1.
31

A Web-Based Data Pipeline for Compliance in International Trade
Sietse Overbeek1, Bram Klievink1, David Hesketh2, Frank Heijmann3 and Yao-Hua Tan1
1Faculty of Technology, Policy and Management, Delft University of Technology, Jaffalaan 5, 2628 BX Delft, the Netherlands
{S.J.Overbeek, A.J.Klievink, Y.Tan}@tudelft.nl
2Excise Customs Stamps & Money, Alexander House, 21 Victoria Avenue, Southend on Sea, Essex, SS99 1AA, United Kingdom
3Customs Administration of the Netherlands, National office, Laan op Zuid 45, 3072 DB Rotterdam, the Netherlands
Abstract. With increasing flows of containerised traffic and growing emphasis on (national) security, businesses and government are struggling to find efficient and effective means to ensure full supply chain control and security. In order to realize reliable and secure global trade, government agencies and businesses have to cooperate. Businesses are already investing in three ways to realize this goal: acquiring the Authorized Economic Operator (AEO) status to prove that a business is compliant and trustworthy, the optimization of logistics and terminal operations by means of synchro-modality, and the realization of sustainable supply chains by means of traceability and visibility. A Web-based IT infrastructure that enables the seamless integration of all data elements from all the different sources in the supply chain is dubbed integrated data pipeline.The focus of this paper is to explain a conceptual model of such a pipeline together with an analysis of the stakeholders involved in such a pipeline in international trade.
1 Introduction
An international trade supply chain is a global network consisting of autonomous or semi-autonomous business actors involved in procurement, manufacturing and distribution activities of products that cross the borders between countries or economic areas. One of the major challenges for supply chain management is to
32

develop a network structure and collaboration mechanism that can facilitate adaptive, flexible and synchronized behaviour in a dynamic environment that is both reliable and secure [1]. However, researchers are still in the early stages of investigating the general principles that govern the birth, growth and evolution of international trade supply chains. Currently, businesses are investing in three key improvements to realize a reliable and secure trade environment, see e.g. [2]. These investments are the achievement of the Authorized Economic Operator (AEO) status, the optimization of logistics and terminal operations by means of synchro-modality, and the realization of sustainable supply chains by means of traceability. An AEO is a status awarded by government to a business involved in the international supply chain which has proved themselves to be compliant and trustworthy, and where applicable, safe and secure1.
Synchro-modality concerns the switching between road transport and barge transport. The application of synchro-modality optimizes the good flows, which has several benefits. For example, if certain goods can be transported by barge instead of by truck, this is cheaper and reduces traffic jams and CO2 emission. Finally, goods traceability and supply chain visibility enables businesses to monitor what is happening and identify what went wrong in the supply chain in case of problems. These big investments made by companies in the supply chain are necessary as the current situation in international supply chains is often very complex and unclear. They are aimed to deal with this complexity and to improve supply chain visibility.
However, to realize these goals, the same reliable trade data is required. Data reliability can be improved by capturing data at the source and using this original data throughout the chain. In international trade, these sources are either the consignor or the consignee. The term consignor is a more generic term for seller and the term consignee is a more generic term for buyer. The terms consignor and consignee will be used in the remainder of the paper. The actor who knows what is being sent into the supply chain is the actor who ‘packed the box’, i.e. consigned the goods. The consignor holds the key to the majority of the information that is needed to improve supply chain visibility, which benefits both buyer and seller.
Apart from the businesses in the supply chain, also government agencies can use this data to realize their goals better, such as improving global security through visibility. In current practice, the consignor is outside the jurisdiction of the importing country’s authorities and therefore those authorities turn to the carrier and the importer for information about the goods instead. Unfortunately, information held by the carrier is not always accurate. It starts with the packing list, if that contains wrong or incomplete information, or is not used or hidden from view, then the transport documents such as way bills and the manifest are likely to be inaccurate [3]. A way bill is a consignment note referring to a receipt issued by a shipper for goods and an
1 See: http://customs.hmrc.gov.uk.
33

evidence of the contract of carriage2. The contract of carriage is a contract between a carrier of goods and the consignor and consignee. Contracts of carriage typically define the rights, duties and liabilities of parties to the contract. A manifest is based on the way bill and contains all relevant data related to the transport, such as the type of transport and the status of the goods (communal or non-communal). Non-communal goods are under the supervision of customs, whereas communal goods are not. The actor that packs the container knows what is in it. As a result, the document containing most information about a specific shipment is often the way bill.
A genuine and complete packing list that starts at the consignor plays a key role in minimizing risks such as safety, security, legal compliance and commercial risks. To ensure that the documents contain reliable data on the consignment, it is important to include the Consignment Completion Point (CCP) as an additional waypoint to the supply chain [3]. This waypoint is located at the point of container stuffing or consignment completion and at that point a full set of accurate data can be provided. The consignor needs to ensure that the order of the buyer matches the packing list, which in turn matches the invoice. The packing list should match the shipping note that matches the contract of carriage that matches the way bill that feeds the manifest. If the packing list is wrong then they are all wrong, which may harm the interests of all the parties involved [3].
Information elements upstream in the supply chain (e.g. the purchase order, an accurate description of the actual consignment, and incoterms) need to come together at the CCP to be verified between the consignor and the consignee [4]. At that point everything relevant to the consignment entering the international trade supply chain for export, transport and import takes on a legal status. If the full amount of data relating to the goods and the consignor and consignee required by Customs and other regulatory agencies for an export declaration is provided electronically at the CCP, this complete and accurate data can be used for advanced risk profiling. This involves Customs in the exporting country and Customs in any transiting or importing countries and the country of the final destination. The seamless integration of all data elements from all the different sources in the supply chain at the CCP can be realized by means of a Web-based IT infrastructure dubbed as an integrated data pipeline.
In this paper we explore the concept and issues of a seamless integrated data pipeline and discuss the stakeholders involved in such a pipeline. The paper focuses on the relationships between the pipeline concept and the stakeholder setting. Therefore, the paper is further structured as follows. Section 2 shows the conceptual model of a seamless integrated data pipeline. Section 3 introduces the identified stakeholders of the pipeline. The issues that stakeholders have in their current situations showing the necessity for an integrated data pipeline are mentioned in section 4. Section 5 shows the stakeholders that enable the realization of the pipeline
2 See: http://en.wikipedia.org/wiki/Waybill.
34
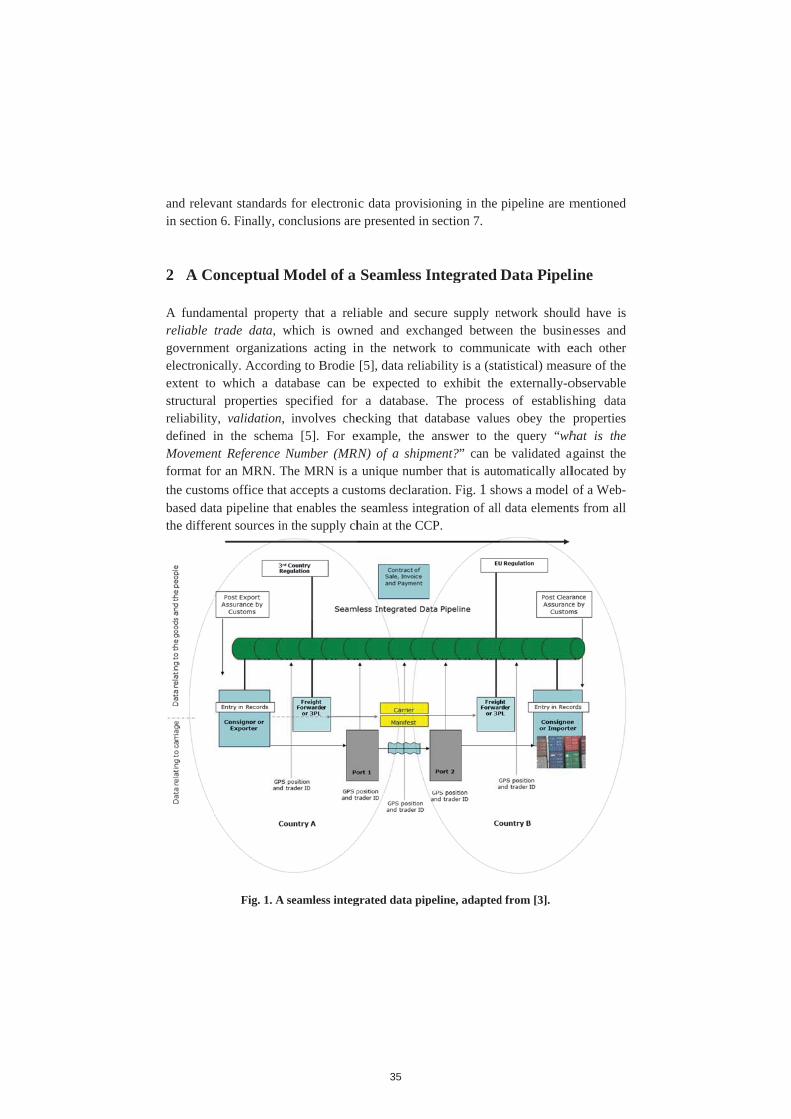
and relevin section
2 A Co
A fundamreliable governmeelectronicextent tostructuralreliabilitydefined iMovemenformat fothe custombased datthe differ
vant standardsn 6. Finally, co
onceptual M
mental propertrade data, went organizatically. Accordi
o which a dal properties y, validation,in the schemnt Reference Nor an MRN. Tms office thatta pipeline tharent sources in
Fig. 1. A
s for electronionclusions are
Model of a
rty that a reliwhich is ownions acting ining to Brodie atabase can bspecified for involves che
ma [5]. For eNumber (MRN
The MRN is at accepts a cusat enables the n the supply ch
seamless integ
ic data provisie presented in
Seamless I
iable and secned and exchn the networ[5], data relia
be expected tr a database. ecking that dexample, the N) of a shipm
a unique numbstoms declaratseamless inte
hain at the CC
grated data pip
ioning in the section 7.
Integrated
cure supply nhanged betwerk to communability is a (stato exhibit the
The procesdatabase value
answer to thment?” can bber that is auttion. Fig. 1 shegration of allCP.
peline, adapted
pipeline are m
Data Pipel
network shoulen the businnicate with eatistical) mease externally-os of establishes obey the he query “whe validated aomatically all
hows a model l data element
d from [3].
mentioned
line
ld have is nesses and each other sure of the observable hing data properties hat is the against the located by of a Web-ts from all
35

The figure shows what kind of shipment data is exchanged in the supply chain during transportation. The international contract of sale, agreed between the buyer and the seller before the goods are consigned, should contain all the relevant data about the goods and the parties, the terms and the planned movement of the goods. The consignor makes an entry in its records containing the necessary and accurate data about the shipment fed by the packing list which should match the purchase order and invoice. This precise data is forwarded to the freight forwarder or a third-party logistics provider (3PL). With which parties the data may be exchanged from a legal perspective is determined by legislation at the national level, EU level or federal level dependent of the country in which the goods move. The pipeline concept draws upon Radio Frequency Identification (RFID) technology for localised tracking of goods at unit, pallet, consignment and container levels. It also draws upon Global Positioning Systems (GPS) to track consignment and containers, where appropriate and cost effective, as well as the tracking of vessels carrying containers through the coastal Automated Identification System3 (ShipAIS) and the Long Range Identification and Tracking system4 (LRIT). The pipeline model shows that all other destitutes of the shipment data get the original shipment data from the consignor; it is not altered by someone else. This includes the planned port of departure, port of arrival, the carrier with the manifest, Customs and the consignee.
In the data pipeline, a difference is made between data that is related to goods and people, and data that is related to the carriage itself. When sharing data in the pipeline, actors can make this distinction. The benefits that the business world will have with such a pipeline are twofold. For a customs declaration, the right data should be gathered and assembled before a customs declaration can be submitted. With a pipeline, it is easier to gather the complete and accurate data at the CCP. Furthermore, it requires less message exchanges between businesses and government in order to complete a full declaration. Both benefits potentially save time and money and can as such be seen as commercial benefits. These kind of commercial benefits should be clear for the business world for successful adoption of the data pipeline. Without clear commercial benefits it will be difficult if not impossible to motivate the business world to use the data pipeline for data exchange in international trade.
3 Stakeholder Analysis
The implementation of a Web-based, seamless, integrated data pipeline is a complicated endeavour, both from a technical point of view and from many other perspectives, including strategic, organizational, political and cultural viewpoints.
3 See: http://www.shipais.com. 4 See: http://www5.imo.org/SharePoint/mainframe.asp?topic_id=905.
36

Moreover, a large number of stakeholders from different organizations are involved in developing and using the data pipeline. Two scenarios for analysing the stakeholders of the pipeline model can be distinguished, see e.g. [6]. These are the market-drivenapproach by commercial companies and the market-facilitating approach by public administrations. In the context of the pipeline model, these public administrations include national government organizations such as Customs and ministries, European bodies like the European Commission’s Taxation and Customs Union Directorate-General (DG TAXUD), international bodies like the World Customs Organization (WCO) and the United Nations (UN).
These public administrations can be viewed as institutions, i.e. complex social systems. Institutions are the facilitators of innovation in the market [7]. Successful institutions are learning organizations, able to adapt to knowledge and to network. They form alliances and partnerships that result in robust supply chains, whether political, economic, environmental, or social. There is a need for closer real-time collaboration between customs administrations and between Customs and business in facilitating legitimate trade and undertaking customs controls. This global customs network can be created in partnership with the various stakeholders of the public and the private sectors in support of the international trading system5. The vision of this network implies the creation of an international e-Customs network that will ensure seamless, real-time and paperless flows of information and connectivity that is realized by the creation of the data pipeline.
Yet the patterns of innovation and the paths to innovation are uneven across sectors and nations, as is described in [7]: “Some Asian countries, such as Japan and Korea, tend to be mission-oriented in their science and technology policies. Some, like members of the European Union, approach innovation from a regulatory and social distribution point of view. Others, like the US - because of their scale and scope and because of their culture of individualism and entrepreneurship - tend to be mixed but focused. Institutions are steered and positioned through governance” [7]. Successful institutional governance requires an understanding of the management of knowledge, but first it must understand the institutional context and value of knowledge.
The market-driven stakeholder approach concerns the stakeholders that benefit from a seamless integrated data pipeline in international trade, which is aimed at minimizing complexity in trade and logically linking the parties involved. Stakeholders that can be identified from a market-driven approach range from the seller/consignor to the buyer/consignee and include the economic operators in-between. These actors include inland carriers, forwarders, shipping agents, sea terminal operators, Customs, inspection authorities and port authorities. These actors
5 See: http://www.gs1.org/customs.
37

play a role in both the exporting country and the importing country. Between the countries (at sea) the shipping line is an important actor [8].
In a market-driven approach to the development of an integrated data pipeline, a number of stakeholders can be identified in supply chains for international trade in the Netherlands. This can be illustrative for what could happen in other EU countries and shows which stakeholders are involved in the implementation of a Web-based, seamless, integrated data pipeline for international trade. The following stakeholders play a key role:
Sea carriers; Container terminals; Freight forwarders: freight forwarders usually take the responsibility for planning, arranging as well as optimizing shipments [9]. By using the co-loading shipment method, which means filing various goods into a container, different shipments for customers can be handled effectively; Providers of Port Community Systems (PCS): a PCS enables all the links within a logistics chain of a seaport or airport to efficiently exchange information with one another [10]; Providers of the e-Government infrastructure: these are a national message broker, or a single window IT infrastructure to public service providers so that citizens and businesses can conduct electronic business with them; Large consignors or consignees: these parties manage most of their supply chains by themselves or have much intra-company transfer. They may use the pipeline to interact with other organizations in the chain; International standardization bodies: important standardization bodies in the context of international trade include e.g. WCO, UN/CEFACT and GS1.
Based on their role in the stakeholder network, stakeholders may contribute to enabling an integrated data pipeline, benefit from its realization or may have both properties. Subsequently, the roles of the aforementioned stakeholders in the network are discussed and the issues they currently have. The way the supply chain is managed nowadays is costly for many parties and improving the supply chain visibility is in the interest of the commercial parties.
4 Stakeholder Issues
The stakeholder issues showing the necessity for an integrated data pipeline for international trade are illustrated by means of three examples. The first example is about the relationship between the freight forwarder and the shipping line. Typically,
38
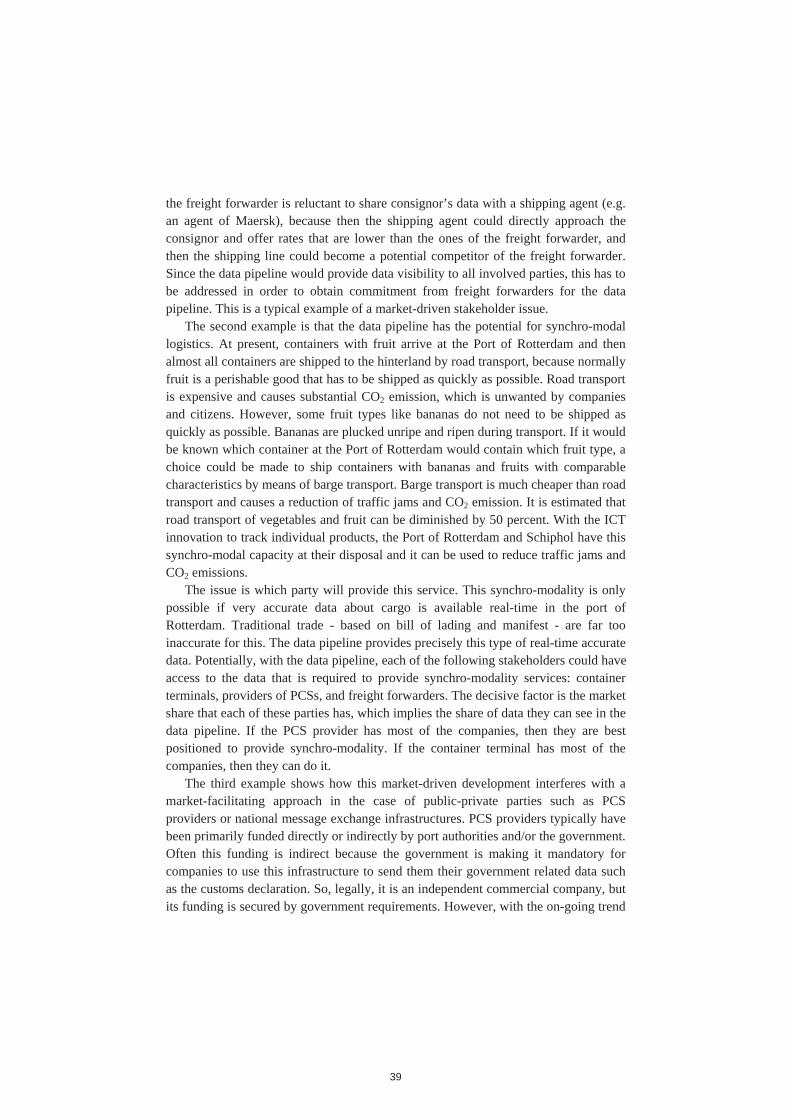
the freight forwarder is reluctant to share consignor’s data with a shipping agent (e.g. an agent of Maersk), because then the shipping agent could directly approach the consignor and offer rates that are lower than the ones of the freight forwarder, and then the shipping line could become a potential competitor of the freight forwarder. Since the data pipeline would provide data visibility to all involved parties, this has to be addressed in order to obtain commitment from freight forwarders for the data pipeline. This is a typical example of a market-driven stakeholder issue.
The second example is that the data pipeline has the potential for synchro-modal logistics. At present, containers with fruit arrive at the Port of Rotterdam and then almost all containers are shipped to the hinterland by road transport, because normally fruit is a perishable good that has to be shipped as quickly as possible. Road transport is expensive and causes substantial CO2 emission, which is unwanted by companies and citizens. However, some fruit types like bananas do not need to be shipped as quickly as possible. Bananas are plucked unripe and ripen during transport. If it would be known which container at the Port of Rotterdam would contain which fruit type, a choice could be made to ship containers with bananas and fruits with comparable characteristics by means of barge transport. Barge transport is much cheaper than road transport and causes a reduction of traffic jams and CO2 emission. It is estimated that road transport of vegetables and fruit can be diminished by 50 percent. With the ICT innovation to track individual products, the Port of Rotterdam and Schiphol have this synchro-modal capacity at their disposal and it can be used to reduce traffic jams and CO2 emissions.
The issue is which party will provide this service. This synchro-modality is only possible if very accurate data about cargo is available real-time in the port of Rotterdam. Traditional trade - based on bill of lading and manifest - are far too inaccurate for this. The data pipeline provides precisely this type of real-time accurate data. Potentially, with the data pipeline, each of the following stakeholders could have access to the data that is required to provide synchro-modality services: container terminals, providers of PCSs, and freight forwarders. The decisive factor is the market share that each of these parties has, which implies the share of data they can see in the data pipeline. If the PCS provider has most of the companies, then they are best positioned to provide synchro-modality. If the container terminal has most of the companies, then they can do it.
The third example shows how this market-driven development interferes with a market-facilitating approach in the case of public-private parties such as PCS providers or national message exchange infrastructures. PCS providers typically have been primarily funded directly or indirectly by port authorities and/or the government. Often this funding is indirect because the government is making it mandatory for companies to use this infrastructure to send them their government related data such as the customs declaration. So, legally, it is an independent commercial company, but its funding is secured by government requirements. However, with the on-going trend
39

that governments require them to become more financially self-supporting, PCS providers are currently investigating their opportunities for developing new value-adding services that they could offer to the market, and that could generate more revenues.
One profitable option would be if they become data hubs that could provide synchro-modality. But if they offer this, then they become competitors of container terminals or freight forwarders in the area of synchro-modality. Very similar issues are arising for national data exchange infrastructures. Typically, they are funded and operated by the government, but if governments decide that they should become financially more self-supporting, then they also have to look for new value-added services. Since they would also have access to the data pipeline, they also could aim for providing synchro-modality services. However, this might conflict with their public role. For example, in the Netherlands the Supd@x functionality in a message broker called Digipoort is combining data intended for different government agencies. According to privacy regulation, they are allowed to combine these data as long as it is only used by government agencies. They are not allowed to combine these data for commercial purposes. Hence, national data exchange infrastructures have to balance very carefully between their public and private roles. The broader issue here is on the division of roles and responsibilities between government organizations, businesses and intermediaries.
So, a key issue here is whether governments are willing to secure the funding of national data exchange infrastructures, or whether they require them to become financially more self-supporting with new commercial services. In this way these three examples show how market-driven issues are shaped by a market-facilitating approach by public administrations.
5 Stakeholders enabling an Integrated Data Pipeline
Next to stakeholders that may benefit from using an integrated data pipeline, there are stakeholders that enable such a pipeline. Portbase is a stakeholder that offers the PCS for the Port of Rotterdam. Next to Rotterdam, the Port of Amsterdam also relies on the PCS offered by Portbase. Specific functionality to improve information exchange between private organizations in the supply chain and Dutch Customs that Portbase will offer includes for example the automated indication of differences when comparing different export declarations leading to an improved risk profiling by Customs. At this moment, Portbase has commercial relationships with carriers and stevedores that use the PCS for data transactions necessary to channel shipments through the ports of either Rotterdam or Amsterdam. This is different in the case of freight forwarders, from which Portbase does not have a commercial advantage yet, which can change in the near future and provides commercial advantages for
40

Portbase. On the contrary, the expansion project ‘Maasvlakte 2’ might prove less of an advantage for Portbase. Maasvlakte 2 is an initiative to expand the Port of Rotterdam by 2.000 hectare, which means a port increase of 20%. After completion, the Port of Rotterdam will measure 12.000 hectare. The Maasvlakte 2 project will attract new container terminals to the port. Currently, 70% of all shipments in the Port of Rotterdam is handled by the Europe Container Terminals (ECT), which is a member of the Hutchison Port Holdings (HPH). Due to the arrival of competing container terminals their share might shrink to about probably 45%. If this happens, it will also affect the operations run by Portbase as their operations are tightly coupled with those of ECT.
Next to Portbase, there are many other companies that provide logistics services on a global level that are also related to customs clearance. For instance, a company like the Kuijken Logistics Group (KLG)6 offers full customs and documentation facilities for businesses. Clients can rely on the company to undertake all the paperwork related to importing and exporting goods. The KLG customs specialists ensure that goods are correctly and securely cleared. This involves the preparation of documents, calculation of taxes, duties and excises, giving advice on specific requirements, facilitating communication with authorities, etc. Using the KLG customs clearance services businesses can avoid costly delays or seizure of the goods, exposure to error or omission, and save time. A global clearance service offered to businesses has as additional advantage that businesses do not need to use a local PCS for each country through which their goods flow. Another example of a provider of logistics services is the company MIC Customs Solutions7. The clearance service provided by this company is a standard customs solution on a single technical platform that supports more than 40 countries. It enables the automated creation of import and export declarations to leverage and seamlessly convert one country’s customs export clearance into another country’s customs import clearance, streamlining inter-company shipping processes. The system also allows quick electronic transfer of data to third parties like brokers and carriers. This prevents the re-keying of data, eliminates mistakes, reduces costs and increases compliance. Now that it is clear that there are various companies providing PCSs that businesses can use for customs clearance services it should also be mentioned that the government does not have the intention to make the use of a specific PCS for customs clearance mandatory for companies. Global players might even want to use a PCS of their own preference, which can differ from a PCS that is used locally.
Digipoort, the Dutch IT infrastructure for e-Government, is an ‘electronic post office’ to facilitate message exchange between businesses and government. In fact, Digipoort simply functions as a router for electronic messages that businesses need to
6 See: http://www.klg-logistics.com. 7 See: http://www.mic-cust.com.
41

send to public parties. An extension of Digipoort is called ‘Supd@x’. Supd@x offers intelligence to interpret the data from the B2G message interactions and determines which data is relevant for which governmental organization. This also includes additional status information. For example, for a specific way bill additional insight might be provided for all public authorities involved, such as insights in which public authorities have acquired data related to that way bill and if there are public authorities that have already accepted or rejected received messages that are based on data related to a specific way bill. However, the current estimate is that it might take a few more years before Supd@x is fully operational as an extension to Digipoort.
A significant question related to stakeholders enabling a pipeline is which stakeholder(s) is / are actually going to manage an integrated data pipeline once it has been realized. The notions of data ownership and data custody will then come into play, as for successful data management the owner of the data should be known to the managing party as well as who has data in custody, i.e. which party has which data stored in their company databases. On a global scale, it can even be expected that several data pipelines like the one proposed in this paper exist that may be interconnected with each other and managed by separate parties. One of the reasons that this may happen is because countries involved in the realization of a worldwide data pipeline may not trust each other, resulting in separately managed but interconnected data pipelines. Also, public authorities will have a hard time trusting private parties to manage the data pipeline, because public authorities will not trust private parties to manage data that is owned by those public authorities. For this reasons it could be helpful if international institutions such as the WCO or UN would play a neutral trusted third party role in the management of the data pipeline as a neutral and trusted public institution.
6 Standardized Electronic Data Provisioning
Standardization bodies that offer standard languages tailored to the needs of message exchange in international trade include e.g. WCO, UN/CEFACT and GS1. There are different possible approaches to standardize electronic data provisioning. This can be illustrated by the different approaches as applied by GS18 and Descartes9. GS1 is an international not-for-profit association dedicated to the development and implementation of global standards and solutions to improve the efficiency and visibility of supply chains globally and across multiple sectors. The standardization approach as applied by GS1 concerns the provisioning of standards of which the intention is that these standards are used globally by everyone involved. For example,
8 See: http://www.gs1.org. 9 See: http://www.descartes.com.
42
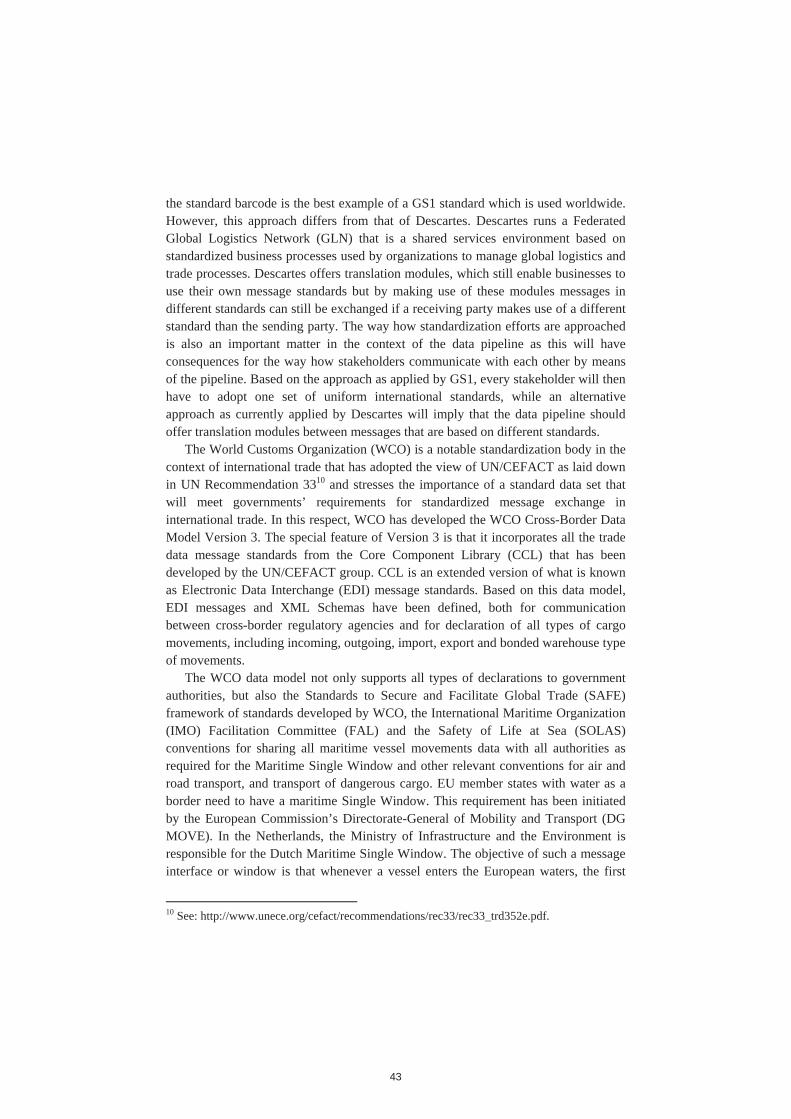
the standard barcode is the best example of a GS1 standard which is used worldwide. However, this approach differs from that of Descartes. Descartes runs a Federated Global Logistics Network (GLN) that is a shared services environment based on standardized business processes used by organizations to manage global logistics and trade processes. Descartes offers translation modules, which still enable businesses to use their own message standards but by making use of these modules messages in different standards can still be exchanged if a receiving party makes use of a different standard than the sending party. The way how standardization efforts are approached is also an important matter in the context of the data pipeline as this will have consequences for the way how stakeholders communicate with each other by means of the pipeline. Based on the approach as applied by GS1, every stakeholder will then have to adopt one set of uniform international standards, while an alternative approach as currently applied by Descartes will imply that the data pipeline should offer translation modules between messages that are based on different standards.
The World Customs Organization (WCO) is a notable standardization body in the context of international trade that has adopted the view of UN/CEFACT as laid down in UN Recommendation 3310 and stresses the importance of a standard data set that will meet governments’ requirements for standardized message exchange in international trade. In this respect, WCO has developed the WCO Cross-Border Data Model Version 3. The special feature of Version 3 is that it incorporates all the trade data message standards from the Core Component Library (CCL) that has been developed by the UN/CEFACT group. CCL is an extended version of what is known as Electronic Data Interchange (EDI) message standards. Based on this data model, EDI messages and XML Schemas have been defined, both for communication between cross-border regulatory agencies and for declaration of all types of cargo movements, including incoming, outgoing, import, export and bonded warehouse type of movements.
The WCO data model not only supports all types of declarations to government authorities, but also the Standards to Secure and Facilitate Global Trade (SAFE) framework of standards developed by WCO, the International Maritime Organization (IMO) Facilitation Committee (FAL) and the Safety of Life at Sea (SOLAS) conventions for sharing all maritime vessel movements data with all authorities as required for the Maritime Single Window and other relevant conventions for air and road transport, and transport of dangerous cargo. EU member states with water as a border need to have a maritime Single Window. This requirement has been initiated by the European Commission’s Directorate-General of Mobility and Transport (DG MOVE). In the Netherlands, the Ministry of Infrastructure and the Environment is responsible for the Dutch Maritime Single Window. The objective of such a message interface or window is that whenever a vessel enters the European waters, the first
10 See: http://www.unece.org/cefact/recommendations/rec33/rec33_trd352e.pdf.
43

port of call of that vessel has to distribute all relevant information according to IMO/FAL recommendations regarding vessels to its authorities and other ports of call of that vessel. These IMO/FAL regulations relate to the vessel, the crew, waste management by the vessel, passengers and cargo.
PROTECT11, an EDI-based standard for dangerous goods declarations to port authorities is already part of this functionality. WCO states that the IMO/FAL functionality is supported by the WCO Data Model version 3. It is not yet clear if all procedural interfaces derived from this data model will also support this functionality and whether they can be applied differently for other stakeholders than Customs. The data about the vessels come from the European Maritime Safety Agency (EMSA), while the data concerning cargo comes from National Customs offices of country of the port of call. These data are brought together in the Maritime Single Window. For EMSA it is relevant which substances are on board of a ship, especially in case of an accident. Ultimately, data that is required by national governments according to EU legislation should be brought together within an EU-wide Maritime Single Window but that is a goal for the near future.
Besides the standardization bodies national governments themselves have launched programs for standardization of B2G and G2B message exchange. More specifically, the Dutch government has launched such a program called the Standard Business Reporting (SBR) program, which is discussed hereafter. The deployment of a global Service-Oriented Architecture (SOA) provides a solution to enable electronic data provisioning at the Consignment Completion Point (CCP) for international trade. An illustrative example of a related SOA-based approach to organize data integration in the context of agri-food can be found in [11]. SOA is a software architecture where functionality is grouped around business processes and packaged as interoperable Web services. (Web) services are loosely coupled with operating systems, programming languages and other technologies which open up Web services. The services are in fact functions that are distinctly separated and that are made accessible over an IT network to be combined and reused in the production of business applications [12, 13]. SOA enables the definition of components with standardized interfaces, a central repository of published web services and standardized procedures for selection and implementation of components. Thus, SOA-based information systems decouple the process, application services, data sharing and technical infrastructure [11].
The communication between Web services is realized by passing data from one service to another, or by coordinating an activity between two or more services. Service providers publish Web services in a service directory, service requestors search in this directory to find suitable services, bind to that service and then use it [13]. In other words, SOA provides the technology that enables real-time provisioning
11 See: http://www.smdg.org/jsp/protect.jsp.
44

of data at the CCP. SOA is widely acknowledged as the de facto standard for data integration. SOA is chosen as the backbone technology of the pipeline’s technical architecture. Such a technical architecture based on SOA consists of three layers [13]: Firstly, a business process management layer is included, to coordinate the execution of business services. Secondly, a business services layer is included, to deliver information services to the business processes. An example of an information service is a service that delivers relevant data from an entry summary declaration for customs to decide about clearance of the container, which is required by customs as they can only decide about container clearance after the reception of this data. Thirdly, a business application layer is needed, to execute the application logic and data storage.
A key for realizing a global SOA for electronic data provisioning at the CCP is a standardized, uniform means to describe, offer and discover data that are used for interaction [14]. This means that data sharing standards are a prerequisite. One of the most widely used set of standards that is tailored for data sharing in international supply chains is offered by GS1 and is called EPC Global12. The definition of EPC Global standards is still an on-going process. What is available are specifications for Radio-Frequency Identification (RFID) tags and readers, standards for storing and sharing Electronic Products Codes (EPC) event data in EPC information services (EPCIS) repositories and an EPCIS discovery service to search EPC related data across the EPC network [14]. The EPC Global standards are open, vendor-neutral, standards ensuring that the SOA based on EPC Global standards will work anywhere in the world on heterogeneous hardware and software platforms. The openness of standards means that the formation of the standard is not dominated by one single organization, but that there is a standardization community that is open to all organizations that have an interest in using the standards.
Very closely related to the EPC Global standards for electronic data provisioning in international supply chains is the Dutch SBR program that aims to reduce the administrative burden for private organizations and the regulatory burden for public organizations [15]. These burdens are caused by the introduction of stricter laws and regulations that require private organizations to provide more timely and accurately business information to various public authorities. The SBR program is based on the Extensible Business Reporting Language (XBRL). XBRL is an eXtensible Markup Language (XML)-based language for formatting business information in such a way that it can be read across different software applications. The fundamental idea of XBRL is to segregate reporting data from meta data. The differences between data and meta data can be exemplified as follows. An entry summary declaration can be viewed as a report containing data for specification of a container which is used by customs to determine whether or not a container can be cleared. The meta data are data that prescribe exactly what data an entry summary declaration should contain.
12 See: http://www.epcglobalinc.org.
45

The meta data are the requirements for the generation of valid entry summary declarations and based on that kind of data the meaning of an entry summary declaration can also be derived. These meta data are used to provide the semantics to reporting data in a standardized way. As an open standard, XBRL is governed by a not-for-profit consortium made up of representatives from more than 170 companies and organizations around the world, including the major accounting firms, software vendors, information brokers, regulators and accounting standards-setters [15].
7 Conclusions
A reliable and secure global supply network can only be achieved by tight cooperation between businesses and government and by making investments that pay off for public as well as private parties involved in international trade. Businesses themselves already invest in three ways to realize the goal of achieving reliable and secure international trade supply chains. These are the achievement of the Authorized Economic Operator (AEO) status to prove that a business is compliant and trustworthy, the optimization of logistics and terminal operations by means of synchro-modality and the realization of sustainable supply chains by means of visibility and traceability. Synchro-modality concerns the switching between different forms of transport. The identification of what is happening and went wrong in the supply chain in case of problems is enabled by real time data visibility and technology driven traceability.
Next to these investments from private parties, public authorities such as Customs want to facilitate the market by stipulating that the seller/consignor and the packing list play a key role in minimizing risks such as safety, security, legal compliance and commercial risks. Therefore, it is of high relevance to include a Consignment Completion Point (CCP) as an additional waypoint to the supply chain. This waypoint is located at the point of container packing or consignment completion and a full set of accurate data should be provided at this waypoint to be verified between the seller/consignor and the buyer/consignee. If the full amount of data relating to the goods and the buyer and seller required by Customs and other regulatory agencies for an export declaration is provided electronically at the CCP, then this complete and accurate data can not only bring the seller and buyer together without being dependent of intermediary logistic service providers but the data can also be used for advanced risk profiling. A Web-based IT infrastructure that enables the seamless integration of all data elements from all the different sources in the supply chain at the CCP has been dubbed as an integrated data pipeline.
Analysing the stakeholders that are concerned with this pipeline has revealed three key issues. Firstly, as the data pipeline would provide data visibility to all involved parties, this has to be addressed in order to obtain commitment from freight
46

forwarders for the data pipeline, which is a typical example of a market-driven stakeholder issue. Secondly, the data pipeline has the potential for synchro-modal logistics but the issue is which party will provide this service. Thirdly, an issue is whether governments are willing to secure the funding of national data exchange infrastructures, or whether they require them to become financially more self-supporting with new commercial services. These issues should be taken into account when an integrated data pipeline is realized for creating data visibility to all involved parties and for achieving reliable and secure international trade supply chains.
Acknowledgements
This work was supported by the ESW project (acronym for Extended Single Window: Information gateway to Europe). ESW is funded by the Dutch Institute for Advanced Logistics (DINALOG) under grant number 2010 1 015R. The authors would like to express their gratitude to Mr. Peter Verbaas from Frugi Venta and Mr. Pieter Verbakel from Dutch Customs for their cooperation in this research.
References
1. Perona, M. and G. Miragliotta, Complexity management and supply chain performance assessment. A field study and a conceptual framework. International Journal of Production Economics, 2004. 90(1): p. 103-115.
2. Tan, Y.-H., et al., Accelerating Global Supply Chains with IT-Innovation: ITAIDE Tools and Methods. 2011, Berlin Heidelberg: Springer.
3. Hesketh, D., Weaknesses in the supply chain: who packed the box? World Customs Journal, 2010. 4(2): p. 3-20.
4. Hesketh, D., Seamless electronic data and logistics pipelines shift focus from import declarations to start of commercial transaction. World Customs Journal, 2009. 3(1):p. 27-32.
5. Brodie, M.L., Data quality in information systems. Information & Management, 1980. 3(6): p. 245-258.
6. Beverland, M.B., M.T. Ewing, and M. Jekanyika Matanda, Driving-market or market-driven? A case study analysis of the new product development practices of Chinese business-to-business firms. Industrial Marketing Management, 2006. 35(3):p. 383-393.
7. de la Mothe, J., The institutional governance of technology, society, and innovation.Technology in Society. 26(2-3): p. 523-536.
8. Baalen, P.v., R. Zuidwijk, and J.v. Nunen, Port Inter-Organizational Information Systems: Capabilities to Service Global Supply Chains. Foundations and Trends® in Technology, Information and Operations Management, 2008. 2(2-3): p. 81-241.
9. Chow, H.K.H., K.L. Choy, and W.B. Lee, A strategic knowledge-based planning system for freight forwarding industry. Expert Systems with Applications, 2007. 33(4): p. 936-954.
47

10. Toh, K.T.K., P. Nagel, and R. Oakden, A business and ICT architecture for a logistics city. International Journal of Production Economics, 2009. 122(1): p. 216-228.
11. Wolfert, J., et al., Organizing information integration in agri-food--A method based on a service-oriented architecture and living lab approach. Computers and Electronics in Agriculture, 2010. 70(2): p. 389-405.
12. Bell, M., Service-Oriented Modeling (SOA): Service Analysis, Design and Architecture. 2008, Hoboken, NJ, USA: Wiley and Sons.
13. Erl, T., Service-Oriented Architecture: Concepts, Technology, and Design. 2005, Boston, MA, USA: Prentice Hall PTR.
14. Baida, Z., et al., Information Technology (IT), in Accelerating Global Supply Chains with IT-Innovation, Y.-H. Tan, et al., Editors. 2011, Springer Berlin Heidelberg. p. 157-173.
15. Bharosa, N., et al., Principles for transforming to Standard Business Reporting: Lessons learned from the Netherlands, in Proceedings of the 12th Annual Conference on Digital Government Research. In press, ACM Press: College Park, MD, USA.
48

e-Customs Study: Private Sector Views on Potential Benefits of Further Electronic Customs Developments in
Switzerland
Mikael Granqvist1, Juha Hintsa1 and Toni Männistö1
1 Cross-border Research Association, Ave d´Echallens 74, CH-1004 Lausanne, Switzerland
Abstract. This research paper explores the current state of play regarding cross-border trade and logistics operations in Switzerland, aiming to identify opportunities to reduce costs and to improve efficiencies in cross-border supply chains, covering procedures, tools and services associated with import, export and transit procedures. The study present the following conclusions and recommendations: Interactive and user friendly e-Customs services which facilitate the preparation, filing, tracking and storage of customs declarations, amongst other functions, can help to reduce costs and improve efficiencies in cross-border supply chains. Design and implementation of e-Customs services need to be driven by tangible benefits for the private sector, including facilitating export procedures, improving flexibility when working with customs, reducing the need to re-enter any customs data during the declaration processes, and enabling a seamless flow of data between the parties involved.
Keywords: e-Customs, customs compliance, SECO
1 Study Background, Process and Population
The Federal Council had mandated the State Secretariat for Economic Affairs (SECO) to prepare a feasibility study in cooperation with the Federal Customs Administration and other Federal Offices on a direct interaction between the Swiss and EU customs systems. The feasibility study is part of the e-government package as laid down in the Federal Council growth policy 2008-2011. This research project, as part of the overall feasibility study, started in the beginning of May 2010. The first results were delivered at the end of July 2010, and full results in November 2010.
The objective was on one hand to study the cost implications of direct electronic data exchange between Swiss enterprises, in particular small and medium enterprises (SMEs), and the Swiss customs administration and on the other hand to look at the costs and benefits for companies from possible future simplifications by connecting the Swiss and EU customs clearance systems. This in particular concerns the harmonization of some simplified procedures as well as the mutual recognition of the principles governing the AEO-F (Authorized Economic Operator, customs & security) scheme of the EU.
49

The scope of this study also includes assessing whether Swiss companies will benefit in terms of reduced costs and other potential benefits from a fully fledged interactive web-based application (solution in compliance with e-government principles) as a way of carrying out customs procedures.
For the purpose of this paper, following two broad definitions (from the literature) are used:
e-Customs = The use of Information Technology to carry out customs compliance using electronic communications channels replacing paper format customs procedures, thus creating a more efficient and modern customs environment.
e-government = The use of Information Technology to enhance the access to and delivery of government services to benefit citizens, business partners and employees.
1.1 Review on e-Customs Development Initiatives on the Global Scale
The traditional role of Customs as a “gatekeeper” is changing due to developments in the international supply chain environment, including: the growth of international trade, reduced tariff and non-tariff barriers, crime and terrorism threats, new models of logistics and the supply chain, and the increasing use of information and communication technology (ICT) in international trade operations. These developments are putting pressure on customs administrations to update their operational models, according to Gordhan (2007) [1] and Widdowson (2007) [2]. The use of information and communication technology enables processes to be more automated, which increases efficiencies and reduces the need for manual re-entries and validation of the same data [3]. Due to the elimination of redundant tasks, the public sector can take advantage of the automation by delivering faster services to companies and can also achieve time related and financial savings, according to Raus et al (2009) [4]. Hesketh (2009) [5] suggests that “electronic pipelines” would simplify customs procedures and facilitate all parties in the supply chain to acquire the information needed. However, Raus et al (2009) [4] point out that there are barriers preventing companies from adapting ICT systems: (1) Costs — small and medium-sized companies may not have the required financial resources to acquire and implement new computer hardware and software; (2) Governmental agencies do often not provide a template specifying which new regulations apply; (3) High complexity in standardization of processes and procedures, especially SMEs, may not possess the required means for keeping multiple standards/systems; and, (4) The fear and resistance among employees to adapt new work procedures.
On global level, the World Customs Organization (WCO) designed the SAFE Framework of standards to secure and facilitate trade and logistics, as it comes to interaction (including possible disruptions) between trade and customs in the 177 WCO member countries. The SAFE Framework consists of four core elements. First, it harmonizes the advance electronic cargo information requirements on inbound, outbound and transit shipments. Second, each country that joins the SAFE Framework commits to employing a consistent risk management approach to address security threats. Third, it requires that at the reasonable request of the receiving nation, based upon a comparable risk targeting methodology, the sending nation's Customs
50

administration will perform an outbound inspection of high-risk containers and cargo, preferably using non-intrusive detection such as large-scale X-ray machines and radiation detectors. Fourth, the SAFE Framework defines benefits that Customs will provide to businesses that meet minimal supply chain security standards and best practices [6]. However, Switzerland is not yet a signatory to the SAFE framework.
On European level, the European Commission has adopted two proposals (in 2005) to modernize the EU Customs Code and to introduce an electronic, paper-free customs environment in the EU. The first proposal aims to simplify and streamline customs processes and procedures. The second proposal is designed to make Member States' electronic customs systems compatible with each other; introduce EU-wide electronic risk analysis and improve information exchange between frontier control authorities; make electronic declarations the rule; and introduce a centralized customs clearance arrangement . The result should be to increase the competitiveness of companies doing business in Europe, reduce compliance costs and improve EU security [7].
Denmark, Germany, and Portugal are examples of European countries that have a Web interface in place to facilitate cross-border trade, according to the CBRA survey (2010) and Bjorn-Andersen et al (2007) [8]. The Web-interface functions both as a way of carrying out customs declarations and as a hub for companies to acquire information, documents, and other related information. Germany has taken this one step further and does not accept paper declarations anymore, which means that companies are forced to use an electronic means of submitting customs declarations, with the Web interface being one option, while Portugal and Denmark still accept both paper and electronic documents (CBRA survey, 2010). The Italian customs administration allows for customs brokers to exchange information with Customs via the IT system “AIDA”. The implementation process of AIDA is an example of barriers that can arise. Difficulties mentioned are the inability to gather all the necessary customs information in one place and to integrate the different IT systems. IT system integration is troublesome, resulting in multiple controls over the same data by different parties along the trade process (CBRA survey, 2010). Overall, a successfully implemented Web interface can save time and money for businesses operators.
1.2 Target Sectors
For the purpose of this study there are four main (potentially overlapping) sectors to be analyzed: (1) companies using electronic certificates such as veterinary, phytosanitary or CITES related where a web-based electronic data exchange with authorities in trans-border commerce is already operational; (2) companies specializing in investment goods such as machinery production; (3) trading companies (import/export); and (4) companies with existing customs simplifications. There are a total of 312'861 companies in Switzerland today; only about 1’000 (0.3%) of these are “non-SMEs”, i.e. companies that have more than 250 employees. The remaining 99.7% of the companies are regarded as Small or Medium Enterprises (SMEs) employing less than 250 persons each.
51

1.3 Cross-Border Trade in Switzerland
In general, import from the EU to Switzerland can be done in two ways. The first method requires lodging an export declaration (ECS) at the customs office of export in the EU and then preparing and submitting an import declaration at the customs office on the Swiss side of the border. The import declaration can be prepared at the border office or in advance and then submitted to Swiss Customs together with other supporting documents. After customs clearance, including payment of relevant duties and taxes, the goods are released for free circulation in the Swiss market. The second method is to first prepare a transit declaration in the country of export, transport the goods across the border to the final destination in Switzerland without having to go through import clearance at the border, and then submit the import declaration for release into free circulation, paying duties and taxes as applicable. Instead of release for free circulation, the transit procedure can be followed by a warehouse procedure, where goods can be stored until they are being supplied to their final destination.
Exporting from Switzerland to the EU can be done in two ways. The first method assumes the issuance of an export declaration in Switzerland and an import declaration in one of the EU countries. After export customs clearance and payment of relevant export charges, the goods can be delivered to the EU. Depending on the INCOTERMS , and assuming that import customs clearance is the responsibility of the EU consignee, the interaction of Swiss companies with customs ends after the goods are cleared for export. The second method also applies the transit procedure. In this case, the goods are cleared for export in the same way as described above; then they are accompanied by a transit declaration until they arrive at their destination in the EU. At the destination, the goods can undergo the customs procedure of release into free circulation or any other customs procedure, including warehousing.
1.4 Methodology and Survey Questionnaire
In this study, the main instruments for data collection are a survey questionnaire combined with personal interviews. The data collection is carried out in two stages, a first round of survey distribution and on-site interviews. The second round consists of follow-up interviews to validate and clarify results from the survey. The methodology for this study is described in the following six steps:
1. Setting up the context for the study; defining the purpose and boundaries, describing the current cross-border trade procedures used by Swiss companies.
2. Surveying companies in Switzerland; defining the study population and sample size, creating and distributing the questionnaire form. Analyzing basic information about the survey respondents.
3. Analyzing the closed survey questions; involvement of Swiss companies in customs activities, customs compliance costs, priorities of future investments and anticipated benefits from future e-Customs upgrades.
52

4. Analyzing the open survey questions and live interviews; qualitative analysis of potential benefits with direct customs interaction / web-application, and possible simplifications / benefits if Swiss and EU customs were to interact in the future.
5. Interviewing a sub-group of the companies to validate and clarify results from the original survey.
6. Analyzing, combining, structuring all the study data towards final conclusions and recommendations regarding cost implications and potential benefits of future e-Customs development.
The survey questionnaire was designed using both open and closed questions, where the closed questions are used to gather quantifiable data while the open questions are used to gather additional qualitative information. The questions were derived from literature research and consultation with several experts in customs matters. The survey questionnaire had a total of 31 questions.
Before distribution, the questionnaire was thoroughly reviewed by SECO, and a group of CBRA advisors (top specialists in customs matters). As Switzerland is a multi-lingual country, the questionnaire was translated into four languages: English, German, French, and Italian. Companies targeted with letter mail received the survey in their respective language to yield a higher response rate. Companies receiving the survey via e-mail were given the option to download the survey in a native language via the Cross-border Research Association website (www.cross-border.org). Companies were able to reply in several ways, including e-mail, fax, and letter mail.
1.5 General Information about Study Participants
Survey data was collected from 70 companies during summer and fall 2010. The survey form was sent out via multiple channels, including Economiesuisse, Swiss Shippers Council and Schweizerischer Gewerbeverband associations – in total to over 1000 companies. The main population for the survey was Swiss-based manufacturing and trade/retail/wholesale companies with import or export and/or transit operations. Over 80% of the survey respondents were involved with import and/or export procedures, while less than 20% were using transit procedures. The survey participants can be considered as active players in international trade: over 60% of purchase value was imported to Switzerland, and over 75% of the sales value was exported outside Switzerland. Around 75% of the study participants were small and medium sized enterprises (SMEs).
The spread in terms of number of customs declarations was broad. For example, for imports, the minimum number of declarations annually per company was 11 and the maximum was 100000. The EU was clearly the most important trading partner for the survey respondents. For imports, over 90% originated in the EU, and for exports, over 70% were destined for the EU. The most commonly used customs district was Schaffhausen, followed by Basel, Geneva and Lugano. The main mode of transport used by the respondents was road, followed by air, rail, and inland waterway.
53
2 Main Findings with the Study
The survey respondents prepare, file, and store their customs declarations in a variety of ways. Around one-quarter of the companies use some sort of in-house or Enterprise Resource Planning (ERP) system with automated processes for these tasks. Rented or leased software is in use by about 15% of the companies, particularly for transit and export procedures. The e-dec1 (gateway) application is used by over three-quarters of the companies for export declarations. Paper-based forms are still used by about 25% of the companies, and about 5% of the survey participants file declarations by other means, i.e., by fax, telephone or verbally. Storage of files is done still very much paper-based, especially for imports, where virtually all the companies maintain paper-based records. With export files, digital storage is much more common. Third-party services - freight forwarder, customs broker, or similar - for the preparation and submission of declaration data to customs was exploited by about one-half of the participating companies, especially for the import procedures.
Around half of the companies have no knowledge on overall customs compliance costs, while the other half either claims to be able to make ”educated guesses” or to have the real cost data per annum or per declaration. The average cost per declaration was calculated to be 56 CHF, varying between the minimum of 3 CHF and maximum of 190 CHF per declaration. Out of the four typical compliance cost components, internal human resources is the major one, followed by external IT systems. Regarding budgets for the years 2010-2011, internal IT systems were considered as the highest area of investment, while new investments in external customs compliance services were considered as the lowest priority. An additional aspect of the compliance costs and usage of third-party service providers: for export procedures, the cost per declaration is about 30% higher for companies who use external services than for companies who do not use such services. For import procedures, no such difference exists. This difference of approximately 30% export procedures may have many reasons behind it: besides high third-party service premiums, it is possible that companies who do not use external services do not take into consideration all of the internal costs while ensuring customs compliance with their export shipments – this remains a topic for future research.
Regarding the potential benefits of possible future upgrades in trade–customs interactions, and e-Customs and e-government services in Switzerland, the following six aspects were ranked on the top: facilitating export procedures; improving flexibility when working with customs; reducing the need to re-enter any customs data during the declaration processes; enabling seamless flow of data between the parties involved, and allowing the re-use of data; the increasing predictability of the customs clearance process and flow of goods; and reducing other administrative costs. On the bottom of the scale, the three lowest priority aspects were: facilitating transit
1 E-dec is an electronic declaration procedure for import, transit and export goods introduced in
Switzerland. The e-dec streamlines declaration procedures and customs’ cargo processing.
54

procedures; coordinating the approach to the control of goods and the application of legislation; and protecting sensitive trade data.
3 Findings Specific for Small and Medium Enterprises (SMEs)
Looking at the preparation and filing of customs declarations, SMEs use information systems (in-house or ERP) to a lesser extent than large enterprises. Depending on the type of information system and on the customs procedure in question, between 0% and 18% of SMEs exploit the data and/or functionalities of these systems, while the rest have to rely on less automated approaches. Other types of automation, including e-dec and NCTS (‘New Computerized Transit System’) are also less common amongst SMEs compared to their bigger counterparts. On the contrary, storage media of the past declarations, digital versus paper, and reliance on 3rd-party services, mainly customs brokers and rented software, are on a similar level as with the large enterprises. Analyzing the awareness of customs compliance costs, SMEs are less knowledgeable of such costs, either per declaration or per annum, compared to the large enterprises. The difference is biggest with costs on import processes, where over half of SMEs do not know the costs, compared to one third of large enterprises.
Concerning the cost value per declaration, SMEs have an average cost of 62 CHF, while large enterprises have an average cost of 37 CHF per declaration, confirming a typical ”economies of scale” applicability with the world of customs compliance. Regarding customs compliance development budgets for 2010-2011, SMEs plan to have internal IT systems as the main investment target, while larger companies count on investing more in external IT solutions/services.
4 Main Issues with Today’s Situation on Trade-Customs Interaction
When asking the private sector about issues with customs administrations anywhere in the world, there is normally no lack of problems raised, because the “dual role” of customs in controlling and facilitating trade is challenging by nature and always open to complaints. A limited set of core issues with the survey participants is presented in the following, while aiming to be as specific as possible in the criticism expressed.
First, problems with long cross-border lead-times were pinpointed by at least 15 companies in the open questions section of the survey questionnaire. The comments varied from the generic (e.g., “lead times need to be reduced”) to specific concerns about competitiveness, especially with competitors in the EU, customer service levels, etc. One company shared the following example of “too long lead times” for the European transports: “Transport from Switzerland to Stuttgart (Germany) takes 3 days, where customs requires 1 day; while transport to Asia takes 4 days”. Second, several companies raised their concerns about the overall costs for customs compliance. In the open questions of the survey, at least 12 companies highlighted the
55

relevance of cost reduction in relation to any type of future e-Customs enhancements. Third, criticism on the e-dec gateway solution was expressed by a couple of respondents, complaining about inflexibility, error-rates, and costs related to updates. As one respondent explained, “We have lots of problems between communications with systems ...e-dec has data, which customs cannot see.” Another claimed that “until now, no benefits (of e-Customs) are known to us. To the contrary, we find e-dec being complicated and prone to computer errors...”
Last but not least, over 60% of the companies replying to the survey were former beneficiaries of the Vereinfachte Ausfuhrregelung (VAR) simplification, which ended on 31.3.2010. About 70% of the former VAR beneficiaries experienced higher compliance costs since VAR ended, mainly due to investments in new software and some hardware. Six companies shared detailed cost numbers, which varied from a minimum cost of 3’400 CHF (for an SME) to a maximum cost of 128’000 CHF (for a large enterprise).
5 Conclusions and Recommendations
Switzerland’s largest trading partner is by far the EU, as Switzerland is not a EU member Swiss enterprises are submitted to much more complicated rules and regulations when importing/exporting to the EU compared to “EU-member” competitors. Hence one of the major problems for Swiss enterprises when trading with EU is the complicated procedures. Also EU cannot be treated as one country, and each member state have their own tax-codes. In that light, competitors located within the EU territory have a cost advantage for EU trade compared to Swiss companies, through the free movement of goods mechanism.
From the private sector perspective, well designed and implemented e-Customs services can provide a means to drive down customs compliance costs and to make the overall cross-border operations more efficient and smooth. However, attention has to be paid to many details during the design and implementation phases of an e-Customs initiative (or a set of initiatives) – as no silver bullets exist.
5.1 Scope and Priorities for e-Customs Services
An e-Customs platform can consist of many different services in terms of content and functionalities, with the overall goal of making cross-border compliance management faster and cheaper for the private sector. Typical e-Customs elements identified by the study participants include the following:
Preparation of customs declarations Filing of customs declarations Tracking of status of filed customs declarations Storage of customs declarations
56

Filing and storage of any other documents from the private sector to custom, including monthly reports with specific commodities Storage and sharing of any cross-border trade and logistics related forms, including non-customs forms
In addition, functionalities enabling printing of import/export/transit documents (assuming paper prints are still needed); extracting import/export/transit statistics; and back-up service for the declaration data, were seen as potential components of future e-Customs solutions in Switzerland. Looking at e-Customs examples from other countries, one could also consider adding elements such as: interactive tariff classification system, official exchange rates, and binding rulings, amongst other possible elements.
5.2 Improving Customs Administration Service Levels towards the Private Sector
Several respondents would appreciate being informed as early as possible about upcoming changes and updates, were they connected with procedures, data requirements or any other regulatory matters. This way the companies could avoid the ´last minute hassle´ when upgrading their own processes and/or systems, training their personnel, etc. An e-Customs platform could be used as a proactive information delivery channel to support this request. Being able to ´do business with customs´ on a continuous basis, i.e., not being tied to office hours, was seen as an important objective by a couple of respondents. Understanding that many aspects do require the participation of officers in duty, an e-Customs platform could create a sort of ´virtual 24/7 customs office´ for the benefit of the private sector operators wanting to operate during night and/or weekend hours. A wish of being able to deal with ´key account managers´, or customs officers with detailed knowledge of specific commodities/supply chains, was presented by at least one respondent. This way companies could avoid the process of ´having to teach customs´ on the specifics of their business, over and over again. An e-Customs platform could facilitate this process by supporting efficient interaction between specific companies and dedicated customs officers, even on a country-wide basis. Fourth, somewhat related to the previous three items, some private sector actors would appreciate receiving more training from customs on current and future aspects of cross-border compliance management. Such training could be facilitated by an e-Customs platform, assuming adequate resources would be made available for achieving this objective. The ´private sector wish list´ of total of nine elements to enhance trade-customs interaction in the future is visualized in the Figure below.
57

Fig. 1.
5.3 Prot
As indicafor the pmaking thHoweverattention is to arracargo intagents ancovering workshopcustoms cbe a tangia next lev
Regardworld, it lessons lethis is proAcademic
5.4 Fina
Well desielectronicexport d
. Private secto
totyping and
ated above, anrivate sector he cross-bordr, as e-Customshould be pai
ange for a scoterest, and a nd brokers. C
multiple comp(s) should bcompliance, pible roadmap vel of cost-bending benchmais recommendearned on a vovided by thec Research an
al Notes
igned and impc managemen
declaration da
or wish list on
Benchmarki
n interactive ein Switzerlan
der processes ams projects aid in the desigoping workshosecond one f
Companies ofmmodities ane facilitated
preferably twofor the develo
nefit analysis aarking with eded to spend variety of e-Ce World Custond Developme
plemented e-Cnt of all custoata automatic
customs-trad
ing Exercises
e-Customs pland by lowerinand even phyare likely to
gn and prioritiop on two sepfor logistics sf various sizend transport mby top expero separate peropment of e-Cattached to it.
e-Customs sersome resourc
Customs aspecoms Organizaent (PICARD)
Customs servioms-related dcally as well
de interaction e
for an e-Cus
atform can prng customs cosical flows fa
be expensivzation phasesparate days: oervice provid
es, from micrmodes, shoulrts in e-goverrsons. And the
Customs servic
rvices in the Eces to learn abcts elsewhere.ation (WCO) P) program
ices can pave data. The ultiml as import
enhancements
stoms Platfor
rovide tangiblompliance cosster and more
ve investment. One way of
one for compaders, includingro to large end be represenrnment service main outcomces in Switzer
EU and the rbout good pra. A practical Partnership in
the way towamate goal is (and possibl
s.
rm
le benefits sts and by e efficient. ts, careful doing this anies with g customs nterprises,
ented. The ces and in me should rland, with
rest of the actices and forum for
n Customs
ards 100% to exploit le transit)
58

declaration data between two or more countries. However, many policy-related, legislative, operational and technical challenges must be overcome – e-Customs services cannot enable such changes of paradigm on their own. If and when decisions are made to move on to develop the next generation of e-Customs services in Switzerland, one should ensure the availability of adequate financial and human expert resources without taking out resources from the current developments. The outcomes should be fully voluntary for any Switzerland-based private sector actor to use (or not to use). The development process should be done in a highly collaborative and transparent manner with all relevant governmental and private sector parties involved. And finally, any aspects supporting further cross-border trade and logistics harmonization, integration and automation between Switzerland and the EU should be taken into serious consideration.
Acknowledgments. CBRA expresses its´ gratitudes to all the companies who participated in the study; to Swiss Shippers Council, Economiesuisse, SGV and all other Swiss associations and institutes who helped to circulate the survey form; to CBRA supervisors Dr. Hameri, Dr. Grainger, Dr. Traill, Dr. Finger and Mr. Jost, who helped to shape the study during the critical phases; to Mr. Holloway, who carried out the final review of the report; to all external experts who shared their views on the global situation regarding e-Customs; and last but not least, to the SECO-team, who was always available for reviews and constructive feedback, throughout the whole study process.
References
1. Gordhan, P.: Customs in the 21st Century”, World Customs Journal, vol 1, no.1 (2007) 2. Widdowson, D.: The changing role of customs: evolution or revolution?, World Customs
Journal, vol 1, no 1. (2007) 3. Wilmott, P.: A review of the European Commission’s plans for an electronic customs
environment, World Customs Journal, vol 1, no.1 (2007) 4. Raus, M. Flügge, B. Boutellier, R.: Electronic customs innovation: An improvement of
governmental infrastructures, Government Information Quarterly 26, pp. 246-256 (2009) 5. Hesketh, D.: Seamless electronic data and logistics pipelines shift focus from import
declarations to start of commercial transaction, World Customs Journal, vol 3, no 1. (2009)
6. World Customs Organization: Framework of standards to secure and facilitate global trade, SAFE Brussels. (2007) Retrieved July 5, 2010 from: http://www.wcoomd.org/files/1.%20Public%20files/PDFandDocuments/SAFE.
7. European Commission: Electronic customs multi-annual strategic plan, 2008 yearly revision (MASP Rev. 9) (2008), Retrieved July 15, 2010. From: http://ec.europa.eu/taxation_customs/resources/documents/customs/policy_issues/e-customs_initiative/masp_strategic_plan_en.pdf.
8. Bjorn-Andersen, N., Razmerita L., Zinner Henriksen H.: The streamlining of cross-border taxation using IT: The Danis eExport Solution, ITAIDE consortium (Information Technology for Adoption and Intelligent Design for E-Government), Project no. 027829 (2007)
59

Reverse Logistics of Recovery and Recycling of Non-Returnable Beverage Containers in the Brewery
Industry: A “Profitable Visit” Algorithm
Mario Monsreal1,2,3
1 AutoID LAB, Zaragoza Logistics Center, Zaragoza, Spain.
2 Center of High Management in Engineering and Technology, Anáhuac University Mexico, México City, México.
3 Latin-American Center of Logistics Innovation-México, México City, Mérida, México.
Abstract. Reverse logistics is one of industries´ activities that is still little known and developed. This paper analyses the necessities of collecting non-returnable packaging at the point of sale, as well as their processing and sale to recycling companies, while considering marketing and operational variables for the reverse scheme. The objective is to increase the quality of recycling material by avoiding contamination and therefore, raising the quantity of recycled material used in the production of new packages. The pilot project analyses the operation of a brewery company in a medium-sized city in México. A collection system for non-returnable glass bottles and cans is designed by applying routing algorithms. Specifically a new “profitable algorithm” based on the well-known Nearest Neighbor is proposed and compared in order to achieve higher volume of collected material while lowering the cost of collection.
Keywords: Reverse Logistics, Non-Returnable Packages, Recycling, Routing algorithm
1 Introduction
Recycling of beverage packaging is a common activity in Western Europe, Japan, Canada and the United States. Usually, non-refillable beverage bottles and cans are returnable in order to be recycled. On the other side of the coin, in developing countries, there are still deficiencies in the development of organized packaging recycling systems.
This paper analyses the requirements of a reverse logistics network of non-returnable beverage packaging in Mexico’s Brewery Industry and presents the results of the economic analysis in the case of implementing the system in a particular city selected for the pilot study.
The interest of recycling non-returnable packaging is a voluntary company initiative, therefore a deposit system is not considered. The objective is to increase the quantity of recycled material used in the production of new packaging, while keeping recycling costs at their minimum. It allows resources to be saved and waste to be reduced.
60

2 Reverse Logistics Network
The concept of reverse logistics has been created to respond to the necessity of businesses to develop and/or restructure their material returns. There are different reasons that have motivated the development of this area such as strict environmental regulations, customer demand or economically driven opportunities to reuse products or recycling materials [1].
There are many definitions of reverse logistics in the literature [2]. However, the most suitable definition might consider the reverse logistics within the frame of the logistics in general. Rubio Lacoba (2003) [3] defines the reverse logistics as “the process of planning, developing, and efficiently controlling the flow of materials, products, and information from the place of origin to the place of consumption in such a way that while satisfying the consumer’s needs, the available remaining material is managed to be reintroduced into the supply chain, obtaining an added value and/or if not possible procuring a suitable disposal of this remaining material”. The concept of reverse logistics is taken as a reference to analyze the current situation in the management of non-returnable packaging and to propose an improved system.
2.1 Current Situation
Currently non-returnable packages are disposed of by consumers in the unsorted municipal waste. At the dumpsite, they are partially recovered by “waste pickers” and sold to recycling companies. Packaging producers buy recycled materials; however, given their low quality, as they have already been mixed with other substances, only a small proportion, around 20 percent of these materials can be used in the production of new packages [4]. Figure 1 describes the material flow in the current situation.
Beer PlantSuppliers Distribution Centers
Point of Sales
Dumpsite
Existing Material Flow
End of Flow
Existing Point
New Material
New Packages
NRPackages
Products
Damaged Packages
Recycled Material
Beverage Package Producer
Other Industries
Recycling Plants
Products
Products
Recycled Material
Damaged NR Products or Packages
High Volume NR Packages
Damaged Packages
Conventions
ConsumersIntermediate Collector
Picked NR Packages
Fig. 1. Current situation.
61

2.2 Proposed Network
In order to increase the quality of recycling material by avoiding contamination at the dumpsite and therefore, raising the quantity of recycled material used in the production of new packaging; it is necessary to collect the non-returnable packages separate from other waste. The proposed recovery and recycling network [5] (Figure 2) considers collecting the packages at the point of sale and transporting them to a recovery center to be conditioned before sending to recyclers.
Beer PlantSuppliers Distribution Centers
Recovery Center
Point of Sales
Dumpsite
Existing Material Flow
Proposed NR Packaging Flow
End of Flow
Non-existing Point, inherent to the design of the reverse network
Existing Point
New Material
New Packages
NR Packages to be Recycled
Products
Damaged Packages
Recycled Material
BeveragePackage Producer
Other Industries
Recycling Plants
Products
Products
Recycled Material
Damaged NR Products or Packages
NR Packages to be Recycled
Damaged Packages
Waste e.g. paper, metals
Conventions
Consumers
High Volume NR Packages
(Glass, Al)
Fig. 2. Proposed recovery and recycling network.
3 Pilot Study
3.1 Delimitation
The pilot project analyses a medium-sized city in México, which was selected as one of the cities in the Mexican Republic with the highest consumption of beverages in returnable containers. This city is placed in the fifth position of consumption by volume and in which the company has the largest market share. [6] The pilot project analyzes the recycling of non-returnable packaging in the brewery industry. In this case, non-returnable glass bottles and aluminum cans (see figure 3).
62

N R G l a s s B o t t l e s
A l u m i n u m C a n s
P E T
C i t ye . g . M e r i d a
R e - u s e R e c y c l i n g o f M a t e r i a l i n :
P r o d u c t i o n o t h e r p r o d u c t s
P r o d u c t i o n o f n e w p a c k a g e s
N a t i o n a lR e g i o n a lS t a t e
A n o t h e r c o m p a n i e s a n d / o r i n d u s t r i e s
B r e w e r y F E M S A
M u l t i - c o m p a n yF E M S A
G e o g r a -p h i c a l l y
P a c k a g e s M a t e r i a l
C o l l e c t i o n O b j e c t i v e
I n s t i t u t i o n
Fig. 3. Delimitation of the Pilot Project. Figure 4 represents the proportion of non-returnable packaging in the year of the study and figure 5 shows the growth projections until the year 2015.
S a l e s P r o p o r t i o n o f B e e r P a c k a g e s i n C C M M e r i d a i n Y e a r 2 0 0 5
R e tu r n a b le G la s s B o t t l e s
8 3 %
N o n - r e t u r n a b le G la s s B o t t le s
3 %
N o n - r e t u r n a b le A lu m in u m C a n s
1 4 %
Fig. 4. Proportion of beer packaging in year of the study.
63

Fig. 5. Growth projections in non-returnable packaging.
3.2 Collection and Routing
One of the determining factors in the reverse logistics network is to ensure a sufficient return volume that will guarantee a continuous flow of materials in the recovery and recycling network. The collection in a reverse logistics system has two basic objectives [1]:
1. The effective acquisition of products or materials from used material generators or clients, involves offering convenient service and consistent timing as well as considering the processes in which the products or materials will be transformed and incorporated to determine how materials should be handled during collection.
2. To operate the collection and transport in an efficient form from the cost perspective. The need for temporary storage of product accumulation after collection, transport volume, separation at the source, and the characteristics of special transport vehicles should be considered in order to facilitate this objective.
Figure 6 represents the principle aspects and some of the possible configurations of collection and transport in reverse logistics systems. The dotted line points out the configuration that was assumed for the first routing algorithm.
64
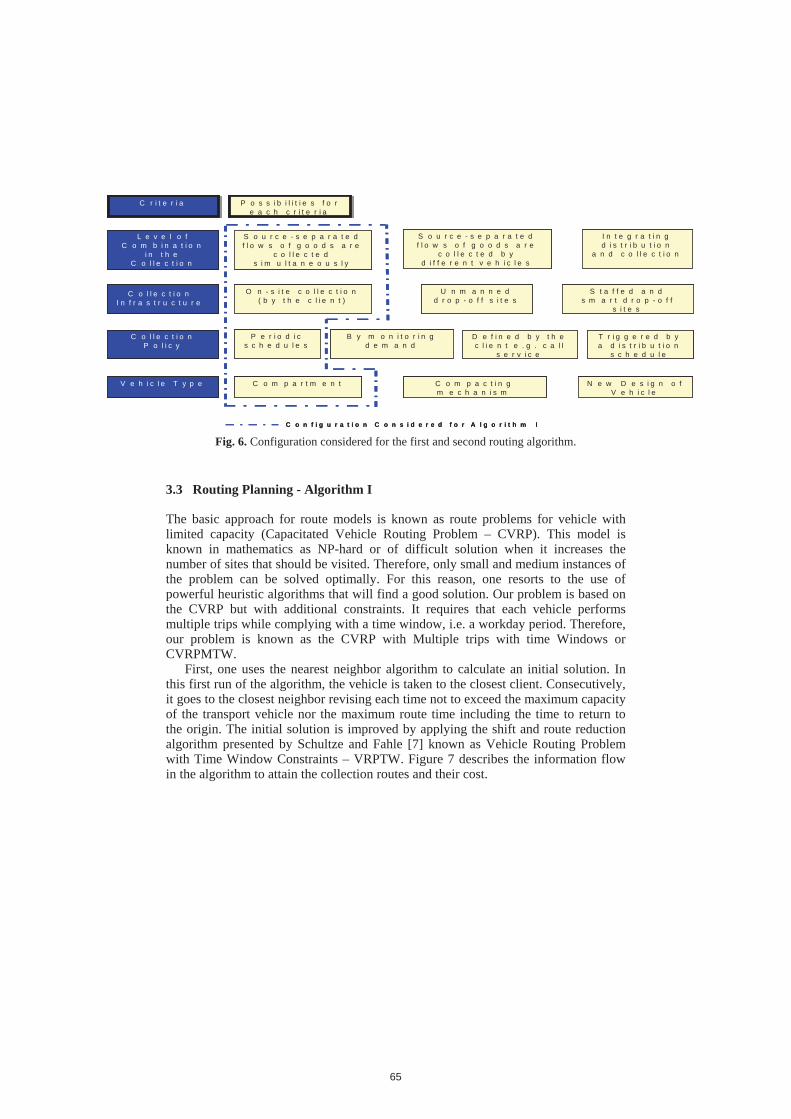
C o n f i g u r a t i o n C o n s i d e r e d f o r A l g o r i t h m I
L e v e l o f C o m b i n a t i o n
i n t h e C o l l e c t i o n
C o l l e c t i o n P o l i c y
P e r i o d i c s c h e d u l e s
B y m o n i t o r i n g d e m a n d
D e f i n e d b y t h e c l i e n t e . g . c a l l
s e r v i c e
V e h i c l e T y p e
T r i g g e r e d b y a d i s t r i b u t i o n
s c h e d u l e
C o m p a r t m e n t
S o u r c e - s e p a r a t e d f l o w s o f g o o d s a r e
c o l l e c t e d b y d i f f e r e n t v e h i c l e s
S o u r c e - s e p a r a t e d f l o w s o f g o o d s a r e
c o l l e c t e d s i m u l t a n e o u s l y
I n t e g r a t i n g d i s t r i b u t i o n
a n d c o l l e c t i o n
O n - s i t e c o l l e c t i o n ( b y t h e c l i e n t )
U n m a n n e d d r o p - o f f s i t e s
S t a f f e d a n d s m a r t d r o p - o f f
s i t e s
C o m p a c t i n g m e c h a n i s m
N e w D e s i g n o f V e h i c l e
C o l l e c t i o n I n f r a s t r u c t u r e
C r i t e r i aC r i t e r i a P o s s i b i l i t i e s f o r e a c h c r i t e r i a
P o s s i b i l i t i e s f o r e a c h c r i t e r i a
Fig. 6. Configuration considered for the first and second routing algorithm.
3.3 Routing Planning - Algorithm I
The basic approach for route models is known as route problems for vehicle with limited capacity (Capacitated Vehicle Routing Problem – CVRP). This model is known in mathematics as NP-hard or of difficult solution when it increases the number of sites that should be visited. Therefore, only small and medium instances of the problem can be solved optimally. For this reason, one resorts to the use of powerful heuristic algorithms that will find a good solution. Our problem is based on the CVRP but with additional constraints. It requires that each vehicle performs multiple trips while complying with a time window, i.e. a workday period. Therefore, our problem is known as the CVRP with Multiple trips with time Windows or CVRPMTW.
First, one uses the nearest neighbor algorithm to calculate an initial solution. In this first run of the algorithm, the vehicle is taken to the closest client. Consecutively, it goes to the closest neighbor revising each time not to exceed the maximum capacity of the transport vehicle nor the maximum route time including the time to return to the origin. The initial solution is improved by applying the shift and route reduction algorithm presented by Schultze and Fahle [7] known as Vehicle Routing Problem with Time Window Constraints – VRPTW. Figure 7 describes the information flow in the algorithm to attain the collection routes and their cost.
65
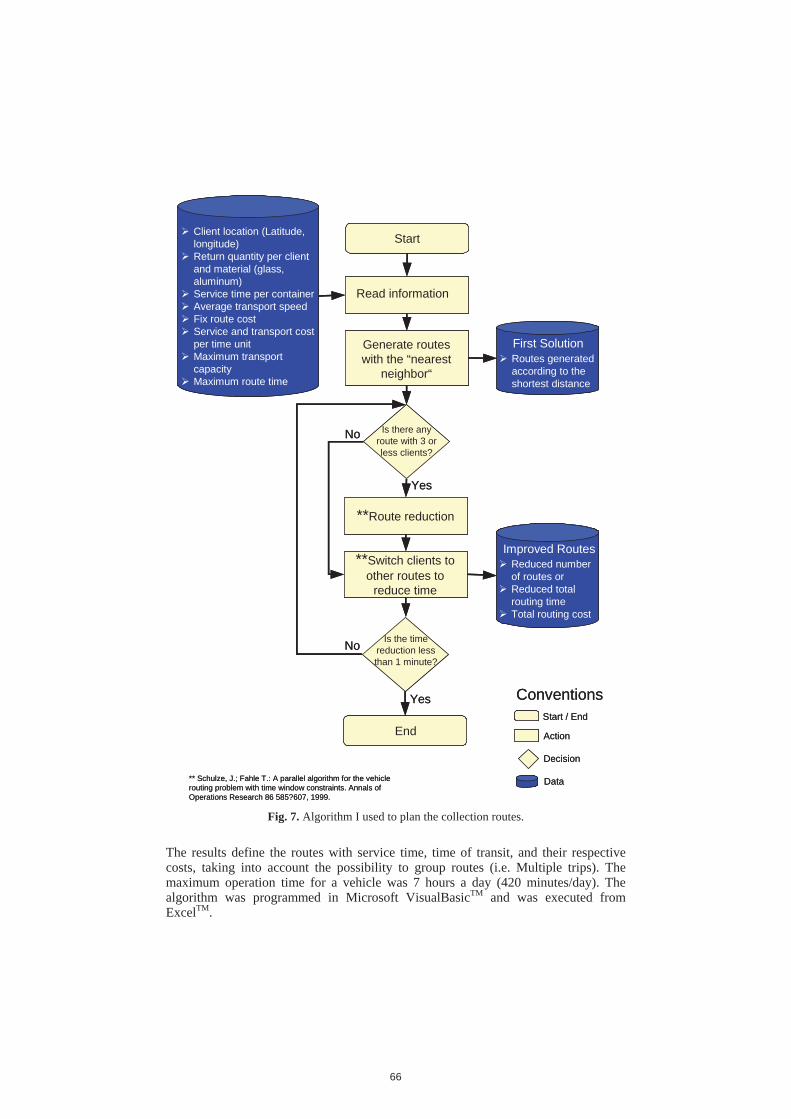
Start
Read information
Client location (Latitude, longitude) Return quantity per client and material (glass, aluminum) Service time per containerAverage transport speedFix route costService and transport cost per time unitMaximum transport capacityMaximum route time
Generate routes with the “nearest
neighbor“
Is there any route with 3 or less clients?
**Route reduction
**Switch clients to other routes to
reduce time
Is the time reduction less than 1 minute?
End
Routes generated according to the shortest distance
Yes
No
First Solution
Yes
No
Reduced number of routes orReduced total routing timeTotal routing cost
Improved Routes
ConventionsStart / End
Action
Decision
Data ** Schulze, J.; Fahle T.: A parallel algorithm for the vehicle routing problem with time window constraints. Annals of Operations Research 86 585?607, 1999.
Fig. 7. Algorithm I used to plan the collection routes.
The results define the routes with service time, time of transit, and their respective costs, taking into account the possibility to group routes (i.e. Multiple trips). The maximum operation time for a vehicle was 7 hours a day (420 minutes/day). The algorithm was programmed in Microsoft VisualBasicTM and was executed from ExcelTM.
66
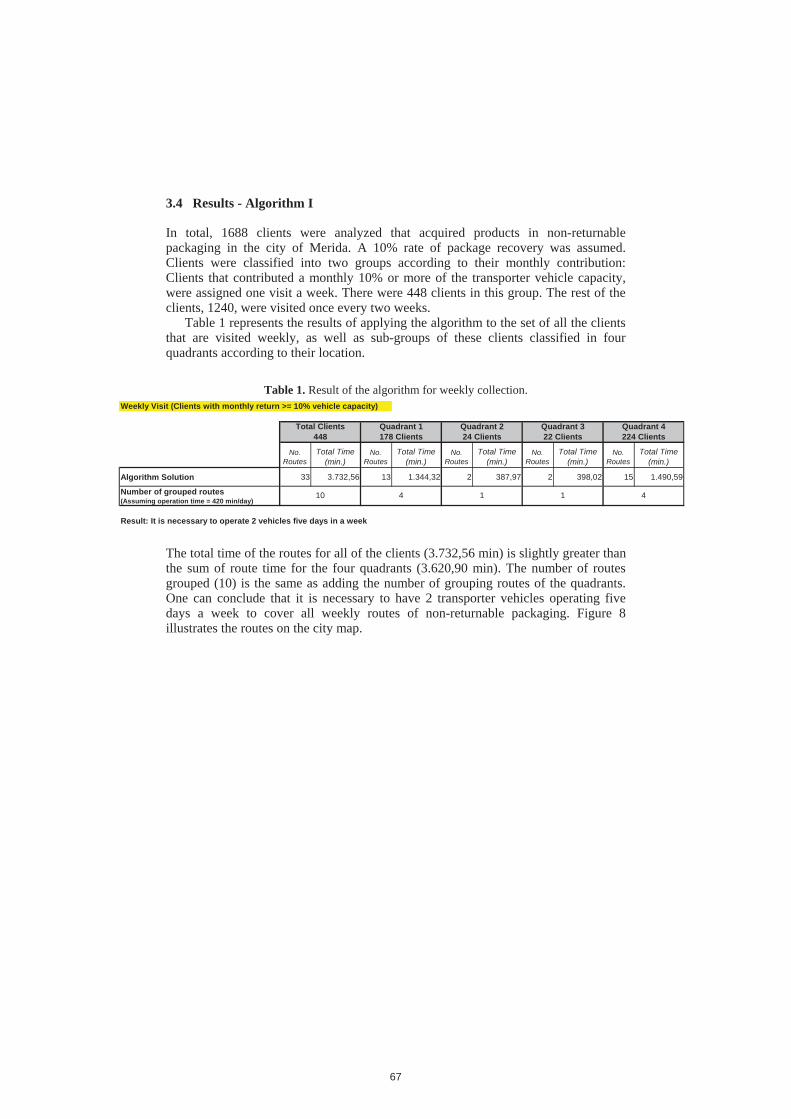
3.4 Results - Algorithm I
In total, 1688 clients were analyzed that acquired products in non-returnable packaging in the city of Merida. A 10% rate of package recovery was assumed. Clients were classified into two groups according to their monthly contribution: Clients that contributed a monthly 10% or more of the transporter vehicle capacity, were assigned one visit a week. There were 448 clients in this group. The rest of the clients, 1240, were visited once every two weeks.
Table 1 represents the results of applying the algorithm to the set of all the clients that are visited weekly, as well as sub-groups of these clients classified in four quadrants according to their location.
Table 1. Result of the algorithm for weekly collection.
Weekly Visit (Clients with monthly return >= 10% vehicle capacity)
No. Routes
Total Time (min.)
No. Routes
Total Time (min.)
No. Routes
Total Time (min.)
No. Routes
Total Time (min.)
No. Routes
Total Time (min.)
Algorithm Solution 33 3.732,56 13 1.344,32 2 387,97 2 398,02 15 1.490,59
Number of grouped routes (Assuming operation time = 420 min/day)
Result: It is necessary to operate 2 vehicles five days in a week
410 4 1 1
Quadrant 4 224 Clients
Total Clients 448
Quadrant 1 178 Clients
Quadrant 2 24 Clients
Quadrant 3 22 Clients
The total time of the routes for all of the clients (3.732,56 min) is slightly greater than the sum of route time for the four quadrants (3.620,90 min). The number of routes grouped (10) is the same as adding the number of grouping routes of the quadrants. One can conclude that it is necessary to have 2 transporter vehicles operating five days a week to cover all weekly routes of non-returnable packaging. Figure 8 illustrates the routes on the city map.
67

Fig. 8. Graphed routes per sectors on the city map. Table 2 represents the results for clients who were visited once every two weeks. In this case, the route time for all clients (3.073,70 min) is slightly less than the sum of the route time for the 4 quadrants (3.162,73 min). The number of grouped routes is 8 for all clients and 10 for the sum of each quadrant. The results obtained by applying the algorithm to all clients are slightly better than the results obtained by applying it separately to each quadrant. The number of grouped routes is eight, therefore one vehicle can sufficiently cover in an 8 day period (one day per route) the routes for the collection of non-returnable packaging of clients that are visited every two weeks.
68

Table 2. Result of the algorithm for bi-weekly collection. Biweekly Visit (Clients with monthly return < 10% vehicle capacity)
No. Routes
Total Time (min.)
No. Routes
Total Time (min.)
No. Routes
Total Time (min.)
No. Routes
Total Time (min.)
No. Routes
Total Time (min.)
Algorithm Solution 16 3.073,70 5 833,29 1 332,10 2 547,61 9 1.449,73Number of grouped routes (Assuming operation time = 420 min/day)
Result: It is necessary to operate 1 vehicle 8 days within two weeks
Total Clients 1240
Quadrant 1 389 Clientes
Quadrant 2 106 Clientes
Quadrant 3 103 Clientes
Quadrant 4 642 Clientes
48 3 1 2
3.5 Algorithm II
The second algorithm, although very similar to the first, in the beginning of the flow, has two substantial differences. The first is the profitability variable that, through a logical flow, outputs two possible values, 0 or 1, or “inactive”, “active” respectively. This determines if the visit to the specific client being evaluated is profitable in terms of a specified threshold which can be in terms of cost. If indeed it is, so then a visit to this client is granted by the algorithm; note that costs (and thus profit) incurred (provided) by the visit are related to the material volume and traveling distance to the specific client. Therefore this algorithm assures the efficiency of each visit leveraging distance and volume of material to be picked up. The second difference is the automatic visit frequency allocation of clients based on profitability variable and/or route saturation. This cycle can determine the direction of the visit frequency in which the client should be moved (higher or lower), and of course, whether it should be moved in order to purge and balance the initial solution. Figure 9 shows the main flow of algorithm II and figure 10 represents the flow to decide the profit variable.
69

•Clients location(coordinates)•Return quantityper client and material•Transport capacity•Times (trip, service, load and unload)•Operation costs (salaries, comissions, maintenance, fuel)
Start
Read information
Client clasification by quadrant taking as the
origin (0,0) therecopilation andselection center
Generate routes with the“nearest neighbor” in quadrant X, with visit
frequency Y and takingrestrictions of capacity,
time and visit profitabilityvarible
Is thereroutes withonly oneclient?
Does theclient
exceedsroute
capacity?
Are there clients withmain visit variable = 0
or routes withoutsaturation of capacity or
time?
Move the clients withmain visit variable = 0
or clients in unsaturated routes to a lower frequency visit
Move the client to a higher frequency
visit
No
Yes
Yes
No
No
Yes
Inputs Outputs
First solutionquadrant X and visit
frequency Y
ConventionsStart / End
Action
Decision
Data
ConventionsStart / End
Action
Decision
Data
ConventionsStart / End
Action
Decision
Data
ConventionsStart / End
Action
Decision
Data
Fig. 9. Algorithm II used to plan the collection routes.
70

From Main Process
Is the“profitable
visit” variable activated?
Calculation of distancesand times (trip, service
and return) of every clientfrom the center (origin)
Calculation of theequilibrium point of visit
profitability
Identification of thenearest client to the origin
(0,0) in quadrant X (nearest neighbor)
Client discardedfor this iteration
Inclusion of the client in the visit sequence of routZ, and eliminated from
the master DB
Is the routesaturated in capacity or
time?
To Main Process
Displacement from theorigin to the centroid
(coordinates) of the lastclient in the visit sequence
of route Z
Publicationor route Z
No
Yes
Yes
No
Are stillavailableclients on
quadrant X onthe master
DB?
Yes
NoRecalculation of distances
of every availablecostumer from the new
centroid (newcoordinates)
Calculation of visits´ costsfrom the center (origin)
Displacement ofthe centroid to the
origin (0,0)
ConventionsStart / End
Action
Decision
Data
ConventionsStart / End
Action
Decision
Data
ConventionsStart / End
Action
Decision
Data
ConventionsStart / End
Action
Decision
Data
Fig. 10. Flow profitability variable in algorithm II.
3.6 Results - Algorithm II
71

As in algorithm I, 1688 clients, with non returnable product sales, were evaluated, also considering a 10% sales collection volume. As can be observed in Table 3 only 1225 clients had profitable visit values, and therefore an assigned visit. Nine grouped routes and a total time of 3100.09 min. is much less time than a weekly visit scenario for algorithm I. With the second algorithm there are no higher or lower visit frequencies. In this case, the remaining clients presenting non profitable values are not visited. However, the collection amount was 97.4% of the amount collected by algorithm I.
Table 3. Results algorithm II. 10% Collection PercentageWeekly Visit
Routes Time (min.) Routes Time (min.) Routes Time (min.) Routes Time (min.) Routes Time (min.)First Solution "nearest neighbor" 37 3,100.09 15 1,187.79 2 286.19 2 192.68 18 1,433.43
Grouped routes number (Assumming operation time = 420 min/day)
49 3 1 1
Quadrant 4 670 ClientsAll Clients 1225 Quadrant 1
429 ClientsQuadrant 2 73 Clients
Quadrant 3 53 Clients
3.7 Reconditioning
Collected non-returnable beverage packaging is transported to a centralized recovery center. At the recovery center, materials are prepared for shipment to a recycler. Glass is sorted according to color; the paper label is removed, and finally, the glass is crushed. Aluminum cans are compacted into bales in order to increase transportation efficiency.
The end material has less contamination and obtains a higher price when sold to recyclers, who take care of the purification process. Bales of aluminum cans can be sold directly to processing facilities. At the processing facility they are shredded, crushed, discolored, melted down and cast into ingots. The ingots are fed into rolling mills that reduce the thickness of the metal from 20-plus inches to a sheet of about 10/1,000 of an inch thick. This metal is then coiled and shipped to can manufacturers where they are turned into new cans.
Crushed glass is sold to glass recyclers where contaminants are removed; the glass is washed and crushed into small pieces in order to have a clean cullet [8]. This cullet is sold to container manufacturers where it is mixed with virgin material and fed into a furnace. The resulting molten glass is drawn from the furnace and channeled through a feeder into the bottle-making machines.
3.8 Aluminum Can Recycling
Aluminum is a metallic material that can be recycled and re-used as often as necessary without any representative loss in quality. The high value of the metal is maintained and offers a sufficient economic incentive for the metal to actually be
72
collected, treated, melted and used again in a similar or comparable way at the end of the product’s service life [9].
The alloy used to produce an aluminum can sheet is a precise mixture which includes primarily manganese and magnesium. The recycling of the material should be done with similar alloyed materials and free of contaminants. Aluminum recyclers have defined quality levels for accepting recycling material [9]. If a can is not recycled, it will take around 500 years to degrade. In the same way, a recycled can may save 95% of the needed energy to produce a new can and will support the conservation of the mineral bauxite. Recycled aluminum is most often used for the production of new beverage containers, components for the automobile and aerospace industries, and building materials such as windows frames and rain gutters [10].
The aluminum can has many advantages as beverage packaging: it requires less energy to cool, there is no danger of crushed packaging, less space is required for empty packaging and an empty can only weighs one twentieth of an empty glass bottle [11].
3.9 Glass Recycling
Glass is manufactured from a mixture of three main ingredients: sand, soda ash, limestone and other additives, which create the color of the glass. In order to make recycled glass competitive with virgin material it is important that the glass scrap feedstock is of high quality in terms of color separation and low contamination. Recycled glass can replace virgin materials by up to 100 percent in the manufacture of new glass bottles and jars, depending on the quality, or can be used for a variety of other purposes such as a blasting abrasive [12], production of fiberglass insulation, decorative glassware, ceramic goods, and a roadbed aggregate [10].
Currently, FEMSA Beverage Packaging is able to re-use only 30 percent on average of recycled glass in the production of new bottles due to the quality of the reclaimed scrap glass, called “cullet”.
The substitution of recycled glass instead of virgin materials enables bottle manufacturers to operate at lower furnace temperatures and improve emission characteristics e.g. nine gallons of fuel oil are saved for each ton of glass that is made from recycled cullet instead of virgin materials [10]. Recycling one ton of glass into new bottles and jars saves 315 kg of tons of CO2 compared to using raw materials taking into account all the raw material extraction, processing, and transport energy used [13].
4 Summary and Outlook
A concept for recovering and recycling non-returnable beverage packaging was developed. First, the reverse logistics network was defined according to the current situation and the proposed packaging reverse flow. Second, the packaging collection was planned using routing algorithms in order to identify how it can be carried out
73

and the involved cost. Subsequently, required processes at the recovery center are analyzed for conditioning the materials before sending to the recycler.
As per the routing algorithms a new profitable routing algorithm based on the nearest neighbor was proposed and tested. This algorithm showed substantial advantages. First it takes into account the cost of arcs and nodes (traveling distances and service times), as well as automatically determines the visit frequency for each client. Also, it evaluates whether a visit should be granted or not based on its “profitability”. The latter is a relevant feature for reverse logistic schemes since these types of schemes have a rather high amount of uncertainty. Due to this mentioned uncertainty an algorithm that assures that each visit of the route is profitable (including its return to the depot) ensures that even if the circuit is broken at any moment and the vehicle forced to return to its point of origin (depot), the company will not lose money or even economic profit. This is not the case with some other algorithms based on complete cycle evaluations or without the profitable visit decision.
Further development of the reverse logistics network configuration includes the classification of the point of sales according to the probability that consumers take back non-returnable packages. In this sense, e.g. bars and restaurants where consumers drink the product in-site will have a higher recovery rate than supermarkets.
From a social point of view, currently “waste pickers” make their income by sorting the waste at the dumpsite and selling the material to recycling companies. It is necessary to offer an alternative to relocate these people to other jobs, for example, some of them could work at the recovery center.
Acknowledgments
I extend my sincere thanks to Professor Mónica Vanegas from Technical University of Berlin, Institute for Machine Tools and Factory Management, Department Assembly Technology and Factory Management for her invaluable contribution. Also to the southeast region logistics department of the brewery “Cuauhtémoc-Moctezuma” for their interest and cooperation in carrying out this project, as well as the graduate college "Stochastic Modeling and Quantitative Analysis of Complex Systems in Engineering" sponsored by the German Research Foundation (DFG) for the scientific support needed in the analysis and evaluation of this research.
References
1. Dekker, R.; Fleischmann, M.; Inderfurth, K.; Van Wassenhove, L.: Reverse Logistics – Quantitative Models for Closed-Loop Supply Chains, Springer, Germany, 2004.
2. Lambert S.; Riopel D.: “Logistique Inverse”, Département de mathématiques et de genie industriel, École Polytechnique de Montreal, Canadá, 2003.
3. Rubio Lacoba, S. (2003). El sistema de logística inversa en la empresa: Análisis y aplicaciones. Tesis Doctoral. Universidad de Extremadura.
74

4. Pescuma A.; De Luca S.; Guaresti M.:Escenarios para un programa de reciclaje de residuos sólidos urbanos en la Cd. De Buenos Aires, Argentina.
5. Vanegas M., Kernbaum S., Seliger G.: Development of a Control System for Recycling Networks Considering Uncertainty and Variability. In: Proceedings Global Conference on Sustainable Product Development and Life Cycle Engineering, September 29 – October 1, Berlin, Germany p. 175-178, 2004.
6. FEMSA, sitio en internet: http://www.femsa.com/qsomos_sub.asp?sub_id=perfil, consultado el: 15.02.2006.
7. Schulze, J.; Fahle T.: A parallel algorithm for the vehicle routing problem with time window constraints. Annals of Operations Research 86 585 607, 1999.
8. Glass Maker Guadalajara, www.genesis.uag.mx/posgrado/revistaelect/calidad/cal010.pdf.
9. Alcoa Inc., www.alcoa.com/alcoa_recycling. 10. Tomra Systems, www.tomra.com. 11. Returnpack, www.returpack.se. 12. Universal Ground Cullet, www.groundcullet.com. 13. Enviros Consulting Ltd, 2003, “Glass Recycling: Life Cycle Carbon Dioxide
Emission”, www.britglass.org.uk//Files/LocalAuthorities/BGEnviroReport.pdf.
75

e-Government Controls in Service-OrientedAuditing Perspective: Beyond Single Window
Faiza Allah Bukhsh and Hans Weigand
Dept. Information Management, Tilburg University, P.O.Box 90153,Tilburg, The Netherlands
[email protected], [email protected]
Abstract. To reduce cost and effort, e-government is trying to maximizethe digital interaction with its citizens. E-customs is a carry-over of suchan effort. Worldwide Customs is transforming from the labor intensivepaper work it used to be for ages to e-customs, where international tradeis facilitated fully exploiting the global digital infrastructure of the 21stCentury. Service-Oriented Auditing (SOAu), is a label for high-tech au-diting services based on the Service-Oriented Architecture. In this paper,the question is addressed what the impact of SOAu is on the relationshipbetween government (e-customs) and business (trading companies), andvice versa. Currently, we are already observing a shift in the distributionof responsibilities (so-called horizontal supervision). We show how thisshift can be leveraged by further developments in SOAu. Another issueis coordination. There is a need for increased coordination. We exploredifferent coordination mechanisms to support this development.
Keywords: Auditing, Customs Control, Service-Oriented Architecture
1 Introduction
To reduce the burden on the front-office in government organizations the conceptof e-government has been introduced. In E-government, most of the governmentfunctions and processes are carried out in the digital form over the Internet.Over time e-government is becoming a challenge at different levels of publicadministration. To cope with this challenge, E-government is usually managedin terms of stages of growth and E-government architectures [9]. These archi-tectures are based on the Service-Oriented Architecture (SOA), while SOA hasrapidly become the de-facto standard for modern information systems. SOAhelps to streamline the business processes in a highly standardized manner[2, 8,22]. SOA is based on distributed services that together perform a collaborativetask. The Open Group[29] and OASIS [18] define SOA as “a paradigm for or-ganizing and utilizing distributed capabilities that may be under the control ofdifferent ownership domains”.
When E-government uses SOA, this allows for a flexible and adaptive com-position of services that communicate with each other via a general platform.
76
In recent years, the focus of SOA research has shifted to management, controland monitoring [20]. In this line, we define Service Oriented Auditing (SOAu)as the combination of SOA and Auditing. SOAu aims to realize the vision ofcontinuous and online monitoring of services [33, 23]. This has also relevance fore-government.
In this paper, we will consider the Customs and its trade facilitation as an E-government organization example. Customs controls are rapidly innovating froma labour-intensive and paper-based door-keeping function to international tradefacilitation that explore the current global digital infrastructure (e-customs).However, the use of the modern technology concepts (like SOA, SOAu, Moni-toring, RFID) in the automation of custom control has by far not been exploredto its limits. The focus of this explorative paper is to consider the possible useof SOA and SOAu in E-government organization, especially in custom controls,and how SOAu influences the relationship between government and business.The paper is organized as follows. Section 2 gives an overview of the backgroundknowledge including recent developments in customs control and the ExtendedSingle Window (ESW) project of which our research is a part. Section 3 describesthe e-government evolution towards the service oriented architecture. Section 4categorizes auditing configurations in terms of coordination, audit object and au-dit subject. Section 5 closes with the main conclusions and directions for futureresearch.
2 Background
In this section we introduce four concepts that are at the basis of this paper.These concepts include Custom Controls, Modernized Custom Code, ExtendedSingle Window, Service-Oriented Architecture and Auditing.
2.1 Custom Controls and Modernized Customs Code
The Modernized Customs Code (MCC) was adopted by the European Commu-nion in April 2008 but the process of realization is still enduring. The aim ofMCC is to simplify legislation and administration procedures for both customsauthorities and traders. The purposes of MCC are:
Goods Tracking: Streamline the customs procedures in such a way that itreduces the effort to keep track of the goods.
Custom Guarantee System: Streamline and harmonies further the customsguarantee systems
Develop Paperless Environment: Lot of paper work is needed for a simplecustom procedure. MCC will ensure the computerization of all customs for-malities, with a view to a completely ‘paperless environment for customsand trade’, e-customs Decision No 70/2008/EC of the Parliament and ofthe Council, adopted on 15 January 2008, by (i) Electronic lodging of cus-toms declarations and accompanying documents as the rule (ii) Exchange ofelectronic information between the national customs, and other authorities;
77

Centralized Clearance: Introduce and promote the concept of “centralizedclearance”, by which authorized traders can declare goods electronically andpay their customs duties at the place where they are established. These allprocedures will be irrespective of the Member State through which the goodswill be brought in or out of the EU customs territory or in which they willbe consumed.
Single Window: An extension of the concept of centralized clearance by pro-viding the documents at a single point. It provide a base for the develop-ment of the ’Single Window’ and ’One-Stop-Shop’ concepts, under whicheconomic operators give information on goods to only one contact point(‘Single Window’ concept), even if the data should reach different adminis-trations/agencies, so that controls on them for various purposes (customs,sanitary,...) are performed at the same time and at the same place (‘one-stop-shop’ concept).
The concept of centralized clearance implies that when an “authorized operator”declares at the customs office, this office carries out the documentary risk anal-ysis. The office then forwards the results of its analysis to the border customsoffice in that Member State or in another Member State where the goods are ac-tually to enter or leave the Community (the ‘office of entry/exit’). Border officecan apply physical controls if needed. Procedures are different for the compliantand trusted traders. As a benefit of centralized clearance, the goods need not tobe moved to the office of import or export but could be delivered directly to thepoint of sale. This would allow multinational companies to conduct all of theirEU business with one customs office. Centralized clearance leads to the singleelectronic entrance point which is called as “Single Window”. In “Single Win-dow” authorized operators provide the information required by customs onceand then all other agencies have access to it.
2.2 Extended Single Window
The vision of the Extended Single Window project (ESW)1 started in 2010 isto develop an integrated and coordinated border management solution for portsand airports integrating with previous and subsequent procedures for reliable,secure, and cost effective logistic chains throughout the Netherlands as a logisticgateway to Europe. The coordinated border management solution is referred toas ‘Extended Single Window’. It requires efficient and reliable handling of data togenerate information for effective joint supply chain planning for shippers, goodsowners, transportation companies, forwarders, terminals and other logistic ser-vice providers. This data is also used to generate information for governmentagencies, like customs, agricultural and tax. Currently, shippers and goods own-ers are faced with a wide range of regulations and procedures when goods enteror exit the EU. Completion of declaration processes and risk analyses and plan-ning and coordination of inspections by the various agencies before shipments
1 http://www.dinalog.nl/institute/projects/research-development-projects/
extended-single-window-information-gateway-to-europe/271
78

are (un)loaded from an aircraft or vessel enables logistics actors (terminal op-erators, forwarders, transport operators) to plan and execute transportation ofshipments with hinterland hubs efficiently (improving modal shift, throughputtime i.e. for perishable goods and reducing congestion). Efficient and reliable gov-ernment controls reduce administrative costs, increase reliability of the supplychain, and ultimately reduce transport costs for shippers and logistic operators.ESW project is a source for realization of all these discussed tasks.
Thus, ESW covers all regulations and procedures for coordinated bordermanagement at ports, airports and extending to hinterland hubs according tothe MCC for both incoming and outgoing logistic flows, including integrationwith previous (outgoing goods for instance preceded by export) and subsequentprocedures (incoming goods for instance followed by transit). Basic researchin advanced information technologies is in Event Driven Architecture with aLogistic Interoperability Ontology:
– Event Driven Information Service Bus (EISB). It is an extension of the con-cept of Enterprise Service Bus (ESB). Basically, each logistic operation trig-gers an event. Minimally, an EISB supports publish/subscribe functionalityto events in virtual data space. Since the data space is virtual, relevant datacan still reside with each actor depending on governance and logistic innova-tions at business level. Thus EISB can support traditional document-drivenprocesses as well as new event-driven processes for tracking and tracing ofmovement of goods.
– Logistic Interoperability Ontology Framework. It specifies the semantics ofall physical objects as shared by business actors in supply chains, e.g. se-mantics of containers, goods items, and trucks thus allowing that each actorshares only relevant information with one or more other actors.
Using the EISB concept it is possible to extend the Single Window concept inat least two important ways. The Single Window is based on digital documents,whereas the ESW is based on events, which is much more flexible. It is not neces-sary anymore for the sender to collect the data needed in the form of documenttemplate. The receiver specifies which data he wants to see (by subscribing toevents), and these data are collected then (that is, continuously) from the virtualdata space fed by all the distributed events. Secondly, the Single Window onlystreamlines data flow in one direction, from logistic operators to governmentagencies, whereas the EISB also supports data flow among logistic operators,among government agencies (e.g. to realize a One-Stop-Shop), or from govern-ment agencies to operators. One of the very powerful new possibilities openedup this way is end-to-end supply chain integrity as advocated by Hesketh [7].
2.3 Service Oriented Architecture
Enterprises need to respond quickly to the today’s more competitive and globalmarket. To fulfill this purpose business needs to streamline its business pro-cesses in highly standardized manner. A contemporary approach for addressing
79
these critical issues is service oriented architecture (SOA) [2, 8, 22]. “SOA is aparadigm for organizing and utilizing distributed capabilities that may be underthe control of different ownership domains. Therefore providing a homogeneousmeans to offer, discover, interact with and use capabilities to produce desiredeffects which are consistent with measurable pre-conditions and expectations”[18]. SOA as an emerging approach meets the requirements of loosely coupled,standards-based, and protocol independent computing [20]. The enterprise ser-vice bus provides the functionality of highly distributed communication andintegration based on event-driven and asynchronous communication. SOA canbe extended to deal with service orchestration, intelligent routing, provisioning,integrity and security of massages as well as service management [21]. ExtendedSOA functionality is separated into three plans (i) Service foundation (ii) Servicecomposition (iii) Service management and monitoring [19]. SOA and cloud com-puting are complementary activities. A platform for cloud computing providesa value-added underpinning for SOA [24], while SOA allows for optimal usageof Software-as-a-Service (SaaS) in cloud platforms.
2.4 Auditing
Auditing is evaluation/monitoring/control of an organization/person/producton the basis of some norms. Traditionally, auditing can be defined in two sce-narios (a) an internal audit (b) external audit. According to ISA standard 2010,internal auditing is ‘to monitor and evaluate the effectiveness of an organizationalrisk management and control system’ [37] while in external auditing the focusis on the assurance about the accuracy of the financial statement and coordina-tion related tasks. The methods of internal and external audit are very similar,but external audit uses fixed norms, while the audit norm can be the subjectof optimization in the case of internal audit. Audit addresses the quality of thebusiness. Because of compliance issues organizations have to pay significant at-tention on the management, reporting and monitoring of the business processes[6]. Auditing is a periodic activity, where the time period and scope differs fromone situation to another. In some organizations auditing is performed continu-ously termed as continuous audit [3]. Continuous and online auditing are verysimilar but slightly different concepts. Online auditing means that the auditingmakes use of Internet technology for the distribution and/or acquisition of theaudit data [32]. This also gives opportunities for interactive access to the data(drilling down). Ideally, online audit is continuous audit but continuous auditcan be realized off-line as well [14].
3 e-Government Evolution towards SOA
E-government growth has been studied in two ways: (i) content analysis of thegovernment web sites for specific features of E-government [10, 28, 36], (ii) surveyamong local government officials. Moon [17] conducted the most known survey of
80

government officials . Sometimes both content method and survey methodologyhave been used together.
Different models of e-government growth have been developed. For publicadministrators of e-government Layne and Lee [15] describe different stages ofe-government development and propose a ’stages of growth’ model for fully func-tional e-government. Keeping in view the technical, organizational and manage-rial feasibility and corresponding examples, four stages of growth model are: (1)cataloging, (2) transaction, (3) vertical integration, and (4) horizontal integra-tion. These stages consider the citizen as a user of governmental services. Thesestages describes that citizen-focused change must be considered throughout e-government development.
The two-stage model of Reddick [26] builds forth on the four stage model.This model of e-government growth is applied to municipalities. Stage I is thecataloging of information online and Stage II is transactions being completed on-line. These stages apply to various e-government relationships being governmentto citizen (G2C), government to business (G2B), or government to government(G2G). In this study, it appears that G2C e-government is primarily in StageI cataloging information, in essence, providing an online presence for cities. E-government is considered more developed in the case of G2G use of internet forgovernment employees.
Governmental agencies are trying to migrate their traditional systems ar-chitectures to more horizontally and vertically integrated architectures. Janssenand Veenstra [9] describe the stages of growth model for the development ofinformation architectures for local governmental agencies. These stages considerthe front and back office in parallel. The five-stage model consists of (1) no inte-gration, (2) one-to-one messaging, (3) warehouse, (4) broker and (5) orchestratedbroker architecture. The first three stages are about integration using data ware-houses. The fourth stage not only handles information, but also starts invokingother types of technical services. In the last growth stage, the orchestrated brokerarchitecture enters. This stage is specialized into SOA. Public decision-makerscan use these stages as a guidance and direction in SOA architecture develop-ment. The stage model provides the milestones to evaluate and control the costsof architecture development.
For improving service delivery, departments and agencies have to work to-gether and manage the mutual information flows. Stage models can help furthere-government development. The stage model proposed by Klievink and Janssen[11] describes the stages of development in joint-up government at national level.It consists of following five stages: (1) Stovepipes (2) Integrated organizations (3)nation-wide portal (4) inter organizational integration and (5) customer-driven,joined-up government. These stages also consider SOA.
From the above, we can see that integration has always been an importante-government concern, evolving from an intra- to an inter-organizational scope.SOA can very well support this development, but it also requires a more holisticview to the coordination of e-government services [12].
81

4 Audit with Service-Oriented Auditing
The relationship between computer science and auditing is bi-directional. In acomputer science perspective, applications of computer science are subject to au-dit, e.g. the information system infrastructure and accounting system, while inaudit perspective, IT applications are employed as a powerful means to supportrisk management and auditing, for instance ACL audit software (www.acl.com)and the AuditSystem-2 used at Deloitte (www.deloitte.com). Service orientedauditing (SOAu) aims at the use of service-oriented technology to further sup-port audit processes and realize the vision of continuous and online monitoring.In this article an audit module can be defined with the help of the followingmodel proposed by Weigand and Bukhsh[33]. Fig 1 describes the overall archi-
Fig. 1. Audit Module
tecture of an audit module based on service-oriented monitoring solution. Events[1] generated by business services (including service request and service responseevents) are published on the EISB. The continuous monitoring (CM) service col-lects the events using the publish/subscribe mechanism. Then it generates theIST (as-is) model from the event traces by means of specified process patterns.Such a pattern consists of two parts: a condition part specifying selection criteriaon operational events, and a result part specifying one or more economic events,
82

typically defined on a higher abstraction level, e.g. using the REA business ontol-ogy [16]. When the processing detects an operational event pattern, it generatesthe corresponding economic event as IST model. The IST model contains bothcompliant and non-compliant process instances from which a fault list is gener-ated (evaluation). The result of the evaluation can be forwarded immediately tothe stakeholder, be it Company / Government/ Concerned Authorities (push)or made available online (pull).
Monitoring management is a second and important component of the modelthat is responsible for adapting and optimizing the first component in the faceof internal and external changes. This activity is responsible for deriving processpatterns from a fixed SOLL (normative) model, and uses process mining or othermachine-learning techniques.
From a coordination perspective, we can divide the government and companyaudit relationship into two categories. (i) uncoordinated: in which one companyis audited by one government authority at a time. (ii) coordinated: when manycollaborating companies are audited by many government authorities in a coor-dinated action.
4.1 Uncoordinated Auditing
Uncoordinated means that one government authority audits one company at atime, based on direct communication between the company (e.g. trading com-pany) and government authority (e.g. custom). In this category, there are againtwo subcategories, depending on the audit subject: (i) government audits thecompany (ii) company audits itself, reporting to the government.
Audit by the Government: Audit by Government is of detective and correc-tive nature. Government want to check the status of the organization /com-pany’s declarations and trustworthiness. Government authorities or share-holders or investors usually perform this type of audit. They audit the assets,controls, declarations and all the matters related to the company’s stability.
Audit by the Company: In this case, the company has a rigorous internalauditing system. According to Starreveld et al [27] organizations need inter-nal control measures, including organizational rules and control activities.These internal controls are in general of a preventive nature, i.e. preventingthe occurrence of errors and opportunistic behavior of the organizationalagents. The purpose of auditing the internal controls by the company is firstof all to implement accountability to owners and to attract investors. Nowa-days, they may also be required by partners, e.g. powerful customers whoare dependent on the quality of the company’s processes. However, the verysame measures can be used to implement accountability to the government,thus avoiding duplicated efforts.
A company/organization provide services to its customers/users with thehelp of different parallel or stand alone processes. We make an important dis-tinction between operational and control services.
83

Operational Service: Each operational service executes a particular activityin the company’s primary processes. Operational services consume and pro-duce value objects, so to safeguard value, operational processes need to becontrolled.
Control Service: Control services implement business control on the opera-tional services. Control services takes place at two levels: control withinthe organization and external control. Control services involve the creationof management systems, managing the consistency and quality of productscoming to/from the company. It also involves the development of programsand processes that operate automatically [34].
Whereas the audit type says who is performing the audit (subject), the servicetype says what is the primary focus of the audit (object). The following tableshows the four possible combinations:
Audit/Service Operational Control
By Company Type I Type II
By Government Type III Type IV
Table 1. Audit subject/object categorization
Type I: Administration in the companies always needs to keep an eye on thestatus of the company. A focus on operational processes corresponds to tra-ditional transaction-based auditing. Traditionally, this type is not feasibleas the government is not willing to accept the risks of abuse and fraud. Itis only willing to leave the auditing responsibility to the company when thecompany is firmly in control (type II). However, with the use of (automated)audit modules (cf. Fig. 1), the type may become acceptable. The audit mod-ule supports a continuous monitoring service of the company’s operationalservices. In this way, it can detect and immune any potential operationalissue. The results can be published and made accessible to the governmentagency.
Type II: Companies arrange the audit activity especially auditing the controlservices for itself to have self-assessment. This so-called system-based controlis usually more efficient and effective than the transaction-based type. Thereare other reasons for choosing this type as well. Companies with internationalsupply chain like to show themselves to be compliant and standardized. Theself-assessment can also replace costly governmental controls, as in the case ofcustom procedures. For this purpose e-customs provides a standard knownas Authorized Economic Operator (AEO) certificate [5]. To get an AEOstandard company have to show customs compliance, appropriate record-keeping standards, financial solvency, and appropriate security and safetystandards in place. An audit module audits the company’s control services
84
in order to ensure compliance to the AEO standard. This module can use thesame architecture as the model in Fig.1, where the events being monitoredare now control service events (for instance, changing authorizations) ratherthan operational service events.
Type III: When the government audits the operational services then there aretwo scenarios (i) government physically audits the operations and operationalservices. This is the traditional way of working, where custom inspectors pro-cess clearance request documents per transport and check all or a selectionof the containers passing the border. Evidently, this is a labor-intensive pro-cess. (ii) Government audits the operational processes by using advancedIT such as the automated scanning, audit tools [33] and/or process miningtechniques such as proposed by Van der Aalst et al [31].
Type IV: This can be seen as a variant of type II where the company has arigorous internal control system, but rather than doing a self-assessment,the government remotely monitors and evaluates the control system. Thisvariant may benefit both the company and the customs. Probably, it requiresan even higher level of “being in control” then in the case of type II. Inthis case it is not sufficient that the internal control system is compliant,according to human interpretation, but that this compliance need to beassessed and monitored online. In other words, the internal control systemmust be highly formalized and automated. The costs that this brings for thecompany can be compensated by the fact that (manual) self-assessments areno longer needed: the company only needs to provide access to the controlservices, via some interface. For the customs, it also saves costs of manualprocessing of AEO reports, and may provide a higher level of security. Onthe other hand, it requires sophisticated audit tools. It is also important thatthe interfaces are well-defined and based on standards.
4.2 Coordinated Auditing
Growing trade and increased security require new controls. In parallel govern-ment would like to reduce the administrative burden. E-customs supports simpli-fied paperless trade procedures, prevents potential security threats and counter-feit tax related frauds and also ensures the interoperability with other e-customssystems within and outside the Europe. The use of SOA in e-customs [25] helpsus to access to the location of goods through its supply chain, the provision ofevidence for import/export, the notification through alerts in case of exceptions,for example deviation from the planned trajectory, abnormal conditions for con-tainers and others. With the still growing world-wide trade, no single companycan fulfill all needs so it has to collaborate and cooperate with other companies.In this context, coordination emerges as a separate service.
Coordination Service: Co-ordination services can be defined as services sup-porting an exchange process (a set of events) for a good or a service [34].Processes like identification, negotiation, order execution and after-sales takeplace in a good exchange as well as a service exchange. Within this process,
85
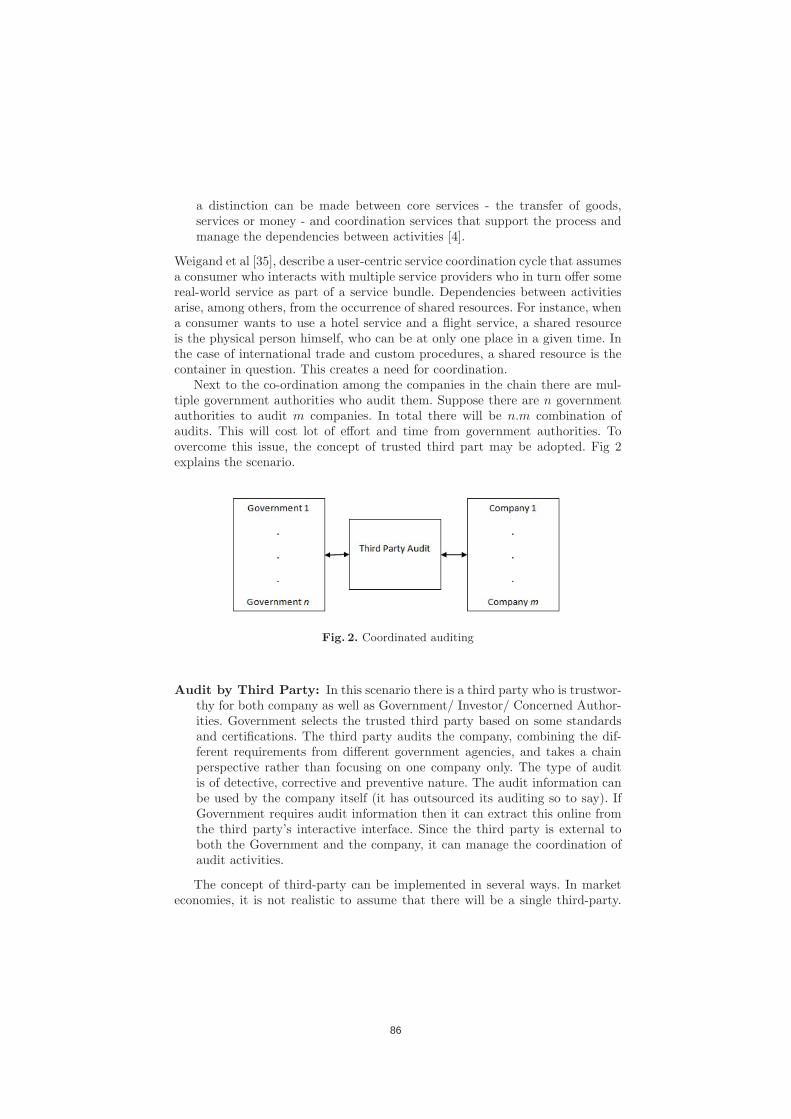
a distinction can be made between core services - the transfer of goods,services or money - and coordination services that support the process andmanage the dependencies between activities [4].
Weigand et al [35], describe a user-centric service coordination cycle that assumesa consumer who interacts with multiple service providers who in turn offer somereal-world service as part of a service bundle. Dependencies between activitiesarise, among others, from the occurrence of shared resources. For instance, whena consumer wants to use a hotel service and a flight service, a shared resourceis the physical person himself, who can be at only one place in a given time. Inthe case of international trade and custom procedures, a shared resource is thecontainer in question. This creates a need for coordination.
Next to the co-ordination among the companies in the chain there are mul-tiple government authorities who audit them. Suppose there are n governmentauthorities to audit m companies. In total there will be n.m combination ofaudits. This will cost lot of effort and time from government authorities. Toovercome this issue, the concept of trusted third part may be adopted. Fig 2explains the scenario.
Fig. 2. Coordinated auditing
Audit by Third Party: In this scenario there is a third party who is trustwor-thy for both company as well as Government/ Investor/ Concerned Author-ities. Government selects the trusted third party based on some standardsand certifications. The third party audits the company, combining the dif-ferent requirements from different government agencies, and takes a chainperspective rather than focusing on one company only. The type of auditis of detective, corrective and preventive nature. The audit information canbe used by the company itself (it has outsourced its auditing so to say). IfGovernment requires audit information then it can extract this online fromthe third party’s interactive interface. Since the third party is external toboth the Government and the company, it can manage the coordination ofaudit activities.
The concept of third-party can be implemented in several ways. In marketeconomies, it is not realistic to assume that there will be a single third-party.
86
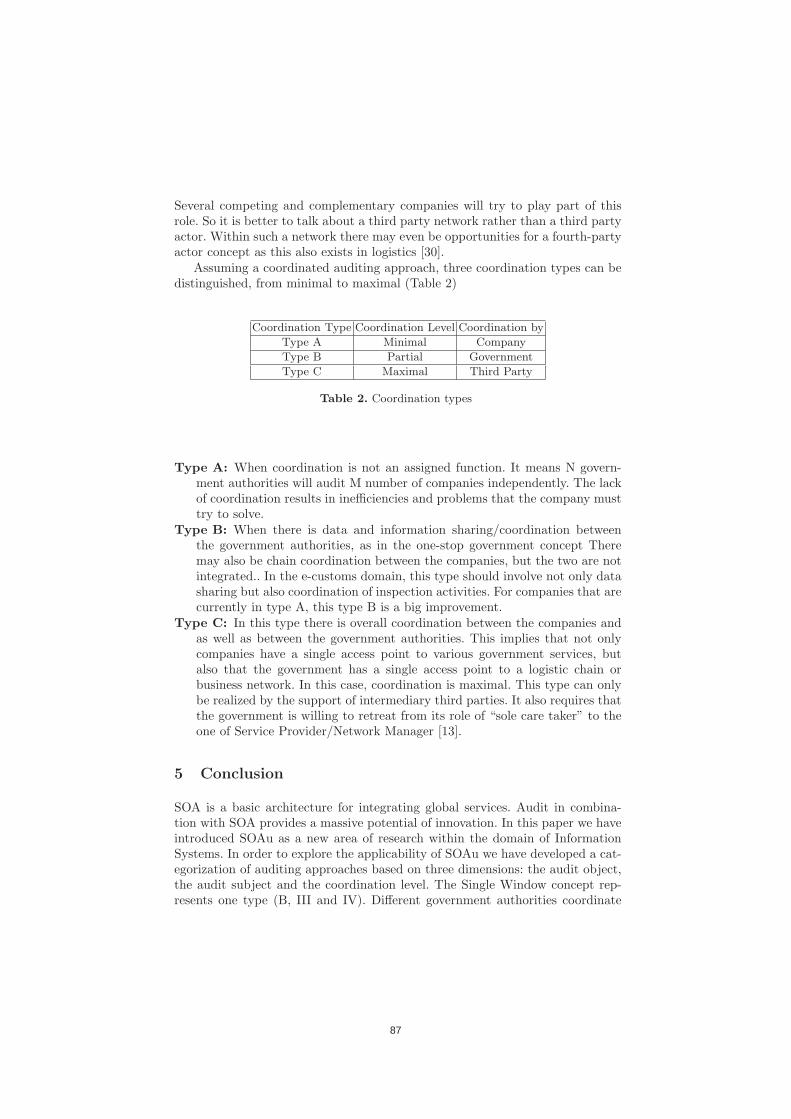
Several competing and complementary companies will try to play part of thisrole. So it is better to talk about a third party network rather than a third partyactor. Within such a network there may even be opportunities for a fourth-partyactor concept as this also exists in logistics [30].
Assuming a coordinated auditing approach, three coordination types can bedistinguished, from minimal to maximal (Table 2)
Coordination Type Coordination Level Coordination by
Type A Minimal Company
Type B Partial Government
Type C Maximal Third Party
Table 2. Coordination types
Type A: When coordination is not an assigned function. It means N govern-ment authorities will audit M number of companies independently. The lackof coordination results in inefficiencies and problems that the company musttry to solve.
Type B: When there is data and information sharing/coordination betweenthe government authorities, as in the one-stop government concept Theremay also be chain coordination between the companies, but the two are notintegrated.. In the e-customs domain, this type should involve not only datasharing but also coordination of inspection activities. For companies that arecurrently in type A, this type B is a big improvement.
Type C: In this type there is overall coordination between the companies andas well as between the government authorities. This implies that not onlycompanies have a single access point to various government services, butalso that the government has a single access point to a logistic chain orbusiness network. In this case, coordination is maximal. This type can onlybe realized by the support of intermediary third parties. It also requires thatthe government is willing to retreat from its role of “sole care taker” to theone of Service Provider/Network Manager [13].
5 Conclusion
SOA is a basic architecture for integrating global services. Audit in combina-tion with SOA provides a massive potential of innovation. In this paper we haveintroduced SOAu as a new area of research within the domain of InformationSystems. In order to explore the applicability of SOAu we have developed a cat-egorization of auditing approaches based on three dimensions: the audit object,the audit subject and the coordination level. The Single Window concept rep-resents one type (B, III and IV). Different government authorities coordinate
87

among each other and share the company data. When companies and govern-ment authorities coordinate with the help of a third party then the concept ofESW comes into play. Type C in combination with any one of type I, II, III, IVprovide different possible variants of ESW. This paper introduces the concept ofSOAu a basic categorization of application possibilities in e-customs. Evaluationof the viability of these types and the respective IT requirements is an openquestion for further research that we want to pursue together with the ESWindustrial partners.
Acknowledgment
This research is partially supported by the DINALOG (www.dinalog.nl) project“Extended Single Window”.
References
1. http://www.gs1.org/gsmp/kc/epcglobal/epcis.2. J. Bih. Service oriented architecture (SOA) a new paradigm to implement dynamic
e-business solutions. Ubiquity, 2006(August), 2006.3. F. Dal-Ri Murcia, F. Cruz de Souza, J. Alonso Borba, and M. Ykeda. Continuous
auditing: A literature review. In International Conference on Information Systemsand Technology Management, volume 1, 2007.
4. W. Davidow and M. Malone. The virtual corporation: Structuring and revitalizingthe corporation for the 21st century. HarperBusiness, 1993.
5. European Union. European custom code, 2008. Retrieved on Jan-uary 11,2011 from http://ec.europa.eu/taxation_customs/customs/policy_
issues/customs_security/aeo/index_en.htm.6. A. Ghose and G. Koliadis. Auditing business process compliance. In B. Krmer,
K.-J. Lin, and P. Narasimhan, editors, Service-Oriented Computing ICSOC 2007,volume 4749 of Lecture Notes in Computer Science, pages 169–180. Springer Berlin/ Heidelberg, 2007.
7. D. Hesketh. Seamless electronic data and logistics pipelines shift focus from importdeclarations to start of commercial transaction. World Customs Journal, 3(1):27–32, 2009.
8. J. Hurwitz, R. Bloor, M. Kaufman, and F. Halper. Service Oriented Architecture(SOA) for Dummies. For Dummies, 2009.
9. M. Janssen and A. F. Van Veenstra. Stages of growth in e-government: An archi-tectural approach. The electronic journal of e-government, 3:193–200, 2005.
10. C. Kaylor, R. Deshazo, and D. Van Eck. Gauging e-government: A report onimplementing services among american cities. Government Information Quarterly,18(4):293–307, 2001.
11. B. Klievink and M. Janssen. Stage models for creating joined-up government:From local to nation-wide integration. In Proceedings of the 2008 internationalconference on Digital government research, pages 117–123. Digital GovernmentSociety of North America, 2008.
12. B. Klievink and M. Janssen. Coordinating e-government service delivery. In Pro-ceedings of the 11th Annual International Digital Government Research Conferenceon Public Administration Online: Challenges and Opportunities, pages 209–216.Digital Government Society of North America, 2010.
88

13. R. Klischewski. Drift or shift? propositions for changing roles of administrationsin e-government. Electronic Government, pages 85–96, 2010.
14. J. Kuhn Jr and S. Sutton. Continuous auditing in erp system environments: Thecurrent state and future directions. Journal of Information Systems, 24:91, 2010.
15. K. Layne and J. Lee. Developing fully functional e-government: A four stage model.Government information quarterly, 18(2):122–136, 2001.
16. W. McCarthy. The REA accounting model: A generalized framework for account-ing systems in a shared data environment. The Accounting Review, 57(3):554–578.
17. M. Moon. The evolution of e-government among municipalities: Rhetoric or reality?Public administration review, 62(4):424–433, 2002.
18. OASIS. OASIS SOA reference model (http://www.oasis-open.org), 2011. Re-trieved on March 20,2011.
19. M. Papazoglou, P. Traverso, S. Dustdar, and F. Leymann. Service-oriented com-puting: State of the art and research challenges. Computer, 40(11):38–45, 2007.
20. M. Papazoglou andW. Van Den Heuvel. Service oriented architectures: approaches,technologies and research issues. The VLDB Journal, 16(3):389–415, 2007.
21. M. P. Papazoglou. Extending the service-oriented architecture. Business integra-tion journal, 7:18–21, 2005.
22. M. P. Papazoglou andW.-J. V. D. Heuvel. Service-oriented design and developmentmethodology. Int. J. Web Eng. Technol., 2:412–442, July 2006.
23. S. Popa and C. Ionescu. Towards online auditing.the database environment. In IIInternational Seminar on IT Audit. Nanjing,China, 2004.
24. G. Raines. Cloud computing and SOA. available at: http://www.mitre.org/work/tech_papers/tech_papers_09/09_0743/09_0743.pdf.
25. L. Razmerita and N. Bjorn-Andersen. Towards ubiquitous e-custom services.In Proceedings of the IEEE/WIC/ACM International Conference on Web Intel-ligence, WI 2007, pages 833–837. IEEE Computer Society, 2007.
26. C. Reddick. A two-stage model of e-government growth: Theories and empiricalevidence for US cities. Government Information Quarterly, 21(1):51–64, 2004.
27. R. Starreveld, H. de Mare, and E. Joels. Bestuurlijke informatieverzorging: Al-gemene grondslagen. Samsom, 1985.
28. G. Stowers. Becoming cyberactive: State and local governments on the world wideweb. Government Information Quarterly, 16(2):111–127, 1999.
29. The Open Group. SOA work group member site (https://www.opengroup.org/projects/soa/), 2011. Retrieved on March 20,2011.
30. G. Vaidyanathan. A framework for evaluating third-party logistics. Commun.ACM, 48:89–94, January 2005.
31. W. van Aalst, K. Van Hee, J. Van Werf, and M. Verdonk. Auditing 2.0: Usingprocess mining to support tomorrow’s auditor. Computer, 43(3):90–93, 2010.
32. W. Van Der Aalst, K. Van Hee, J. Van Der Werf, A. Kumar, and M. Verdonk.Conceptual model for online auditing. Decision Support Systems, 50(3):636–647,2011.
33. H. Weigand and F. A. Bukhsh. Supporting customs controls by means of service-oriented auditing. manuscript Department of Information Management, Universityof Tilburg, 2011.
34. H. Weigand, P. Johannesson, B. Andersson, J. J. Arachchige, and M. Bergholtz.Management service - a framework for design. In Proceeding of 23rd InternationalConference on Advanced Information Systems Engineering published in LectureNotes in Computer Science, 2011. accepted.
89

35. H. Weigand, P. Johannesson, B. Andersson, M. Bergholtz, and J. Arachchige. Clos-ing the user-centric service coordination cycle by means of coordination services.Lecture Notes in Business Information Processing, 72 LNBIP:267–282, 2011.
36. D. West and Taubman Center for Public Policy. Urban e-government: An as-sessment of city government websites. Taubman Center for Public Policy, BrownUniversity, 2001.
37. S. W. Zarkasyi. International audit techniques traditional versus progressive ap-proach. Jurnal Ekonomi dan Bisnis Terapan, 2, 2006.
90